Article

Genome-Wide Identification of GATA Transcription Factors in Acorus and Expression Patterns Under Abiotic Stress

1
Fujian Health College, Fuzhou 350101, China
2
Key Laboratory of National Forestry and Grassland Administration for Orchid Conservation and Utilization, Fujian Agriculture and Forestry University, Fuzhou 350002, China
3
College of Pharmacy, Fujian University of Traditional Chinese Medicine, Fuzhou 350002, China
*
Authors to whom correspondence should be addressed.
These authors contributed equally to this work.
Horticulturae 2025, 11(4), 410; https://doi.org/10.3390/horticulturae11040410
Submission received: 13 February 2025 / Revised: 6 April 2025 / Accepted: 10 April 2025 / Published: 11 April 2025
(This article belongs to the Section Genetics, Genomics, Breeding, and Biotechnology (G2B2))

Abstract

:
The GATA transcription factors are a class of DNA-binding proteins that control the expression of target genes by binding to the promoter regions of DNA, thereby affecting the growth and development of plants. In recent years, GATA genes have been discovered and functionally characterized in many plant species. However, there is limited annotation information for GATA genes in the genus Acorus. This study identified 38 and 20 GATA genes in Acorus calamus and A. gramineus, respectively. Based on a phylogenetic tree, they were classified into four subfamilies (I, II, III, and IV). At the same time, an analysis of the GATA domain and motifs revealed that the domains are relatively conserved across all subfamilies. A multiple sequence alignment showed that almost all GATA proteins are highly conserved at the LCNACG site. An analysis of cis-elements, collinearity, and protein–protein interaction networks provided insights into the response mechanisms under biotic stress. Additionally, we found significant changes in the expression of GATA in A. gramineus under drought and salt stress. These results provide useful information for future functional analyses of GATA genes and contribute to a better understanding of the stress response mechanisms and molecular breeding directions in the Acorus species.

1. Introduction

Plants encounter numerous environmental challenges throughout their developmental processes. Over the long course of evolution, many have developed diverse protective mechanisms to adapt to various stresses (abiotic and biotic), with transcriptional regulation being a key control strategy [1]. Transcription factors (TFs) play crucial roles in regulating gene expression by binding specifically to the promoter regions of target genes, thereby influencing essential biological processes such as cell morphogenesis, signal transduction, and stress responses [2]. In plants, several transcription factor families have been identified, including GATA (GATA-binding factor), WRKY, MYB (MYB proto-oncogene), bZIP (basic region-leucine zipper), and MADS-box [3].
GATAs are a type of DNA-binding protein found in fungi, animals, and plants. These proteins regulate the transcription levels of target genes by recognizing and binding to (T/A)GATA(A/G) sequences in gene promoters [4]. The GATA gene family is widespread in plants and plays a crucial role in various biological processes, including growth, hormone regulation, defense, and responses to abiotic stress [3]. In plants, all GATA factors contain a type IV zinc finger domain with 18 or 20 residues [5], typically structured as C-X2-C-X18-C-X2-C or C-X2-C-X20-C-X2-C [6]. As a transcription factor, GATA regulates the expression of downstream genes mainly by binding conserved sequences, thus affecting biological phenotypes. The common consensus sequence recognized by the GATA transcription factor family is WGATAR. Phylogenetic analyses, along with studies on DNA-binding domains and gene structures, have classified the GATA family into four subfamilies: I, II, III, and IV [7].
The GATA family is widely present in both monocotyledonous and dicotyledonous plants, with the first GATA gene identified in tobacco [8]. To date, GATA genes have been reported in many plant species, including 30 in Ara. thaliana, 28 in rice, 35 in apples, and 64 in soybeans [6,9,10]. GATA transcription factors have a broad range of functions in plants, and research has shown that they are involved in the regulation of plant photosynthesis [11], light and circadian rhythm responses [12], chlorophyll biosynthesis [13], chloroplast division [14], and flower development [15]. Additionally, GATA factors are involved in plant responses to various abiotic stresses, including salt, drought, and high-temperature stress [16,17,18]. In Ara. thaliana, GATA12 regulates primary seed dormancy and flowering time [19]. In rice, OsGATA12 influences the yield by affecting leaf and branch numbers [20,21]. In poplars, PdGATA19 primarily regulates photosynthesis and growth [11]. These diverse functions highlight the importance of GATA transcription factors and the need for their further study in plant biology.
The genus Acorus, commonly known as sweet flag, is widely known for its ornamental use in horticulture, particularly in water gardens, ponds, and as a ground cover in moist environments [22,23,24]. Additionally, this species holds ecological and ethnopharmacological significance [25,26]. Global climate change, including rising temperatures and sea levels, poses significant challenges for Acorus species living in freshwater wetlands [27,28,29,30]. However, no research has yet been conducted on GATA transcription factors in Acorus species, which greatly limits our understanding of its horticultural and ecological applications. This is particularly relevant given its use in aquatic environments, where understanding its genetic adaptations could enhance its ecological role. Specifically, without knowledge of GATA transcription factors, we cannot identify the genes that help Acorus cope with environmental stresses like flooding or salinity, limiting our ability to strengthen its role in stabilizing wetland ecosystems (ecological use), develop hardier ornamental varieties for changing climates (horticultural use), or engineer stress-resistant strains through biotechnology (biotechnological use). Therefore, a thorough study of GATA can clarify the relationship between Acorus and abiotic stress, laying the foundation for the molecular breeding of stress-resistant Acorus varieties.
In the present study, we identified 38 AcGATA genes in tetraploid A. calamus and 20 AgGATA genes in diploid A. gramineus. Comparative analyses were performed to explore the phylogeny, conserved motifs, gene structures, and chromosomal distributions of these genes. Additionally, the expression patterns of AgGATA genes in leaf tissues under different abiotic stresses were analyzed and further validated through qRT-PCR experiments. Our findings provide insights into the evolutionary dynamics of GATA genes in monocotyledonous plants and provide a basis for future research on this key transcription factor family.

2. Materials and Methods

2.1. Identification, Classification and Phylogenetic Analysis of A. calamus and A. gramineus GATA Transcription Factors

A. calamus and A. gramineus genomes were downloaded from the National Center for Biotechnology Information (NCBI) database (http://cucurbitgenomics.org/, accessed on 3 November 2024) [31], and a total of 30 Ara. thaliana GATA–family protein sequences were downloaded from Tair (https://www.arabidopsis.org, accessed on 3 November 2024) [32].
A BLASTp (Basic Local Alignment Search Tool for proteins, version 2.3.0+) search was performed using Arabidopsis GATA protein sequences as queries against the A. calamus and A. gramineus genomes with stringent thresholds (E-value ≤ 1 × 10⁻⁵, sequence coverage ≥ 50%). Next, preliminary domain screening was conducted using NCBI’s Conserved Domain Database (https://www.ncbi.nlm.nih.gov/cdd/, accessed on 3 November 2024) with default parameters (E-value cutoff of 0.01, minimum alignment length of 40 amino acids). Rigorous domain validation was then performed using HMMER v3.3.2 (https://www.ebi.ac.uk/Tools/hmmer/search/phmmer, accessed on 3 November 2024), involving three critical steps: first, constructing a position-specific scoring matrix (PSSM) based on the PFAM GATA domain seed alignment (PF00320); second, running Hmmscan with stringent thresholds (E-value ≤ 1 × 10⁻⁵, domain coverage ≥ 85%); and third, manually verifying zinc finger topology by inspecting multiple sequence alignments [33,34]. Sequence alignment was conducted using MAFFT [35].
The phylogenetic relationships were constructed based on the GATA family members from Ara. thaliana, A. calamus, and A. gramineus. The DNA sequences were aligned by MAFFT [34] and used TrimAL [36] to trim the poorly aligned positions. ML analyses were conducted with IQ-TREE [37], and the best substitution model was identified by ModelFinder with the Bayesian Information Criterium (BIC) [38]. The members were divided into groups I, II, III, and IV according to the phylogenetic tree, and the tree was visualized using iTOL (https://itol.embl.de/, accessed on 4 November 2024) [39]. The physicochemical properties of GATA proteins were analyzed using the protein parameter calc function of TBtools-II [33].

2.2. Conserved Motifs, Domains, and Multiple Sequence Alignment

The MEME tool (version 5.5.7, http://meme-suite.org/tools/meme, accessed on 5 November 2024) was used to analyze 58 motifs of AcGATA and AgGATA protein sequences, with the default setting of 10 motifs [40]. NCBI (https://www.ncbi.nlm.nih.gov/cdd/, accessed on 5 November 2024) was used to determine the domain structure (location and number) of AcGATAs and AgGATAs in the protein sequence. The TBtools software was used to visualize the phylogenetic trees, motifs, and domains of Acorus GATA family members [33]. A multiple sequence alignment was analyzed for GATA proteins using MAFFT [35] with default parameters, visualized via the Esprit 3.0 website (https://espript.ibcp.fr/ESPript/cgi-bin/ESPript.cgi, accessed on 6 November 2024) [41].

2.3. Chromosomal Localization and Collinearity Analysis

Using A. calamus and A. gramineus genome files and annotation files, the TBtools software was used to map the gene distribution of AcGATAs sand AgGATAs on the chromosomes.
MCScanX [42] identifies collinear genomic regions by analyzing homologous gene pairs and their chromosomal positions and is widely used to study genome evolution, polyploidization, and structural rearrangements, leveraging conserved synteny to infer evolutionary events and functional gene relationships. Therefore, we used MCScanX to perform a collinearity analysis of AcGATAs and AgGATAs. First, we involved whole-genome pairwise alignment between A. calamus and A. gramminus (E-value ≤ 1 × 10⁻¹⁰, max_target_seqs 5). Then, we executed the MCScanX algorithm with critical parameters, including a minimum collinear block requirement of 5 homologous gene pairs, a maximum gap size of 25 intervening genes, and an E-value threshold of ≤ 1 × 10⁻⁵ for anchor pair significance. Finally, the collinearity of the A. calamus and A. gramineus chromosomes was visualized using TBtools, and GATA genes were highlighted [33].

2.4. Cis-Elements and Protein–Protein Interaction Analysis

The 2000 bp upstream sequences of the GATA gene promoters in A. calamus and A. gramminus were extracted and analyzed for cis-acting element annotation using the PlantCARE online tool (http://bioinformatics.psb.ugent.be/webtools/plantcare/html/, accessed on 8 November 2024) [43]. Excel was used to generate heat maps and pie charts for the distribution of light-responsive elements, abiotic and biological stresses, plant hormone responses, and plant growth and development elements. The protein sequences of GATAs were uploaded to the STRING database (https://string-db.org/, accessed on 10 November 2024) for a network comparison [44]. Interactions were predicted between AcGATAs and AgGATAs and with other proteins based on Ara. thaliana protein interaction data. The predictive data were visualized using Cytoscape 3.10.3 [45].

2.5. Plant Drought and Salt Stress Treatment

This study utilized rhizome divisions (asexual propagation) from healthy 5-year-old A. gramineus mature plants selected from Fujian Agriculture and Forestry University’s germplasm nursery. Samples with ≥6 intact leaves, a 30 cm height, a disease-free status, and intact root systems after six months of greenhouse cultivation were incubated for 10 days under controlled conditions: a 12 h/12 h light/dark cycle (8000 lx), 28 °C/25 °C day/night temperatures, and 75% relative humidity. After collecting untreated control samples, the stress treatment was then applied. The plants were secured in hydrologic containers using supports, with the rhizome (stem) and roots fully immersed in the treatment solutions. The leaves were elevated and isolated from the solutions using a non-absorbent barrier (parafilm-sealed foam collars) to prevent unintended contact.
Polyethylene Glycol (PEG), a chemically inert, non-penetrating osmotic agent, induces osmotic stress to simulate drought by lowering the medium’s water potential, creating a gradient that limits root water uptake and mimics natural drought conditions [46,47]. Therefore, in the drought treatment, the stems and roots of the plants were soaked in a 20% PEG2000 solution for 20 min and then taken out. Samples were collected at 3, 9 and 24 h after treatment [48]. In the salt stress treatment, the stems and roots of the plants were immersed in a 300 mmol/L NaCl solution for 20 min and then removed [49]. Samples were taken at 3, 9, and 24 h after treatment, respectively. Leaf samples were collected at the same time points. All the treatments were repeated in triplicate, and the samples were immediately stored at −80 °C.

2.6. Gene Expression Patterns and Quantitative Fluorescence Validation Under Abiotic Stress

A FastPure Plant Total RNA Isolation Kit (Vazymes, Nanjing, China) was used to extract the total RNA from all the leaf tissues that had been stored at −80 °C. High-quality RNA was extracted and subjected to paired-end sequencing on the Illumina high-throughput sequencing platform to obtain raw RNA-seq data. The raw RNA-seq data underwent quality control using fastp [50]. The filtered RNA-seq reads were aligned to the A. gramineus genome using HISAT2 [51]. The expression level of each gene was quantified as the fragments per kilobase of transcript per million mapped reads (FPKM), which was calculated through FeatureCounts. We identified the actin gene (AgACT1) in A. gramineus by performing a BLAST search using the Arabidopsis actin (act) gene as a reference. Through an evaluation of the coefficient of variation (CV) and expression stability across samples, genes with excessively high or low expression levels were excluded. Ultimately, the gene KAK1276548.1 (AgACT1), which exhibited stable expression across all tissues, was selected. The seven AgGATA genes (AgGATA1, AgGATA3, AgGATA5, AgGATA6, AgGATA9, AgGATA19, and AgGATA20) that exhibited significant differential expression in the transcriptomic analysis were further validated through quantitative real-time PCR (qRT-PCR), with three technical replicates per sample. Primers for the seven stable candidate genes and reference gene were designed using Primer Premier 5.0 [52], as listed in Table 1. The first strand of cDNA was synthesized using the Hifair AdvancedFast One-Step RT-gDNA Digestion SuperMix for qPCR (Yeasen, Shanghai, China). Using the Hieff UNICON Universal Blue qPCR SYBR Green Master Mix (Yeasen, Shanghai, China), qPCR was performed on a QuantStudio 1 Plus real-time PCR detection system (Thermo Fisher Scientific). The cycle conditions were as follows: 95 °C for 30 s, 95 °C for 15 s, and 60 °C for 30 s, 40 cycles. The technique was repeated three times for each gene. Using KAK1276548.1 as the internal control gene, the relative expression of the gene was calculated using the 2−ΔΔCT method [53]. A correlation analysis of the relative expression levels of each gene was performed using the OmicStudio tool (https://www.omicstudio.cn/tool, accessed on 15 November 2024).

3. Results

3.1. Identification and Characteristics Analysis of GATAs

A total of 38 and 20 GATA genes were identified in A. calamus and A. gramineus, respectively. These were renamed AcGATA1-AcGATA38 and AgGATA1-AgGATA20 according to their chromosomal distribution and sequence. The identified GATA protein sequences of Acorus are shown in Table S1. The prediction of the physicochemical properties of the proteins showed that the physicochemical properties of proteins of AcGATA and AgGATA members have undergone significant changes (Table S2).
The AcGATA proteins ranged in the number of amino acids from 141 (AcGATA5, AcGATA28) to 725 (AcGATA27) and in molecular weight from 79.73 kDa (AcGATA27) to 15.74 kDa (AcGATA5, AcGATA28). The theoretical pI ranged from 10.39 to 4.75. The number of amino acids of AgGATA proteins ranged from 488 (AgGATA18) to 138 (AgGATA17), and the molecular weight ranged from 54.48 kDa (AgGATA18) to 15.93 kDa (AgGATA17). The theoretical pI ranged from 9.71 to 4.96. All the AcGATA and AgGATA proteins are hydrophilic proteins.

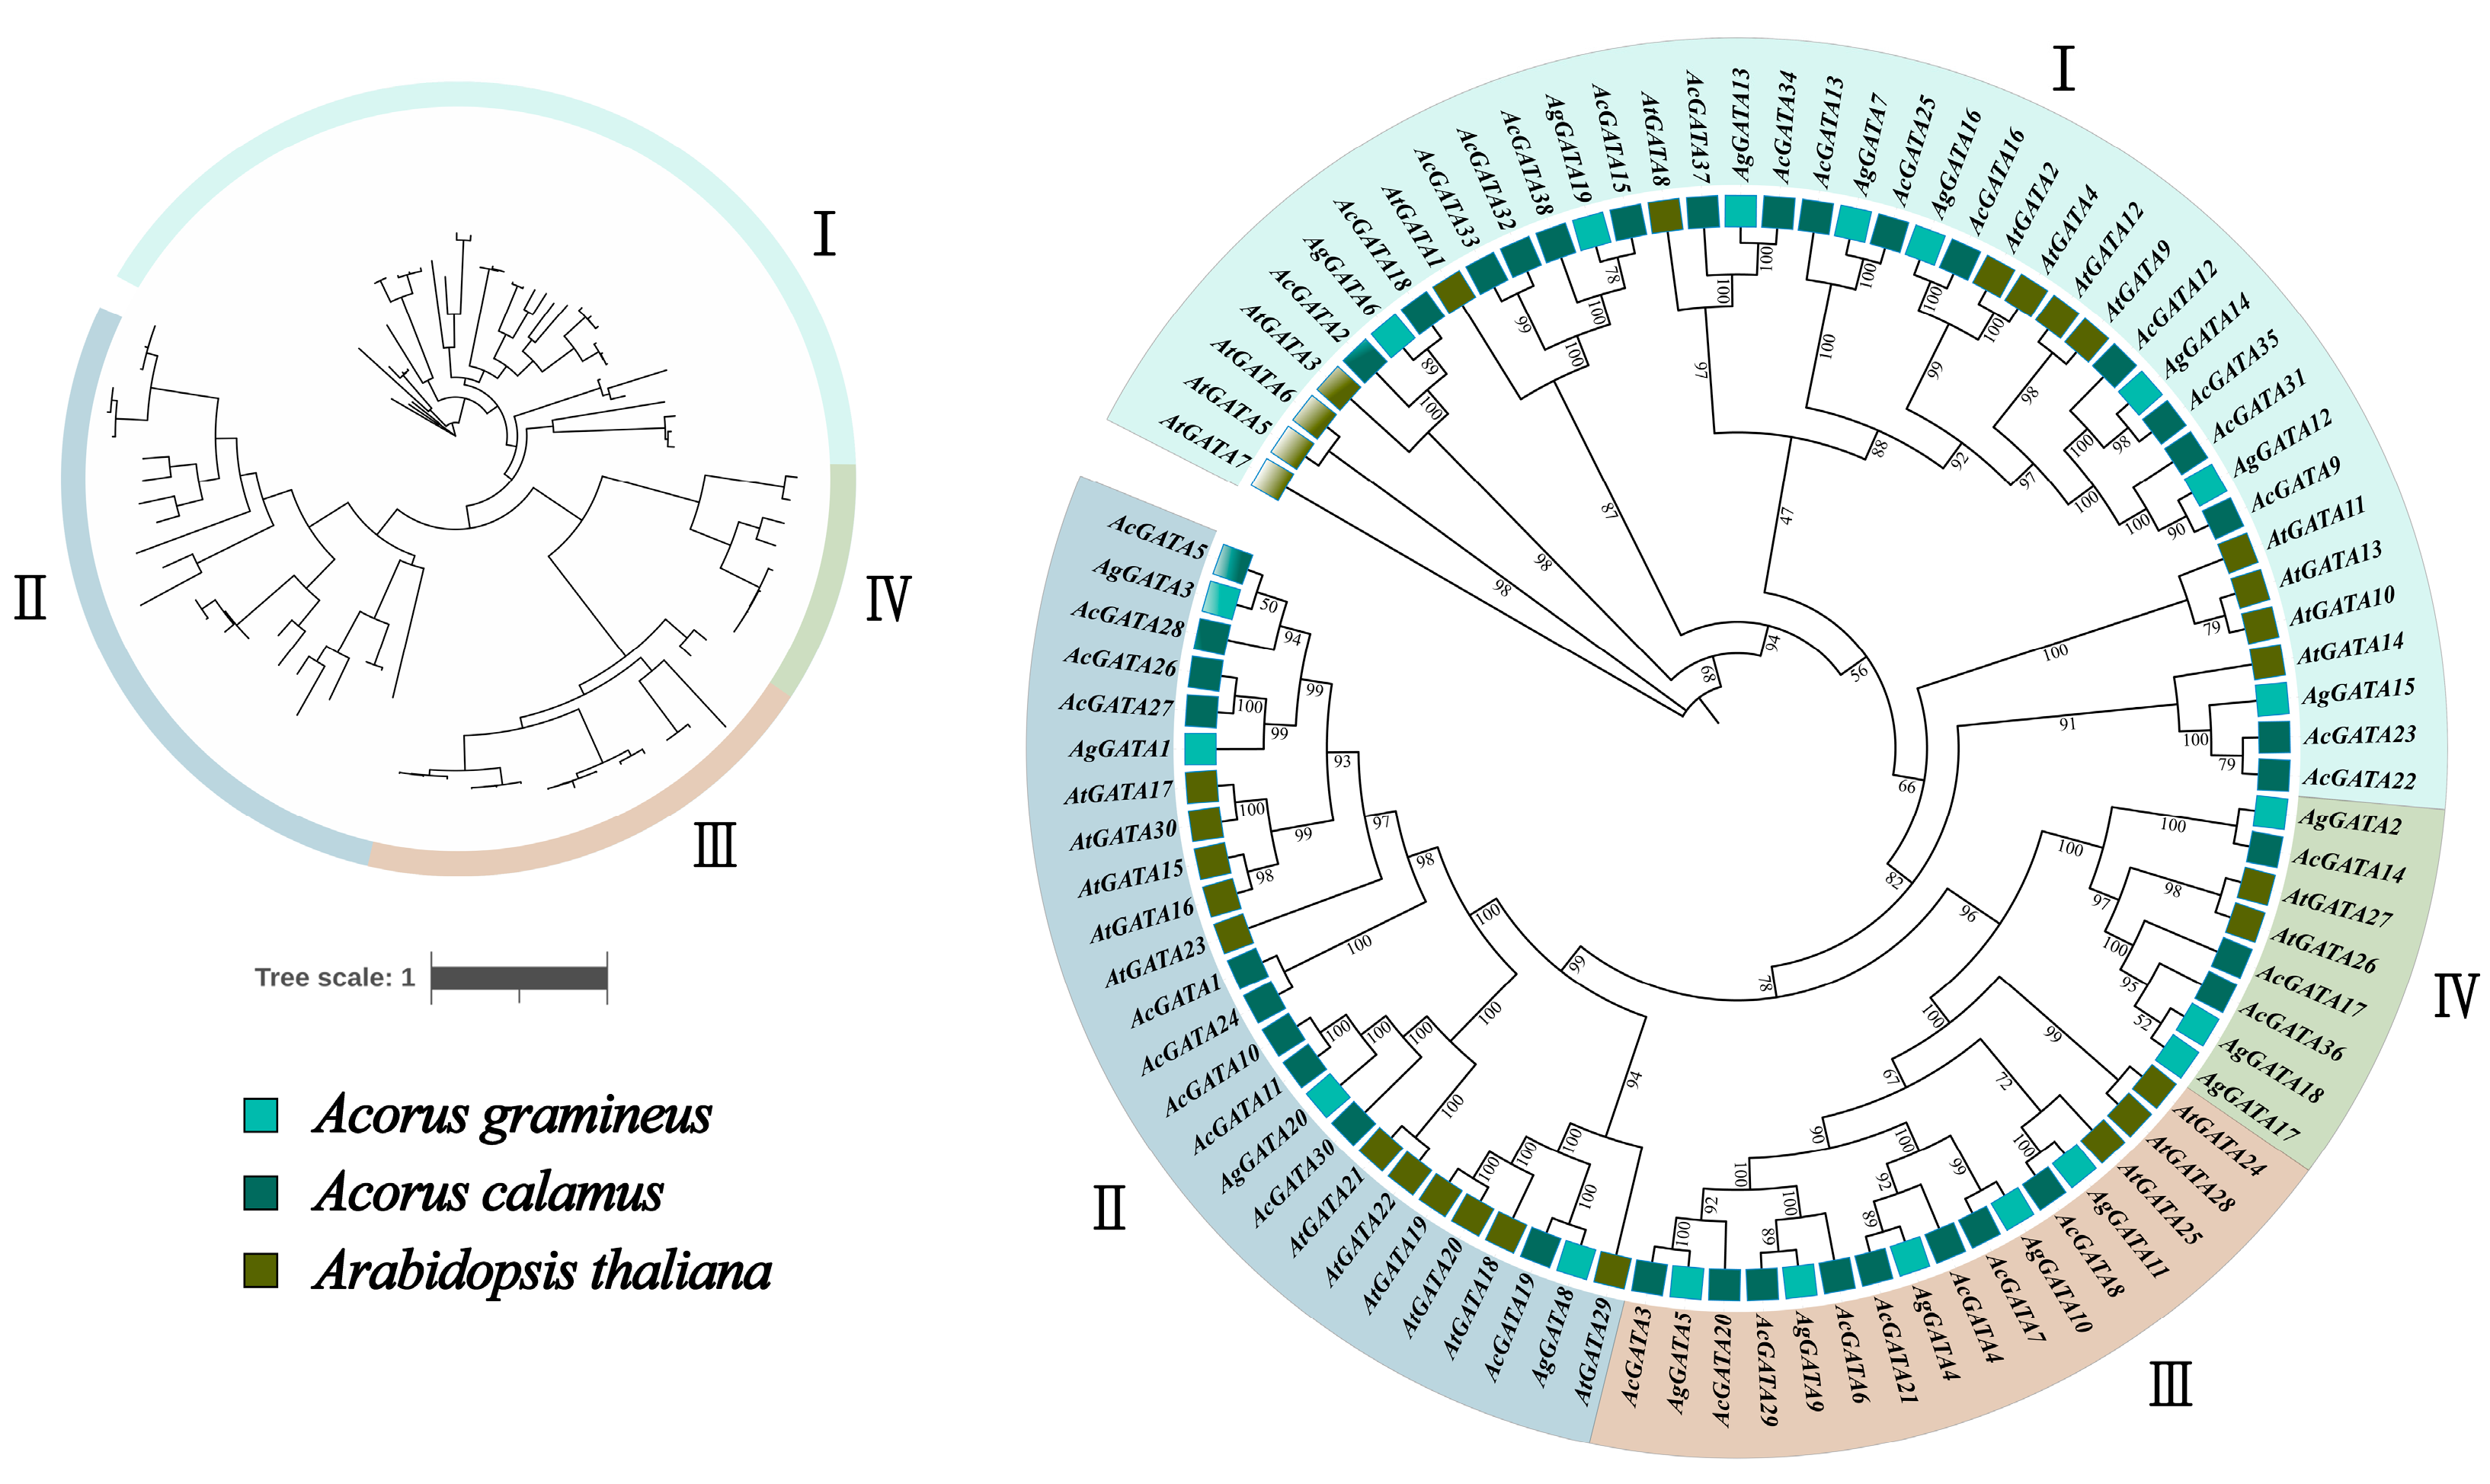
3.2. Phylogenetic Analysis of AcGATAs and AgGATAs

ML phylogenetic trees of GATA family members from three species, Ara. thaliana, A. calamus and A. gramineus, were constructed (Figure 1). According to the classification of AtGATA members, GATA genes were divided into four groups: I, II, III, and IV. Groups I to IV in A. calamus contained 17, 9, 8, and 4 AcGATA genes, respectively, and groups I to IV in A. gramineus contained 8, 3, 5, and 4 AgGATA genes, respectively. The GATA genes in A. calamus and A. gramineus were highly clustered together, indicating a low degree of evolutionary differentiation between the two species. In subgroup I and subgroup II, the number of AcGATAs genes was significantly amplified.

3.3. Analysis of Conserved Motifs and Domains in GATA Proteins

A domain analysis showed that the domains of the GATAs of different subfamilies had different degrees of conservation (Figure 2). The overall sequence of subfamily III was the most conservative, with each member containing motif3 and motif4. These were the most obvious distinguishing features between subfamily III and other subfamilies. The conserved form of the other subgroups was relatively low; subgroup I contained motif2, subgroup II contained motif1 and motif6 or 9, and most members of subgroup IV contained only motif1. All the identified AcGATAs and AgGATAs contained either the GATA domain or the ZnF_GATA domain (Pfam PF00032), with both domains sharing identical structures and functions.

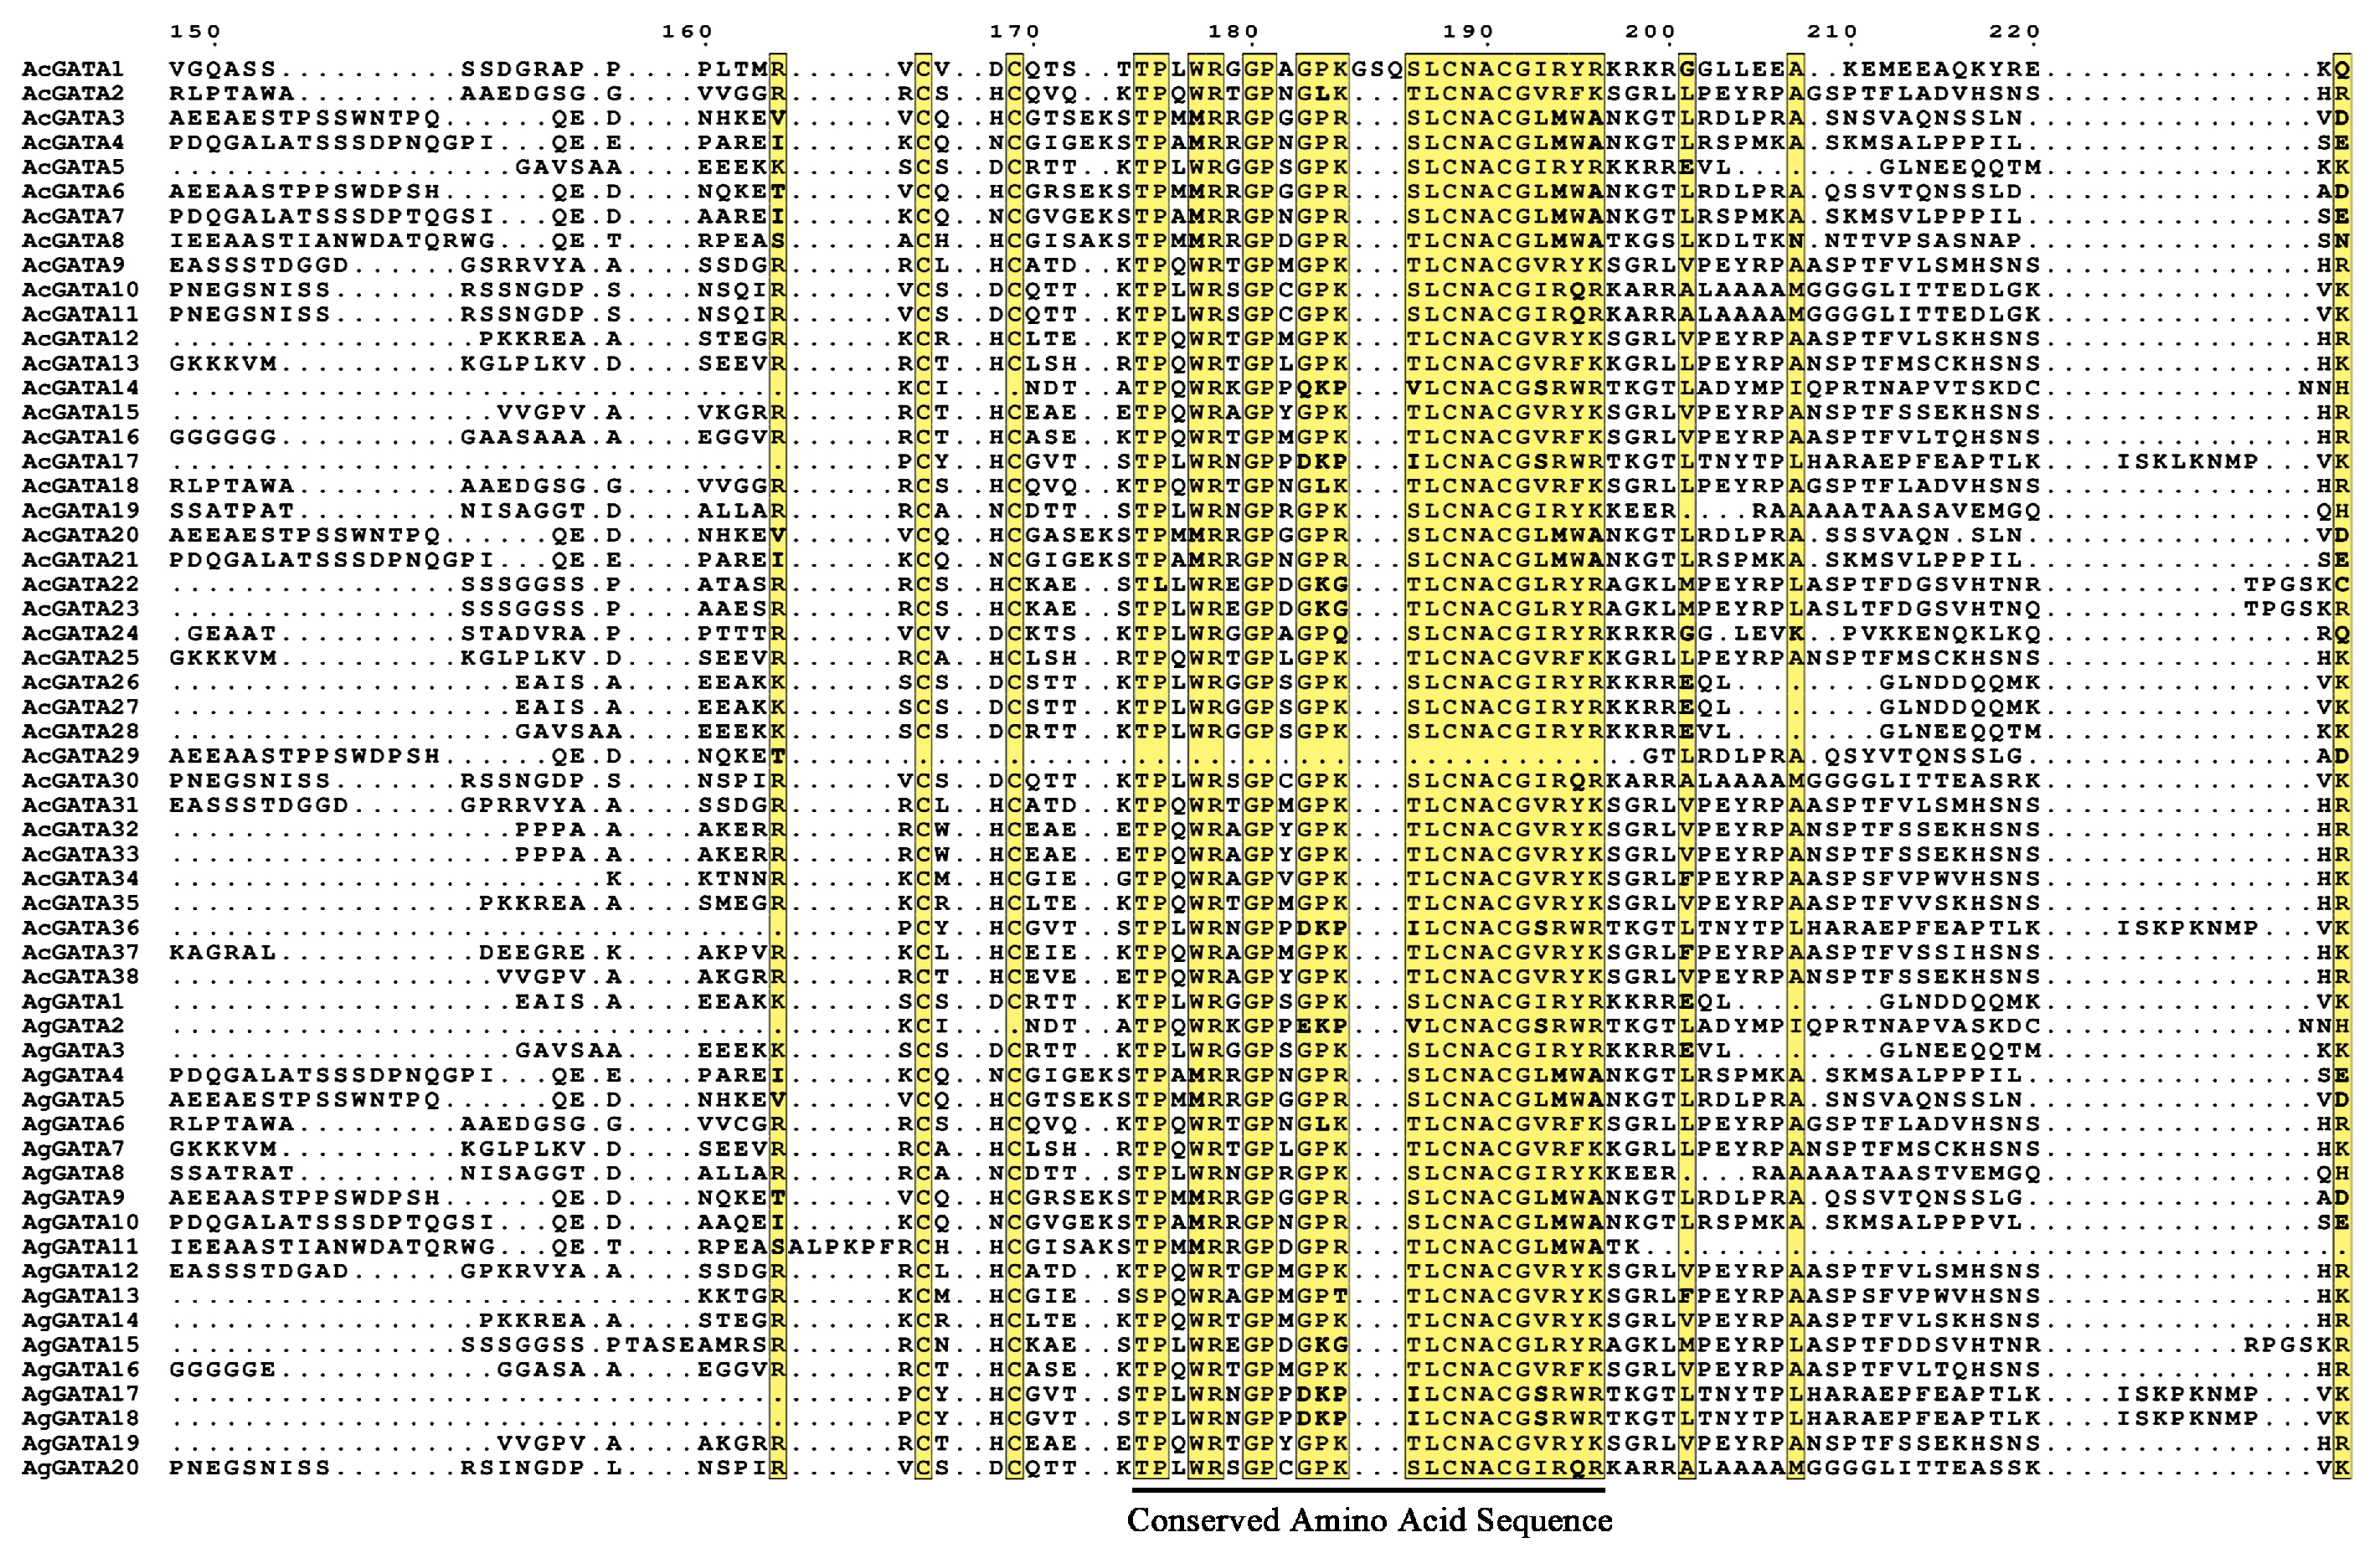
3.4. Multiple Sequence Analysis of AcGATAs and AgGATAs

As shown in Figure 3, consistent with studies in other species, the GATA proteins in A. calamus and A. gramineus showed highly conserved properties. It is worth noting that almost all the AcGATAs and AgGATAs showed highly conserved properties at the amino acid residue at the LCNACG site. Meanwhile, we noticed that AcGATA29 was deficient in this amino acid residue. We think this may be a genome annotation error.

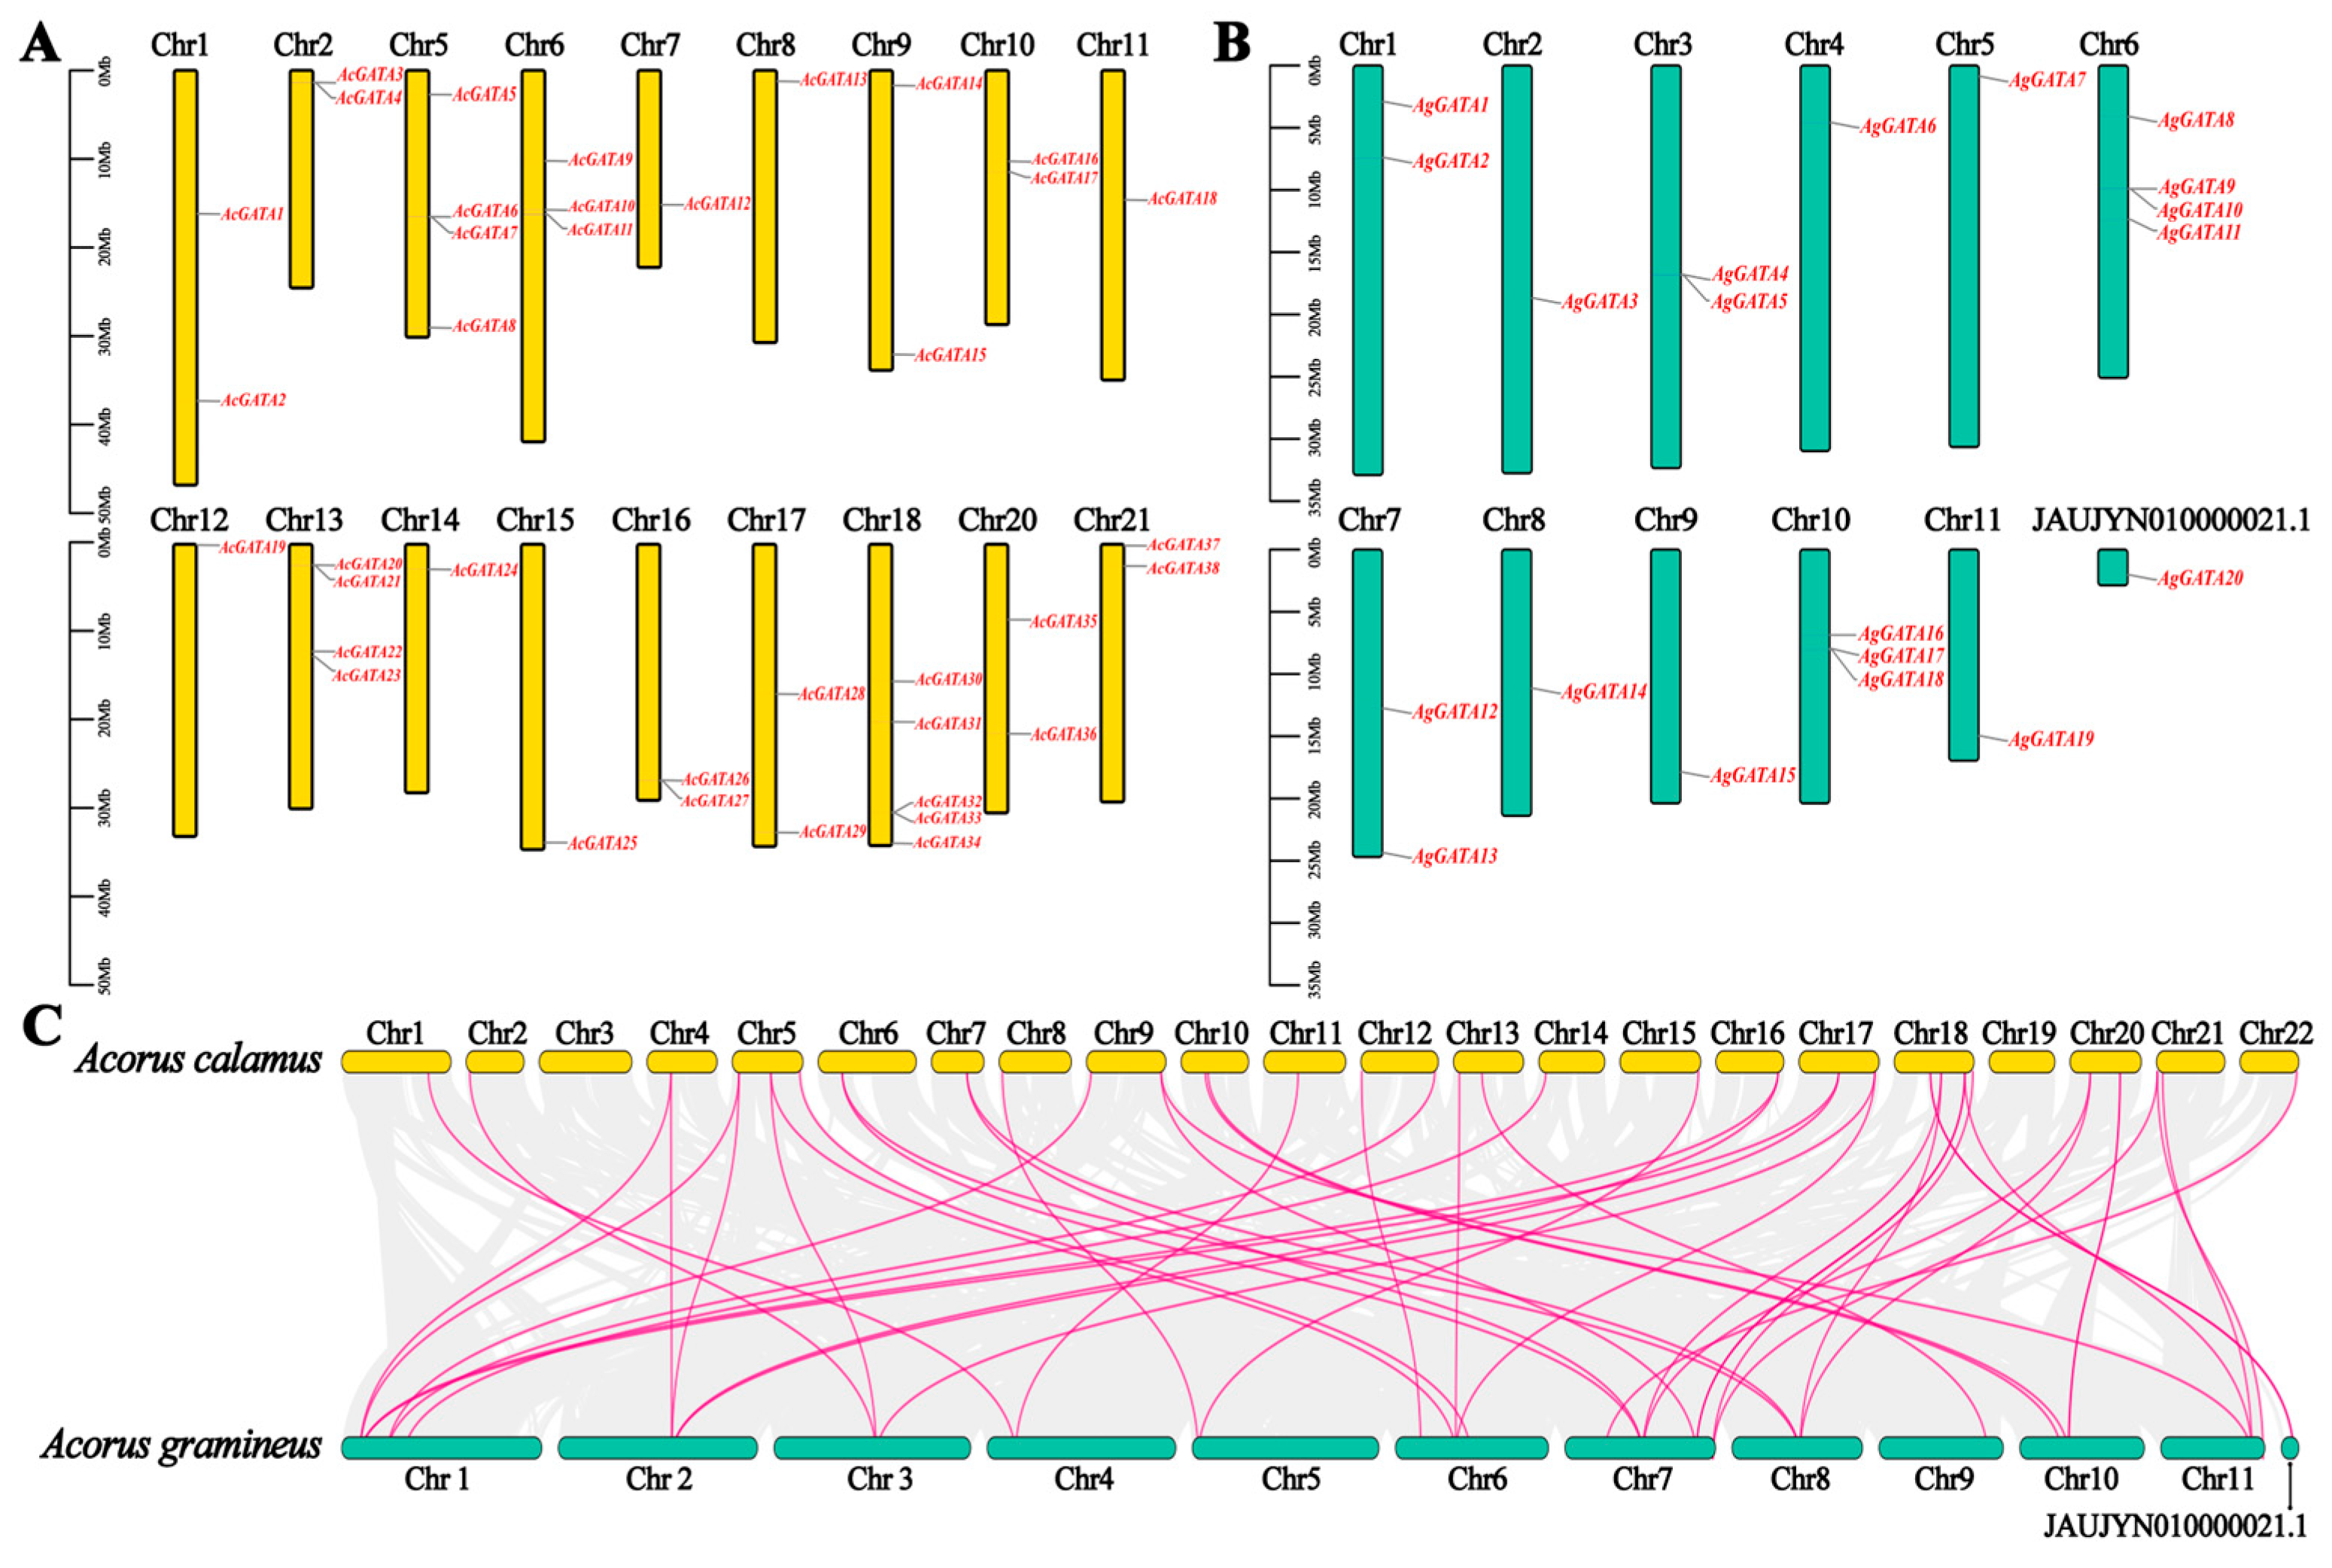
3.5. Localization and Collinearity Analysis of AcGATAs and AgGATAs

The positions of AcGATAs on the chromosomes are shown in Figure 4A, and the positions of AgGATAs on the chromosomes are shown in Figure 4B. In A. calamus, GATA genes were most abundant on chr18, with five genes. This was followed by chr5 and chr13, each with four genes, and the rest of the chromosome distribution varied from one to three. In A. gramineus, AgGATA8-AgGATA11 were concentrated on chr6, AgGATA16-AgGATA18 were concentrated on chr10, and 1–2 different genes were distributed on the other chromosomes.
To better understand the evolution of the Acorus GATA gene family, we performed a collinearity analysis of A. calamus and A. gramineus, highlighting the collinear relationships of GATA genes between the two species with pink lines (Figure 4C). The results revealed an extensive array of collinear relationships between the GATA gene of A. calamus and A. gramineus, with each GATA gene exhibiting corresponding collinear loci in both species. The analysis revealed that each GATA gene from both species likely has at least one corresponding collinear locus in the other. Many genes show direct one-to-one correspondences on similar chromosomes, while others correspond across different chromosomes.

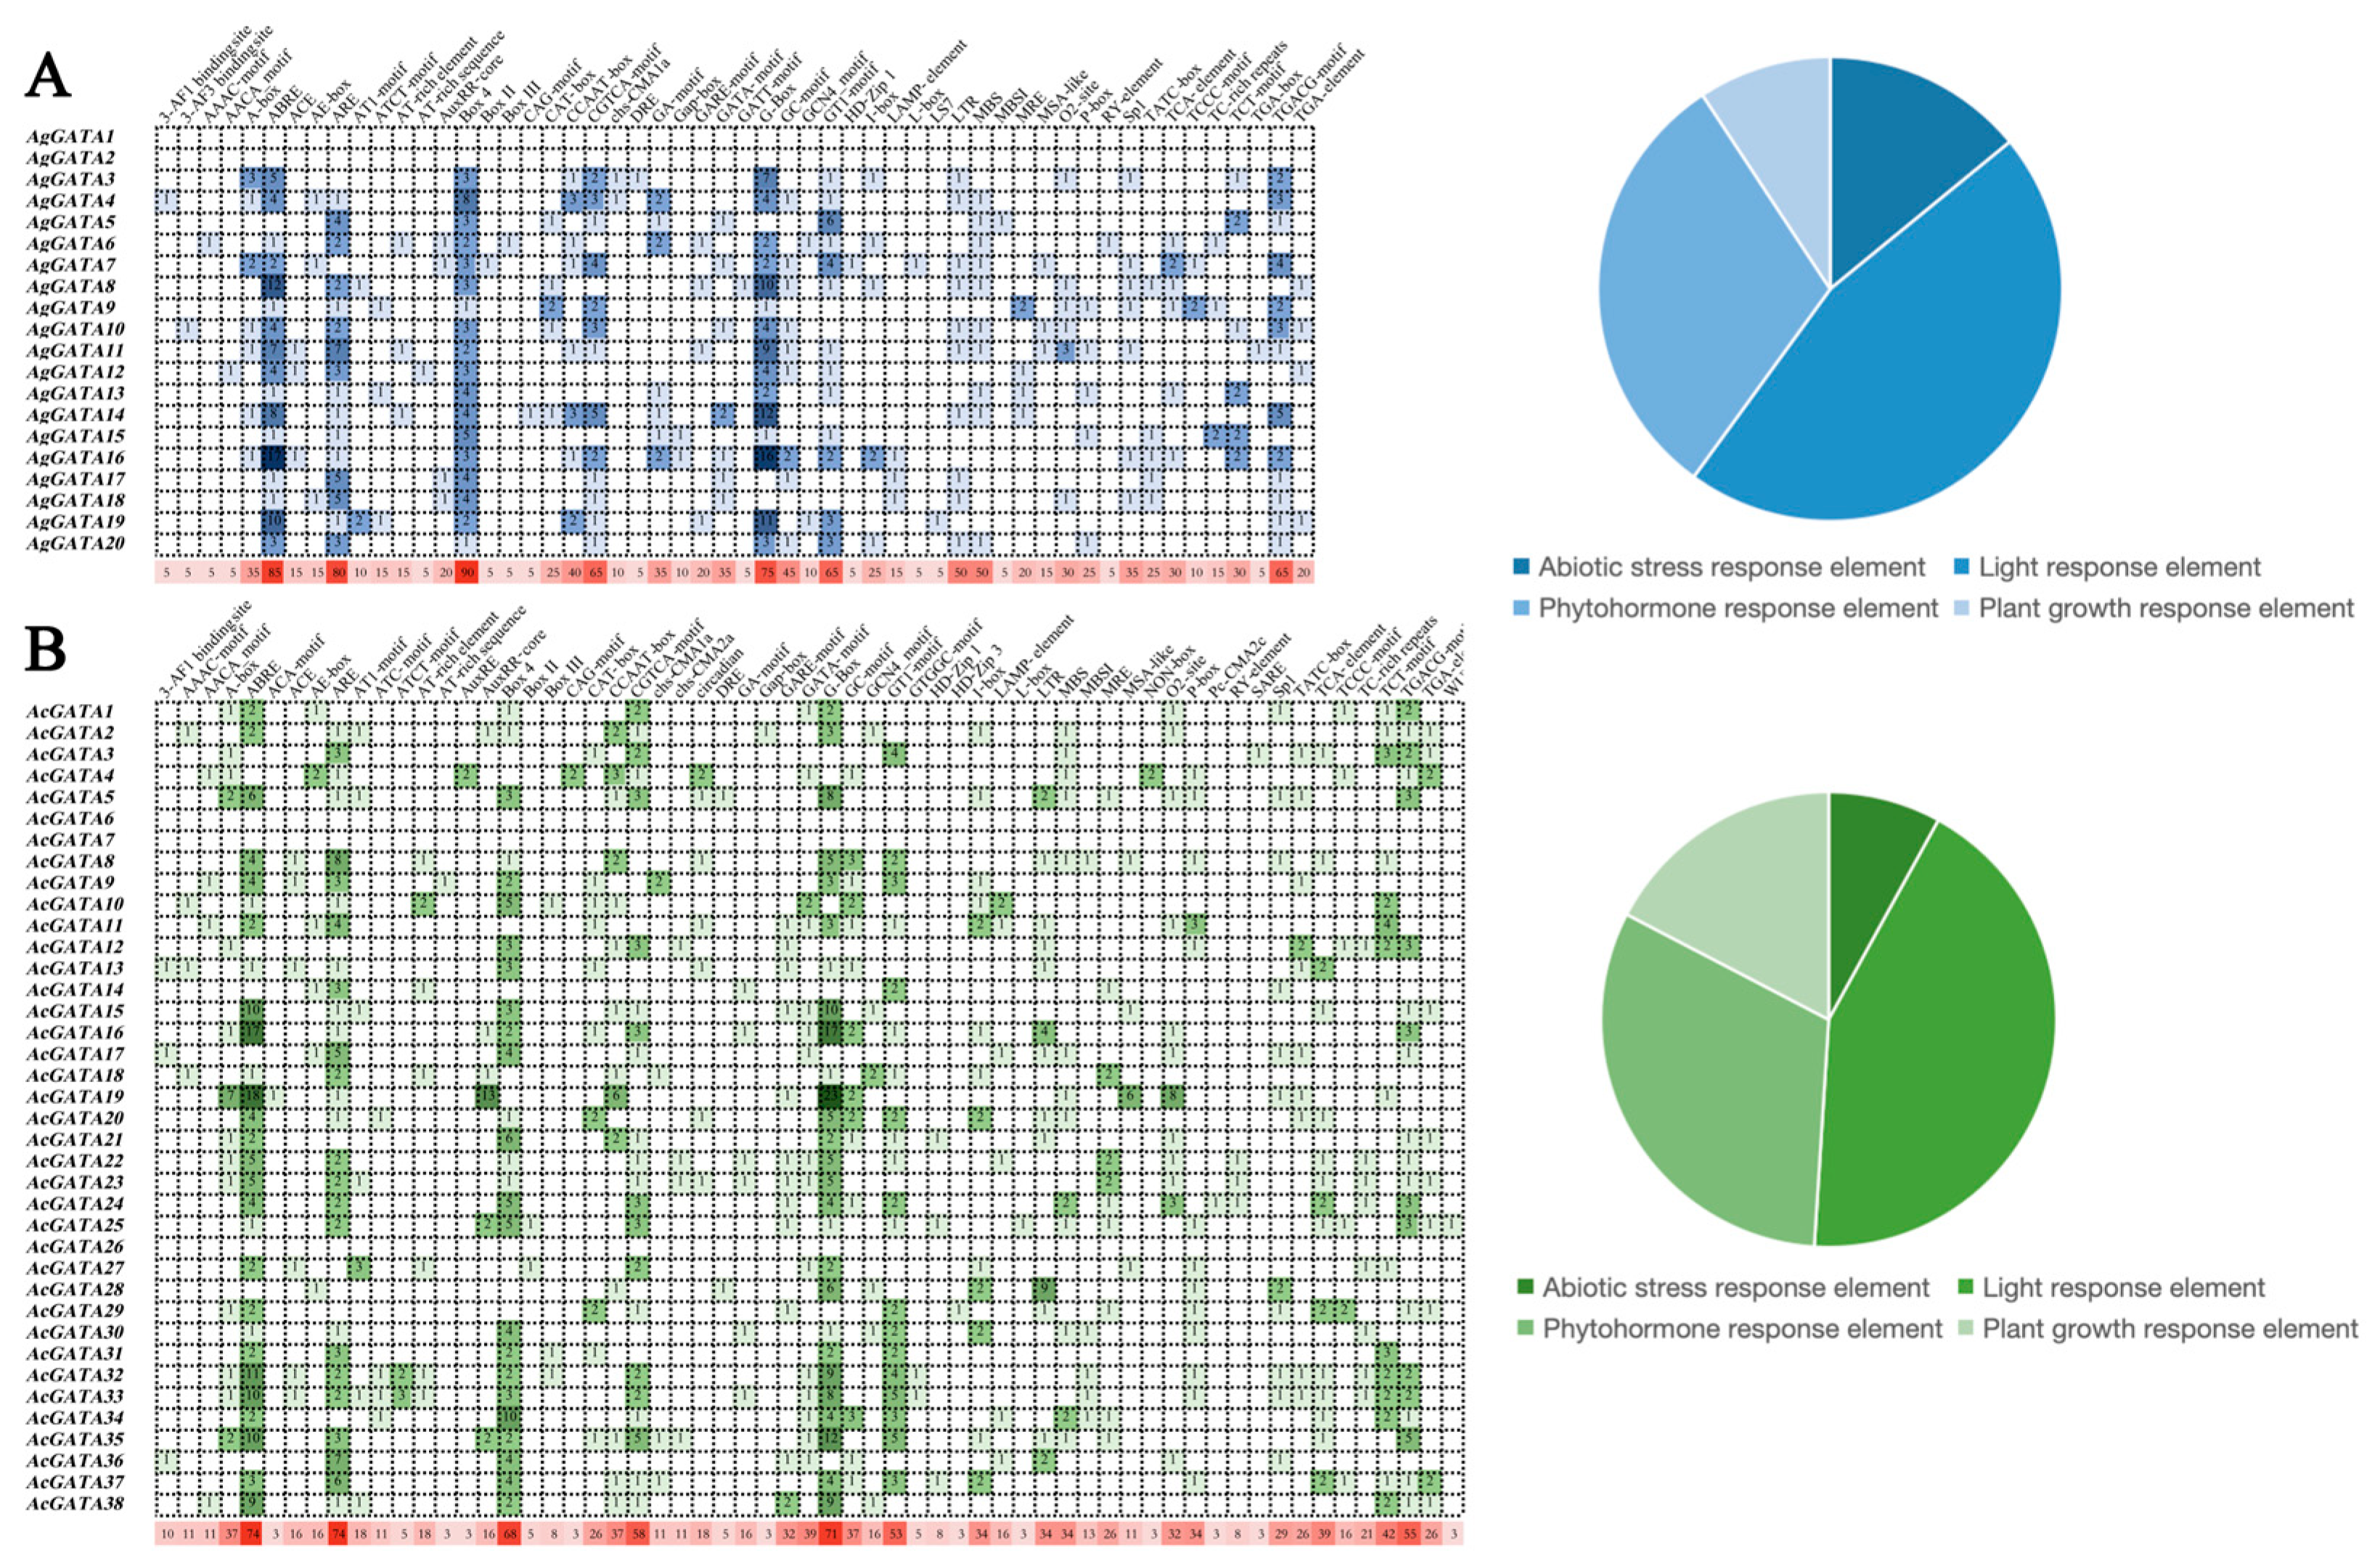
3.6. Analysis of Cis-Acting Elements on Promoters

The 2000 bp promoter sequences of GATAs in the tetraploid A. calamus genome and the diploid A. gramineus genome were obtained, and the cis-elements were searched using PlantCARE. The identified cis-elements were classified into four categories: light-responsive elements, plant-hormone-responsive elements, abiotic-stress-responsive elements, and plant growth and development elements. The results showed that the light-responsive elements were the most abundant and widely present in the promoter sequences of GATA genes (Figure 5). Secondly, hormone-responsive elements, such as ABRE, were widely found in GATA. AgGATA16 contained the most ABRE elements (17), and AcGATA19 contained the highest number of ABRE elements (18). Methyl jasmonate (MeJA) elements were second only to abscisic acid elements in terms of their quantity and distribution.
In A. gramineus, the predicted plant growth and development elements were fewer than the hormone-responsive elements, but the opposite was true for A. calamus. In addition, in the promoter sequences of AcGATAs and AgGATAs, the identified cis-elements related to abiotic stress included those related to anaerobic induction, low temperatures, and drought stress. Among these, the low-temperature and anaerobic induction elements were the most numerous, followed by those responding to drought stress, while those related to damage were fewer.

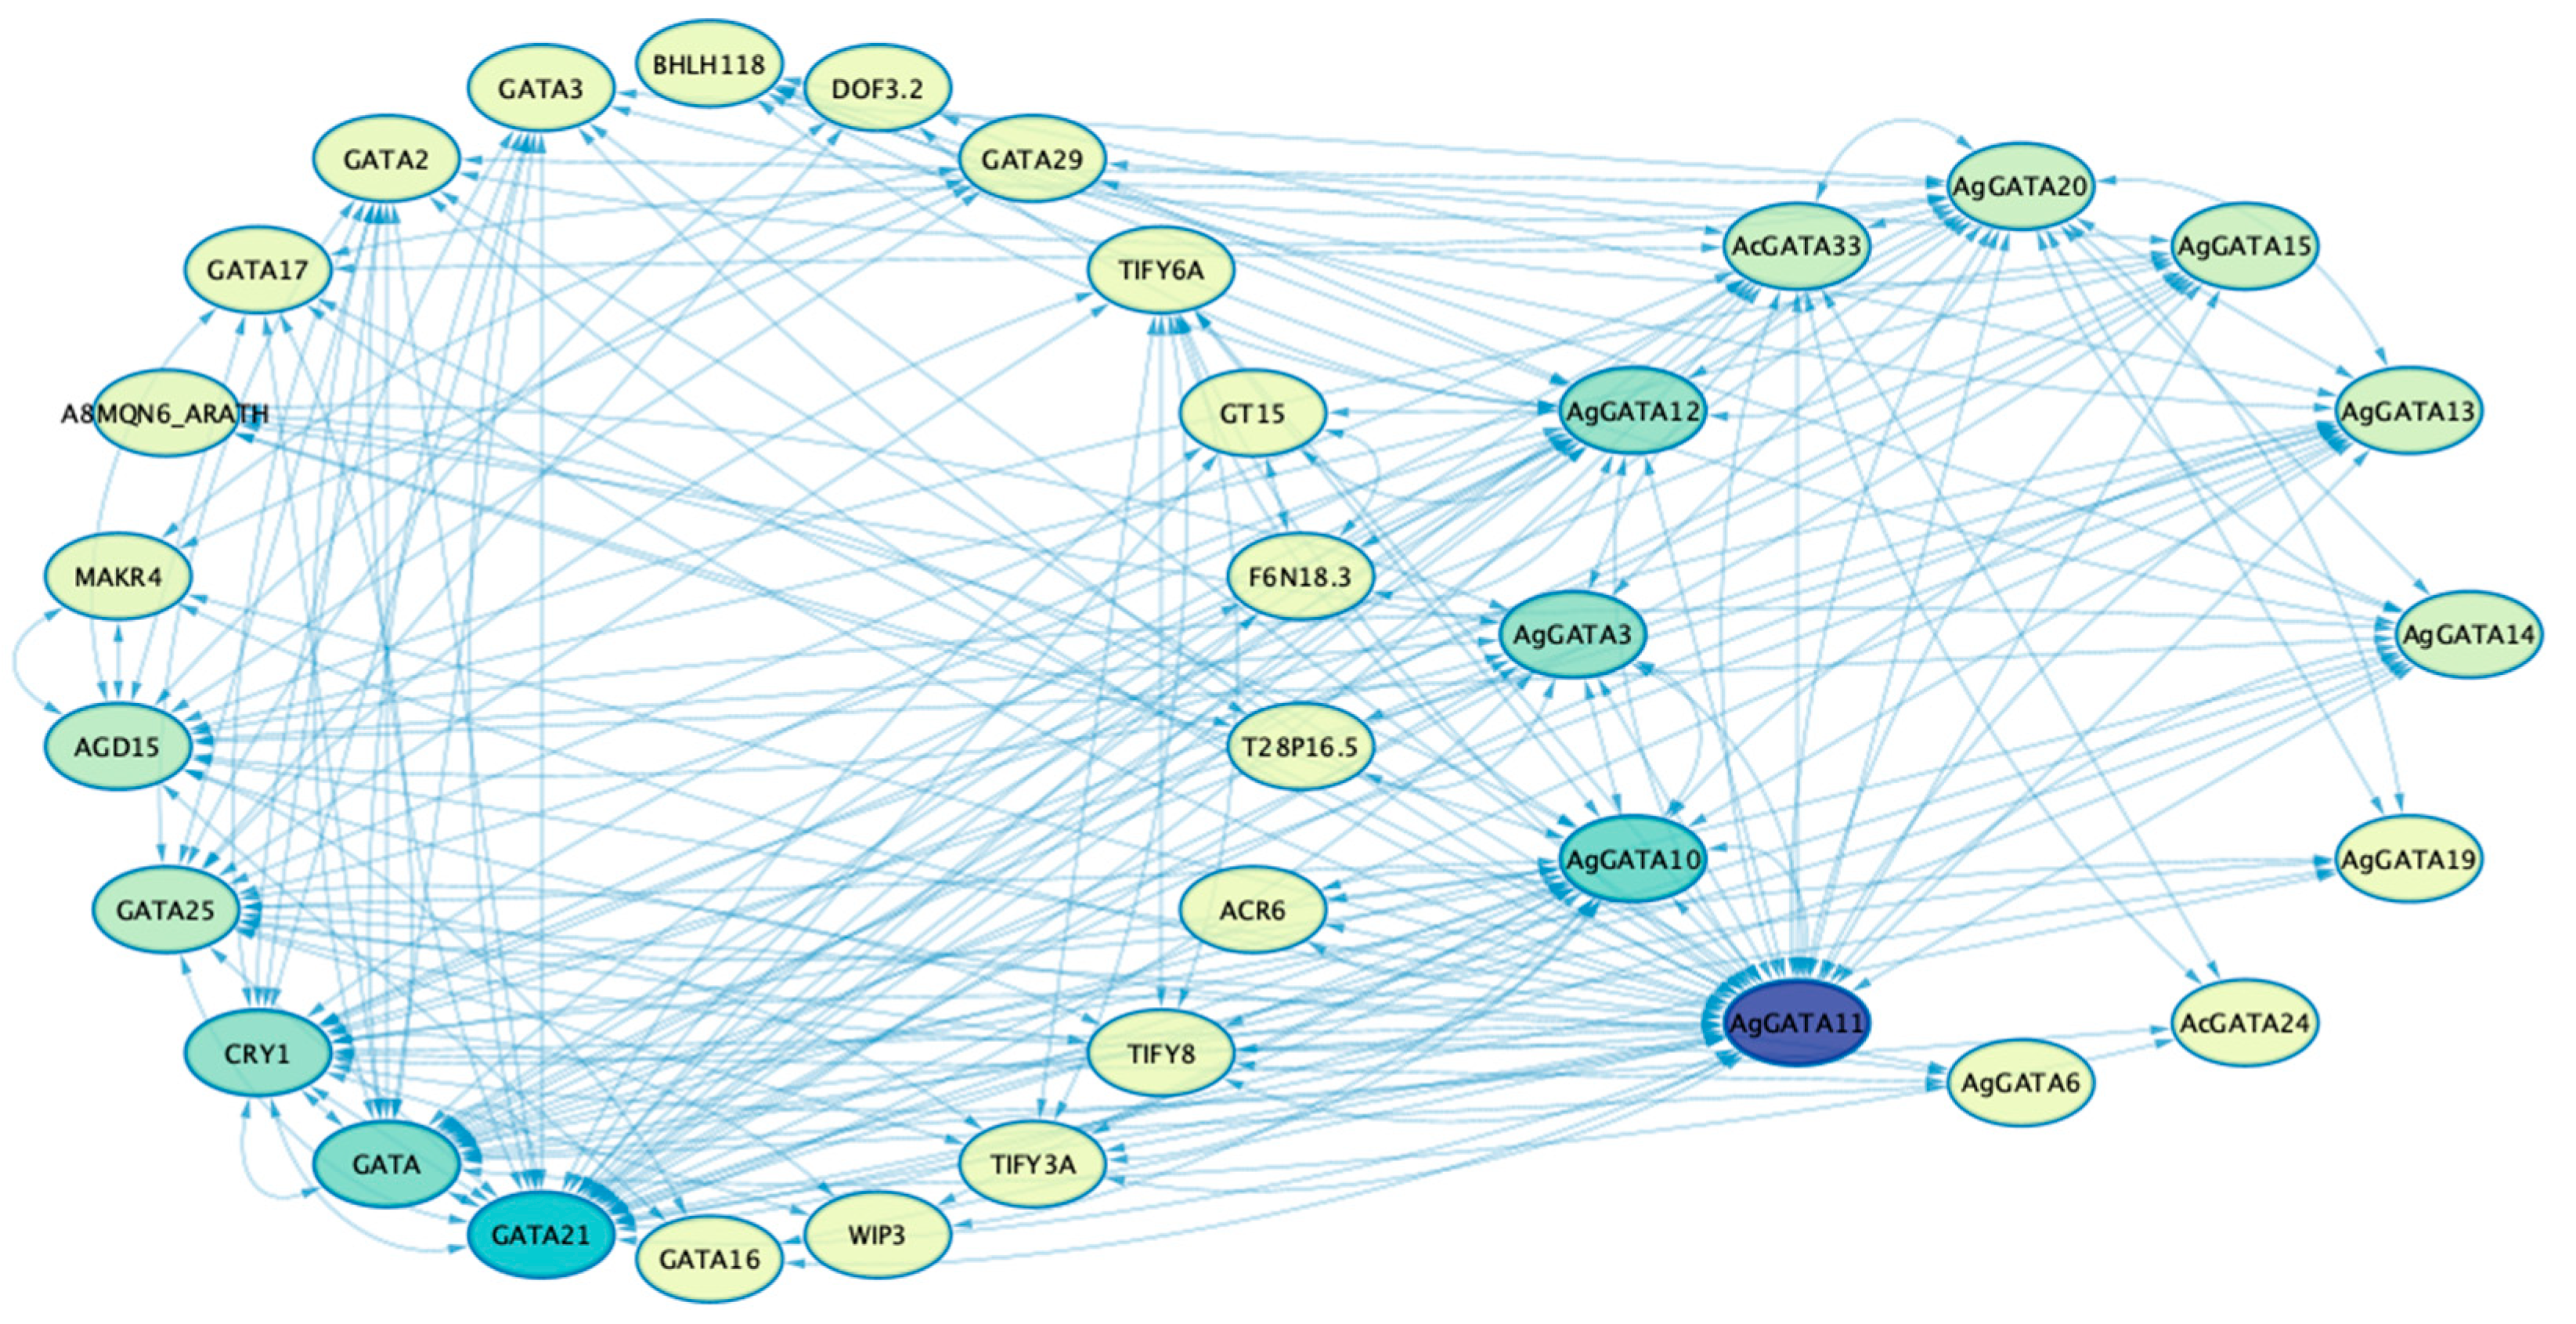
3.7. Protein–Protein Interaction and Structure Analysis

The protein interaction networks of the AgGATA and AcGATA proteins were predicted using the online database STRING (https://string-db.org/, accessed on 8 November 2024) to investigate the mechanism of GATA involvement in stress response (Figure 6). The interaction network showed that the GATA protein interactions in A. gramineus were significantly stronger than those in A. calamus. GATA proteins have strong interactions with CRY, AGD, MAKR, and other proteins. In addition, several proteins involved in plant stress responses have been identified as potential GATA interaction partners, including bHLH, DOF, TIFY, and others [54,55,56].

3.8. AgGATA Gene Responds to Abiotic Stress

Transcriptome sequencing was performed on the leaves of A. gramineus under different stress conditions, and the TPM (transcripts per million reads) values for 20 AgGATAs were obtained (Table S3). In Figure 7, the log2 of the TPM values is used to represent the transcriptional abundance of each gene in the leaf transcriptome. AgGATA2, AgGATA8, AgGATA13, and AgGATA15 had a TPM of 0 under all treatments, indicating that they were not expressed. Under normal, untreated conditions, the expression of 12 AgGATA genes was 0. In the three stages of D1, D2, and D3 after drought treatment, the overall trend of AgGATA expression gradually increased over time. Among them, the expression levels of AgGATA6 and AgGATA19 were significantly increased at the D1 stage (3 h after drought treatment). The expression of AgGATA1 was significantly increased at the D2 stage (9 h after drought treatment) and then decreased. In the three stages of S1, S2, and S3 after the salt stress treatment, most of the AgGATA expression levels showed a trend of first increasing and then decreasing, with the highest expression levels observed in AgGATA6 and AgGATA19 at the S2 stage (9 h after the salt treatment). In general, members of the AgGATA family showed significant responses to both drought and salt stress.

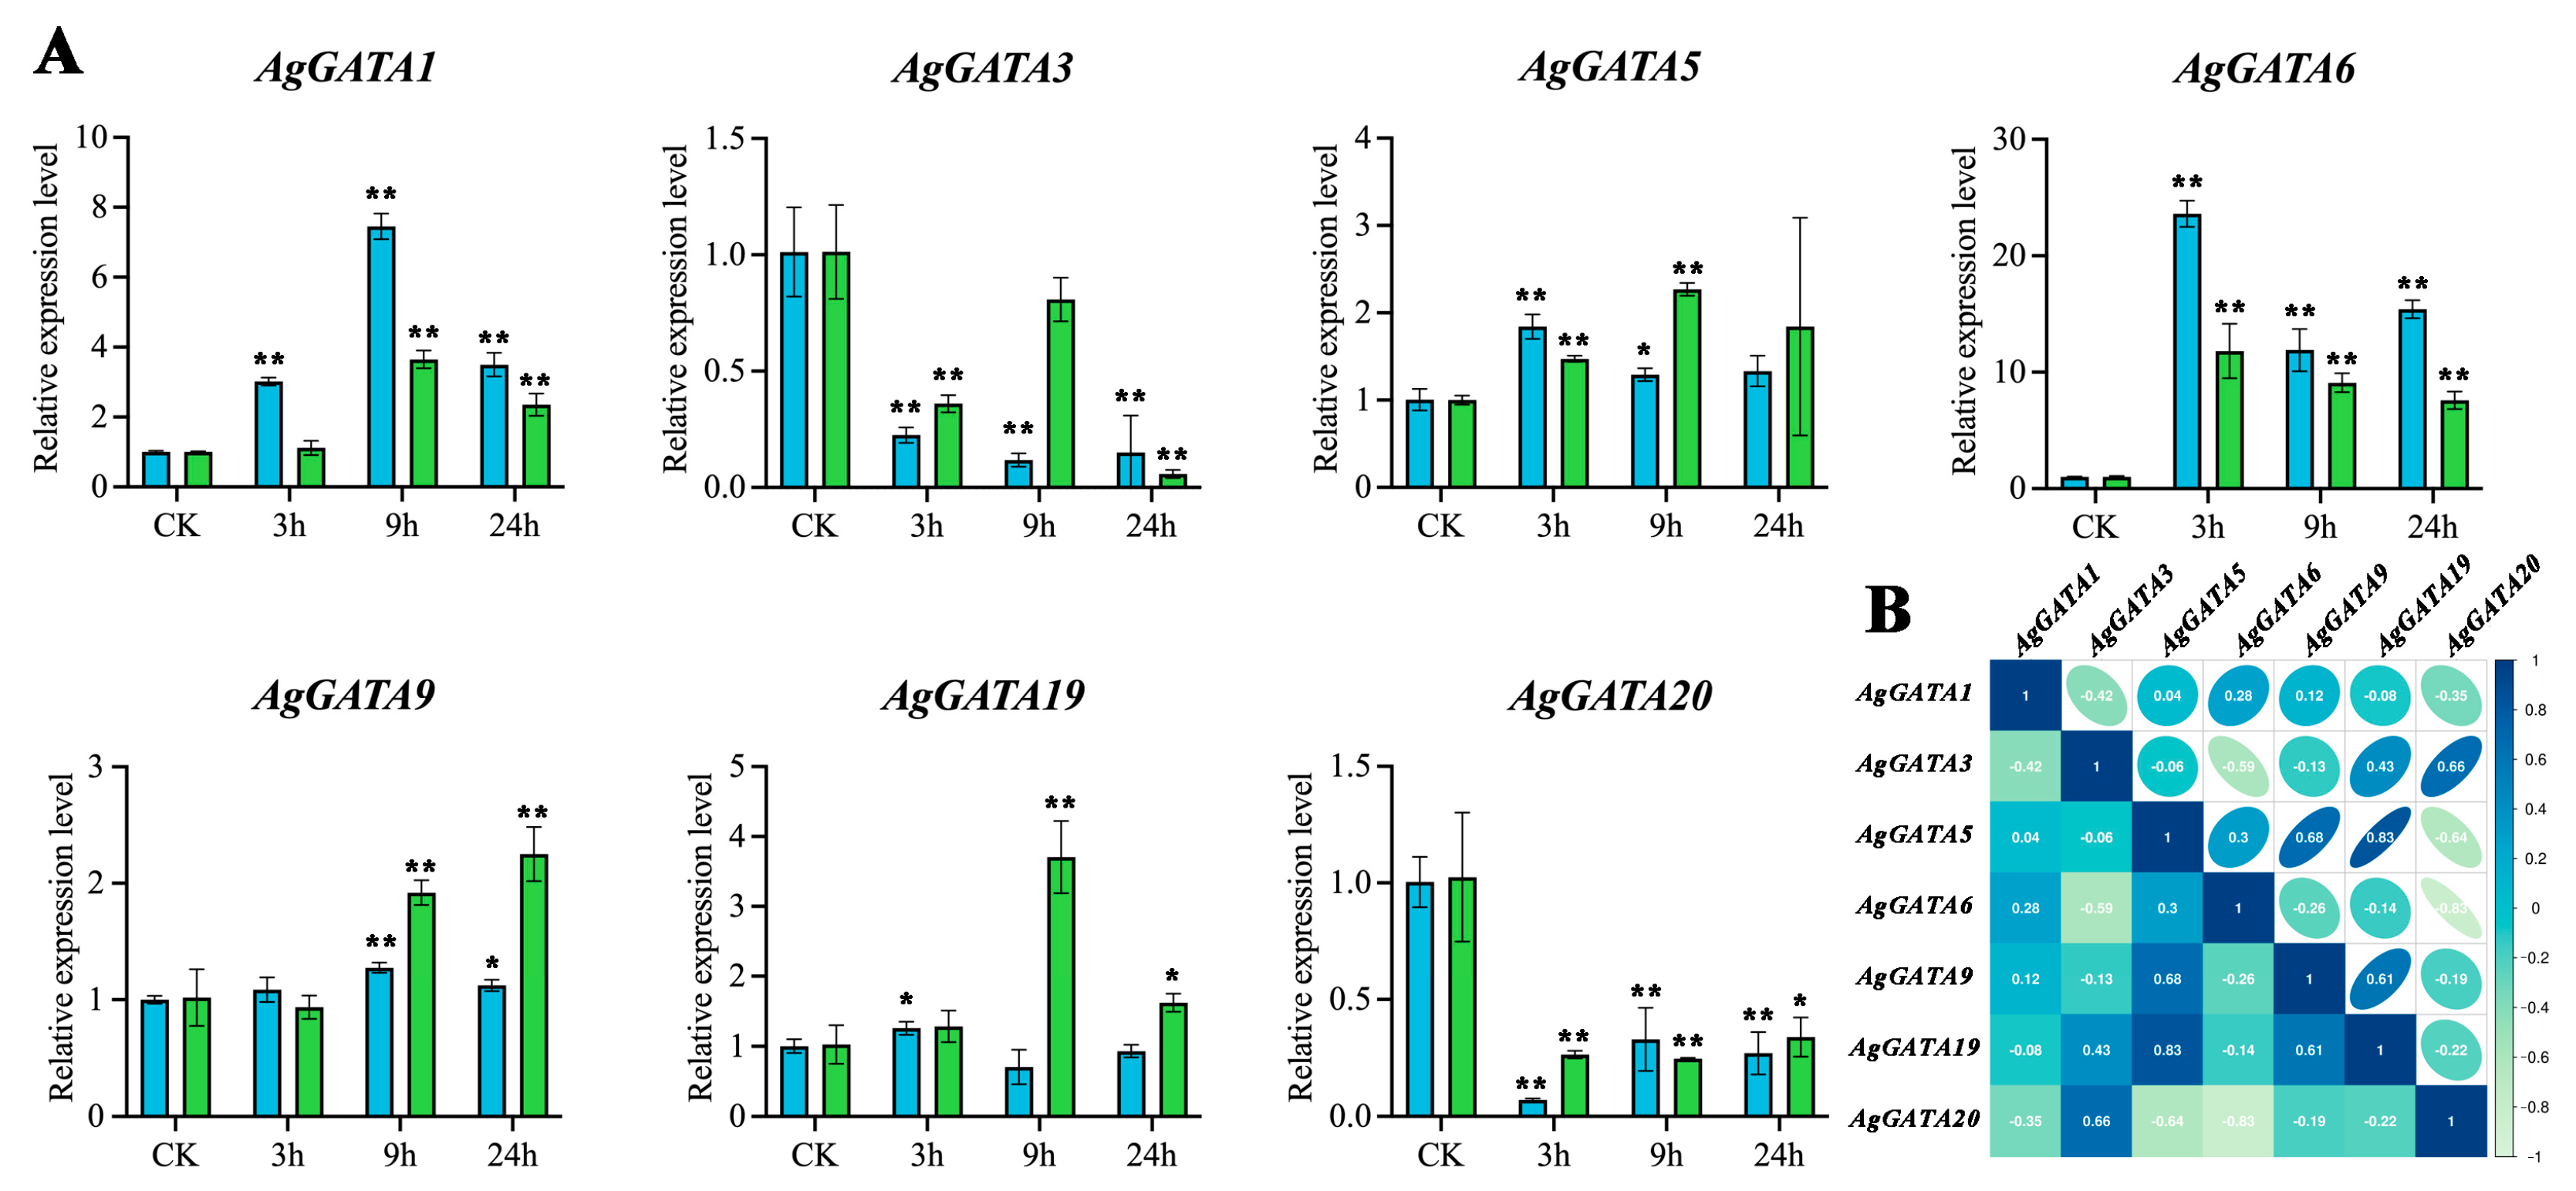
3.9. Quantitative Real-Time PCR Under Abiotic Stress in A. gramineus

To verify the expression patterns of AgGATAs under abiotic stress, we selected several genes with significant changes in their transcriptomes, detected and verified their transcription levels using qRT-PCR (Figure 8A), and explored the effects of drought and salt stress on the gene expression over the subsequent 24 h. The primer sequences are shown in Table 1. The results showed that the expression of seven AgGATAs was consistent with that observed in the transcriptome. The gene expression levels within 24 h after drought and salt stress were compared and analyzed, and it was found that the general trend of gene expression changes was similar. The expression levels of AgGATA1 and AgGATA6 increased significantly after drought stress, especially at the ninth and third hour post-treatment. The expression level of AgGATA19 did not change significantly after drought stress but showed a clear peak at the ninth hour after salt stress. Unlike the rising trends of other genes after stress, the expression levels of AgGATA3 and AgGATA20 decreased significantly. A further correlation analysis showed significant correlations between AgGATA3 and AgGATA20 (r = 0.66) and between AgGATA5 and both AgGATA9 and AgGATA19 (r = 0.68 and r = 0.83) (Figure 8B). This suggests that these two genes may interact under abiotic stress.

4. Discussion

In this study, we identified 38 AcGATA genes in tetraploid A. calamus and 20 AgGATA genes in diploid A. gramineus. Here, we observed a doubling of GATA gene family members in tetraploid A. calamus compared to diploid A. gramineus, consistent with gene family expansion following whole-genome duplication (WGD) in plants. Some regulatory genes are preferentially retained to stabilize polyploid genomes and enhance stress adaptation [57]. The expanded GATA repertoire in A. calamus may facilitate functional diversification and ecological adaptability, potentially underpinning traits such as stress tolerance and niche expansion. Previous studies identified 30 GATA genes in Ara. thaliana [58], 24 in melons [59], 28 in eggplants [60], 58 in potatoes [61], 79 in wheat [62], and 179 in cotton [63]. Variations in the number of GATA genes across different species suggest that species evolution is shaped by multiples factors, including environmental conditions.
A phylogenetic tree and multiple sequence comparison analysis revealed that the Acorus GATA gene family can be divided into four subfamilies, I, II, III, and IV, consistent with the classification of AtGATA genes in Ara. thaliana [13]. According to the clustering relationship between the genes, we can predict the function of AcGATA or AgGATA based on the known function of AtGATA. AtGATA15-17 is involved in the chlorophyll accumulation process of Ara. thaliana [64], and we speculate that its clusters of AcGATA1, 3, 5 and AgGATA26-28 may have similar functions. For the identification of conserved motifs, we found that subfamily III contained the most conserved motifs. The multiple sequence comparison analysis showed that all the GATA proteins contain a highly conserved amino acid sequence of LGCNA, which is consistent with previous studies in other species [65].
An analysis of cis-elements revealed the existence of elements that respond to various environmental stimuli. A large number of GATA cis-elements were light-responsive elements, ABA-responsive elements, and MeJA-responsive elements in Acorus. Abscisic acid (ABA) is a key plant hormone that plays a crucial role in plant responses to abiotic stresses such as drought, salt stress, and extreme temperatures, as well as biological stresses such as pathogen infections [66,67]. Under adverse environmental conditions, ABA triggers various physiological processes, including stomatal closure, root system regulation, the organization of soil microbial communities, transcriptional and post-transcriptional gene activation, and metabolic adjustments [68,69]. Additionally, several abiotic-stress-related elements, such as those linked to drought and salt stress responses, were identified, indicating that most GATA genes are involved in stress response mechanisms. A protein interaction network analysis further demonstrated that GATA proteins interact with various proteins under abiotic stress conditions, such as bHLH, DOF, and TIFY family members. Under drought stress, PbDof08 and PbDof16 expression in Phoebe bournei was up-regulated [69]. The bHLH transcription factor SlbHLH92 up-regulates the expression of the L-CYSTEINE DESULFHYDRASE 1 (SlLCD1) gene in Solanum lycopersicum and enhances the tolerance of tomatoes to salt stress [70].
The GATA transcription factor is an evolutionarily conserved regulatory protein that plays a crucial role in the positive regulation of plant stress resistance. In this study, transcriptome sequencing and qRT-PCR experiments were conducted on plant tissues subjected to drought and salt stress. The results revealed differences in the expression levels of AgGATA genes in leaf tissues under different stress conditions, indicating that the functions of GATA gene family members in plant stress resistance may vary. Notably, AgGATA6 exhibited a strong positive response to both drought and salt stress, with high expression levels (Figure 7). Based on a phylogenetic analysis, we found that AgGATA6 clusters with AtGATA3 (Figure 1), which has been shown in previous studies to regulate the stem tip meristem, flowering and development, hormone regulation and other functions [4]. These findings suggest that AgGATA6 may mediate the responses to abiotic stress via hormonal regulation. In future studies, AgGATA6 will be overexpressed to clarify its molecular function, contributing to a deeper understanding of resistance mechanisms. Certain members of the AgGATA gene family, such as AgGATA6, may serve as promising candidates for breeding programs aimed at enhancing abiotic stress resistance.

5. Conclusions

GATA is of great value in studying the ecological significance of calamus. Based on phylogenetic and gene structure comparisons, we grouped the GATA genes into four subfamilies. Through the prediction of cis-regulatory elements in the Acorus GATA gene family, we found that these genes are predominantly controlled by light-responsive and hormone-responsive elements, playing a crucial role in various physiological responses to abiotic stresses in plants. The results of protein interaction predictions showed that GATA proteins interact with many other proteins with an anti-abiotic stress function. In addition, the transcriptome and RT-qPCR results showed that AgGATA6 was the most responsive gene under drought and salt stress. We present a comprehensive analysis that elucidates the evolutionary history and diversification of GATA transcription factors in the genus Acorus.

Supplementary Materials

The following supporting information can be downloaded at: https://www.mdpi.com/article/10.3390/horticulturae11040410/s1, Table S1a: AcGATA protein sequences used in the phylogenetic tree; Table S1b. AgGATA protein sequences used in the phylogenetic tree; Table S2. Physicochemical properties of Acorus GATA protein; Table S3. Expression profiles of AgGATA gene in leaves at different periods after drought stress (D1-3) and salt stress (S1-3).

Author Contributions

Conceptualization, Z.-J.L. and S.-P.C.; methodology, L.M.; software, L.M. and C.-Y.Z.; validation, L.M., C.-Y.Z., C.-Y.G. and M.-L.C.; formal analysis, Y.H.; investigation, M.-L.C.; resources, H.-H.F.; data curation, C.-Y.Z.; writing—original draft preparation, L.M.; writing—review and editing, L.M. and C.-Y.Z.; visualization, C.-Y.Z.; supervision, Z.-J.L. and S.-P.C.; project administration, L.M.; funding acquisition, L.M. All authors have read and agreed to the published version of the manuscript.

Funding

This research was supported by the launch of high-level talent research project (MWY2023-5-02).

Data Availability Statement

The transcriptome raw data have been deposited with the National Genomics Data Center (NGDC): BioProject ID PRJCA037124.

Acknowledgments

We acknowledge the technical support by lab staff during the conduction of lab experiments, Xiong-De Tu and Yaxuan Xin.

Conflicts of Interest

The authors declare no conflicts of interest.

References

  1. Du, B.; Haensch, R.; Alfarraj, S.; Rennenberg, H. Strategies of plants to overcome abiotic and biotic stresses. Biol. Rev. Camb. Philos. Soc. 2024, 99, 1524–1536. [Google Scholar] [CrossRef] [PubMed]
  2. Weidemüller, P.; Kholmatov, M.; Petsalaki, E.; Zaugg, J.B. Transcription factors: Bridge between cell signaling and gene regulation. Proteomics 2021, 21, e2000034. [Google Scholar] [CrossRef] [PubMed]
  3. Zhu, W.; Guo, Y.; Chen, Y.; Wu, D.; Jiang, L. Genome-wide identification, phylogenetic and expression pattern analysis of GATA family genes in Brassica napus. BMC Plant Biol. 2020, 20, 543. [Google Scholar] [CrossRef] [PubMed]
  4. Chen, Y.; Bates, D.L.; Dey, R.; Chen, P.-H.; Machado, A.C.D.; Laird-Offringa, I.A.; Rohs, R.; Chen, L. DNA Binding by GATA Transcription Factor Suggests Mechanisms of DNA Looping and Long-Range Gene Regulation. Cell Rep. 2012, 2, 1197–1206. [Google Scholar] [CrossRef]
  5. Patient, R.K.; McGhee, J.D. The GATA family (vertebrates and invertebrates). Curr. Opin. Genet. Dev. 2002, 12, 416–422. [Google Scholar] [CrossRef]
  6. Reyes, J.C.; Muro-Pastor, M.I.; Florencio, F.J. The GATA family of transcription factors in Arabidopsis and rice. Plant Physiol. 2004, 134, 1718–1732. [Google Scholar] [CrossRef]
  7. Kim, M.; Xi, H.; Park, J. Genome-wide comparative analyses of GATA transcription factors among 19 Arabidopsis ecotype genomes: Intraspecific characteristics of GATA transcription factors. PLoS ONE 2021, 16, e0252181. [Google Scholar] [CrossRef]
  8. Daniel-Vedele, F.; Caboche, M. A tobacco cDNA clone encoding a GATA-1 zinc finger protein homologous to regulators of nitrogen metabolism in fungi. Mol. Gen. Genet. 1993, 240, 365–373. [Google Scholar] [CrossRef]
  9. Chen, H.; Shao, H.; Li, K.; Zhang, D.; Fan, S.; Li, Y.; Han, M. Genome-wide identification, evolution, and expression analysis of GATA transcription factors in apple (Malus × domestica Borkh.). Gene 2017, 627, 460–472. [Google Scholar] [CrossRef]
  10. Zhang, C.; Hou, Y.; Hao, Q.; Chen, H.; Chen, L.; Yuan, S.; Shan, Z.; Zhang, X.; Yang, Z.; Qiu, D.; et al. Genome-wide survey of the soybean GATA transcription factor gene family and expression analysis under low nitrogen stress. PLoS ONE 2015, 10, e0125174. [Google Scholar] [CrossRef]
  11. An, Y.; Zhou, Y.; Han, X.; Shen, C.; Wang, S.; Liu, C.; Yin, W.; Xia, X. The GATA transcription factor GNC plays an important role in photosynthesis and growth in poplar. J. Exp. Bot. 2020, 71, 1969–1984. [Google Scholar] [CrossRef] [PubMed]
  12. Manfield, I.W.; Devlin, P.F.; Jen, C.H.; Westhead, D.R.; Gilmartin, P.M. Conservation, convergence, and divergence of light-responsive, circadian-regulated, and tissue-specific expression patterns during evolution of the Arabidopsis GATA gene family. Plant Physiol. 2007, 143, 941–958. [Google Scholar] [CrossRef] [PubMed]
  13. Bi, Y.M.; Zhang, Y.; Signorelli, T.; Zhao, R.; Zhu, T.; Rothstein, S. Genetic analysis of Arabidopsis GATA transcription factor gene family reveals a nitrate-inducible member important for chlorophyll synthesis and glucose sensitivity. Plant J. 2005, 44, 680–692. [Google Scholar] [CrossRef] [PubMed]
  14. Chiang, Y.H.; Zubo, Y.O.; Tapken, W.; Kim, H.J.; Lavanway, A.M.; Howard, L.; Pilon, M.; Kieber, J.J.; Schaller, G.E. Functional characterization of the GATA transcription factors GNC and CGA1 reveals their key role in chloroplast development, growth, and division in Arabidopsis. Plant Physiol. 2012, 160, 332–348. [Google Scholar] [CrossRef]
  15. Zhao, Y.; Medrano, L.; Ohashi, K.; Fletcher, J.C.; Yu, H.; Sakai, H.; Meyerowitz, E.M. HANABA TARANU is a GATA transcription factor that regulates shoot apical meristem and flower development in Arabidopsis. Plant Cell 2004, 16, 2586–2600. [Google Scholar] [CrossRef]
  16. Zhang, K.; Jia, L.; Yang, D.; Hu, Y.; Njogu, M.K.; Wang, P.; Lu, X.; Yan, C. Genome-Wide Identification, Phylogenetic and Expression Pattern Analysis of GATA Family Genes in Cucumber (Cucumis sativus L.). Plants 2021, 10, 1626. [Google Scholar] [CrossRef]
  17. Zhang, X.; Ma, J.; Yang, S.; Yao, W.; Zhang, N.; Hao, X.; Xu, W. Analysis of GATA transcription factors and their expression patterns under abiotic stress in grapevine (Vitis vinifera L.). BMC Plant Biol. 2023, 23, 611. [Google Scholar] [CrossRef]
  18. Gupta, P.; Nutan, K.K.; Singla-Pareek, S.L.; Pareek, A. Abiotic Stresses Cause Differential Regulation of Alternative Splice Forms of GATA Transcription Factor in Rice. Front. Plant Sci. 2017, 8, 1944. [Google Scholar] [CrossRef]
  19. Ravindran, P.; Verma, V.; Stamm, P.; Kumar, P.P. A Novel RGL2–DOF6 Complex Contributes to Primary Seed Dormancy in Arabidopsis thaliana by Regulating a GATA Transcription Factor. Mol. Plant 2017, 10, 1307–1320. [Google Scholar] [CrossRef]
  20. Hudson, D.; Guevara, D.R.; Hand, A.J.; Xu, Z.; Hao, L.; Chen, X.; Zhu, T.; Bi, Y.-M.; Rothstein, S.J. Rice Cytokinin GATA Transcription Factor1 Regulates Chloroplast Development and Plant Architecture. Plant Physiol. 2013, 162, 132–144. [Google Scholar] [CrossRef]
  21. Lu, G.; Casaretto, J.A.; Ying, S.; Mahmood, K.; Liu, F.; Bi, Y.M.; Rothstein, S.J. Overexpression of OsGATA12 regulates chlorophyll content, delays plant senescence and improves rice yield under high density planting. Plant Mol. Biol. 2017, 94, 215–227. [Google Scholar] [CrossRef] [PubMed]
  22. Zhang, X.B.; Liu, P.; Yang, Y.S.; Chen, W.R. Phytoremediation of urban wastewater by model wetlands with ornamental hydrophytes. J. Environ. Sci. 2007, 19, 902–909. [Google Scholar] [CrossRef] [PubMed]
  23. Shu, H.; Zhang, S.; Lei, Q.; Zhou, J.; Ji, Y.; Luo, B.-S.; Hong, L.; Li, F.; Liu, B.; Long, C. Ethnobotany of Acorus in China. Acta Soc. Bot. Pol. 2018, 87, 1–14. [Google Scholar] [CrossRef]
  24. Cheng, Z.; Shu, H.; Zhang, S.; Luo, B.; Gu, R.; Zhang, R.; Ji, Y.; Li, F.; Long, C. From Folk Taxonomy to Species Confirmation of Acorus (Acoraceae): Evidences Based on Phylogenetic and Metabolomic Analyses. Front. Plant Sci. 2020, 11, 965. [Google Scholar] [CrossRef]
  25. Zhang, X.; Wei, D.; Hu, Z.; Zhang, A.; Li, F.; Zhang, J.; Wu, Y.; Tang, Y. Tolerance and physiological responses of sweet flag (Acorus calamus L.) under nitrite stress during wastewater treatment. Ecol. Eng. 2018, 122, 107–111. [Google Scholar] [CrossRef]
  26. Zhang, S.H.; Zhang, S.Y.; Li, G. Acorus calamus root extracts to control harmful cyanobacteria blooms. Ecol. Eng. 2016, 94, 95–101. [Google Scholar] [CrossRef]
  27. Ma, Y.-Y.; Chen, Y.-T.; Hu, X.-X.; Ma, Q.-R.; Feng, T.-C.; Feng, G.-L.; Ma, D. The 2022 record-breaking high temperature in China: Sub-seasonal stepwise enhanced characteristics, possible causes and its predictability. Adv. Clim. Change Res. 2023, 14, 651–659. [Google Scholar] [CrossRef]
  28. Haj-Amor, Z.; Araya, T.; Kim, D.G.; Bouri, S.; Lee, J.; Ghiloufi, W.; Yang, Y.; Kang, H.; Jhariya, M.K.; Banerjee, A.; et al. Soil salinity and its associated effects on soil microorganisms, greenhouse gas emissions, crop yield, biodiversity and desertification: A review. Sci. Total Environ. 2022, 843, 156946. [Google Scholar] [CrossRef]
  29. Singh, A. Soil salinization management for sustainable development: A review. J. Environ. Manag. 2021, 277, 111383. [Google Scholar] [CrossRef]
  30. Khojasteh, D.; Haghani, M.; Nicholls, R.J.; Moftakhari, H.; Sadat-Noori, M.; Mach, K.J.; Fagherazzi, S.; Vafeidis, A.T.; Barbier, E.; Shamsipour, A.; et al. The evolving landscape of sea-level rise science from 1990 to 2021. Commun. Earth Environ. 2023, 4, 257. [Google Scholar] [CrossRef]
  31. Ma, L.; Liu, K.-W.; Li, Z.; Hsiao, Y.-Y.; Qi, Y.; Fu, T.; Tang, G.-D.; Zhang, D.; Sun, W.-H.; Liu, D.-K.; et al. Diploid and tetraploid genomes of Acorus and the evolution of monocots. Nat. Commun. 2023, 14, 3661. [Google Scholar] [CrossRef] [PubMed]
  32. Swarbreck, D.; Wilks, C.; Lamesch, P.; Berardini, T.Z.; Garcia-Hernandez, M.; Foerster, H.; Li, D.; Meyer, T.; Muller, R.; Ploetz, L.; et al. The Arabidopsis Information Resource (TAIR): Gene structure and function annotation. Nucleic Acids Res. 2008, 36, D1009–D1014. [Google Scholar] [CrossRef] [PubMed]
  33. Chen, C.; Wu, Y.; Li, J.; Wang, X.; Zeng, Z.; Xu, J.; Liu, Y.; Feng, J.; Chen, H.; He, Y.; et al. TBtools-II: A “one for all, all for one” bioinformatics platform for biological big-data mining. Mol. Plant 2023, 16, 1733–1742. [Google Scholar] [CrossRef] [PubMed]
  34. Potter, S.C.; Luciani, A.; Eddy, S.R.; Park, Y.; Lopez, R.; Finn, R.D. HMMER web server: 2018 update. Nucleic Acids Res. 2018, 46, W200–W204. [Google Scholar] [CrossRef]
  35. Katoh, K.; Standley, D.M. MAFFT multiple sequence alignment software version 7: Improvements in performance and usability. Mol. Biol. Evol. 2013, 30, 772–780. [Google Scholar] [CrossRef]
  36. Capella-Gutierrez, S.; Silla-Martinez, J.M.; Gabaldon, T. Trimal: A tool for automated alignment trimming in large-scale phylogenetic analyses. Bioinformatics 2009, 25, 1972–1973. [Google Scholar] [CrossRef]
  37. Nguyen, L.T.; Schmidt, H.A.; von Haeseler, A.; Minh, B.Q. IQ-TREE: A fast and effective stochastic algorithm for estimating maximum-likelihood phylogenies. Mol. Biol. Evol. 2015, 32, 268–274. [Google Scholar] [CrossRef]
  38. Kalyaanamoorthy, S.; Minh, B.Q.; Wong, T.K.F.; von Haeseler, A.; Jermiin, L.S. ModelFinder: Fast model selection for accurate phylogenetic estimates. Nat. Methods. 2017, 14, 587–589. [Google Scholar] [CrossRef]
  39. Letunic, I.; Bork, P. Interactive Tree of Life (iTOL) v6: Recent updates to the phylogenetic tree display and annotation tool. Nucleic Acids Res. 2024, 52, W78–W82. [Google Scholar] [CrossRef]
  40. Bailey, T.L.; Johnson, J.; Grant, C.E.; Noble, W.S. The MEME Suite. Nucleic Acids Res. 2015, 43, W39–W49. [Google Scholar] [CrossRef]
  41. Robert, X.; Gouet, P. Deciphering key features in protein structures with the new ENDscript server. Nucleic Acids Res. 2014, 42, W320–W324. [Google Scholar] [CrossRef] [PubMed]
  42. Wang, Y.; Tang, H.; Debarry, J.D.; Tan, X.; Li, J.; Wang, X.; Lee, T.H.; Jin, H.; Marler, B.; Guo, H.; et al. MCScanX: A toolkit for detection and evolutionary analysis of gene synteny and collinearity. Nucleic Acids Res. 2012, 40, e49. [Google Scholar] [CrossRef] [PubMed]
  43. Lescot, M.; Déhais, P.; Thijs, G.; Marchal, K.; Moreau, Y.; Van de Peer, Y.; Rouzé, P.; Rombauts, S. PlantCARE, a database of plant cis-acting regulatory elements and a portal to tools for in silico analysis of promoter sequences. Nucleic Acids Res. 2002, 30, 325–327. [Google Scholar] [CrossRef] [PubMed]
  44. Szklarczyk, D.; Kirsch, R.; Koutrouli, M.; Nastou, K.; Mehryary, F.; Hachilif, R.; Gable, A.L.; Fang, T.; Doncheva, N.T.; Pyysalo, S.; et al. The STRING database in 2023: Protein-protein association networks and functional enrichment analyses for any sequenced genome of interest. Nucleic Acids Res. 2023, 51, D638–D646. [Google Scholar] [CrossRef]
  45. Otasek, D.; Morris, J.H.; Bouças, J.; Pico, A.R.; Demchak, B. Cytoscape Automation: Empowering workflow-based network analysis. Genome Biol. 2019, 20, 185. [Google Scholar] [CrossRef]
  46. Benmrid, B.; Ghoulam, C.; Ammar, I.; Nkir, D.; Saidi, R.; Staropoli, A.; Iacomino, G.; ELhajjami, E.; Cheto, S.; Geistlinger, J.; et al. Drought-tolerant rhizobacteria with predicted functional traits enhanced wheat growth and P uptake under moderate drought and low P-availability. Microbiol. Res. 2024, 285, 127795. [Google Scholar] [CrossRef]
  47. Cheng, S.; Fan, S.; Yang, C.; Hu, W.; Liu, F. Proteomics revealed novel functions and drought tolerance of Arabidopsis thaliana protein kinase ATG1. BMC Biol. 2025, 23, 48. [Google Scholar] [CrossRef]
  48. Lu, X.; Zhou, X.; Cao, Y.; Zhou, M.; McNeil, D.; Liang, S.; Yang, C. RNA-seq Analysis of Cold Drought Responsive Transcriptomes of Zea mays ssp. mexicana, L. Front. Plant Sci. 2017, 8, 136. [Google Scholar] [CrossRef]
  49. Sha, M.; Fu, X.; Bai, R.; Zhong, Z.; Jiang, H.; Li, F.; Yang, S. YOLOv8-licorice: A lightweight salt-resistance detection method for licorice based on seed germination state. Front. Plant Sci. 2024, 15, 1474321. [Google Scholar] [CrossRef]
  50. Chen, S.; Zhou, Y.; Chen, Y.; Gu, J. fastp: An ultra-fast all-in-one FASTQ preprocessor. Bioinformatics 2018, 34, i884–i890. [Google Scholar] [CrossRef]
  51. Kim, D.; Paggi, J.M.; Park, C.; Bennett, C.; Salzberg, S.L. Graph-based genome alignment and genotyping with HISAT2 and HISAT-genotype. Nat Biotechnol. 2019, 37, 907–915. [Google Scholar] [CrossRef] [PubMed]
  52. Lalitha, S. Primer premier 5. Biotechnol. Softw. Int. Rep. 2000, 1, 270–272. [Google Scholar]
  53. Livak, K.J.; Schmittgen, T.D. Analysis of relative gene expression data using real-time quantitative PCR and the 2(-Delta Delta C(T)) Method. Methods 2001, 25, 402–408. [Google Scholar] [CrossRef]
  54. Rai, N.; Rai, S.P.; Sarma, B.K. Chickpea defense against dual stresses of salt and Fusarium wilt is enhanced through selected bHLH transcription factors carrying the bHLH-MYC_N domain. Plant Physiol. Biochem. 2025, 218, 109314. [Google Scholar] [CrossRef]
  55. Li, M.; Fan, D.; Wen, Z.; Meng, J.; Li, P.; Cheng, T.; Zhang, Q.; Sun, L. Genome-wide identification of the Dof gene family: How it plays a part in mediating cold stress response in Prunus mume. Plant Physiol. Biochem. 2024, 217, 109215. [Google Scholar] [CrossRef]
  56. Chen, Q.; Dai, R.; Shuang, S.; Zhang, Y.; Huo, X.; Shi, F.; Zhang, Z. Genome-wide investigation of the TIFY transcription factors in alfalfa (Medicago sativa L.): Identification, analysis, and expression. BMC Plant Biol. 2024, 24, 840. [Google Scholar] [CrossRef]
  57. Duan, Z.; Zhang, Y.; Tu, J.; Shen, J.; Yi, B.; Fu, T.; Dai, C.; Ma, C. The Brassica napus GATA transcription factor BnA5.ZML1 is a stigma compatibility factor. J. Integr. Plant Biol. 2020, 62, 1112–1131. [Google Scholar] [CrossRef]
  58. Schwechheimer, C.; Schröder, P.M.; Blaby-Haas, C.E. Plant GATA Factors: Their Biology, Phylogeny, and Phylogenomics. Annu. Rev. Plant Biol. 2022, 73, 123–148. [Google Scholar] [CrossRef]
  59. Zheng, L.; Tang, L.; Li, J. Genome-wide identification of the GATA gene family in melon (Cucumis melo) and analysis of their expression characteristics under biotic and abiotic stresses. Front. Plant Sci. 2024, 15, 1462924. [Google Scholar] [CrossRef]
  60. Wang, Y.; Li, X.; Mo, Y.; Jiang, C.; Zhou, Y.; Hu, J.; Zhang, Y.; Lv, J.; Zhao, K.; Lu, Z. Identification and expression profiling of SmGATA genes family involved in response to light and phytohormones in eggplant. Front. Plant Sci. 2024, 15, 1415921. [Google Scholar] [CrossRef]
  61. Yu, R.; Chang, Y.; Chen, H.; Feng, J.; Wang, H.; Tian, T.; Song, Y.; Gao, G. Genome-wide identification of the GATA gene family in potato (Solanum tuberosum L.) and expression analysis. J. Plant Biochem. Biotechnol. 2022, 31, 37–48. [Google Scholar] [CrossRef]
  62. Feng, X.; Yu, Q.; Zeng, J.; He, X.; Liu, W. Genome-wide identification and characterization of GATA family genes in wheat. BMC Plant Biol. 2022, 22, 372. [Google Scholar] [CrossRef] [PubMed]
  63. Zhang, Z.; Zou, X.; Huang, Z.; Fan, S.; Qun, G.; Liu, A.; Gong, J.; Li, J.; Gong, W.; Shi, Y.; et al. Genome-wide identification and analysis of the evolution and expression patterns of the GATA transcription factors in three species of Gossypium genus. Gene 2019, 680, 72–83. [Google Scholar] [CrossRef] [PubMed]
  64. Ranftl, Q.L.; Bastakis, E.; Klermund, C.; Schwechheimer, C. LLM-Domain Containing B-GATA Factors Control Different Aspects of Cytokinin-Regulated Development in Arabidopsis thaliana. Plant Physiol. 2016, 170, 2295–2311. [Google Scholar] [CrossRef]
  65. Saidi, A.; Hajibarat, Z.; Hajibarat, Z. Phylogeny, gene structure and GATA genes expression in different tissues of solanaceae species. Biocatal. Agric. Biotechnol. 2021, 35, 102015. [Google Scholar] [CrossRef]
  66. Dar, N.A.; Amin, I.; Wani, W.; Wani, S.A.; Shikari, A.B.; Wani, S.H.; Masoodi, K.Z. Abscisic acid: A key regulator of abiotic stress tolerance in plants. Plant Gene 2017, 11, 106–111. [Google Scholar] [CrossRef]
  67. Chaffai, R.; Ganesan, M.; Cherif, A. Plant Hormones and Their Regulatory Roles in Abiotic Stress Response. In Plant Adaptation to Abiotic Stress: From Signaling Pathways and Microbiomes to Molecular Mechanisms; Springer Nature: Singapore, 2024; pp. 249–274. [Google Scholar]
  68. Muhammad Aslam, M.; Waseem, M.; Jakada, B.H.; Okal, E.J.; Lei, Z.; Saqib, H.S.A.; Yuan, W.; Xu, W.; Zhang, Q. Mechanisms of Abscisic Acid-Mediated Drought Stress Responses in Plants. Int. J. Mol. Sci. 2022, 23, 1084. [Google Scholar] [CrossRef]
  69. Zheng, K.; Lv, M.; Qian, J.; Lian, Y.; Liu, R.; Huo, S.; Rehman, O.U.; Lin, Q.; Zhou, Z.; Liu, X.; et al. Identification and Characterization of the DOF Gene Family in Phoebe bournei and Its Role in Abiotic Stress-Drought, Heat and Light Stress. Int. J. Mol. Sci. 2024, 25, 11147. [Google Scholar] [CrossRef]
  70. Lu, S.; Sun, Y.; Liu, X.; Wang, F.; Luan, S.; Wang, H. The SlbHLH92 transcription factor enhances salt stress resilience by fine-tuning hydrogen sulfide biosynthesis in tomato. Int. J. Biol. Macromol. 2024, 282 Pt 5, 137294. [Google Scholar] [CrossRef]
Figure 1. ML phylogenetic tree of a member of the GATA genes of Ara. thaliana, A. calamus and A. gramineus. Upper-left corner shows the phylogenetic topology structure. The four branches of the evolutionary tree represent these four groups by color, and are identified by I, II, III, and IV, representing the four subfamilies of GATA. The three different colored squares represent different species. See the legend at the bottom left.
Horticulturae 11 00410 g001
Figure 2. Phylogenetic tree, conserved motif, and domain analysis of Acorus GATA family members. (A) ML phylogenetic trees of AgGATA and AcGATA, with different colors representing distinct subfamilies (from top to bottom: Subfamily II, IV, III and I). (B) Conserved protein motif. (C) Chromosomal distribution of the GATA conserved domain. Protein length can be estimated according to the scale bar below. Motif and domain legends are shown on the right.
Horticulturae 11 00410 g002
Figure 3. Multiple sequence alignment of AcGATA and AgGATA protein sequences. Yellow highlights indicate conserved residues (i.e., amino acid sequences identical in both AcGATA and AgGATA proteins).
Horticulturae 11 00410 g003
Figure 4. Chromosome localization and interspecific collinearity analysis of Acorus. (A) AcGATA chromosome map. (B) AgGATA chromosome mapping. (C) Interspecific collinearity analysis of A. calamus and A. gramineus. The pink line highlights the replication relationship of GATAs.
Horticulturae 11 00410 g004
Figure 5. Cis-element distribution prediction. (A) Cis-element distribution prediction heat map of 2000 bp promoters upstream of diploid A. gramineus coding sequence, and pie chart of promoter classification proportion on the right. (B) Cis-element distribution prediction heat map of 2000 bp promoters upstream of tetraploid A. calamus coding sequence, and pie chart of promoter classification proportion on the right. Different colors represent different categories of promoters, as shown in the legend (below the pie chart). The percentages labeled below the cis-element heat map represent the proportion of each cis-element shared within the AcGATAs or AgGATAs.
Horticulturae 11 00410 g005
Figure 6. Protein interaction prediction diagram of AcGATAs and AgGATAs. Each circle represents a protein. The right circle is AcGATAs or AgGATAs, and the left circle is other proteins that produce interactions. The color of the protein represents the intensity of the interaction, and the darker the color, the stronger the interaction. The blue line indicates two proteins interacting.
Horticulturae 11 00410 g006
Figure 7. Analysis of expression patterns of AgGATA family members. Expression levels were normalized on a row average, graded from blue (low expression) to red (high expression). CK represents the control group, the period during which no treatment was performed. D1, D2, and D3 represent 3 h, 9 h, and 24 h after drought stress treatment, respectively. S1, S2, and S3 indicate 3 h, 9 h, and 24 h after high salt stress treatment, respectively.
Horticulturae 11 00410 g007
Figure 8. qRT-PCR analysis of AgGATA genes in leaves at different times after stress. (A) Fluorescence quantitative histogram of different genes at different periods; CK represents the control group that was not subjected to stress treatment, the blue column represents drought stress, and the green column represents salt stress. Black asterisks indicate the p-values from the significance test (* p < 0.05, ** p < 0.01). (B) Correlation analysis of expression levels among seven AgGATA genes; correlation coefficients are marked with numbers. They can be estimated using the right bar.
Horticulturae 11 00410 g008
Table 1. The primers of AgGATA genes.
Gene IDGene NamePrimer NameSequence
KAK1280067.1AgGATA11-FGGAGGTGGAGCGAACTTGAACTG
AgGATA11-RAGCATGGATGAATCCGCAAGAGAG
KAK1277125.1AgGATA33-FGGAGAAGAAGAGCTGCTCGGATTG
AgGATA33-RCACAGAGACTTTGGCCCAGATGG
KAK1276896.1AgGATA55-FGAACTCCAACCACCACGATGACTG
AgGATA55-RCTCTGATCCATCCATGCCGTTGAC
KAK1272898.1AgGATA66-FGTCATCCTCATCCACCACCACAAC
AgGATA66-RGCCTTGGCTTCCTCTGCTTCTTC
KAK1268328.1AgGATA99-FAACTTGAACCGCCACGATGACTG
AgGATA99-RATCCGTCCACGCCGTCCATC
KAK1260277.1AgGATA1919-FATTGCGAGGCGGAGGAGACG
AgGATA1919-RCCGGCCCGACTTATACCTGACC
KAK1258291.1AgGATA2020-FCCGATCAGAGTCTGCTCAGATTGC
AgGATA2020-RGCCCTTCTCGCCTTCCTTTGTC
KAK1276548.1AgACT1ACT-FGCTTCTTCCATCGTGTCTCGTCTC
AgACT1ACT-RTGTCCTTCCCAGTCCCTTGAGTG
Disclaimer/Publisher’s Note: The statements, opinions and data contained in all publications are solely those of the individual author(s) and contributor(s) and not of MDPI and/or the editor(s). MDPI and/or the editor(s) disclaim responsibility for any injury to people or property resulting from any ideas, methods, instructions or products referred to in the content.

