Abstract
Vegetable production primarily relies on the conventional tillage system (CTS), which leads to soil degradation through erosion and reduced soil health. The use of no-tillage vegetable systems (NTVS) aims to mitigate these issues; however, information about the impact of this management system on soil health and greenhouse gas (GHG) emissions remains limited. Thus, the objective of this study was to conduct an on-farm evaluation of the effects of no-tillage and cover crop use on soil C and N contents and stocks, soil bulk density (SD), mean geometric diameter (MGD) of aggregates, soil temperature, volumetric soil moisture (VM), plant yield, and GHG emissions in cauliflower production under NTVS compared to CTS in a subtropical ecosystem in southeastern Brazil. Chemical and physical properties were assessed at depths of 0–5, 5–10, and 10–30 cm. GHG emissions, particularly nitrous oxide (N2O), carbon dioxide (CO2), and methane (CH4) were measured using closed static chambers and gas chromatography. NTVS with cover crop mixes had higher yield than CTS without cover crops (25.1 and 18.4 Mg ha−1, respectively). NTVS exhibited increased MGD and VM and reduced SD. Soil temperature in the 0–5 cm layer was lower in NTVS than in CTS. Soil C and N stocks were higher in NTVS, but high N2O emissions offset this advantage compared to CTS. Overall, NTVS emitted more CO2 and N2O than CTS, while both systems showed soil CH4 uptake. NTVS maintained sufficient carbon equivalent reserves (0–30 cm) to offset GHG emissions, making it a viable alternative for plant yield and soil quality; however, its environmental impact on GHG emissions requires further attention.
1. Introduction
Cauliflower (Brassica oleracea var. botrytis) is a prominent crop produced in the Brazilian subtropics, where vegetables are predominantly grown in smallholder farms [1]. Despite not being one of the world’s largest cauliflower-producing countries, Brazil has considerable production, particularly in the Southeast and South regions. The domestic cauliflower production was 140,067 Mg, spread across more than 19,646 agricultural properties. The largest producing states include São Paulo (36,368 Mg), Rio de Janeiro (36,219 Mg), Paraná (17,182 Mg), Santa Catarina (12,569 Mg), and Minas Gerais (12,418 Mg) [2].
Vegetables are predominantly produced under the conventional soil tillage system (CTS), which involves intense soil disturbance due to frequent plowing and harrowing. After medium- to long-term adoption, CTS reduces soil organic matter, which negatively affects soil chemical, physical, and biological properties, and leads to lower yields [3,4,5]. This intensive soil disturbance raises concerns about the sustainability of conventional vegetable production systems, particularly in regions with high rainfall and temperatures, which increase soil biological activity [2,3,4].
The conversion of areas under CTS to no-tillage vegetable system (NTVS) has been adopted as a sustainable alternative to mitigate these impacts [4,6]. NTVS minimizes soil disturbance, restricting it to planting rows, and incorporates cover crops to produce biomass that remains on the soil surface. This management approach improves soil fertility, reduces compaction, and enhances crop resilience to water and temperature stress, while mitigating greenhouse gas (GHG) emissions [7,8,9]. However, although NTVS improves soil’s physical, chemical, and biological properties [3,4,5,10], the high biomass produced by cover crops can increase GHG emissions [11,12,13,14].
Cover crops, particularly legumes, influence nitrous oxide (N2O) emissions through biological nitrogen fixation, which enhances carbon sequestration but also intensifies organic matter mineralization and denitrification, resulting in higher N2O emissions [15,16,17].
International studies have shown that global warming can intensify greenhouse gas (GHG) fluxes in agricultural areas, but such emissions can be significantly modulated by soil management practices. A meta-analysis conducted by the authors demonstrated that the use of conservation practices, such as no-tillage and cover cropping, can mitigate the effects of warming on GHG emissions in different cropping systems worldwide, reinforcing the importance of adopting sustainable strategies in agricultural environments sensitive to climate change [18].
In this context, the proposed hypothesis was that NTVS increases soil C and N stocks by adding cover crop residues and using no tillage, leading to higher cauliflower yields and lower GHG emissions compared to CTS. Thus, the objective of this study was to conduct an on-farm evaluation of the effects of no-tillage and cover crop use on soil C and N contents and stocks, soil bulk density (SD), mean geometric diameter (MGD) of aggregates, soil temperature, volumetric soil moisture, plant yield, and GHG emissions in cauliflower production under NTVS compared to CTS in a subtropical ecosystem in southeastern Brazil.
2. Materials and Methods
2.1. Site Characterization
The experiment was conducted from November 2021 to January 2022 on a farm recognized as a technical reference area in vegetable production, located in Angelina, Southern Brazil (27°36′05.8″ S, 49°04′15.7″ W, 450 m altitude). The climate is classified as Cfa, warm and temperate, according to the Köppen classification [19], with a mean annual temperature of 17.9 °C and a mean annual rainfall depth of 1642 mm. The soil was classified as a Typic Dystrudept [20] with a clay texture, consisting of 440 g kg−1 clay, 190 g kg−1 sand, and 370 g kg−1 silt, in the 0–20 cm layer.
The experimental area has been cultivated with cauliflower, broccoli, and cabbage (Brassica oleracea var. botrytis, B. oleracea var. italica, B. oleracea var. capitata) in CTS for approximately 40 years. According to local farmers, the CTS included soil plowing at a depth of 20 cm, harrowing after each vegetable crop, and frequent use of a rotary hoe to counteract soil compaction. Eleven years before the experiment setup, part of the CTS area was converted into NTVS with cauliflower and pumpkin (Cucurbita maxima) crops. The tillage in NTVS was restricted to the planting line, leaving the rest of the area without any soil disturbance, and cover crops were grown before cauliflower. Over the last six years, cover crop mixes of black oats (Avena strigosa), ryegrass (Lolium multiflorum), barley (Bromus catharticus), and vetch (Vicia sativa) were grown in the winter. Velvet bean (Mucuna pruriens), millet (Pennisetum americanum), and plantain signalgrass (Urochloa plantaginea) were grown in the summer. Seeds of winter species were broadcast on the soil surface, using 100 kg ha−1 of oats, 15 kg ha−1 of ryegrass, and 15 kg ha−1 of vetch. Barley grows naturally, depending on the seed bank in the area. Velvet bean was the first cover crop sown in the summer, using three seeds per row (15 kg ha−1), with a spacing of 1.0 m × 1.0 m between rows and a depth of 3 cm. After twenty days, 40 kg ha−1 of millet was sown. Plantain signalgrass grows naturally, along with millet, depending on the seed bank in the area and environmental conditions. The cover crop mixes produced 17 to 18 Mg ha−1 year−1 of total dry weight, adding winter and summer yields [6].
The winter cover crops were rolled down with a knife roller prior to cauliflower planting. Furrows were opened using specialized equipment, and the seedlings were planted manually, with a spacing of 0.8 m between rows and 0.6 m between plants in both treatments (CTS and NTVS). The soil was fertilized using a 15-00-15 N-P-K formulation, based on regional recommendations for cauliflower [21]. Seedlings were transplanted in November, and plants were manually harvested in January. Summer cover crops were sown after harvesting. The areas in CTS and NTVS were arranged side by side, with similar relief and soil conditions, varying only in the management system. Each area (NTVS and CTS) covered 40 m2, and each treatment was divided into five plots (8 m2), comprising five pseudo-repetitions for both management systems (Figure 1).
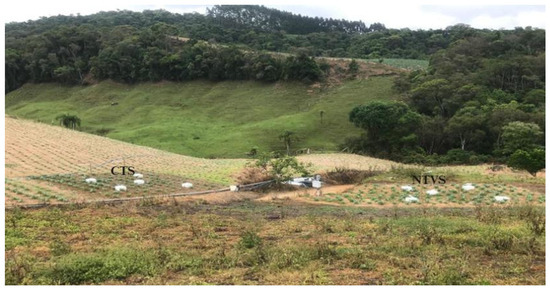
Figure 1.
Experimental area. White boxes on the ground are static chambers for monitoring greenhouse gas (GHG) emissions. CTS = conventional soil tillage system, without cover crops; NTVS = no-tillage vegetable production system using a mix of winter (black oat, ryegrass, vetch, and barley) and summer (millet, velvet bean, and signalgrass) cover crops before cauliflower transplanting.
Before installing the static chambers for monitoring GHG emissions, soil samples of the 0–5, 5–10, and 10–30 cm layers were collected for chemical and physical characterization as described by [22,23]. Each pseudo-replicate consisted of three simple samples, collected at each depth (0–5, 5–10, and 10–30 cm) in each 8 m2 plot. Fifteen replicates were collected per treatment and per depth, with a composite sample being taken after every three pseudo-replicates per plot. In the week prior to collecting soil samples and setting up the experiment, the CTS area underwent plowing and harrowing, and a rotary hoe was used to prepare the soil for planting cauliflower.
Climate data were recorded during the experimental period using a meteorological station installed in the area (Figure 2). The highest temperature was 24.5 °C on 3 January 2022, while the lowest was 15.8 °C on 9 December 2021. Sprinkler irrigation was applied in both treatments during periods without rainfall to meet the crop’s water requirements (Figure 2).
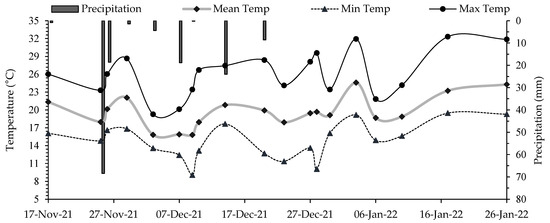
Figure 2.
Climate data recorded throughout the cauliflower cycle. Mean Temp = mean temperature; Min Temp = minimum temperature; Max Temp = maximum temperature. Data were continuously recorded by the meteorological station installed at the experimental site.
2.2. Measured Variables
2.2.1. Cauliflower Yield
Cauliflower yield was evaluated by manually harvesting six plants from each 8 m2 plot in January. After removing the leaves, inflorescence fresh weight was quantified, and yield was expressed in Mg ha−1.
2.2.2. Air Sampling, GHG Analysis, and Calculations
Air samples for GHG analysis were collected using the closed static chamber method [24]. A rectangular 0.5 × 0.4 m metal base was previously fixed and inserted into the soil to a depth of 0.05 m (Figure 3) in each pseudo-replication of the two management systems (Figure 1). The bases remained in the plots throughout the evaluation period. The chambers were mounted onto the metal base during the sample collection.
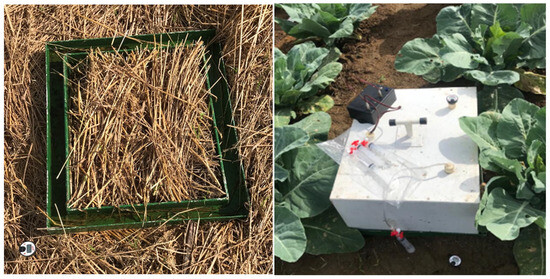
Figure 3.
Metal base inserted into the soil in the no-tillage system (left), and the static chamber mounted onto it to collect air samples for monitoring greenhouse gas emissions in the conventional system (right). The images show the winter cover crop straw before cauliflower planting and the soil without cover in the conventional system.
The chambers (0.50 m length, 0.4 m width, and 0.25 m height) (Figure 3) were equipped with two 12-volt fans connected to an external battery, which were activated 30 s prior to air sampling to homogenize the air inside the chamber. During gas collection, the chambers were sealed by filling their channels with water, isolating the internal atmosphere from the external environment. Collections were performed one day before each scheduled N-P-K fertilizer application, on the application day, and after the fertilizer application (Table 1). Cauliflower seedlings were planted on 17 November 2021, and the crop cycle comprised 71 days (Table 1).

Table 1.
Greenhouse gas (GHG) sampling schedule during the cauliflower growth cycle.
The chamber bases were constructed from 5 mm carbon steel, which is resistant to the pressure required to insert them into the soil. This material was welded, forming a 4 cm-wide and 3 cm-high channel. In addition, a 5 cm base was centered below the channel for better fixation when inserted into the soil and delimitation of the soil area to be preserved during the experiment. The bases were installed one week before starting the experiment and remained in the field until the samplings ended to avoid soil disturbances. Ten bases were installed, one in each plot. Four gas collections were performed on each evaluation date, at 0, 15, 30, and 45 min. N2O, CO2, and CH4 fluxes were measured, starting seven days before the first nitrogen fertilizer application and continuing until the cauliflower harvest, spanning a 71-day field experiment (Table 1). During this period, 19 GHG samplings were performed between 9:00 h and 11:00 h, as this is the standard time for representing the average CO2 and N2O fluxes, which tend to show lower variability throughout the day, unlike CH4, which can be more influenced by diurnal fluctuations [11].
The collection procedure involved homogenizing the air inside the chamber by activating an electric fan for 30 s prior to air sampling. Subsequently, a syringe plunger was moved three consecutive times to flush all the air accumulated in the catheter, and drawn to the 20 mL mark; the catheter and syringe valves were immediately closed. The syringes were placed in a thermal box and transported to the laboratory to transfer the contents to 12 mL exetainer vials, where the gases remained until analysis by gas chromatography. The internal temperature of the chamber was monitored during the collection period using a digital thermometer. Soil temperature was measured at the first five centimeters depth using a digital thermometer placed into the soil next to the static chamber. N2O, CO2, and CH4 concentrations were analyzed by gas chromatography, using a device (Shimadzu GC 2014, Greenhouse model) consisting of an electron capture detector for determining N2O and a flame ionization detector for determining CO2 and CH4. The concentrations were measured using a flame ionization detector equipped with a methanizer, which converts CO2 into CH4 for detection. The gases were separated in a packed column at a temperature of 80 °C, using nitrogen (N2) as the carrier gas. The daily fluxes of N2O, CO2, and CH4 were calculated considering the linear relationship between the gas concentration in the chamber and the time between its closure and collection, according to Equation (1), adapted from [25]:
where
- Gas flux is the flux of N2O and CH4 (g ha−1 day−1) or CO2 (kg ha−1 day−1);
- ∆(gas) is the variation in the gas concentration (N2O nmol mol−1; CH4 µmol mol−1; or CO2 µmol mol−1) inside the chamber;
- ∆t is the incubation period (min);
- P is the atmospheric pressure inside the chamber (1 atm);
- V is the chamber volume (L);
- R is the universal gas constant (0.082 atm L mol−1 K−1);
- T is the chamber internal temperature (K);
- M is the gas molecular weight (g mol−1);
- A is the soil area occupied by the chamber (m2);
- Element/Gas is the ratio of the element atomic mass to the gas molecular mass. In this case, 28/44 for N2O, 12/16 for CH4 and 12/44 for CO2.
Gas fluxes were calculated as the mean of five replicates. The mean flux between two consecutive sampling events was obtained by multiplying the resulting value by the time interval (in days) between samplings. Linear interpolation was applied to estimate daily fluxes between sampling dates, ensuring a more accurate representation of emissions over time. Cumulative emissions of N-N2O, C-CH4, and C-CO2 were calculated using trapezoidal integration of the respective N-N2O, C-CH4, and C-CO2 fluxes. This method assumes that fluxes measured between 09:00 h and 11:00 h represent the mean daily emissions [11]. Emissions in carbon equivalent were then calculated from the cumulative emission values, as described by [26,27].
The global warming potential (GWP) of each system was calculated by the sum of the cumulative soil CH4 and N2O emissions and the annual soil organic C accumulation rate (∆C) in NTVS compared to CTS [24]. Emissions of CH4 and N2O were expressed as kg Ceq ha−1 by multiplying the fluxes by the ratio of their respective global warming potentials (1, 27, and 273 for CO2, CH4, and N2O, respectively) and the molar ratio between CO2 and C (44/12 = 3.67), using Equation (2):
This metric represents the net balance between carbon sequestration and greenhouse gas emissions, expressed as carbon equivalent units, considering the contributions of CH4 and N2O based on their respective global warming potentials.
2.2.3. Soil Chemical and Physical Properties
Soil samples of the experimental area were collected to quantify total soil C and N stocks, soil bulk density, volumetric moisture, and mean geometric diameter of aggregates before cauliflower transplanting. The samples were collected at the 0–5, 5–10, and 10–30 cm layers in each plot of the treatments, following the methodology recommended by [28,29]. Total soil organic carbon (TOC) and total nitrogen (TN) were determined using dry combustion in an elemental analyzer [30]. Soil bulk density and volumetric moisture were measured using the volumetric ring method [28]. Aggregate stability was determined by wet sieving [31]. Trenches of 40 × 40 × 40 cm were opened in each plot, and three disturbed samples and two undisturbed samples were collected to form composite samples. TOC and TN contents were evaluated in disturbed samples, and soil bulk density and aggregate stability were evaluated in the undisturbed samples. After collection, the samples were placed in plastic bags and sent to the laboratory for evaluation.
Disturbed samples were air-dried and passed through a 2 mm mesh sieve. The samples were then ground in a porcelain mortar and passed through a 150 mesh (0.149 mm) sieve to quantify TOC and TN contents in a dry combustion elemental analyzer. TOC and TN stocks were calculated by the equivalent mass method [30], using Equation (3):
where
- CS is the total organic carbon stock (TOC) or total nitrogen stock (TN) (Mg ha−1);
- is the sum of soil carbon or nitrogen contents from the first (surface) to the last layer of the profile in the evaluated treatment (Mg ha−1);
- is the sum of soil mass from the first to the last layer of the profile in the evaluated treatment (Mg ha−1);
- is the sum of soil mass from the first to the last layer in the profile in the reference treatment (Mg ha−1);
- MTn is the soil mass in the last layer of the profile in the evaluated treatment (Mg ha−1);
- CTn is the carbon or nitrogen concentration in the last layer of the profile in the evaluated treatment (Mg C or N Mg−1).
Soil bulk density (SD) and volumetric moisture (VM) were determined using the volumetric ring methodology [28]. Aggregate stability was assessed using soil blocks collected with a spade. The samples were air-dried and manually broken along natural lines of weakness. Subsequently, the samples were passed through 8.00 mm and 4.00 mm mesh sieves to obtain soil aggregates [28]. Twenty-five grams of aggregates retained by the 4.00 m sieve were transferred to a 2.00 mm sieve which was part of a set of sieves with decreasing mesh diameters: 2.00, 1.00, 0.50, 0.25, 0.105, and 0.053 mm [7,28,32].
The aggregates placed on the 2.00 mm sieve were moistened with a water sprayer, and the sieves were subjected to vertical wet sieving for 15 min using a Yoder apparatus [31]. The material retained on each sieve was removed with a water jet, placed in aluminum crucibles, and taken to a forced air-circulation oven at 105 °C until constant weight. The mean geometric diameter (MGD) was calculated using the weight of the aggregates [28].
2.3. Statistical Analysis
The variation in the mean daily fluxes of N-N2O, C-CH4, and C-CO2 emitted by the soil was expressed as the standard deviation of the mean (n = 5). Cumulative soil emissions of N-N2O, C-CH4, and C-CO2, soil TOC and TN contents and stocks, SD, MGD, VM, soil temperature, and cauliflower yield were analyzed using two-way ANOVA, with time as a fixed factor. Data normality was assessed using the Shapiro–Wilk test, and homogeneity of variances was verified with Levene’s test. Outliers were identified and evaluated using Cook’s distance to ensure robust analysis. Statistical analyses were conducted using the program Sisvar 5.8 [33]. When significant effects were detected, means (n = 5) were compared using the t-test (LSD) at p < 0.05 [34].
3. Results and Discussion
3.1. Cauliflower Yield and Soil Chemical and Physical Properties
Cauliflower yield was 27% higher in NTVS (25.1 Mg ha−1) compared to CTS (18.4 Mg ha−1) (Figure 4). This higher yield is directly associated with the greater plant biomass added to the soil by winter and summer cover crops under NTVS. Cover crops promote soil organic matter accumulation, improving soil structure, nutrient cycling, and microbial activity, which enhance nutrient availability and water retention [3,4,5,6]. Consequently, plants benefit from improved growing conditions, resulting in higher productivity. Additionally, NTVS improves soil chemical and physical properties (Table 2 and Table 3) compared to CTS, thereby supporting higher vegetable yields.
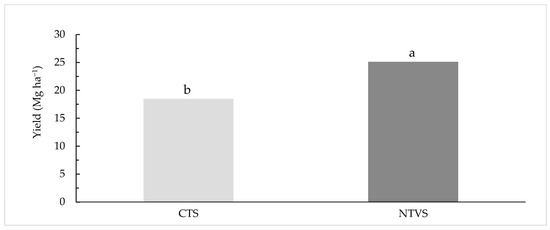
Figure 4.
Cauliflower yield (Mg ha−1) in CTS and NTVS, in the 2021/2022 harvest. CTS = conventional soil tillage system, without cover crops; NTVS = no-tillage vegetable production system using a mix of winter cover crops (black oat, ryegrass, vetch, and barley) and summer cover crops (millet, velvet bean, and signalgrass) before cauliflower transplanting. Different letters above the bars represent statistically significant differences between means, according to the t-test (LSD) at p < 0.05.

Table 2.
Total organic carbon (TOC) and total nitrogen (TN) contents and stocks in different soil layers of plots with no-tillage vegetable production system (NTVS) and conventional tillage system (CTS) after cauliflower harvest.

Table 3.
Mean geometric diameter (MGD), soil bulk density (SD), and volumetric moisture (VM) in different soil layers of plots with no-tillage vegetable production system (NTVS) and conventional tillage system (CTS) after cauliflower harvest.
Previous studies have shown improved soil chemical and physical properties in NTVS with winter cover crops compared to CTS, leading to higher onion yields [10,34]. In NTVS, plant residues covering the soil gradually release nutrients during their decomposition, improving soil fertility [35,36] and positively affecting plant growth [10]. The NTVS plots exhibited the highest total organic carbon (TOC) and total nitrogen (TN) contents and stocks across all soil layers (Table 2).
The results in the CTS, particularly in the 0–5 and 5–10 cm layers, can be attributed to plowing and harrowing, which disrupt soil aggregates, accelerate the mineralization of plant residues, and increase carbon loss to the atmosphere as CO2 [37]. The lower TOC contents and stocks in the CTS are linked to the limited presence of plant residues on the soil surface and the rapid decomposition of residues caused by soil tillage, which incorporates them into soil profiles. In an organic management system similar to the NTVS, TOC stocks increased from 34.6 Mg ha−1 to 58.2 Mg ha−1 in 10 years, corresponding to a C sequestration of 23.6 Mg ha−1, or an average rate of 2,36 Mg ha−1 year−1 [10].
The highest TN contents and stocks were observed in NTVS (Table 2), primarily due to the presence of cover plants in this system, particularly legumes, such as vetch and velvet bean. N is gradually released into the soil as the straw of winter and summer cover crops (grasses and legumes) decomposes in NTVS [10,32,38,39].
The NTVS stores 22.1 and 2.64 Mg ha−1 more TOC and TN in the 0–30 cm layer than CTS (Table 2). These findings are aligned with the results from the meta-analysis [18], which showed that conservation practices such as no-tillage and cover cropping increase soil C and N stocks in croplands across various climate zones, highlighting their potential to enhance soil carbon sequestration.
These higher C and N stocks improved soil chemical conditions, resulting in the higher yield (6.7 Mg ha−1) in NTVS compared to CTS (Figure 4). Long-term experiments with onion crops under NTVS and CTS also revealed increases in C and N contents and stocks in treatments using cover crops without soil disturbance [13,32]. Aggregate stability, measured by MGD, was higher in NTVS than in CTS, regardless of the soil layer (Table 3). Similar findings have been reported in other studies, highlighting the positive effects of cover crop residues on soil structure, moisture retention, and aggregate stability in no-tillage systems [5,32,37,40].
The lowest soil bulk density (SD) was observed in NTVS, specifically in the 0–5 and 5–10 cm layers. These low values were attributed to the high MGD and TOC and TN contents and stocks (Table 2) found for the NTVS, which collectively contribute to improved soil structure. Contrastingly, the higher SD in the CTS indicates greater soil compaction, likely caused by the repeated use of plowing and harrowing. These conventional tillage practices disrupt soil aggregates, expose organic matter to rapid mineralization, and promote soil settling over time, leading to reduced porosity and increased soil bulk density. Similar observations were made for [41], who emphasized that improved aggregation and moisture retention in soils under conservation management are key factors for field-scale estimations of GHG balances in agriculture.
In both treatments, the SD was below the critical range; according to the soil texture, it is 1.40 g cm−3, indicating significant soil compaction [42]. The highest moisture values were observed in NTVS areas, 0.35 cm3 cm−3 in the 0–5 cm layer, 0.38 cm3 cm−3 in the 5–10 cm layer, and 0.44 cm3 cm−3 in the 10–30 cm layer, significantly exceeding the values in the CTS, which were 0.25, 0.29, and 0.37 cm3 cm−3, respectively (Table 3). These results indicate that maintaining cover crop residues on the soil, as in NTVS plots, enhances soil water retention. Additionally, considering that cover plants such as black oats and velvet beans contribute to improving soil structure by increasing TOC levels and biological activity, they enhance water infiltration and reduce surface evaporation [43]. Thus, the soil environment in NTVS became more stable and retained more water, ensuring greater water availability for subsequent crops, which positively affected crop yield. Similar results were found in studies [7,10] evaluating soil physical and chemical properties and onion crop yields under NTVS and CTS, demonstrating that NTVS increases soil VM and porosity while reducing SD, resulting in higher onion yields compared to CTS.
The soil–plant cover, combined with rhizodeposition throughout the year, generates biopores and channels that facilitate water infiltration into the soil. Thus, the higher moisture observed in NTVS resulted from soil cover and improvements in physical and biological characteristics, creating a more favorable environment for crop growth compared to the CTS. The improved physical conditions and higher C and N stocks in NTVS are reflected in the greater cauliflower yield compared to the CTS (Figure 4).
Thus, improving soil characteristics by adding plant residues increases soil C and N stocks, positively affecting soil MGD and moisture, and reducing SD compared to the CTS. A low SD indicates less soil compaction and great soil aeration, water retention, and infiltration capacity [44]. The constant presence of plant biomass in NTVS also decreased the mean soil temperature (Figure 5) in the surface layer (0–5 cm) compared to the CTS. The cover crops under NTVS form a protective layer, directly reducing exposure to solar radiation and lowering soil temperature. Lower soil temperatures reduce evaporation and conserve moisture, which explains the higher VM in NTVS compared to CTS (Table 3). The matric potential is lower in wetter soils, which facilitates plant water absorption [45], makes soil conditions more suitable for developing subsequent crops, and promotes thermal stability throughout the soil surface layer. The statistical comparison of soil temperature between tillage treatments was conducted using analysis of variance and the t-test (LSD) at p < 0.05 [33]; however, considering the temporal nature of temperature fluctuations, a repeated measures design could provide further insights into treatment effects over time.
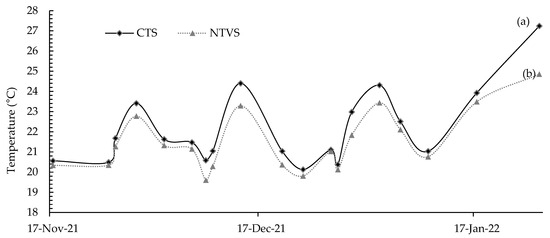
Figure 5.
Soil temperature (°C) in the surface layer in CTS and NTVS treatments during measurements of greenhouse gas (GHG) emissions. CTS = conventional soil tillage system, without cover crops; NTVS = no-tillage vegetable production system using a mix of winter cover crops (black oat, ryegrass, vetch, and barley) and summer cover crops (millet, velvet bean, and signalgrass) before cauliflower transplanting. Means (n = 5) followed by the same letter do not significantly differ according to the t-test (LSD) at p < 0.05.
The lower temperatures in NTVS had significant implications for GHG emissions. Soils with lower temperatures tend to reduce microbial activity and root respiration, decreasing mineralization processes and, consequently, the release of GHG such as CO2, N2O, and CH4. However, the presence of cover crops and the increased additions of C and N to the surface led to an enrichment in microorganisms, which may have resulted in the increased GHG emissions under NTVS (Figure 6), as also found by [33]. The lower C/N ratio of the soil cover residues, particularly legumes, and the higher microbial activity and temperature resulted in higher gas emissions, mainly CO2, due to a faster decomposition rate of the plant material [46].
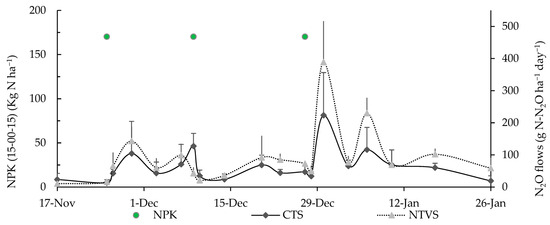
Figure 6.
Mean soil N2O fluxes (g N-N2O ha−1 day−1) in CTS and NTVS treatments. NPK = 15-00-15 N-P-K fertilizer applications. CTS = conventional soil tillage system, without cover crops; NTVS = no-tillage vegetable production system using a mix of winter (black oat, ryegrass, vetch, and barley) and summer (millet, velvet bean, and signalgrass) cover crops before cauliflower transplanting.
3.2. Soil GHG Fluxes and Emissions
3.2.1. N2O Emissions
The highest daily emissions of N2O fluxes were observed in NTVS, which can be attributed to the higher soil moisture levels in this system compared to the CTS (Table 3). The continuous presence of plant biomass on the soil surface in NTVS creates conditions that favor nitrification and denitrification, which contribute to N2O emissions [47]. The N2O fluxes peaked on December 30, reaching 389 g N-N2O ha−1 day−1 in NTVS and 224 g N-N2O ha−1 day−1 in the CTS, likely due to the third nitrogen fertilizer application carried out three days earlier (Figure 6). During the first nine days of measurement, both treatments exhibited low N2O emissions, but emissions increased following the first N-P-K fertilizer application on 25 November. The application of nitrogen fertilizer appeared to have stimulated microbial activity, leading to higher N2O release in both systems.
A study measuring soil GHG in onion crops found a peak in N2O emissions on the first assessment date in NTVS, attributed to the presence of oilseed radish residues associated with poultry litter applied to the soil as fertilizer [8]. N2O emissions peaked three days after the first fertilizer application, carried out on 25 November (Figure 6), in both CTS (104 g N-N2O ha−1 day−1) and NTVS (143 g N-N2O ha−1 day−1) plots.
The highest cumulative N2O emissions were observed in NTVS. The total cumulative emissions were 6192 g N-N2O ha−1 (NTVS) and 4288 g N-N2O ha−1 (CTS), while mean cumulative emissions over the 71-day monitoring period were 1708 g N-N2O ha−1 (NTVS) and 1235 g N-N2O ha−1 (CTS over the 71 days of monitoring). Emissions in CTS were 28% more than those in NTVS (Figure 7).
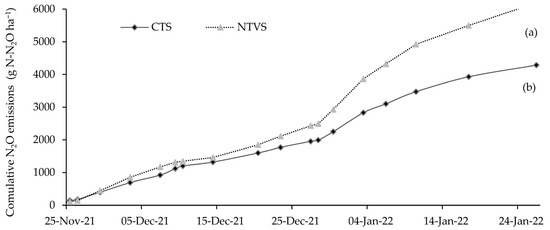
Figure 7.
Mean cumulative soil N2O emissions (g N-N2O ha−1) in CTS and NTVS treatments, considering N-P-K fertilizer applications in cauliflower. CTS = conventional soil tillage system, without cover crops; NTVS = no-tillage vegetable production system using a mix of winter cover crops (black oat, ryegrass, vetch, and barley) and summer cover crops (millet, velvet bean, and signalgrass) before cauliflower transplanting. Means (n = 5) followed by the same letter do not significantly differ according to the t-test (LSD) at p < 0.05.
The increased N2O emission in NTVS compared to CTS is explained by the addition of soil cover plant residues with a low C/N ratio due to the presence of legumes, which reduces their decomposition time [48]. Thus, microorganisms increased oxygen use, generating anaerobic conditions in part of the soil, leading to denitrification and higher N2O emission [49,50]. However, when large amounts of carbon-rich plant materials are added as cover, soil surface temperature decreases, lowering microbial activity and N2O emission [51]. There were no differences in N2O emissions between the treatments over the first two fertilizer application cycles (Figure 8A,B). The fertilizer application cycles were based on predefined intervals aligned with the crop’s growth stages. Each cycle represents the period between two consecutive N-P-K applications (Table 1).
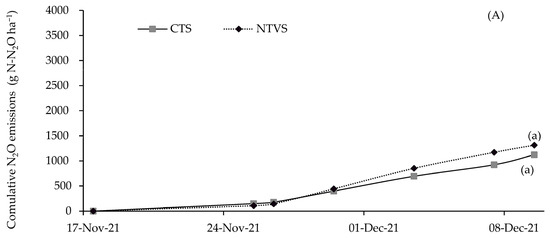
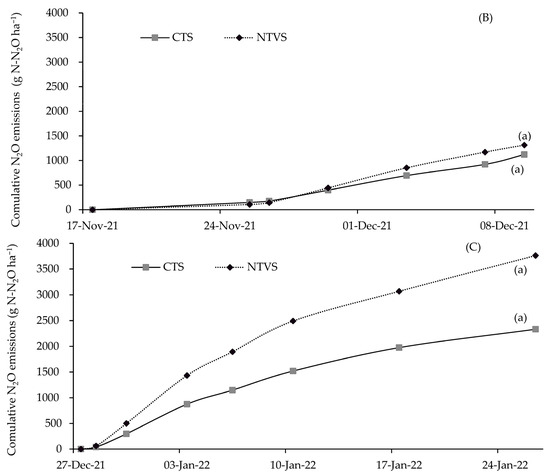
Figure 8.
Mean cumulative soil N2O emissions (g N-N2O ha−1) in each N-P-K fertilizer application cycle, in the CTS and NTVS treatments. CTS = conventional soil tillage system, without cover crops; NTVS = no-tillage vegetable production system using a mix of winter (black oat, ryegrass, vetch, and barley) and summer (millet, velvet bean, and signalgrass) cover crops before cauliflower transplanting. Means (n = 5) followed by the same letter do not significantly differ according to the t-test (LSD) at p < 0.05.
The differences in N2O fluxes between NTVS and CTS plots were more evident in the third fertilizer application cycle, reaching 24%. NTVS soils probably had more anaerobic microsites because they retained more soil moisture (Table 3). However, the lower SD indicates that macroporosity and aeration capacity were adequate. Moreover, N2O emissions could be even higher if the system soils were more compacted. This demonstrates the importance of cover crops and their proper management in mitigating N2O emissions in NTVS [49].
3.2.2. CH4 Emissions
In NTVS, CH4 emission data indicated a higher rate of consumption than emission of this gas into the atmosphere. This is attributed to the improvement in soil structure promoted by conservation management and the continuous vegetation cover, which enhance porosity and increase soil aeration [52]. Cover crops (legumes and grasses) increase microbial activity, particularly that of methanotrophic bacteria, which utilize CH4 as a carbon and energy source, oxidizing it into carbon dioxide (CO2) and thereby reducing net CH4 emissions [53]. Although NTVS soils exhibited higher moisture content, the improved soil structure and lower bulk density likely facilitated gas exchange and oxygen diffusion, creating favorable conditions for methanotrophic activity. The presence of macropores in NTVS soils reduces water saturation in critical microsites, preventing anaerobic conditions that could inhibit methane oxidation [54]. The highest CH4 emission was observed in CTS areas (2.44 g C-CH4 ha−1 day−1) on December 3, while the highest CH4 consumption was observed in NTVS, reaching 1.71 g C-CH4 ha−1 day−1 on January 10 (Figure 9).
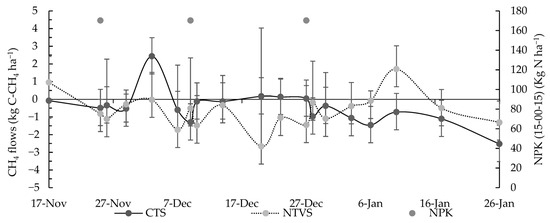
Figure 9.
Mean soil CH4 fluxes (g C-CH4 ha−1 day−1) in CTS and NTVS plots with cauliflower plants. CTS = conventional soil tillage system, without cover crops; NTVS = no-tillage vegetable production system using a mix of winter cover crops (black oat, ryegrass, vetch, and barley) and summer cover crops (millet, velvet bean, and signalgrass) before cauliflower transplanting. The variation in mean daily soil CH4 fluxes is expressed as the standard deviation of the mean.
In NTVS, SD was lower and MGD was larger, indicating the presence of more macropores and improved aeration. CTS may have exhibited increased aeration due to lower soil moisture (Table 3). The highest CH4 consumption occurred in NTVS, with 39.5 g C-CH4 ha−1, while CTS consumption was 34.1 g C-CH4 ha−1 (Figure 10).
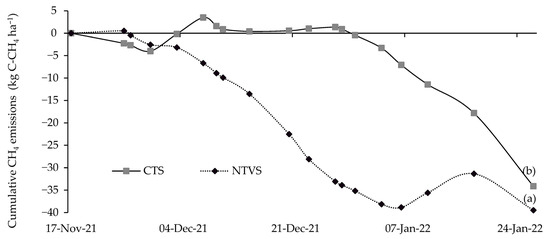
Figure 10.
Mean cumulative soil CH4 emissions (g C-CH4 ha−1) in NTVS and CTS plots with cauliflower plants. CTS = conventional soil tillage system, without cover crops; NTVS = no-tillage vegetable production system using a mix of winter cover crops (black oat, ryegrass, vetch, and barley) and summer cover crops (millet, velvet bean, and signalgrass) before cauliflower transplanting. Means (n = 5) followed by the same letter do not significantly differ according to the t-test (LSD) at p < 0.05.
In an experiment with varying levels of straw in sugarcane areas, the presence of straw on the soil increased CH4 absorption by 40% compared to areas where all plant residues were removed [55]. This highlights the importance of straw cover, as CH4 absorption is affected by soil moisture, temperature, cover, and fertilizer application. This CH4 consumption is associated with methanotrophs, bacteria that utilize CH4 as a carbon source and energy to oxidize it to carbon dioxide (CO2) through aerobic reactions [56]. This process is essential for methane mitigation [56]. The differences between treatments (Figure 10) were primarily attributed to the varying management practices. In the CTS, the soil remained bare (without cover crops), and frequent tillage (plowing and harrowing) disrupted its structure, reducing organic matter inputs and microbial activity. In contrast, the NTVS maintained continuous soil cover crops, which enhanced soil structure, moisture retention, and biological activity. Additionally, environmental factors during the collection period (Figure 2) affected methane fluxes in both systems [53].
The difference in CH4 emissions between the two treatments in the second fertilizer application cycle (Figure 11B) was not statistically significant. However, cumulative CH4 emissions in CTS were higher than in NTVS, where methane consumption was observed. CH4 emissions in CTS reached 1.19 g C-CH4 ha−1 on 14 December, whereas NTVS exhibited a net CH4 uptake of 24.17 g C-CH4 ha−1 on 27 December.
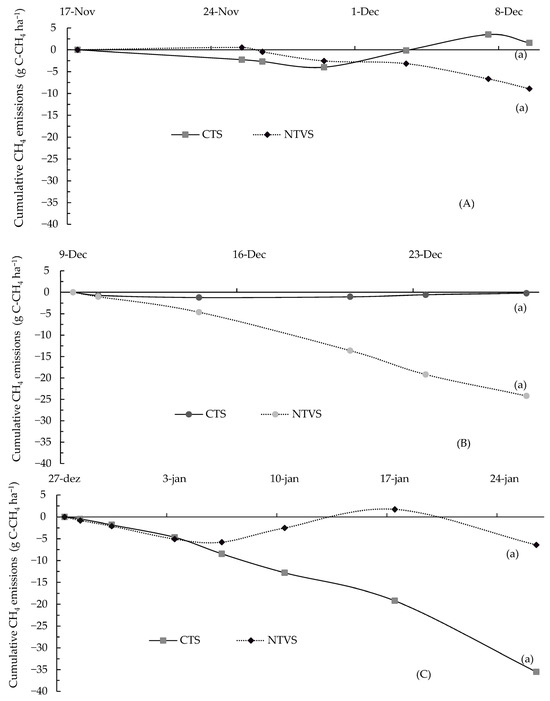
Figure 11.
Mean cumulative soil CH4 emissions (g C-CH4 ha−1) during each fertilizer application cycle. CTS = conventional soil tillage system, without cover crops; NTVS = no-tillage vegetable production system using a mix of winter cover crops (black oat, ryegrass, vetch, and barley) and summer cover crops (millet, velvet bean, and signalgrass) before cauliflower transplanting. Means (n = 5) followed by the same letter do not significantly differ according to the t-test (LSD) at p < 0.05.
3.2.3. CO2 Emissions
CO2 emissions are directly related to soil tillage, organic matter addition, and environmental conditions, as these factors affect microbial activity and organic matter decomposition, leading to variations in CO2 emissions. Daily CO2 emission fluxes (Figure 12) in NTVS peaked on December 30, reaching 69.8 kg C-CO2 ha−1 day−1. The daily CO2 emission peak in CTS reached 37.2 kg C-CO2 ha−1 day−1. However, these were the highest values observed within each system and do not necessarily represent the seasonal peak, as emissions vary with environmental and soil conditions throughout the growing period.
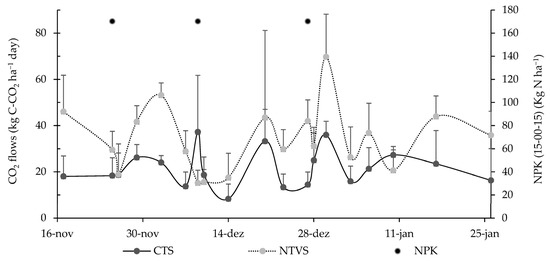
Figure 12.
Mean soil CO2 fluxes (Kg C-CO2 ha−1 day−1) in CTS and NTVS plots with cauliflower plants. CTS = conventional soil tillage system, without cover crops; NTVS = no-tillage vegetable production system using a mix of winter cover crops (black oat, ryegrass, vetch, and barley) and summer cover crops (millet, velvet bean, and signalgrass) cover crops before cauliflower transplanting. The variation in mean daily soil CO2 fluxes is expressed as the standard deviation of the mean.
CO2 emissions in CTS plots remained constant during the first three collections, whereas in NTVS areas, the first two collections showed the highest emissions. This is attributed to the lower C/N ratio of cover plants, particularly vetch and velvet bean, and the higher soil nitrogen content (Table 3). High nitrogen availability, both in cover crops and in the soil, accelerates plant residue decomposition, releasing more carbon as CO2 [57,58,59]. In addition, the NTVS had higher carbon contents and stocks in the soil compared to the CTS (Table 3).
The highest cumulative CO2 emissions were 2459 kg C-CO2 ha−1 in NTVS and 1485 kg C-CO2 ha−1 in the CTS. Significant differences were observed between the treatments (Figure 13). Despite the lower soil temperatures observed in NTVS (Figure 5), CO2 emissions were higher due to the increased availability of labile organic matter and enhanced microbial activity. The decomposition of plant residues, particularly from legume cover crops with a low C/N ratio, accelerates microbial respiration, resulting in greater CO2 release regardless of temperature differences [53]. This agrees with [60], which noted that increases in labile organic matter and fertilizer input can elevate microbial respiration, leading to higher CO2 emissions, especially in systems that combine technological intensification with cover crops.
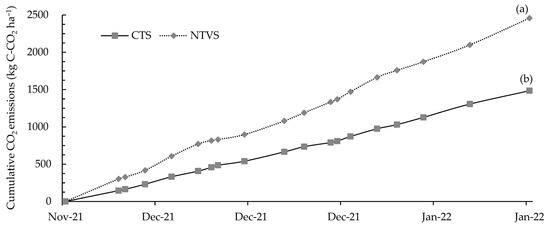
Figure 13.
Mean cumulative soil CO2 emissions (kg C-CO2 ha−1) in CTS and NTVS plots with cauliflower plants. CTS = conventional soil tillage system, without cover crops; NTVS = no-tillage vegetable production system using a mix of winter cover crops (black oat, ryegrass, vetch, and barley) and summer cover crops (millet, velvet bean, and signalgrass) before cauliflower transplanting. Means (n = 5) followed by the same letter do not significantly differ according to the t-test (LSD) at p < 0.05.
Enzymes produced by intense microbial activity can raise soil temperature, further increasing CO2 production [53,61]. The increased emissions in NTVS are directly related to the quantity and quality of soil organic matter (Table 2 and Table 3). An NTVS area with onion crops exhibited higher levels of light and particulate organic matter, which are labile C and N fractions readily decomposed by microorganisms, resulting in higher CO2 emissions [37]. As highlighted in a meta-analysis by [62] on cover crop management and their effects on soil carbon stocks and GHG emissions, increases in soil C contents compensate for higher CO2 emissions in areas with cover crops compared to areas without them.
Considering the mean cumulative CO2 emissions within each mineral fertilizer application cycle (Figure 14A–C), significant differences were observed between treatments in the first (Figure 14A) and third (Figure 14C) cycles. The highest emissions in the first cycle were observed in NTVS, with 816 kg C-CO2 ha−1, while in the CTS, they were 458 kg C-CO2 ha−1. Similarly, the NTVS showed significantly higher emissions in the third cycle compared to the CTS, reinforcing the influence of cover crops and organic matter decomposition on CO2 fluxes.
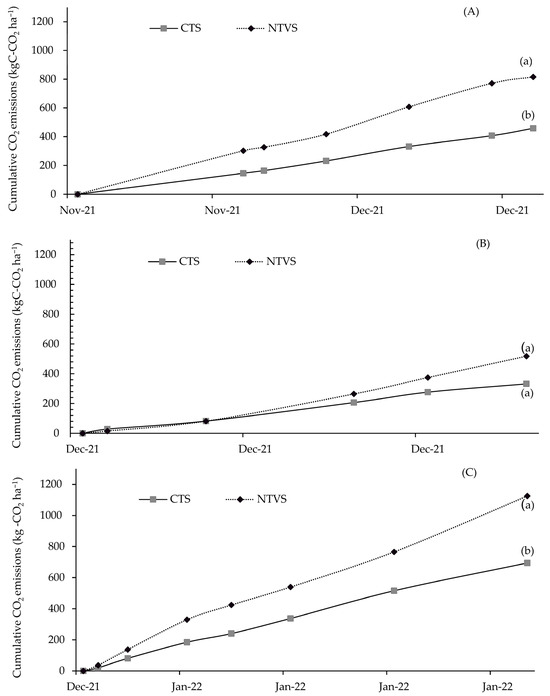
Figure 14.
Mean cumulative soil CO2 emissions (kg C-CO2 ha−1) during each fertilizer application cycle. CTS = conventional soil tillage system, without cover crops; NTVS = no-tillage vegetable production system using a mix of winter cover crops (black oat, ryegrass, vetch, and barley) and summer cover crops (millet, velvet bean, and signalgrass) before cauliflower transplanting. Means (n = 5) followed by the same letter do not significantly differ according to the t-test (LSD) at p < 0.05.
3.3. Carbon Equivalent Required to Neutralize Emissions of N2O, CH4, and CO2
The carbon equivalent required to offset GHG emissions throughout the cauliflower production cycle was higher in NTVS than in CTS (Figure 15). This difference is primarily attributed to the higher cumulative emissions of N2O and CO2 in NTVS, resulting in a greater need for carbon sequestration to balance emissions. Additionally, the higher organic matter decomposition rates in NTVS contributed to increased CO2 releases, further influencing the carbon equivalent required for mitigation.
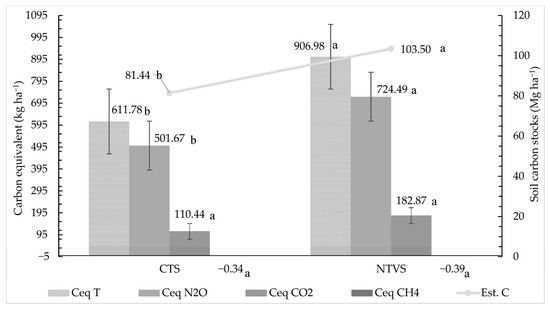
Figure 15.
Carbon equivalent required to neutralize cumulative emissions of N2O, CH4, and CO2 throughout the cauliflower cycle, alongside soil carbon stocks for each treatment (CTS and NTVS). CTS = conventional soil tillage system, without cover crops; NTVS = no-tillage vegetable production system using a mix of winter cover crops (black oat, ryegrass, vetch, and barley) and summer cover crops (millet, velvet bean, and signalgrass) before cauliflower transplanting. Ceq T = Total Carbon Equivalent required to neutralize emissions; Ceq N2O = Carbon Equivalent for N2O; Ceq CH4 = Carbon Equivalent for CH4; Ceq CO2 = Carbon Equivalent for CO2. Error bars represent the standard deviation of the mean. Means (n = 5) followed by the same letter do not differ statistically (LSD, p < 0.05).
N2O and CO2 require more carbon equivalent for neutralization than CH4. Thus, their significant contribution to global warming necessitates enhanced mitigation efforts [63]. The NTVS areas had sufficient carbon reserves to offset emissions of N2O, CH4, and CO2, as evidenced by the total carbon stocks in the 0–30 cm layer (Table 2, Figure 15). Carbon stocks were 22.06 Mg ha−1 higher in NTVS than in the CTS, fully enabling the offsetting of GHG in the form of CeqT. This mitigation capacity is attributed to the use of winter and summer cover crops, which promote mulch formation, increase soil carbon retention, and enhance soil biological activity in NTVS areas. Despite the absence of cover crops, the CTS carbon stocks sufficed to neutralize CeqT emissions, reinforcing the importance of maintaining adequate levels of soil organic matter.
Although both systems had adequate carbon stocks to mitigate emissions, the NTVS provides the advantage of more stable carbon stocks over time. This is attributed to the continuous presence of vegetation cover and reduced soil disturbance, which are essential for long-term sustainability. In contrast, the CTS may experience greater carbon losses due to soil exposure, reduced aggregate stability, and organic matter degradation, particularly in monoculture systems without cover crops.
The results demonstrate the effectiveness of the NTVS in mitigating GHG emissions, indicating its adoption as a viable strategy for sustainable agricultural systems. Furthermore, the comparison between CTS and NTVS emphasizes the importance of agricultural practices that promote soil carbon conservation to mitigate emissions and enhance soil quality and productivity.
4. Conclusions
Our results confirm part of our hypothesis that NTVS increases soil C and N stocks by adding cover crop residues and using no tillage, leading to higher cauliflower yields compared to CTS. But, our results do not confirm that NTVS emits less GHG than CTS.
Implementing NTVS for cauliflower cultivation proved to be an effective management choice for increasing productivity. After 11 years of NTVS management, improvements in soil characteristics (increased carbon and nitrogen stocks, reduced soil density, increased soil aggregation and volumetric moisture) indicated that this system can contribute to more sustainable production and long-term soil health.
However, NTVS exhibited the highest GHG emissions, particularly CO2 and N2O, due to the addition of plant residues from winter and summer crops with diverse botanical compositions, predominantly legumes and grasses. The use of legumes as cover crops under NTVS, which fix nitrogen, significantly influenced the dynamics of N2O release, highlighting the need for management strategies to mitigate GHG emissions. Although NTVS exhibited higher CO2 and N2O emissions, it also demonstrated the highest capacity for soil carbon and nitrogen storage, compensating for these increased emissions.
Overall, NTVS proved to be an advantageous alternative for enhancing crop yield and soil quality; however, its environmental impact, particularly on GHG emissions, requires careful consideration. Thus, achieving a balance between agronomic efficiency and environmental sustainability is critical for developing more sustainable agricultural practices.
Author Contributions
Conceptualization, A.L. and D.D.; methodology, B.d.R.D. and P.H.d.S.C.; software, B.d.R.D. and P.H.d.S.C.; validation, A.L., J.C.R., C.B. and L.D.G.; formal analysis, B.d.R.D.; investigation, A.L., L.R.R. and P.E.L.; resources, A.L.; data curation, B.d.R.D. and J.C.R.; writing—original draft preparation, B.d.R.D. and A.L.; writing—review and editing, P.E.L., J.L.R.T., M.Z. and C.B.; visualization, L.R.R. and L.D.G.; supervision, A.L. and D.D.; project administration, A.L.; funding acquisition, A.L., D.D. and P.E.L. All authors have read and agreed to the published version of the manuscript.
Funding
This research was funded by Council for Scientific and Technological Development (CNPq) grant number 311474/2021, 406447/2023, 151015/2024, and 307410/2021; the Brazilian Coordination for the Improvement of Higher Education Personnel (CAPES) grant number 88881.691714/2022 and 88887.999208/2024; the Brazilian National Institute of Science and Technology in Low Carbon Emission Agriculture (INCT-ABC), via CNPq grant number 406635/2022; and the Santa Catarina State Research and Innovation Support Foundation (FAPESC), grant number 48/2021, via scholarship granted to the first author. And The APC was funded by CNPq, grant number 406635/2022 and 88881.691714/2022 and 88:87.999208/2024.
Data Availability Statement
The original data presented in the study are openly available in https://repositorio.ufsc.br/handle/123456789/252098 (accessed on 5 April 2025).
Acknowledgments
The authors acknowledge the financial support provided by CNPq (grants 311474/2021, 406447/2023, 151015/2024, and 307410/2021); CAPES (88881.691714/2022 and 88887.999208/2024); INCT-ABC via CNPq (406635/2022); and FAPESC (48/2021).
Conflicts of Interest
The authors declare no conflict of interest.
References
- Dos Santos, A.A.; Giehl, A.L.; Silva, F.M.; de Luca, F.V.; Padrão, G.d.A.; Elias, H.T.; Alves, J.R.; Gugel, J.T.; Araujo, L.A.; Vicente, L.R.M.; et al. Síntese Anual da Agricultura de Santa Catarina 2018–2019. 2019. Available online: https://docweb.epagri.sc.gov.br/website_cepa/publicacoes/Sintese_2018_19.pdf (accessed on 5 January 2025).
- Marouelli, W.A.; Abdalla, R.P.; Madeira, N.R.; de Oliveira, A.S.; de Souza, R.F. Eficiência de uso da água e produção de repolho sobre diferentes quantidades de palhada em plantio direto. Pesqui Agropecuária Bras. 2010, 45, 369–375. [Google Scholar] [CrossRef]
- Giumbelli, L.D.; Loss, A.; Ventura, B.S.; Junior, E.d.S.; Almeida, J.; Piccolo, M.d.C.; Mafra, Á.L.; Kurtz, C.; Brunetto, G.; Comin, J.J. Aggregation index, carbon, nitrogen, and natural abundance of 13C and 15N in soil aggregates and bulk soil cultivated with onion under crop successions and rotations. Soil Res. 2020, 59, 622–635. [Google Scholar]
- Comin, J.J.; Vezzani, F.; Souza, M.; Kurtz, C.; Mafra, Á.L.; Lovato, P.E.; Lourenzi, C.R.; Loss, A. Soil Health in No-tillage Vegetable Production Systems-SPDH. In Soil Health and Sustainable Agriculture in Brazil, 1st ed.; Mendes, I.C., Cherubin, M.R., Eds.; Soil Science Society of America; John Wiley & Sons: Hoboken, NJ, USA, 2024; Volume 3, pp. 208–235. [Google Scholar]
- Bortolini, J.G.; Soares, C.R.F.S.; Muller, M.J.; Ferreira, G.W.; Meyer, E.; Caroline Krug Vieira, M.S.; Kurtz, C.; Lourenzi, C.R.; Lovato, P.E.; Loss, A.; et al. Soil Carbon, Glomalin, And Aggregation in Onion Crop Under No-Tillage with Cover Crops or Conventional Tillage Systems for Eight Years. J Agric Stud. 2021, 9, 130–150. [Google Scholar]
- Fayad, J.A.; Comin, J.J.; Bertol, I. Sistema de Plantio Direto de Hortaliças (NTVS); Boletim Didático; Epagri: Florianópolis, Brazil, 2019; Volume 131, 91p. [Google Scholar]
- Loss, A.; Junior, E.D.S.; Schmitz, D.; Da Veiga, M.; Kurtz, C.; Comin, J.J. Atributos físicos do solo em cultivo de cebola sob sistemas de plantio direto e preparo convencional. Rev. Colomb. Cienc. Hortícolas. 2017, 11, 105–113. [Google Scholar] [CrossRef]
- Müller Júnior, V.; Koucher, L.d.P.; Souza, M.; Lima, A.P.; Kurtz, C.; Couto, R.d.R.; Lovato, P.E.; Giacomini, S.J.; Brunetto, G.; Comin, J.J. Nitrous Oxide Emissions in No-Tillage Onion (Allium cepa L.) Crops Are Increased by Oilseed Radish Cover Crop and Poultry Manure Application. Rev. Bras. Ciência Solo. 2019, 43, e0180116. [Google Scholar] [CrossRef]
- Shi, P.; Schulin, R. Erosion-induced losses of carbon, nitrogen, phosphorus and heavy metals from agricultural soils of contrasting organic matter management. Sci. Total Environ. 2018, 618, 210–218. [Google Scholar] [CrossRef]
- Souza, M.; Júnior, V.M.; Kurtz, C.; Ventura, B.d.S.; Lourenzi, C.R.; Lazzari, C.J.R.; Ferreira, G.W.; Brunetto, G.; Loss, A.; Comin, J.J. Soil chemical properties and yield of onion crops grown for eight years under no-tillage system with cover crops. Soil Tillage Res. 2021, 208, 104897. [Google Scholar]
- Jantalia, C.P.; Dos Santos, H.P.; Urquiaga, S.; Boddey, R.M.; Alves, B.J.R. Fluxes of nitrous oxide from soil under different crop rotations and tillage systems in the South of Brazil. Nutr. Cycl. Agroecosyst. 2008, 82, 161–173. [Google Scholar]
- Thomazini, A.; Mendonça, E.S.; Cardoso, I.M.; Garbin, M.L. SOC dynamics and soil quality index of agroforestry systems in the Atlantic rainforest of Brazil. Geoderma Reg. 2015, 5, 15–24. [Google Scholar] [CrossRef]
- Câmara, P.H.d.S. Influência da Complexidade de Diferentes Sistemas de Cultivo de Cebola na Emissão de Gases de Efeito Estufa. Ph.D. Thesis, Universidade Federal de Santa Catarina, Florianópolis, Brazil, 2022. [Google Scholar]
- Carvalho, M.L.; Vanolli, B.d.S.; Schiebelbein, B.E.; Borba DAd Luz FBd Cardoso, G.M.; Bortolo, L.d.S.; Marostica, M.E.M.; Souza, V.S. Guia prático de Plantas de Cobertura: Aspectos Fitotécnicos e Impactos Sobre a Saúde do solo; Universidade de São Paulo-USP: São Paulo, Brazil, 2022. [Google Scholar] [CrossRef]
- Pereira, B.d.J.; Filho, A.B.C.; La Scala, N., Jr. Greenhouse gas emissions and carbon footprint of cucumber, tomato and lettuce production using two cropping systems. J. Clean Prod. 2021, 282, 124517. [Google Scholar] [CrossRef]
- Six, J.; Feller, C.; Denef, K.; Ogle, S.M.; Sá, J.C.M.; Albrecht, A.A. Soil carbon matter, biota and aggregation in temperate and tropical soils: Effects of notillage. Agronomie 2002, 22, 755–775. [Google Scholar] [CrossRef]
- Butterbach-Bahl, K.; Baggs, E.M.; Dannenmann, M.; Kiese, R.; Zechmeister-Boltenstern, S. Nitrous oxide emissions from soils: How well do we understand the processes and their controls? Philos. Trans. R Soc. B Biol. Sci. 2013, 368, 20130122. [Google Scholar] [CrossRef]
- Gao, H.; Tian, H.; Zhang, Z.; Xia, X. Warming-induced greenhouse gas fluxes from global croplands modified by agricultural practices: A meta-analysis. Sci. Total Environ. 2022, 820, 153288. [Google Scholar] [CrossRef]
- Alvares, C.A.; Stape, J.L.; Sentelhas, P.C.; de Moraes Gonçalves, J.L.; Sparovek, G. Köppen’s climate classification map for Brazil. Meteorol. Zeitschrift. 2013, 22, 711–728. [Google Scholar] [CrossRef]
- Soil Survey Staff. Keys to Soil Taxonomy, 13th ed.; USDA Natural Resources Conservation Service: Washington, DC, USA, 2022. [Google Scholar]
- Comissão de Química e Fertilidade do Solo (CQFS-RS/SC). Manual de Adubação e Calagem para os Estados do Rio Grande do Sul e de Santa Catarina, 11th ed.; Sociedade Brasileira de Ciência do Solo: Viçosa, Brazil, 2016. [Google Scholar]
- Teixeira, P.C.; Donagemma, G.K.; Fontana, A.; Teixeira, W.G. (Eds.) Manual de Métodos de Análise de Solo, 3rd ed.; Embrapa: Brasília, Brazil, 2017; 573p. [Google Scholar]
- Tedesco, M.J.; Gianello, C.; Bissani, C.A.; Bohnen, H.; Volkweiss, S.J. Análise de Solo, Plantas e Outros Materiais, 2nd ed.; Departamento de Solos da Universidade Federal do Rio Grande do Sul: Porto Alegre, Brazil, 1995; 174p. [Google Scholar]
- Mosier, A.; Wassmann, R.; Verchot, L.; King, J.; Palm, C. Methane and Nitrogen Oxide Fluxes in Tropical Agricultural Soils: Sources, Sinks and Mechanisms; Springer: Berlin/Heidelberg, Germany, 2004. [Google Scholar]
- Schirmann, J.; De Bastos, D.F.; Weiler, D.A.; Veloso, M.G.; Dieckow, J.; Carvalho, P.C.D.F.; Bayer, C. Nitrous oxide emission factor from cattle urine and dung in native grassland of the Pampa biome, South Brazil. Soil Res. 2020, 58, 198. [Google Scholar] [CrossRef]
- Siqueira Neto, M.; Venzke Filho, S.d.P.; Piccolo, M.d.C.; Cerri, C.E.P.; Cerri, C.C. Rotação de culturas no sistema plantio direto em Tibagi (PR): I-Sequestro de carbono no solo. Rev. Bras. Ciência Do Solo 2009, 33, 1013–1022. [Google Scholar] [CrossRef]
- IPCC. Mudança Climática 2021: A Base das Ciências Físicas; Masson-Delmotte, V., Zhai, P., Pirani, A., Connors, S.L., Péan, C., Berger, S., Caud, N., Chen, Y., Goldfarb, L., Gomis, M.I., et al., Eds.; Cambridge University Press: Cambridge, UK, 2021; 2391p, Available online: https://www.ipcc.ch/report/ar6/wg1 (accessed on 12 December 2024).
- EMBRAPA. Manual de Métodos de Análise de Solos, 2nd ed.; Embrapa Solos: Rio de Janeiro, Brazil, 2011; 230p. [Google Scholar]
- Da Veiga, M. Metodologia Para Coleta de Amostras e Análises Físicas do Solo; Boletim Técnico, 01; Embrapa/CNPSA: Florianópolis, Brazil, 2011. [Google Scholar]
- Sisti, C.P.J.; dos Santos, H.P.; Kohhann, R.; Alves, B.J.R.; Urquiaga, S.; Boddey, R.M. Change in carbon and nitrogen stocks in soil under 13 years of conventional or zero tillage in southern Brazil. Soil Tillage Res. 2004, 76, 39–58. [Google Scholar] [CrossRef]
- Yoder, R.E. A Direct Method of Aggregate Analysis of Soils and a Study of the Physical Nature of Erosion Losses. Agron. J. 1936, 28, 337–351. [Google Scholar] [CrossRef]
- Loss, A.; Basso, A.; Oliveira, B.S.; de Paula Koucher, L.; de Oliveira, R.A.; Kurtz, C.; Lovato, P.E.; Curmi, P.; Brunetto, G.; Comin, J.J. Total organic carbon and soil aggregation under a no-tillage agroecological system and conventional tillage system for onion. Rev. Bras. Cienc. Do Solo 2015, 39, 1212–1224. [Google Scholar] [CrossRef][Green Version]
- Ferreira, D.F. Sisvar: A Computer Analysis System To Fixed Effects Split Plot Type Designs. Rev. Bras. Biom. 2019, 37, 529–535. [Google Scholar] [CrossRef]
- Dodge, Y. Least Significant Difference Test, 1st ed.; Springer: New York, NY, USA, 2008. [Google Scholar] [CrossRef]
- Loss, A.; Ferreira, L.B.; Gonzatto, R.; Giumbelli, L.D.; Mafra, Á.L.; Goedel, A.; Kurtz, C. Efeito da sucessão ou rotação de culturas sobre a fertilidade do solo após sete anos de cultivo com cebola. Braz. J. Dev. 2020, 6, 16587–16606. [Google Scholar] [CrossRef]
- Wolschick, N.; Tondello Barbosa, F.; Bertol, I.; Fiorentin dos Santos, K.; de Souza Werner, R.; Bagio, B. Cobertura do solo, produção de biomassa e acúmulo de nutrientes por plantas de cobertura. Rev. Ciências Agroveterinárias 2016, 15, 134–143. [Google Scholar] [CrossRef][Green Version]
- Giumbelli, L.D.; Loss, A.; Kurtz, C.; Mafra, Á.L.; Piccolo, M.D.C.; Torres, J.L.R.; Lourenzi, C.R.; Brunetto, G.; Comin, J.J. Combinations of Plant Species for Rotation With Onion Crops: Effects on the Light Fraction, Carbon, and Nitrogen Contents in Granulometric Fractions of the Soil Organic Matter. J. Agric. Stud. 2021, 9, 202. [Google Scholar] [CrossRef]
- Prasad, J.V.N.S.; Rao, C.S.; Srinivas, K.; Jyothi, C.N.; Venkateswarlu, B.; Ramachandrappa, B.K.; Dhanapal, G.N.; Ravichandra, K.; Mishra, P.K. Effect of ten years of reduced tillage and recycling of organic matter on crop yields, soil organic carbon and its fractions in Alfisols of semi arid tropics of southern India. Soil Tillage Res. 2016, 156, 131–139. [Google Scholar] [CrossRef]
- Lima, C.E.; Guedes ítalo, M.R.; da Silva, J.; Alcântara, F.A.; Madeira, N.R.; Carvalho, A.D.F.; Fontenelle, M.R. Effects of Five Years Adoption of No-Tillage Systems for Vegetables Crops in Soil Organic Matter Contents. Agric. Sci. 2018, 9, 117–128. [Google Scholar] [CrossRef]
- Bayer, C.; Martin-Neto, L.; Mielniczuk, J.; Pavinato, A. Armazenamento de carbono em frações lábeis da matéria orgânica de um Latossolo Vermelho sob plantio direto. Pesqui Agropecuária Bras. 2004, 39, 677–683. [Google Scholar] [CrossRef]
- Palosuo, T.; Heikkinen, J.; Hilasvuori, E.; Kulmala, L.; Launiainen, S.; Lehtilä, A.; Liski, J. Demands and possibilities for field-scale estimation of agricultural greenhouse gas balances. Catena 2025, 249, 108649. [Google Scholar] [CrossRef]
- Assouline, S. Bulk Density of Soils and Impact on Their Hydraulic Properties. In Série Enciclopédia de Ciências da Terra; Springer: Berlin/Heidelberg, Germany, 2011; pp. 95–100. [Google Scholar] [CrossRef]
- Scavo, A.; Fontanazza, S.; Restuccia, A.; Pesce, G.R.; Abbate, C.; Mauromicale, G. The role of cover crops in improving soil fertility and plant nutritional status in temperate climates. A review. Agron. Sustain. Dev. 2022, 42, 93. [Google Scholar] [CrossRef]
- Guedes Filho, O.; da Silva, A.P.; Giarola, N.F.B.; Tormena, C.A. Structural properties of the soil seedbed submitted to mechanical and biological chiseling under no-tillage. Geoderma 2013, 204–205, 94–101. [Google Scholar] [CrossRef]
- Bassoi, L.H.; Soares, J.M. Relação Solo-Água-Planta. In Fruticultura Irrigada, 1st ed.; EMBRAPA: Brasília, Brazil, 2011; pp. 27–35. [Google Scholar]
- Thomazini, A.; Mendonça, E.S.; Souza, J.L.; Cardoso, I.M.; Garbin, M.L. Impact of organic no-till vegetables systems on soil organic matter in the Atlantic Forest biome. Sci. Hortic. 2015, 182, 145–155. [Google Scholar] [CrossRef]
- Freidenreich, A.; Dattamudi, S.; Li, Y.C.; Jayachandran, K. Soil Respiration and Carbon Balance Under Cover Crop in a no-Till Tropical Fruit Orchard. Front. Environ. Sci. 2021, 9, 766638. [Google Scholar] [CrossRef]
- Wang, Y.; Zhang, W.; Li, T.; Wang, C.; Zhao, X.; Cai, Z. Nitrous oxide emissions and denitrifier abundance in two agricultural soils amended with crop residues and urea in the North China Plain. Soil Tillage Res. 2022, 215, 105214. [Google Scholar] [CrossRef]
- Santos, T.d.L.; Barros, V.d.S.; Figueirêdo MCBd Nunes, A.B.d.A.; Gondim, R.S.; Silva, E.d.O.; Aragão, F.A.S.d.; Sousa, J.A.d. Pegada de Carbono de Produtos Agrícolas: Estudo de caso do Melão; Embrapa Agroindústria Tropical: Fortaleza, Brazil, 2013; 36p, Documentos/Embrapa Agroindústria Tropical, 143; Available online: https://www.infoteca.cnptia.embrapa.br/infoteca/handle/doc/982137 (accessed on 10 January 2025).
- Abdalla, M.; Hastings, A.; Cheng, K.; Yue, Q.; Chadwick, D.; Espenberg, M.; Truu, J.; Rees, R.M.; Smith, P. A critical review of the impacts of cover crops on nitrogen leaching, net greenhouse gas balance and crop productivity. Glob. Change Biol. 2019, 25, 2530–2543. [Google Scholar] [CrossRef] [PubMed]
- Tariq, A.; Menheere, N.; Gao, Y.; Brown, S.; Van Eerd, L.L.; Lauzon, J.D.; Bruun, S.; Wagner-Riddle, C. Increased N2O emissions by cover crops in a diverse crop rotation can be mediated with dual nitrification and urease inhibitors. Agric. Ecosyst. Environ. 2024, 374, 109178. [Google Scholar] [CrossRef]
- Lam, S.K.; Goodrich, J.P.; Liang, X.; Zhang, Y.; Pan, B.; Schipper, L.A.; Sulaeman, Y.; Nelson, L.; Chen, D. Mitigating soil greenhouse-gas emissions from land-use change in tropical peatlands. Front. Ecol. Environ. 2022, 20, 352–360. [Google Scholar] [CrossRef]
- La Scala, N.; Bolonhezi, D.; Pereira, G.T. Short-term soil CO2 emission after conventional and reduced tillage of a no-till sugar cane area in southern Brazil. Soil Tillage Res. 2006, 91, 244–248. [Google Scholar] [CrossRef]
- Smith, K.A.; Ball, T.; Conen, F.; Dobbie, K.E.; Massheder, J.; Rey, A. Exchange of greenhouse gases between soil and atmosphere: Interactions of soil physical factors and biological processes. Eur. J. Soil Sci. 2018, 69, 10–20. [Google Scholar] [CrossRef]
- Teixeira, C.E.; Torves, J.C.; Finotti, A.R.; Fedrizzi, F.; Marinho, F.A.M.; Teixeira, P.F. Estudos sobre a oxidação aeróbia do metano na cobertura de três aterros sanitários no Brasil. Eng. Sanit. E Ambient. 2009, 14, 99–108. [Google Scholar] [CrossRef]
- Vasconcelos, A.L.S.; Cherubin, M.R.; Feigl, B.J.; Cerri, C.E.P.; Gmach, M.R.; Siqueira-Neto, M. Greenhouse gas emission responses to sugarcane straw removal. Biomass Bioenergy 2018, 113, 15–21. [Google Scholar] [CrossRef]
- Song, H.J.; Lee, J.H.; Jeong, H.-C.; Choi, E.-J.; Oh, T.-K.; Hong, C.-O.; Kim, P.J. Effect of straw incorporation on methane emission in rice paddy: Conversion factor and smart straw management. Appl. Biol. Chem. 2019, 62, 70. [Google Scholar] [CrossRef]
- Filho, O.F.d.L.; Ambrosano, E.J.; Wutke, E.B.; Rossi, F.; Carlos, J.A.D. Adubação Verde e Plantas de Cobertura no Brasil: Fundamentos e prática, 1st ed.; EMBRAPA: Brasília, Brazil, 2014. [Google Scholar]
- Da Silva, R. Potencial da Mucuna Preta Como Adubo Verde Para o Arroz-de-Sequeiro em Latossolo Amarelo da Amazônia; Universidade de São Paulo: Piracicaba, Brazil, 2020. [Google Scholar] [CrossRef]
- Shao, H. Agricultural greenhouse gas emissions, fertilizer consumption, and technological innovation: A comprehensive quantile analysis. Sci. Total Environ. 2024, 926, 171979. [Google Scholar] [CrossRef] [PubMed]
- McClelland, S.C.; Paustian, K.; Schipanski, M.E. Management of cover crops in temperate climates influences soil organic carbon stocks: A meta-analysis. Ecol. Appl. 2021, 31, e02278. [Google Scholar] [CrossRef] [PubMed]
- Li, H.; Tan, X.; Guo, J.; Zhu, K.; Huang, C. Study on an Implementation Scheme of Synergistic Emission Reduction of CO2 and Air Pollutants in China’s Steel Industry. Sustainability 2019, 11, 352. [Google Scholar] [CrossRef]
- Rigon, J.P.G.; Calonego, J.C.; Pivetta, L.A.; Castoldi, G.; Raphael, J.P.A.; Rosolem, C.A. Using cover crops to offset greenhouse gas emissions from a tropical soil under no-till. Exp. Agric. 2021, 57, 217–231. [Google Scholar] [CrossRef]
Disclaimer/Publisher’s Note: The statements, opinions and data contained in all publications are solely those of the individual author(s) and contributor(s) and not of MDPI and/or the editor(s). MDPI and/or the editor(s) disclaim responsibility for any injury to people or property resulting from any ideas, methods, instructions or products referred to in the content. |
© 2025 by the authors. Licensee MDPI, Basel, Switzerland. This article is an open access article distributed under the terms and conditions of the Creative Commons Attribution (CC BY) license (https://creativecommons.org/licenses/by/4.0/).