Article

Cytological, Physiological and Genotyping-by-Sequencing Analysis Revealing Dynamic Variation of Leaf Color in Ginkgo biloba L.

by
Fangdi Li
1,†,
Yaping Hu
1,2,†,
Wenxuan Jing
1,3,†,
Yirui Wang
1,
Xiaoge Gao
1 and
Qirong Guo
1,*
1
Co-Innovation Center for Sustainable Forestry in Southern China, College of Forestry and Grassland, College of Soil and Water Conservation, Nanjing Forestry University, Nanjing 210037, China
2
Key Laboratory of Plant Innovation and Utilization, Institute of Subtropical Crops of Zhejiang Province, Zhejiang Academy of Agricultural Sciences, Wenzhou 325005, China
3
Wuwei Talent Exchange and Development Service Center, Wuwei 733099, China
*
Author to whom correspondence should be addressed.
These authors contributed equally to this work.
Horticulturae 2025, 11(4), 395; https://doi.org/10.3390/horticulturae11040395
Submission received: 10 March 2025 / Revised: 3 April 2025 / Accepted: 7 April 2025 / Published: 8 April 2025

Abstract

:
Ginkgo biloba has unique leaf color and high ornamental value. Here, we conducted seasonal dynamic analyses of leaf color, morphology, physiology, and biochemistry in the new variety Huangjinwanliang (HJWL), using the golden-leaf ginkgo Xiajin (XJ) as a control, and performed genotyping-by-sequencing (GBS) to explore genetic differences. The results showed that both varieties were golden-yellow leaves in spring and autumn, transitioning to green in summer. The total chlorophyll and carotenoid contents in HJWL (1.45~4.84 mg/g and 0.09~0.39 mg/g) were significantly higher than those in XJ (1.42~3.93 mg/g and 0.08~0.34 mg/g). HJWL exhibited a higher number of chloroplasts, with visible single lamellar thylakoids, whereas XJ had fewer chloroplasts. Chloroplast fluorescence and photosynthetic parameters indicated that HJWL possesses a greater capacity for light acclimatization. The total flavonoids and wax content of HJWL (16.67 ± 0.33 mg/g and 18.22 ± 0.15 mg/g) were significantly higher than those of XJ (14.15 ± 0.31 mg/g and 30.19 ± 0.18 mg/g). GBS analysis revealed distinct genome-wide molecular bases between HJWL and XJ. These findings demonstrate that HJWL’s leaf color and extended ornamental period make it a valuable landscape tree species for spring and autumn, suitable for promotion as an ornamental tree.

1. Introduction

Plant leaves are typically green, but golden, purple-red, and floral-white varieties also exist in nature, contributing to the diverse and colorful world of plants. Common examples of golden-leaf plants include Sophora japonica ‘Jinye’, Populus deltoides ‘Marsh’, Ligustrum lucidum ‘Vicaryi’, and Ulmus pumila ‘Jinye’ [1]. Research has shown that the formation of golden-leaf plants is not associated with nutrient deficiencies or growth variability caused by pests, diseases, droughts or floods [2]. Most Ginkgo biloba is green foliage during the spring and summer growing seasons, but some display a golden-yellow color, which is referred to in horticulture as golden-leaf ginkgo. Golden-leaf ginkgo was first discovered and grafted by farmers in Anlu, Hubei Province in the 1980s. Subsequently, it was developed, promoted and applied by fruit tree experts. After more than 40 years of cultivation, the variety XJ has been granted new plant variety rights (variety right number: 20080034), and Wannianjin has been approved as a national forest tree variety (variety number: S-SV-GB-008-2014), later renamed Changjin, and HJWL is its trade name. HJWL is a bud mutation variety of Ginkgo biloba, developed and bred by Nanjing Forestry University. Its leaves exhibit a golden-yellow color in spring, demonstrating high ornamental value. As the leaves mature, the color gradually changes from golden-yellow to yellowish-green, showing a “re-greening” phenomenon during midsummer. Golden-leaf ginkgo is widely distributed in eastern and northern China, and researchers have conducted transcriptomic and metabolomic studies to investigate the molecular mechanisms and dynamic regulatory networks underlying its leaf yellowing. These studies have confirmed that chlorophyll metabolism-related genes, chloroplast development and hormone metabolism play critical roles in leaf coloration [3,4,5]. However, in practical applications, it has been observed that golden-leaf ginkgo exhibits issues in late spring and early summer, such as leaves turning white and thin, with edges becoming withered and scorched, or rotten. These symptoms seriously affect tree growth and diminish its ornamental value.
The structure of plant leaves is closely linked to their photosynthetic efficiency, chloroplast distribution, stomata density, texture and coloration. In golden-leaf plants, the cells of the fenestrated tissues are broader and thicker, while the cells of the spongy tissues are sparsely arranged, with significant variation in cell thickness [6]. The variegated golden leaves of G. biloba ‘Variegata’ have significant differences in chloroplast structure, shape and size [7]. Leaf coloration is influenced by the type and composition of chlorophyll with the plant. For instance, the yellow coloration of XJ leaves has been attributed to an elevated ratio of carotenoids to chlorophyll b [3]. In the yellow-leaf mutant ginkgo, genes encoding chlorophyll degradation enzymes, non-yellow coloring 1 (NYC1), NYC1-like (NOL) and chlorophyllase (CLH), were upregulated in spring. By summer, HEMA, which encodes glutamyl-tRNA reductase (a key enzyme in chlorophyll biosynthesis), was downregulated, while CLH (involved in chlorophyll breakdown) remained upregulated. This imbalance between reduced biosynthesis and enhanced degradation led to lower chlorophyll accumulation, contributing to the mutant’s yellow phenotype [3]. Similarly, increased carotenoid-to-chlorophyll ratios have been observed in yellow leaves of Macadamia variety ‘HAES344′ and Acer palmatum [8,9], while the yellow coloration of Chrysanthemum morifolium Ramat is caused by chlorophyll deficiency [10]. Photosynthesis is fundamental to plant survival, and photosynthetic properties vary among different plant species under identical conditions. For example, dark green-leaf tomatoes exhibit higher chlorophyll content and greater photosynthetic rate [11]. In contrast, the yl20 (yellow leaf 20) mutant of eggplant (Solanum melongena L.) exhibits abnormal chloroplast ultrastructure, reduced chlorophyll and carotenoid content, and lower photosynthetic efficiency [12]. In Liquidambar formosana Hance, chloroplast numbers and sizes gradually decreased, thylakoid membranes became distorted, and chlorophyll synthesis was inhibited as external temperatures declined [13]. Chlorophyll fluorescence serves as an intrinsic probe of the photosynthetic mechanism, reflecting the physiological status of plant species and the subtle effects of external factors on their photosynthetic performance [14]. For example, the photosynthetic efficiency and chlorophyll content of Acer saccharum leaves decreased under certain conditions [15]. The tomato ylm mutant exhibits pronounced yellowing, reduced light energy absorption and capture efficiency, and impaired electron transport at lower temperature [16]. Similarly, the yellow leaf mutant of pak-choi (Brassica rapa L. ssp. chinensis) shows decreased photosynthetic activity and photochemical conversion efficiency [17].
Ginkgo is a medicinal plant, and the primary metabolites found in its leaves include flavonoids, terpene lactones, polypentenols and polysaccharides [18,19,20,21]. Research has demonstrated that the accumulation of flavonoids and flavonols in ginkgo contributes to pigment accumulation [22]. Flavonoids are also identified as the main metabolites responsible for the yellowing of rice [23]. In contrast, high-pigment tomatoes showed significantly lower soluble content compared to cherry tomatoes [24]. Studies on Quercus suber have exhibited no significant differences in leaf traits such as leaf area, leaf size, photosynthetic pigment content and cuticular wax layer that contributed to forming a nearly impermeable membrane that helps the plant cope with drought conditions [25].
Genotyping-by-sequencing (GBS) is the process of obtaining single-nucleotide polymorphism (SNP) information and genotyping in plants by second-generation sequencing [26]. The genetic structure, kinship and inbreeding prediction of 102 cultivated germplasms of ginkgo were analyzed by simplified genome sequencing [27]. Similarly, GBS was used to explore the genetic diversity and structure of 103 distinct Clematis samples [28].
The variety HJWL, characterized by its absence of burnt leaf edges, represents an upgraded variety of gold-leaf ginkgo. Its unique leaf coloration traits hold significant ornamental value for garden applications. However, comprehensive studies on the traits of the HJWL variety remain limited. This study intends to determine the following: (1) ultrastructural differences in chloroplasts that contribute to distinct coloration phenotypes; (2) physiological parameters related to leaf scorch in XJ; and (3) the genetic basis of these differences through GBS analysis. This research aims to provide a deeper understanding of the characteristics of HJWL, enrich the genetic resources of golden-leaf ginkgo varieties, and establish a foundation for cultivating higher-quality ornamental ginkgo varieties.

2. Materials and Methods

2.1. Plant Material

In this study, five healthy 7-year-old grafted G. biloba ‘Huangjinwanliang’ (HJWL) trees with golden leaves were selected as samples. The ginkgo varieties used were HJWL and ‘Xiajin’ (XJ), which exhibits traits similar to HJWL and grows under natural conditions without special treatment. Five healthy XJ plants were chosen as the control. Both HJWL and XJ were cultivated in the Golden Leaves Ginkgo Germplasm Resources Garden (30°53′ N, 118°04′ E) (Figure S1), located in Tiefu Town, Pizhou City, Jiangsu Province. HJWL and XJ leaves located on the same short shoot of trees were collected from March to November in 2022 (Figure 1).

2.2. Leaf Anatomical Characters

2.2.1. Light Microscope Observation

The anatomical characteristics of HJWL leaves were studied using the conventional paraffin sectioning method. The material was fixed in FAA solution (5% formalin, 5% acetic, and 90% alcohol) for 24 h at 4 °C. The paraffin sections with a thickness of 5 µm were prepared, stained with toluidine blue and sealed with neutral resin. The sections were observed with a light microscope (Leica DM2000 LED, Wetzlar, Germany).

2.2.2. Scanning Electron Microscope Observation

The leaves from HJWL and XJ were cut into small pieces, no more than 1 mm2 in size. The sample surfaces were gently rinsed with PBS (Servicebio, G0002, Wuhan, China) and quickly fixed in 4% glutaraldehyde at room temperature for 2 h. Subsequently, the samples were dehydrated with ethanol series (30%–50%–70%–80%–90%–95%–100%), dried at the critical point, fixed on SEM aluminum roots with double-sided carbon tape and coated with gold. Images were captured with a Hitachi SU8100 scanning electron microscope (HITACHI, Tokyo, Japan).

2.2.3. Transmission Electron Microscopic Observation

Samples dissected from the HJWL and XJ leaves were cut into smaller sections approximately 0.5 mm2 in size, pre-fixed in 4% glutaraldehyde for 24 h at 4 °C, washed three times with 0.1 M phosphate buffer for 15 min each time and post-fixed in 1% OsO4 for 2 h. Then, the samples were dehydrated, embedded and polymerized [7]. For ultrastructural observations, 70 nm thick sections were cut using a Leica EMUC7 ultramicrotome (Leica Microsystems GmbH, Wentzler, Germany) and stained with 2% uranyl acetate and 2.6% lead citrate. Finally, the leaves’ ultrastructure was observed and photographed using a HITACHI HT7800 transmission electron microscope (HITACHI, Tokyo, Japan).

2.3. Determination of Physiological and Secondary Metabolite

The leaf color parameters were measured with a X-Rite colorimeter (Ci 64, Xrite Pantone, Grand Rapids, MI, USA). The brightness parameter (L*) indicated whether the color was light or dark, and the larger the value, the brighter the color. The red-green phase value (a*) changed from negative to positive, indicating that the color changed from green to red. The yellow-blue value (b*) changed from negative to positive, indicating that the color changed from blue to yellow. For each plant, leaves were chosen in the same place, and the process was repeated three times.
The chlorophyll in ginkgo leaves was extracted by the 95% ethanol extraction method, and its content was calculated by a spectrophotometer (UVmini-1240, Shimadzu, Kyoto, Japan) [29]. Carotenoid components were determined by high-performance liquid chromatography (HPLC).
A CIRAS-3 portable photosynthesis system (PP Systems, Amesbury, MA, USA) was used to measure the photosynthetic characteristics, light response curves and diurnal variation in photosynthesis of the functioning leaves from HJWL and XJ. The LED light source’s photosynthetically effective radiation was 1200 μmolm−2 s−1, with 90% red light, 5% blue light and 5% white light. The light intensity was set to 1000 µmol·m−2·s−1, the CO2 concentration in the reference chamber was 380 µmol·mol−1 and the leaf temperature was 25 °C. The fully functional leaves were measured at the 3rd–5th nodes of the upper part of the plantlet on the morning of sunny day (8:00–11:00).
The chlorophyll fluorescence parameters were measured by a FMS-2 Pulse Modulated Fluorometer (Hansatech, Pentney, UK) at 8:00–10:00 on sunny mornings. The 10 functional leaves from the 4th to 7th position of the upper part of the plantlets were selected and adapted to darkness for 30 min. The time difference in leaf adaptation was 2 min. After a certain time, the basic fluorescence parameters were determined with a light intensity of 3000 µmol·m−2·s−1. Chlorophyll fluorescence was measured in approximately one-third of the leaf tip, avoiding the leaf veins. For each measurement, a detachable leaf clip (Hans Scientific Instruments Co., Ltd., Shenzhen, China) was placed on a leaf, and the fluorescence probe was positioned perpendicular to the surface of the leaf clip. The fluorescence signal was displayed with a temporal resolution of 10 µs. At the beginning of the measurement, weak light of 2–3 µmol quantum m−2 s−1 was irradiated onto the upper epidermis. A saturated light pulse of 3500 µmol quantum m−2 s−1 was emitted with a peak wavelength of 627 nm for 1 s. And each index was repeated six times.
The mature leaves of each plant were collected for the determination of flavonoid content, which was repeated six times. The flavonoid and ginkgolide contents of ginkgo were measured using HPLC [30]. The soluble sugar content in ginkgo leaves was measured using the anthrone colorimetric method [31] and wax content was determined by gravimetric analysis [32].

2.4. Genotyping-by-Sequencing

HJWL, XJ and eight other fresh leaf samples were randomly selected from the ginkgo germplasm bank for GBS genome analysis (Table S1). DNA was extracted from ten frozen ginkgo leaves using the CTAB method [33]. DNA quality was assessed using an Agilent 2100 Bioanalyzer (Agilent Technologies, Inc., Santa Clara, CA, USA). The GBS library sequencing was performed on the Illumina sequencing platform by Gene de novo Biotechnology Co., Ltd. (Guangzhou, China). The raw sequencing data have been submitted to the National Genomics Data Center (NGDC) with the accession number CRA006613. Sequencing was carried out using the PE 150 strategy on a Novaseq 6000 sequencer (Illumina, San Diego, CA, USA). The raw data were filtered by FASTP (v 0.18.0) [34], and filtered reads were aligned to the ginkgo reference genome [35] using the mem algorithm of BWA (v 0.7.12) [36] with the alignment parameter of -k 32 -M. Alignment results were tagged using the Picard (v 1.129). SNP detection was performed using GATK [37] (v. 3.4-46), and functional annotation of the detected variant was performed using ANNOVAR (v. 2) [38]. ADMIXTURE [39] (v. 1.3.0) was used to analyze the genetic structure of ten ginkgo materials. The cluster with the smallest cross-validation error was selected as the best K value. TreeBeST [40] (v 1.9.2) was used to construct the phylogenetic tree. GCTA [41] (v. 1.92.2) was used for principal component analysis (PCA).

2.5. Data Processing

All raw data were organized using Microsoft Excel 2021, statistical analyses were performed using SPSS 24.0, and plots were generated with Origin 2024b and R (v4.2.0). The significance of the differences between HJWL and XJ were assessed using an independent sample t-test, with a significance level of p < 0.05.

3. Results

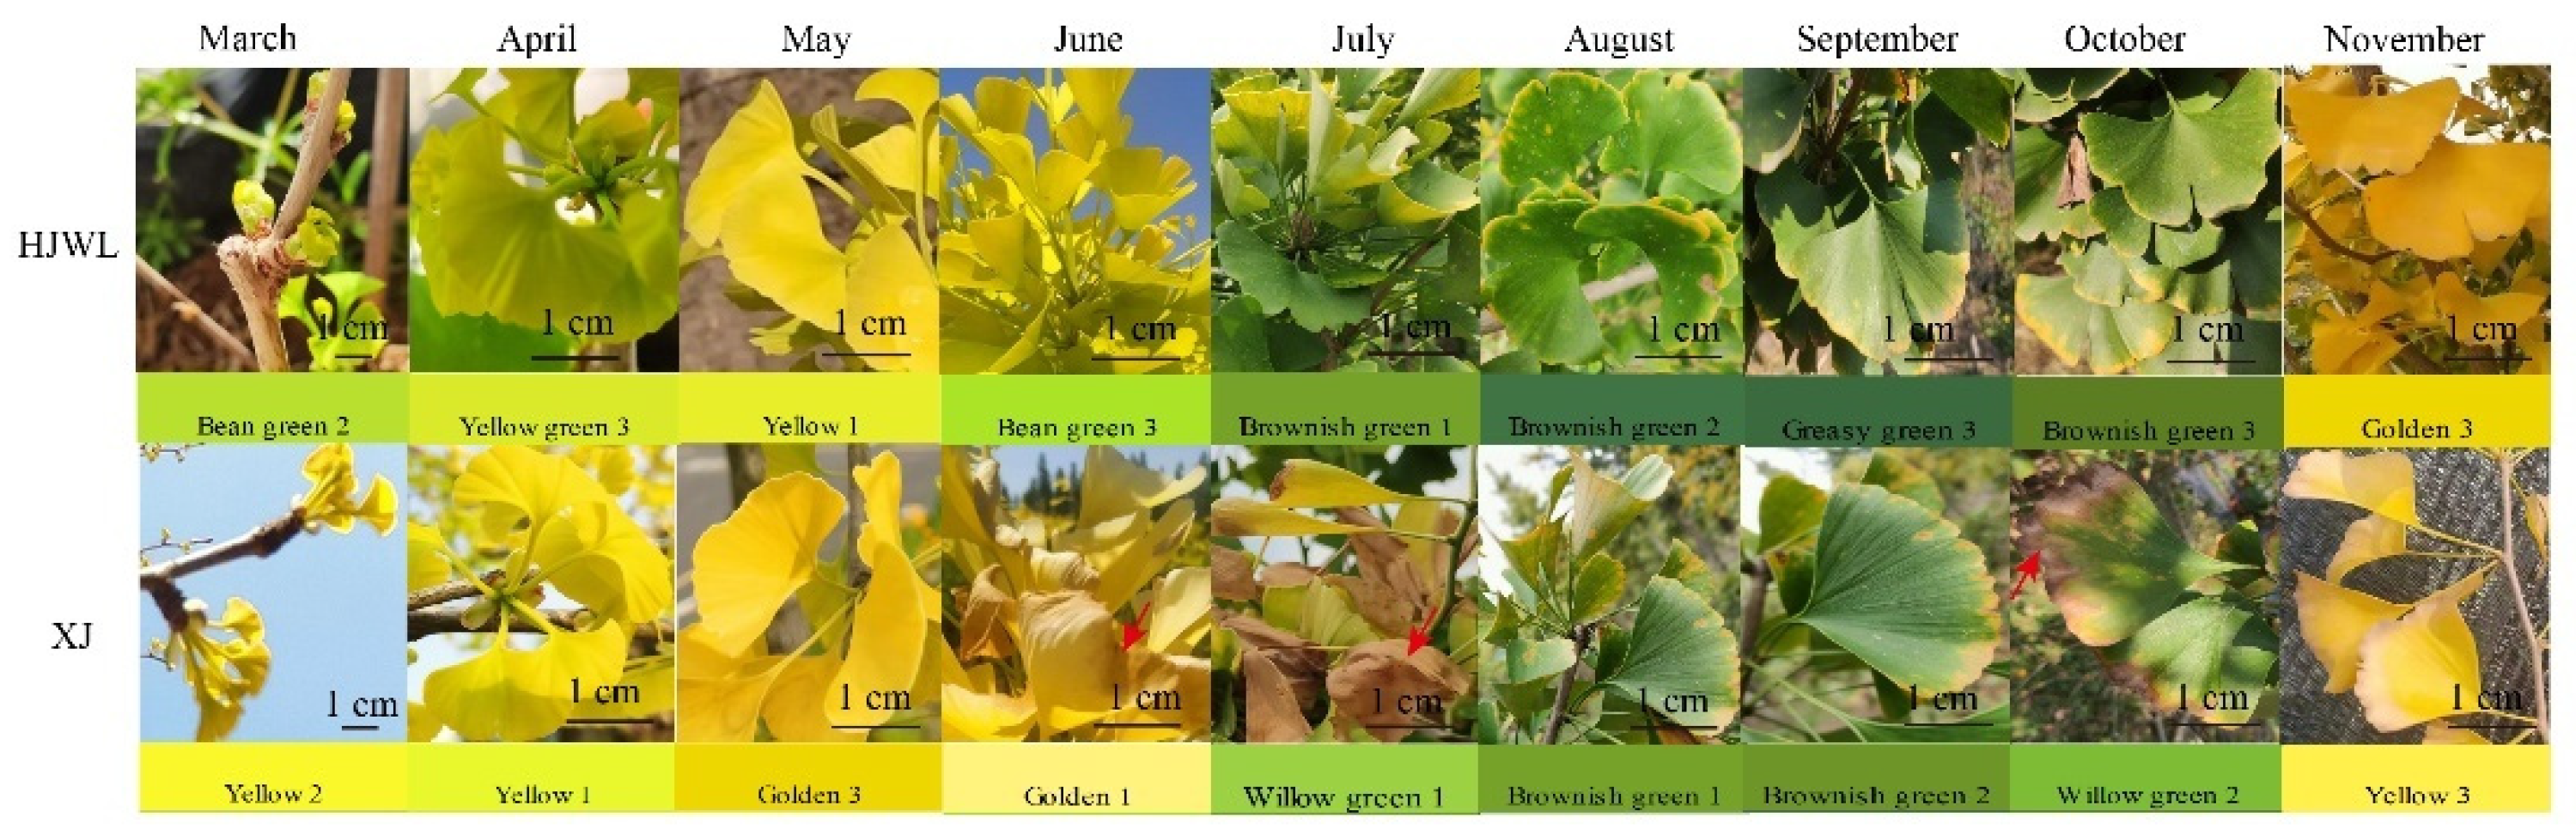
3.1. Seasonal Dynamic Changes in Ginkgo Leaf Color

To quantitatively describe the seasonal dynamics of leaf coloration in HJWL and XJ, the color differences L*, a* and b* were measured by a colorimeter. The L* represents the color lightness, where higher values indicate greater brightness and lower values correspond to darker shades. Significant differences in L* values were observed between HJWL and XJ, but the overall trend is down-up (Figure 2a). Throughout the leaf development period, the L* values gradually decreased during summer, reached their minimum in late September and increased to their maximum in November. The a* value, representing the red-green color ratio, demonstrated that higher values indicate stronger red coloration and weaker green tones. During leaf development, HJWL exhibited an up-down-up trend in a* values, reaching its maximum in November, with intensified green coloration, and its minimum in July, with reduced green intensity. In contrast, XJ reached its maximum a* value in May, with diminished green intensity, and its minimum in September, with enhanced green coloration (Figure 2b). The b* value, indicating the yellow-blue color ratio, revealed that higher values correspond to deeper yellow tones, while lower values represent stronger blue coloration. HJWL displayed an overall downward-upward trend in b* values, peaking in May, with intensified yellow coloration, and reaching its minimum in September, with lighter yellow tones. Similarly, the b* values for XJ reached their maximum in April, with enhanced yellow coloration, and their minimum in August, with reduced yellow intensity (Figure 2c). According to the L*, a* and b* values, leaf color changes were systematically described using the RGB color model corresponding to the RAL international standard color chart (Figure S2). Comparative analysis between the color difference and morphological observation in HJWL and XJ revealed that the primary stages of leaf color transformation were consistent with the measured color differences (Figure 1).

3.2. Seasonal Dynamic Changes in Pigment Content in Ginkgo Leaves

The change in total chlorophyll (Chl T) content in plant leaves will directly affect the color of leaves, with higher concentrations resulting in deeper green and lower concentrations leading to lighter shades. In July, the Chl T content of HJWL peaked at 4.841 ± 0.13 mg·g−1 FW (Figure 3a), while it reached its lowest value of 1.483 ± 0.069 mg·g−1 FW in November. The Chl T content of HJWL was significantly higher than that of XJ in April, June and July but significantly lower in September and November. For XJ, the Chl T content reached its maximum of 3.932 ± 0.38 mg·g−1 FW in July and reached its minimum of 1.422 ± 0.095 mg·g−1 FW in May. The chlorophyll a (Chl a) content of HJWL decreased to the lowest value of 0.714 ± 0.045 mg·g−1 FW in May (Figure 3b) and peaked at 3.273 ± 0.07 mg·g−1 FW in July. It was significantly higher than that of XJ in April, July and October but significantly lower in September. The Chl a content of XJ decreased to the lowest value of 0.642 ± 0.079 mg·g−1 FW in April and reached the highest value of 2.573 ± 0.26 mg·g−1 FW in July. The chlorophyll b (Chl b) content exhibited a trend similar to that of Chl a, showing a down-up-down trend (Figure 3c). HJWL reached the highest Chl b value of 1.573 ± 0.056 mg·g−1 FW in July and the lowest value of 0.488 ± 0.054 mg·g−1 FW in November. It was significantly higher than XJ in April, June and July but significantly lower from September to November. XJ reached the highest Chl b value of 1.364 ± 0.13 mg·g−1 FW in July and the lowest value of 0.53 ± 0.036 mg·g−1 FW in June. The carotenoid content of HJWL peaked at 0.393 ± 0.023 mg·g−1 FW in July (Figure 3d) and reached the lowest value of 0.09 ± 0.006 mg·g−1 FW in May. It was significantly higher than that of XJ from July to November. The carotenoid content of XJ reached its maximum of 0.338 ± 0.064 mg·g−1 FW in September and reached its minimum of 0.068 ± 0.009 mg·g−1 FW in April (Figure 3d).

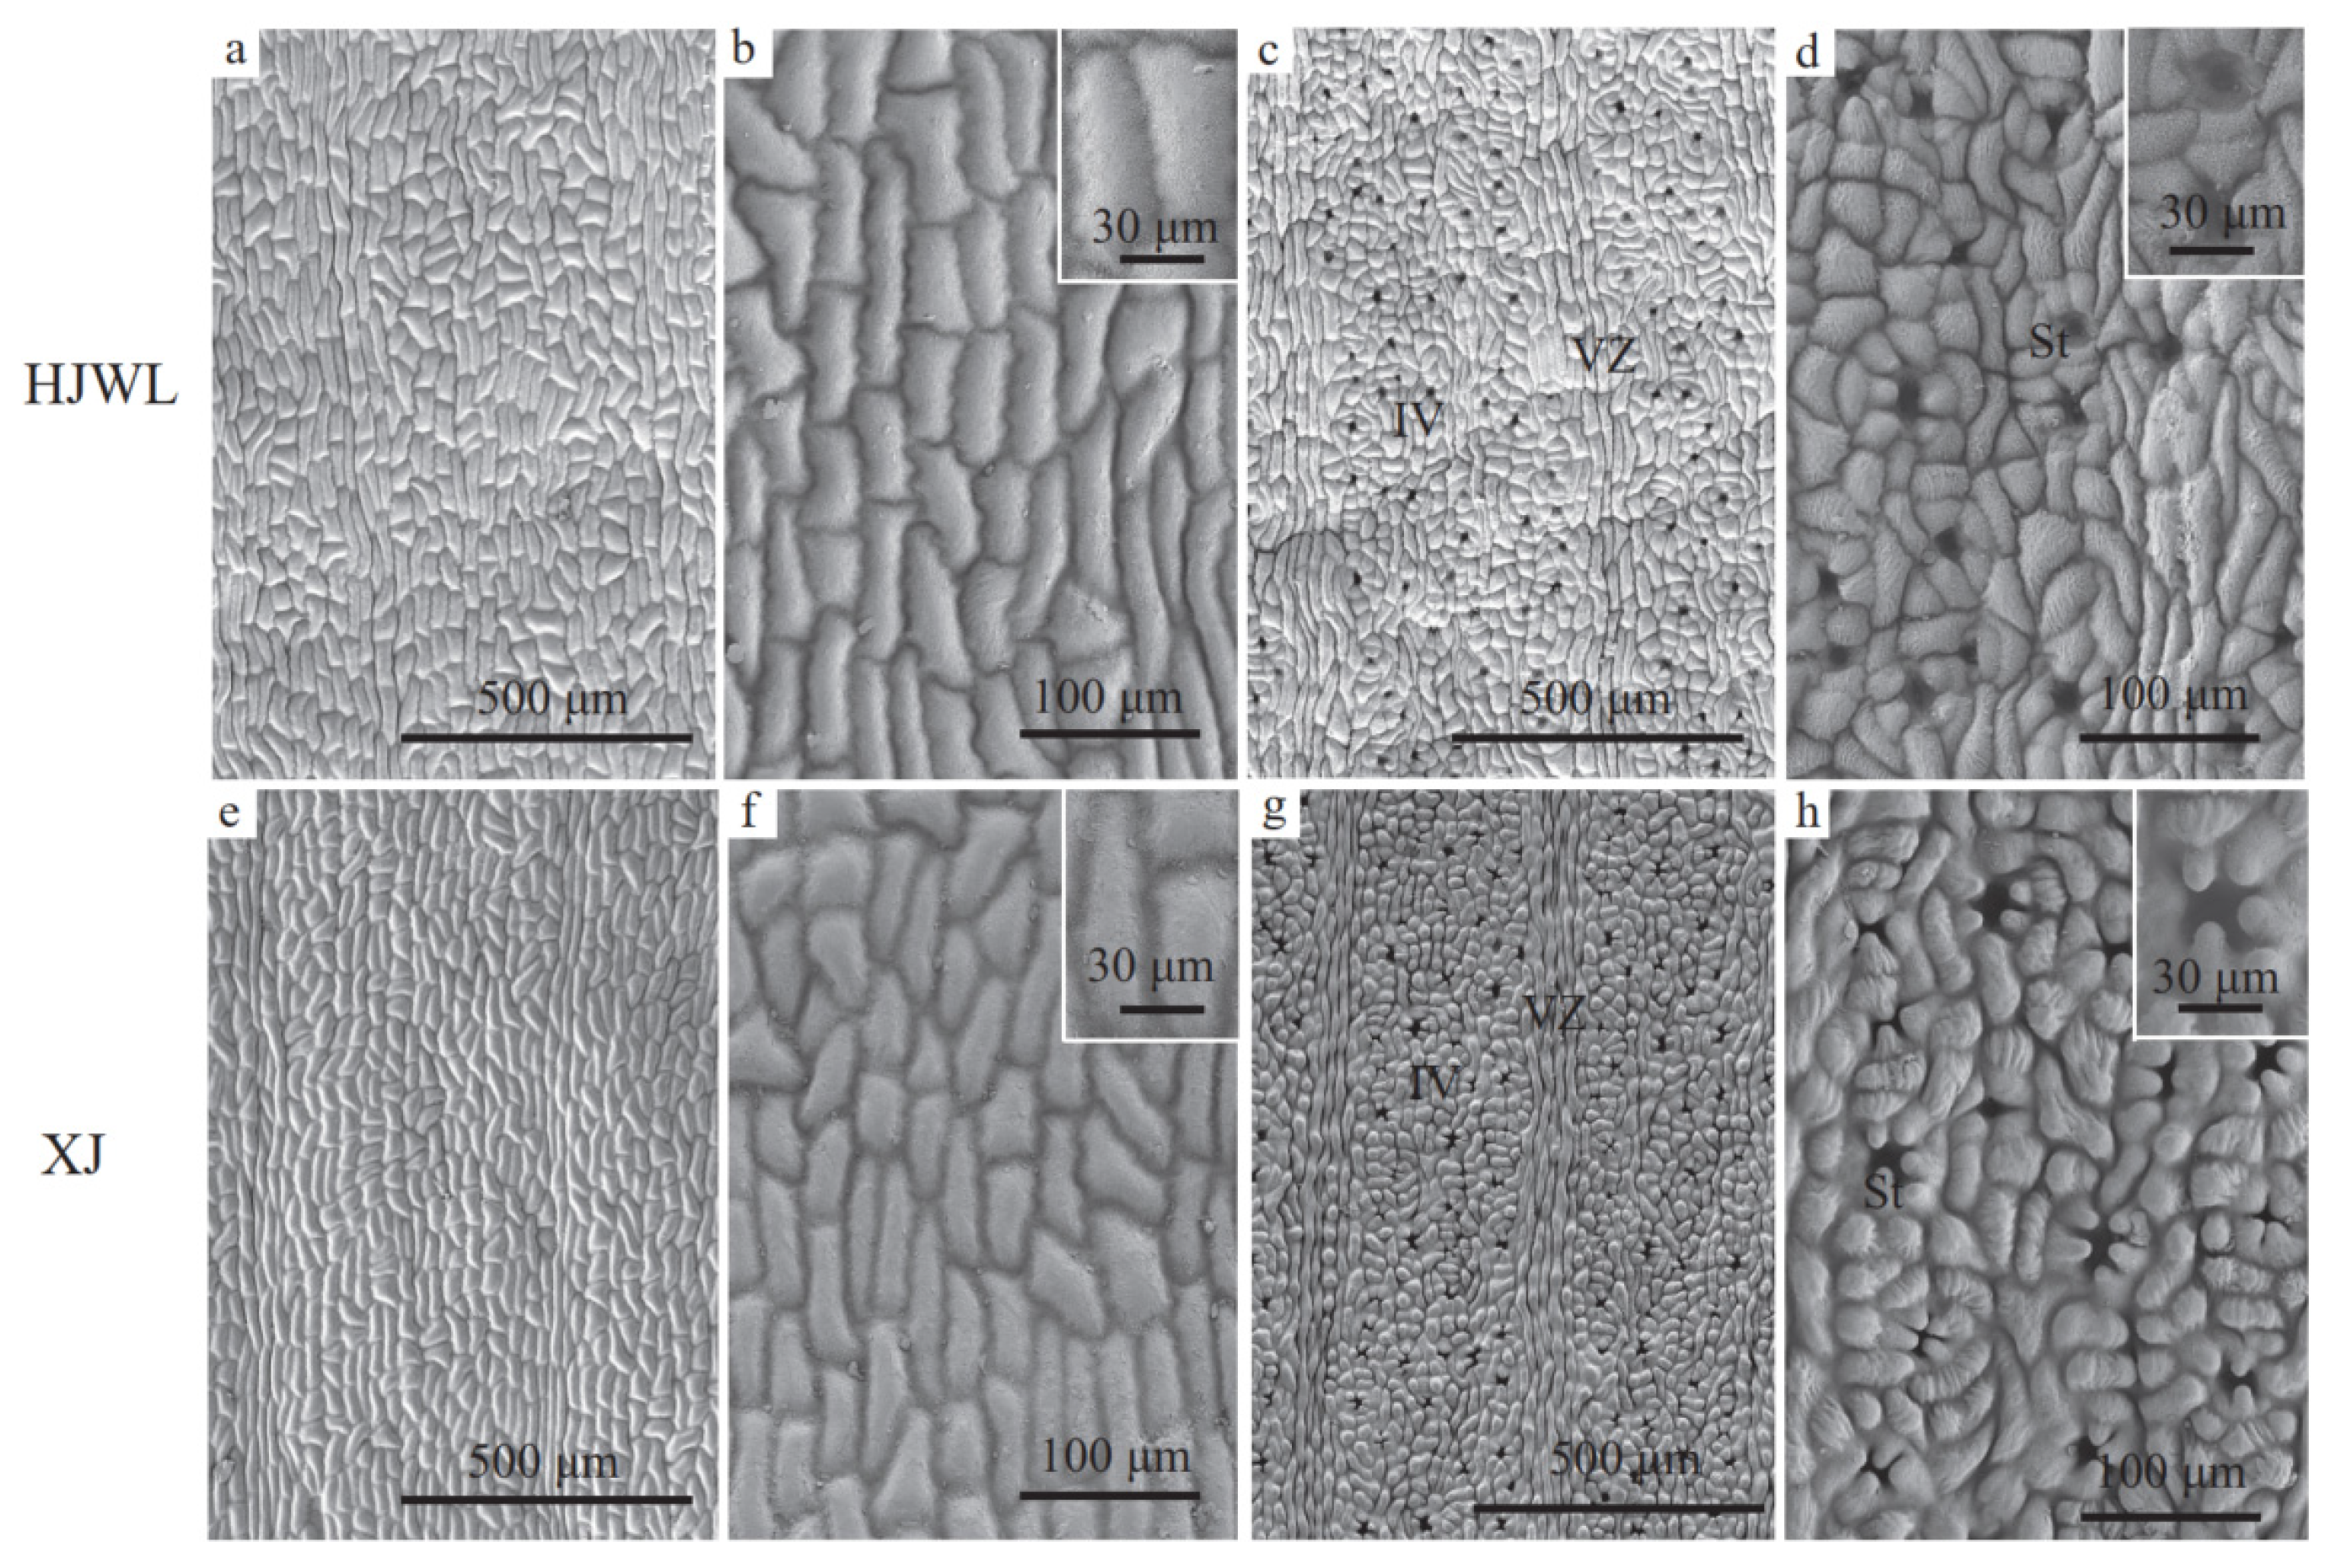
3.3. Phenotypic Characteristics in HJWL Leaves

The transverse anatomical structure of Ginkgo biloba leaves, from top to bottom, consists of upper epidermis, palisade tissue, spongy tissue and lower epidermis. The upper and lower epidermal cells of HJWL were single-layered, elongated vertically and arranged closely in June, with dimensions larger than that of XJ. By August, the epidermal cells of HJWL had decreased in size (Figure 4a–f). The HJWL palisade tissue was also composed of a single layer of closely packed cells (Figure 3a,b), while the palisade tissue of XJ exhibited dense cytoplasmic content (Figure 4e,f). The sponge tissue cells of HJWL were irregularly shaped and loosely arranged. In August, the palisade tissue thickened and the gap of sponge tissue increased (Figure 4c,d). The cell boundary between palisade tissue and spongy tissue of XJ was blurred in August, with cells showing signs of disintegration (Figure 4g,h).
The ultrastructural scanning electron microscopy (SEM) analysis revealed no significant morphological differences between the upper and lower epidermal cells of HJWL and XJ. The upper epidermal cells exhibited smooth and uplifted structure, with their long axis aligned parallel to the vein direction (Figure 5a,b,e,f). A large number of stomata were observed in the interveinal regions, while cells in the vein area exhibited gradual elongation and were devoid of stomatal distribution (Figure 5c,g). The periclinal wall of HJWL epidermal cells appeared relatively smooth, whereas in XJ, the subsidiary cells surrounding the stomata protruded outward, forming an elongated mastoid shape that covered the stomata with an inward-curved bulge (Figure 5d,h).
The ultrastructural transmission electron microscope (TEM) analysis of leaves showed that HJWL exhibited earlier leaf development and more advanced thylakoid membrane formation compared to XJ. In May, the chloroplasts of both HJWL and XJ displayed a similar rounded morphology, containing osmiophilic particles within the stroma, with thylakoids stacked into a grana structure. The chloroplast structure of HJWL was complete, the starch granules were significantly higher than that of XJ (Table S2), and the lamellar structure was more closely arranged than that of XJ (Figure 6a,d,g,j,m,p). In June, the chloroplasts in both ginkgo varieties were ellipsoidal, showing a notable increase in size compared to the previous month. The content of HJWL osmiophilic granules increased significantly, and there were large starch granules (Table S2). The thylakoids were closely arranged and stacked to form a grana structure. The chloroplast lamellae in the leaves of XJ were not obvious, and a large number of osmiophilic particles were accumulated in the matrix (Figure 6b,e,h,k,n,q). In July, the chloroplasts of both ginkgo varieties were oval, and the content of internal starch granules decreased. The content of osmiophilic granules in HJWL was significantly reduced, and the thylakoid lamellar structure was reduced, but the structure was clear and the grana structure was not obvious. The content of osmiophilic granules in XJ was higher than that in HJWL (Table S2), and the thylakoid lamellar structure was clear (Figure 6c,f,i,l,o,r).

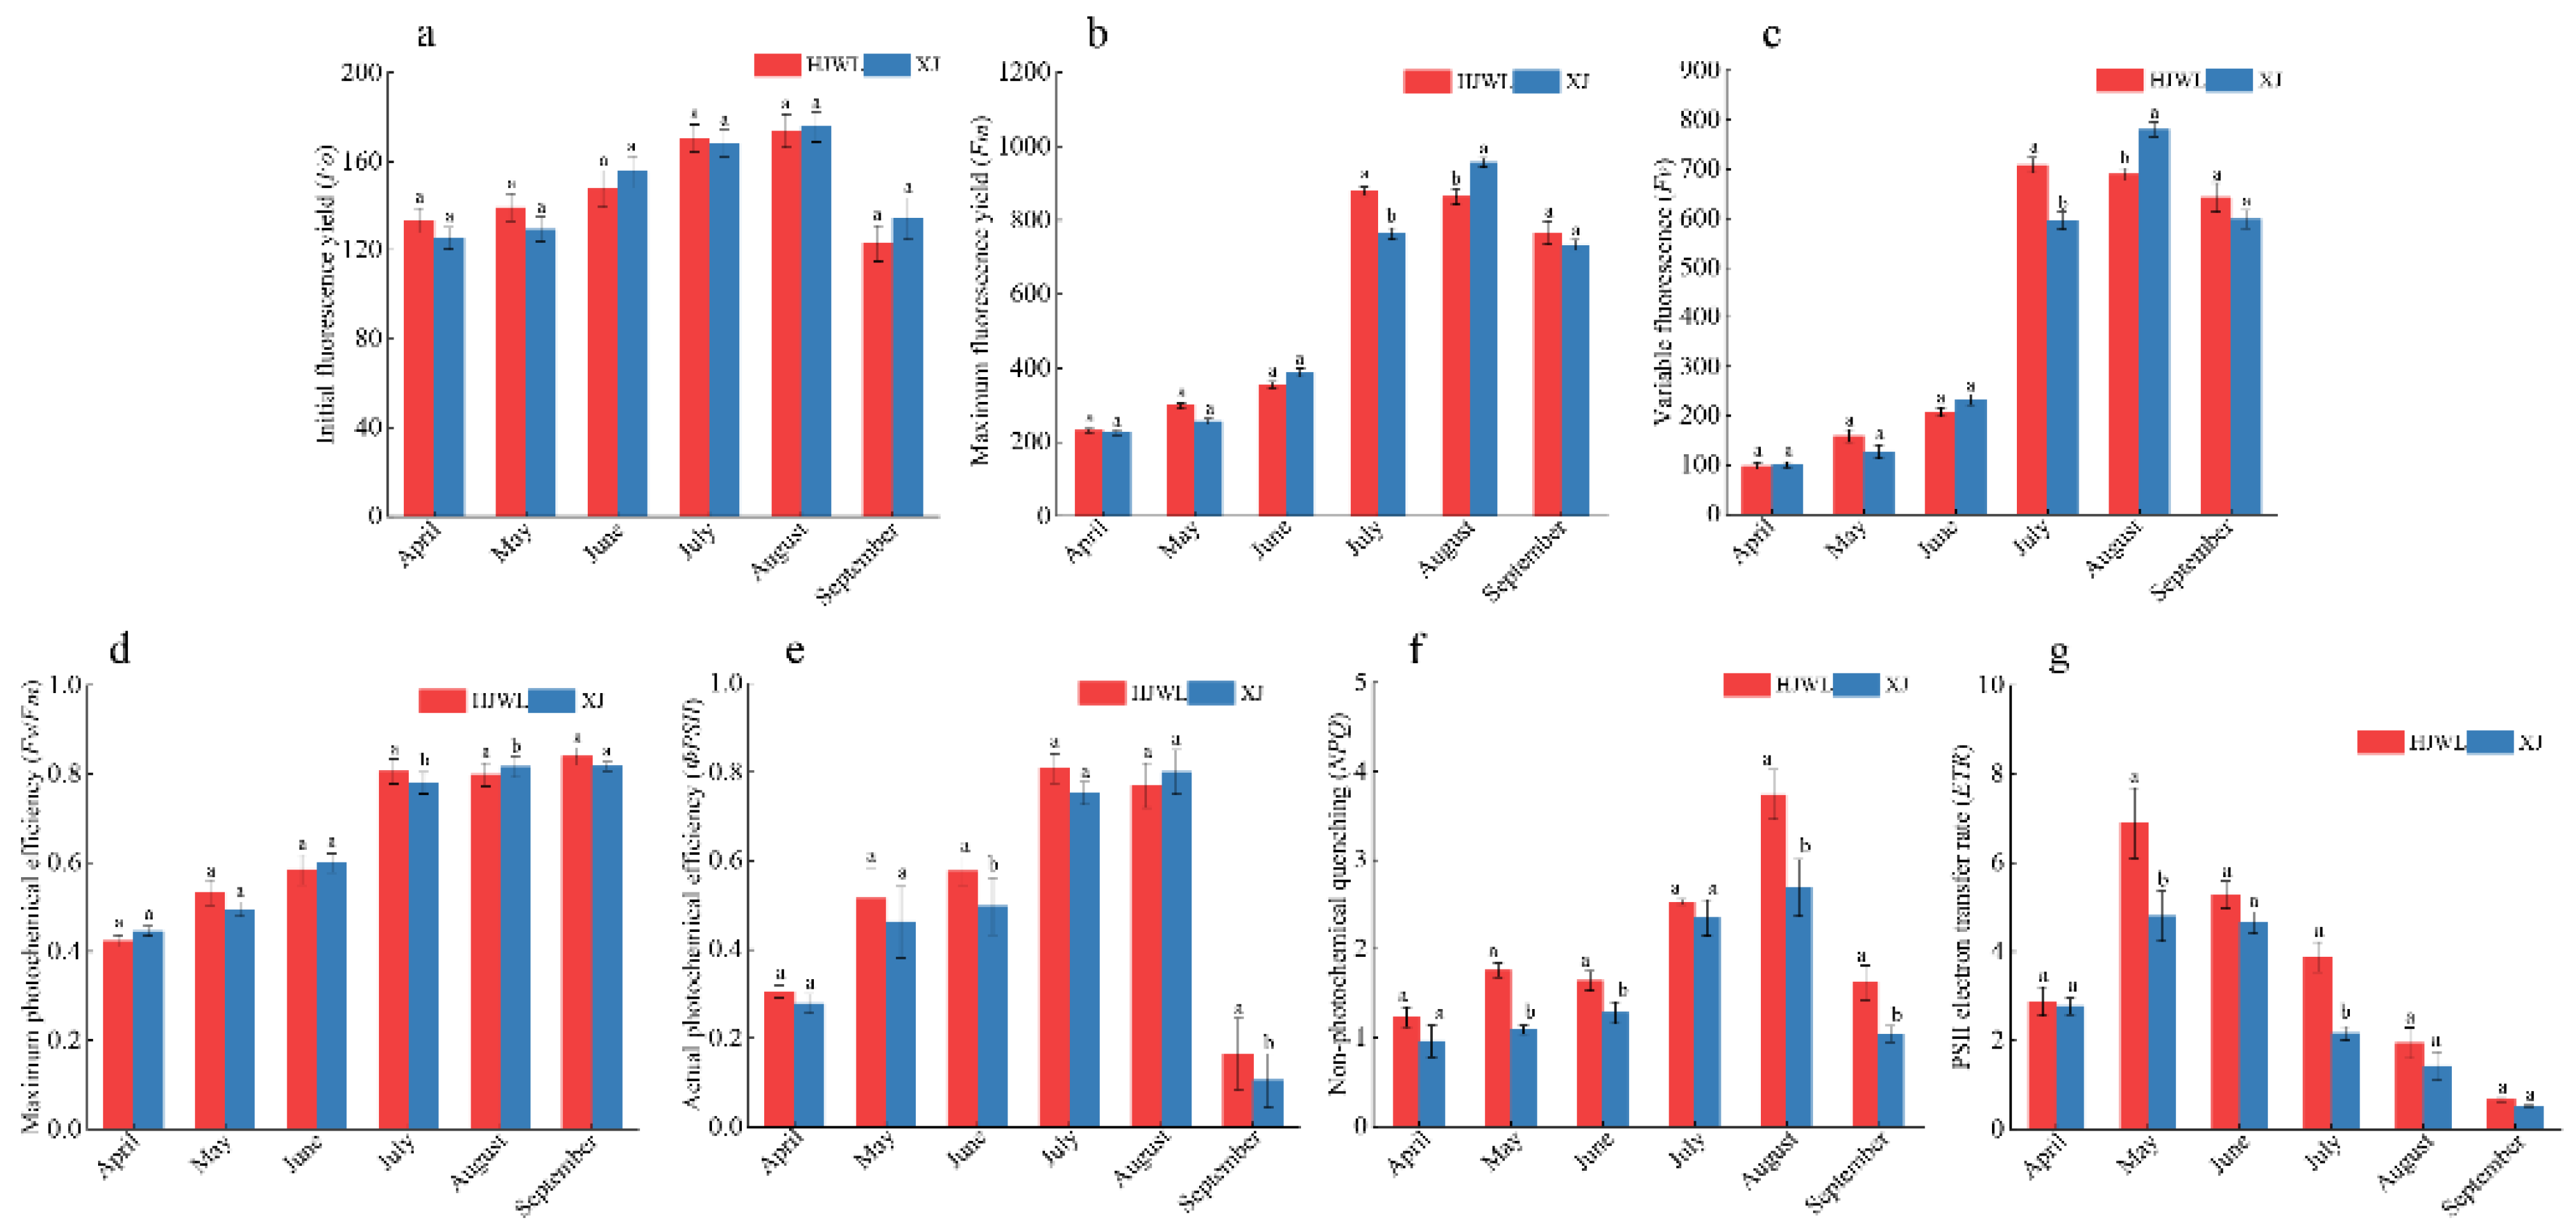
3.4. Chlorophyll Fluorescence Parameters of Ginkgo

The initial fluorescence yield (FO) represents the fluorescence yield when the PSII reaction center is completely open. The FO of HJWL and XJ showed a rising–falling trend in different periods, with an increase observed from April to August followed by a decrease in September (Figure 7a). The maximum fluorescence yield (Fm) corresponds to the fluorescence yield when the PSII reaction center is completely closed. The variation trend of Fm in HJWL and XJ was similar to that of FO (Figure 7b). The Fm of HJWL was significantly higher than that of XJ in July but significantly lower in August (Figure 7b). The variable fluorescence (Fv) results by subtracting FO from Fm. The Fv of HJWL was significantly higher than that of XJ in July, but significantly lower in August (Figure 7c). The maximum photochemical efficiency (Fv/Fm) reflects the conversion efficiency of PSII primary light and serves as an indicator of plant health. Lower Fv/Fm values suggest impaired photosynthesis and poorer plant health under severe stress conditions. The Fv/Fm of HJWL was significantly higher than that of XJ in June but significantly lower in August (Figure 7d). The actual photochemical efficiency (ΦPSII), which represents the actual light energy conversion efficiency of leaves, showed an overall upward–downward trend for both HJWL and XJ (Figure 7e). A higher light energy conversion efficiency was observed in HJWL in June and September compared to XJ. The fluorescence quenching coefficient (NPQ), an effective indicator of light protection, exhibited a rise–fall trend for both HJWL and XJ (Figure 7f). HJWL had significantly higher NPQ values than that of XJ in May, June, August and September. The PSII electron transport rate (ETR), which reflects the capacity of photosynthetic electron transport, also showed a rising–falling trend for both varieties (Figure 7g). HJWL showed a significantly higher ETR than that of XJ in May and July.

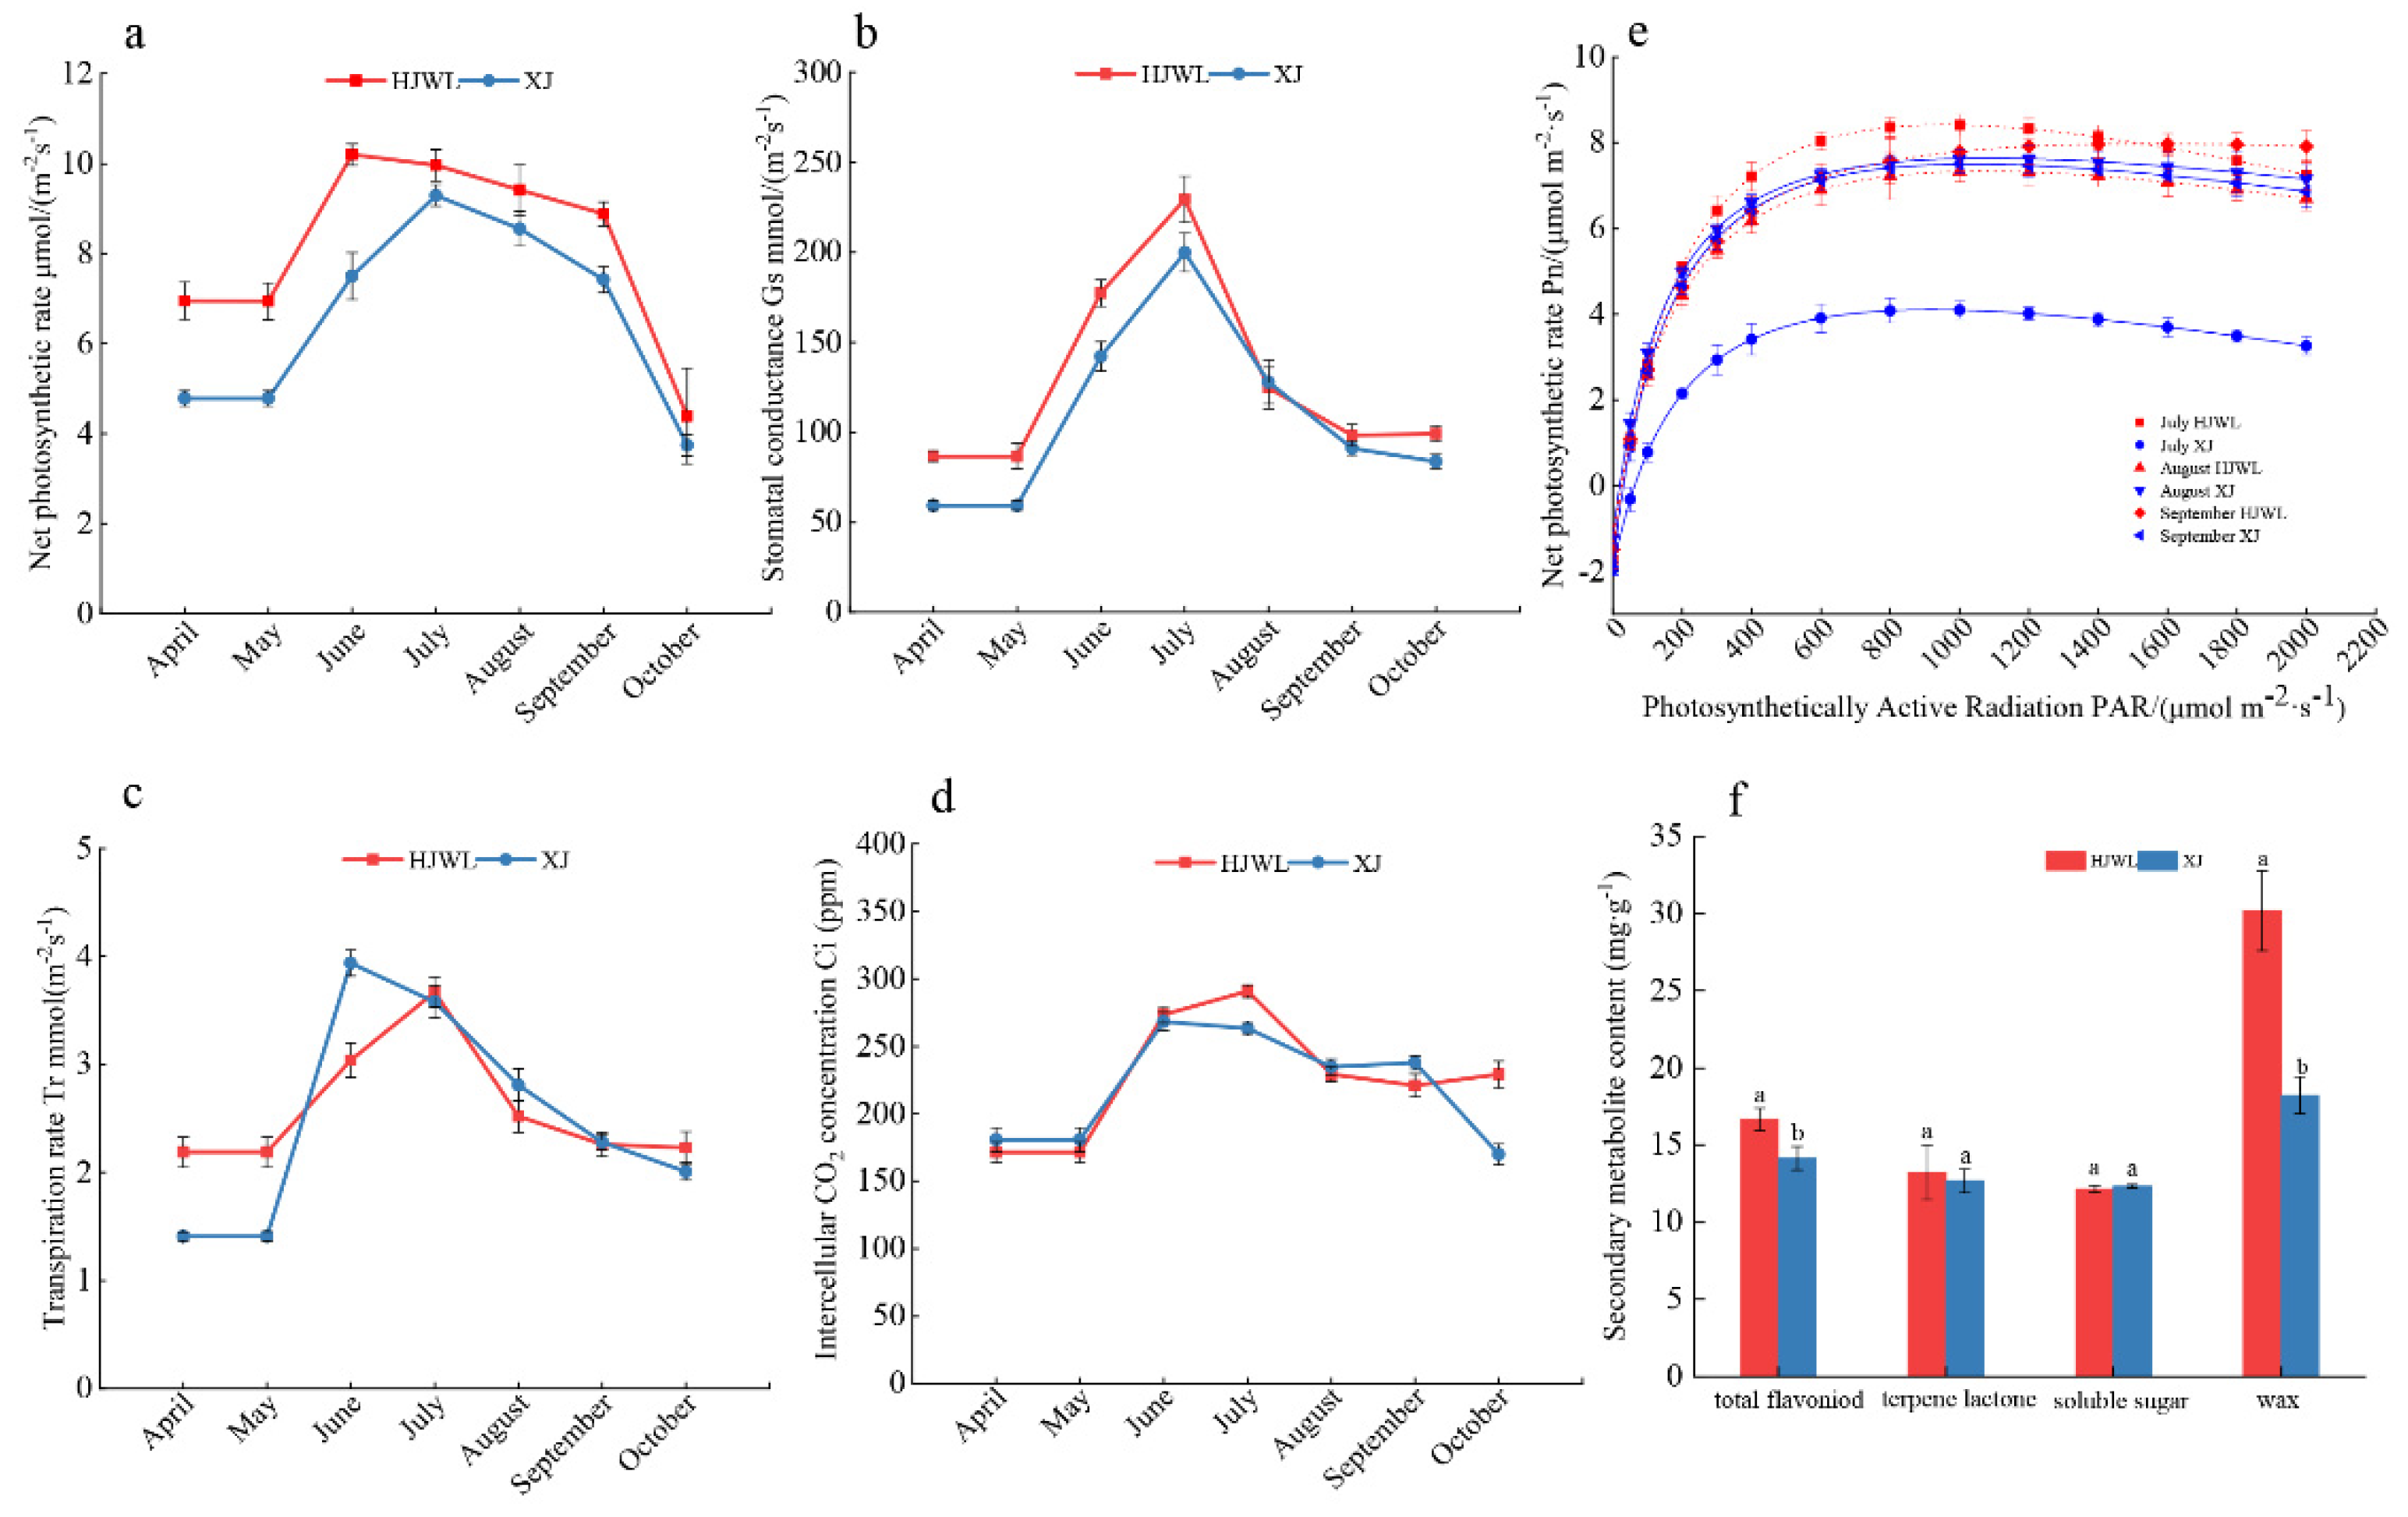
3.5. Comparison of Photosynthetic Physiology and Metabolites

Photosynthesis serves as the primary source of energy for plant growth, with its intensity reflecting the developmental capacity of plants. Analysis of photosynthetic parameters in HJWL and XJ revealed that the net photosynthetic rate (Pn), which indicates the ability of plants to accumulate organic matter, exhibited an upward–downward trend in both HJWL and XJ from April to October, consistently surpassing that of XJ each month (Figure 8a). Pn peaked at 10.21 ± 0.24 μmol CO2·m−2·s−1 in HJWL by late June and decreased to its lowest value of 4.39 ± 1.06 μmol CO2·m−2·s−1 by late October (Figure 8a). The Pn of XJ peaked at 9.29 ± 0.24 μmol CO2·m−2·s−1 in July and reached its lowest value of 3.74 ± 0.24 μmol CO2·m−2·s−1 by October (Figure 8a). Stomatal conductance (Gs), which reflects the degree of stomatal opening in plant leaves, showed an upward–downward trend in HJWL and XJ (Figure 8b). Both varieties reached their highest Gs values in July (HJWL: 229.43 ± 12.91 mmol·m−2·s−1; XJ: 199.85 ± 10.76 mmol·m−2·s−1) and their lowest in April (HJWL: 86.67 ± 3.01 mmol·m−2·s−1; XJ: 59.33 ± 2.57 mmol·m−2·s−1) (Figure 8b). The Gs of HJWL was slightly lower than that of XJ in August but significantly higher in all other months (Figure 8b). Transpiration rate (Tr) is conducive to the formation of water potential gradient in plants and maintains the constant temperature of plants. The Tr of HJWL peaked at 3.67 ± 0.14 mmol H2O·m−2·s−1 in July and the lowest value occurred in April (2.19 ± 0.15 mmol H2O·m−2·s−1) (Figure 8c). The Tr of HJWL was significantly higher than XJ in April, May and October but lower in June and August, while XJ reached its peak in June (3.94 ± 0.12 mmol H2O·m−2·s−1), reached its lowest value in May (1.41 ± 0.04 mmol H2O·m−2·s−1), and showed a downward trend from July to October (Figure 8c). The intercellular CO2 concentration (Ci) reflects the final balance between photosynthesis and respiration in plants. The change trend of intercellular CO2 concentration between HJWL and XJ was basically the same (Figure 8d), showing a trend of decreasing first and then increasing. The Ci of HJWL peaked in July (290.78 ± 4.56 μmol·mol−1) and XJ in June (268.36 ± 6.9 μmol·mol−1).
The overall trend of the light response curves of HJWL and XJ was similar (Figure 8e). As the photosynthetic active radiation (PAR) increased from 0 to 2200 μmol·m−2·s−1, the Pn increased rapidly at first, then began to increase gently after 600 μmol·m−2·s−1, and decrease slowly after about 1000 μmol·m−2·s−1. The maximum net photosynthetic rate (Pn, max) of the two varieties was significantly different in July and September, but there was no significant difference in August (Table S3). The light saturation point (LSP) of HJWL was significantly higher than that of XJ in August and September, indicating that HJWL can use full sunlight more effectively. Plants with a lower light compensation point (LCP) demonstrate a greater ability to use low light. The LCP of HJWL in July and September was significantly higher than that of XJ, indicating that XJ is more adept at utilizing weak light (Table S3). Additionally, the dark respiration rate (Rd) of HJWL in July and September was significantly higher than that of XJ, indicating that HJWL accumulates more photosynthetic products compared to XJ.
In August, the content of total flavonoids in HJWL was measured at 16.67 ± 0.031 mg/g, while that in XJ was 14.15 ± 0.31 mg/g, indicating a statistically significant difference between the two varieties (Figure 8f). There was no significant difference in the content of terpenoids and soluble sugar between HJWL and XJ in August. Notably, the wax content of HJWL in August was significantly higher than that of XJ.

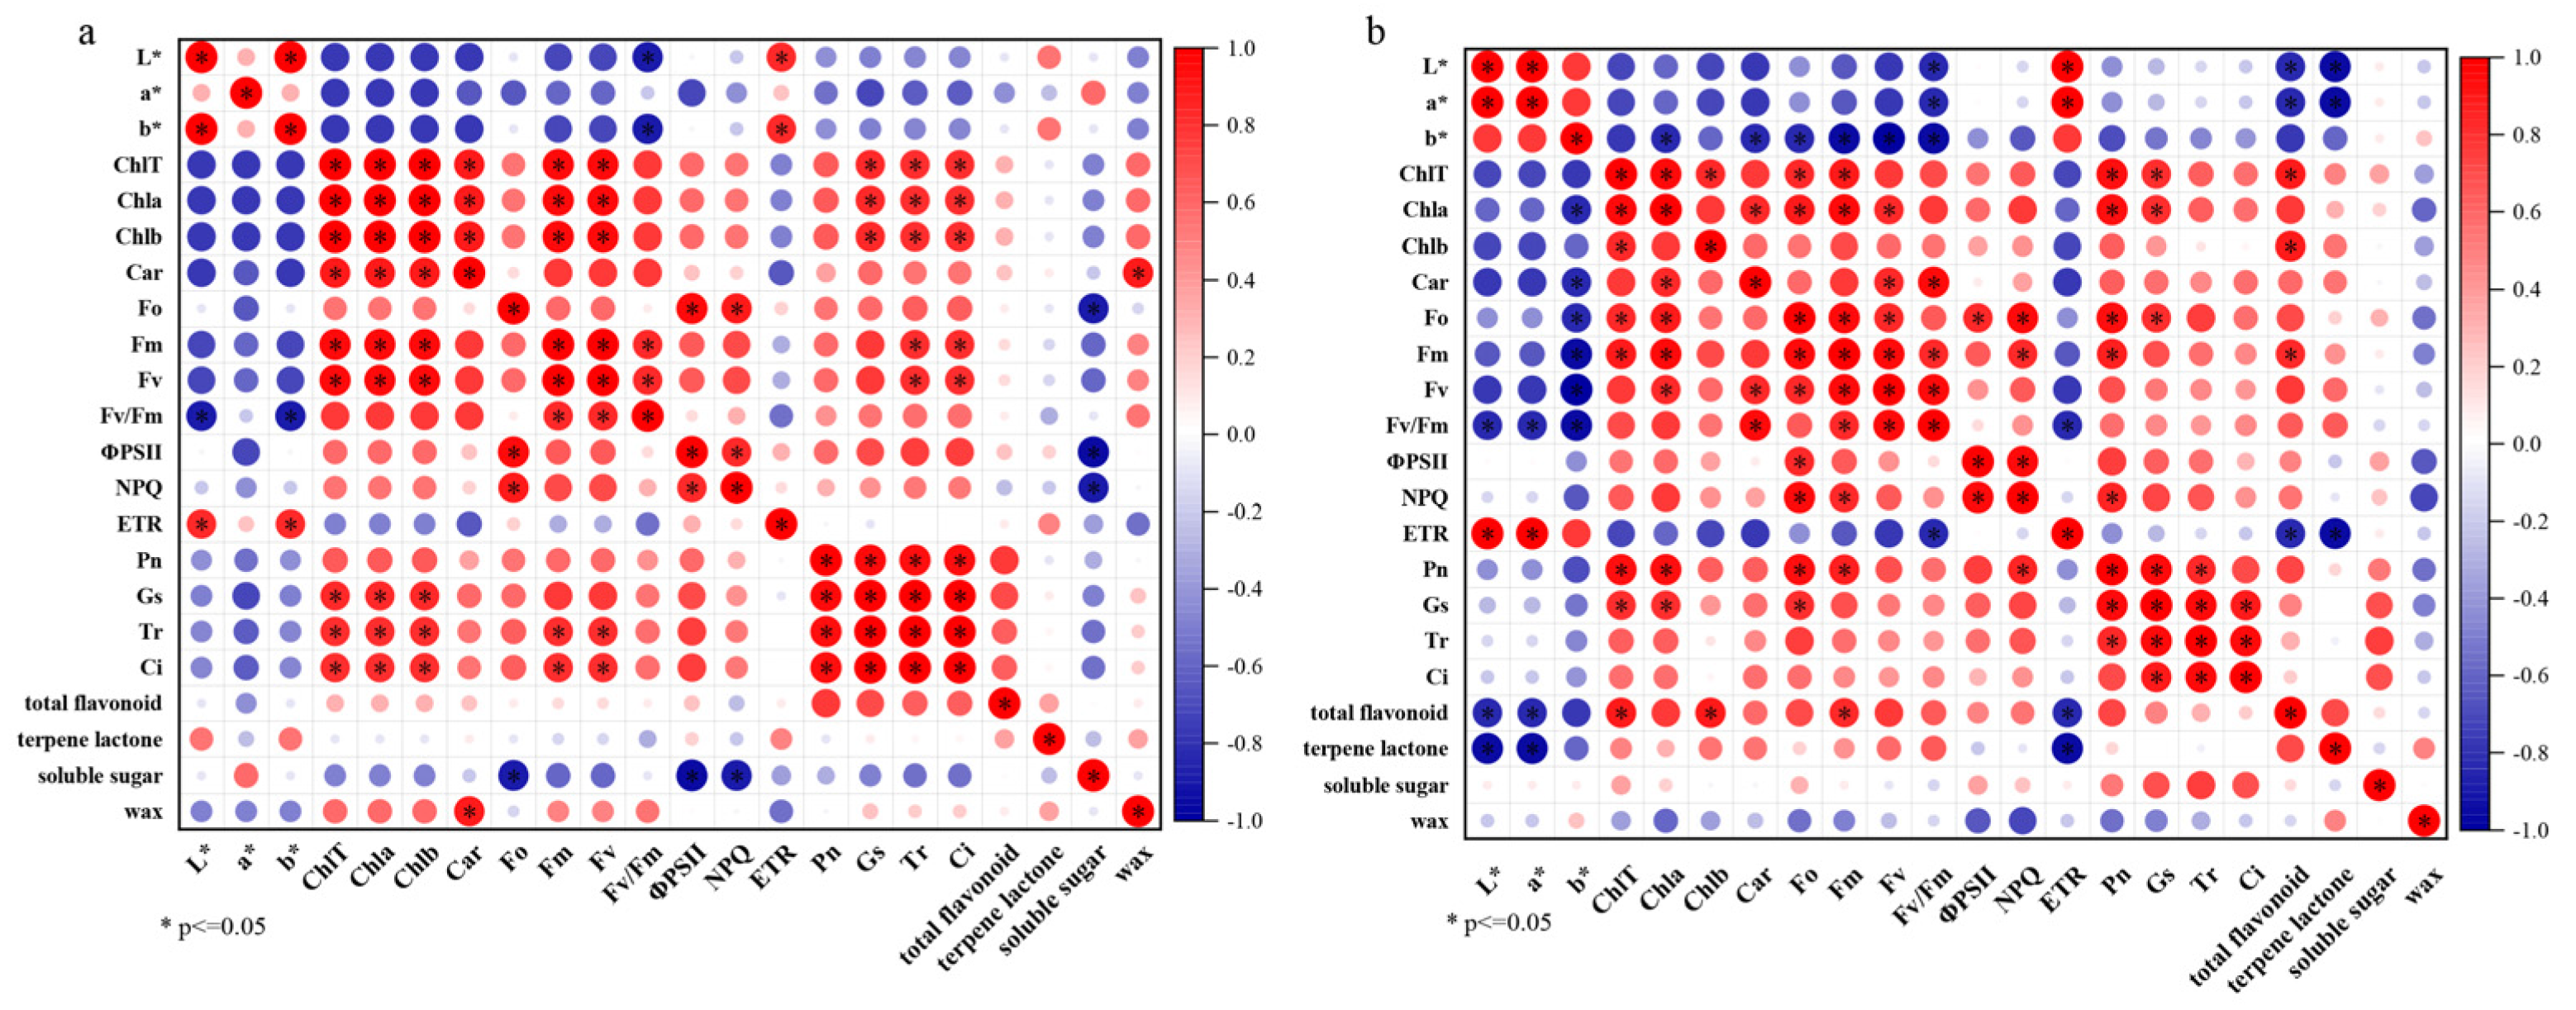
3.6. Correlation Analysis Between Physiological Indexes

The growth and development of plants constitute a comprehensive, systematic and coordinated process. Correlation analysis among the physiological indices of HJWL and XJ revealed that the Fm, Fv, Tr, Ci and total chlorophyll, chlorophyll a and chlorophyll b in HJWL were significantly positively correlations (Figure 9a). Similarly, Fo, Fm and Fv in XJ were significantly positively correlations with total chlorophyll and chlorophyll a (Figure 9b). These findings indicated that chlorophyll fluorescence parameters and photosynthesis directly affect chlorophyll content. The Pn of XJ was significantly positively correlated with total chlorophyll and chlorophyll a, and its yellowness was higher than that of HJWL, indicating that the accumulation of pigment content in XJ was higher. The accumulation of flavonoids and flavonols in Ginkgo biloba leaves may further promote the pigment accumulation, as evidenced by the positive correlation between the content of flavonoids and total chlorophyll, chlorophyll b and Fm in XJ. Additionally, a significant positive correlation was observed between flavanone and Pn in HJWL. In August, HJWL exhibited dark green leaves, while XJ displayed green leaves, a difference potentially attributable to variations in flavonoid content accumulation (Figure 9a,b).

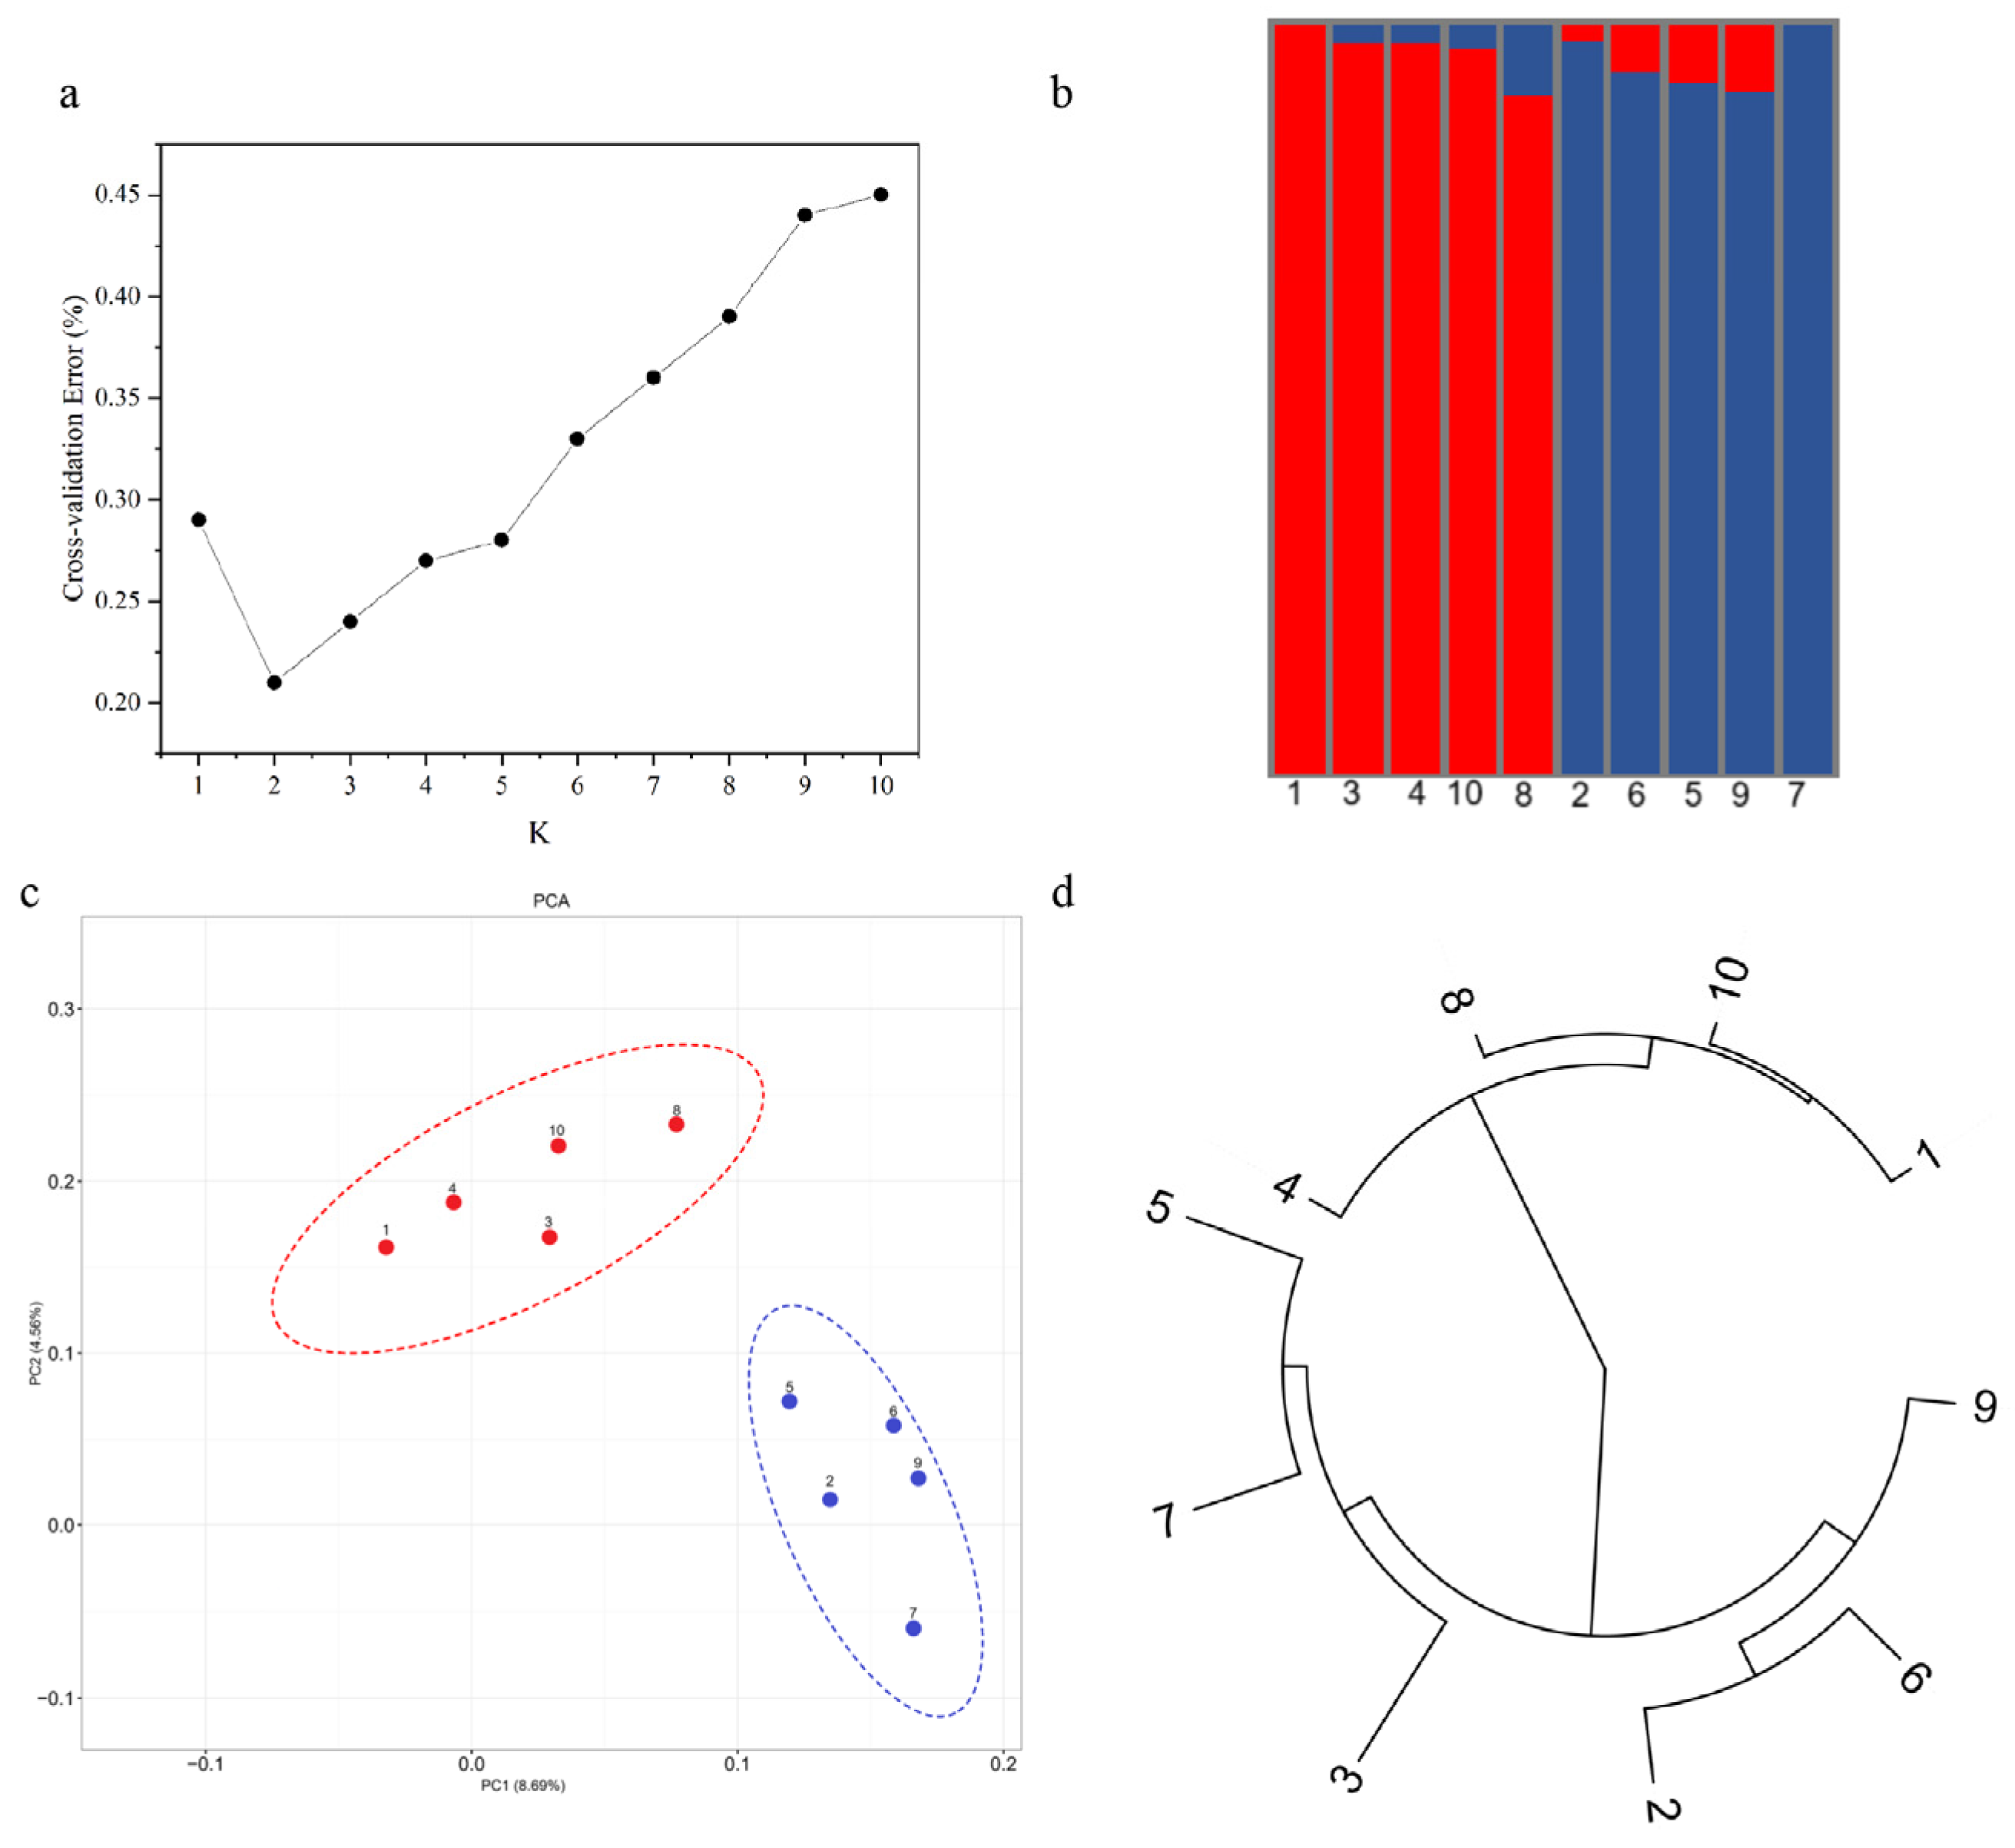
3.7. GBS Simplified Genome Analysis

In order to explore the genetic background of HJWL and XJ at the whole genome level, we sequenced the GBS simplified genome of the two golden leaf varieties and eight randomly selected Ginkgo biloba materials (ten in total) to analyze their genetic diversity. After filtering the sequencing data of ten Ginkgo biloba materials, a total of 97,602,855 high-quality clean reads were obtained, with each read length of 136 bp (Table S1). The comparison rate of clean reads and reference genomes of all samples was between 97.16% and 97.78%. The sequencing quality is good and the error rate is low, which can be used for subsequent analysis. SNP calling was performed on the sequencing data, and it was found that more than 90% of the mutation sites were located in the intergenic region, 536,621 mutation sites were located in the intron region, accounting for 9.366% of all mutation sites, and there were few mutation sites in other regions (Table S4). The GBS data of all samples met the requirements of subsequent analysis.
The genetic structure of ten ginkgo materials was analyzed by ADMIXTURE. The cross-validation error map from one to ten shows that the cross-validation error value is the smallest when K = 2 (CV = 0.2153, Figure 10a). Therefore, it is inferred that 10 ginkgo germplasm materials can be divided into two subgroups, named G1 (red) and G2 (blue) (Figure 10b). The HJWL is in the G1 subclass, and the XJ is in the G2 subclass. Principal component analysis (PCA) can explore the genetic background similarity and clustering relationship between individuals. The results of PCA were consistent with the results of ADMIXTURE (Figure 10c), and ten ginkgo materials could be divided into two categories. The phylogenetic tree results showed that HJWL and XJ were in two branches, indicating that they obviously had different genetic backgrounds (Figure 10d). It further shows that HJWL and XJ obviously do not belong to the same variety.

4. Discussion

Ginkgo biloba leaves are unique and highly ornamental. However, research on its leaf color varieties remains limited, mainly focusing on multi-colored spotted leaves, monochrome XJ and other varieties [7,12,42]. There is a notable lack of exploration into the variation types of leaf coloration during spring and summer. Investigating the phenotype, structure, physiology and molecular basis of the superior leaf color types in Ginkgo biloba can enhance our understanding of varietal traits, thereby facilitating the breeding of more and better new varieties [7,12]. This study found that the leaf color change in HJWL generally belongs to the type of golden-leaf ginkgo in spring and summer, with significant differences observed in leaf coloration and its persistence.

4.1. The Response of Leaf Color Change and Pigment Content in HJWL and XJ

The coloration of golden-leaf plants is affected by both internal genetic factors and external environmental factors. The type, content and distribution of pigments in leaf cells directly determine leaf color [3,43]. Murray and Falbrl [44,45] classified the ratio of chlorophyll a and chlorophyll b content into two categories according to chlorophyll mutation. One is chlorophyll b deletion type, while chlorophyll a is normal, such as rice [46] and pea [47]. The other type is total chlorophyll and chlorophyll a deficiency, such as Ilex × attenuata ‘Sunny Foster’ [48], Agave angustifolia Haw. [49], and Bamboo [50]. In this study, ginkgo HJWL and XJ were in the second category. Notably, the content of two kinds of carotene in HJWL was significantly higher than that in XJ throughout the leaf development period, especially during the color conversion period.

4.2. Effect of Chloroplast Ultrastructure on Leaf Color Change

Variations in leaf structure are mainly manifested through the mutation of plastids, which are related to factors such as thickness of cell wall, the number of cell layers of palisade tissue and spongy tissue, and the difference in the number, structure, shape and distribution of chloroplasts [51]. Chloroplasts are cytoplasmic organelles in eukaryotic cells that consist of a chloroplast membrane, thylakoid and matrix and are the sites of photosynthesis. Electron microscopic investigation revealed fewer chloroplasts per cell and looser stroma lamellae in Brassica campestris L. mutant, indicating that yellowing of leaves is largely affected by abnormal chloroplast development. [52]. Similarly, the chloroplasts of orchids Cymbidium ‘Sakura’ and its etiolated mutant had an incomplete thylakoid structure, with loosely arranged grana lamella, inducing chlorophyll degradation, which contributed to the yellowing of mutant plants [53]. The ultrastructure of chloroplasts in the Hydrangea macrophylla var. maculata leaves was irregular. The formation of the silvery white leaf color of H. macrophylla var. maculata was primarily due to the abnormal development of chloroplasts [54]. In this study, the palisade tissue cells of HJWL were closely arranged with obvious morphological structure. However, the cytoplasm of XJ palisade tissue was dense, and the morphology was difficult to distinguish, potentially due to incomplete structural formation during the greening process. The periclinal wall of the upper and lower epidermal cells in HJWL was relatively smooth, while the upper epidermal subsidiary cells of XJ protrude outward to form papillae of different lengths. The lower epidermal papillae in XJ were more obvious, with some cells exhibiting longitudinal folds extending from the top of the bulge to the base. There were significant differences in chloroplast structure in different periods. Compared to XJ, HJWL exhibited a more complete chloroplast structure, with more grana and more layers of stacked grana, consistent with findings reported by Li et al. [7]. These structural changes may affect the normal development of the plastids of the two golden-leaf ginkgo varieties, hindering the process of chlorophyll synthesis and accumulation, and ultimately resulting in changes in leaf color. Previous studies have demonstrated that leaf color variation is influenced by the number and distribution of chloroplasts, which can be assessed through chloroplast ultrastructure. Abnormal chloroplast ultrastructure is a key factor in leaf color changes. In addition to impairing chlorophyll synthesis and accumulation, such structural anomalies are also associated with altered gene expression patterns involved in chloroplast development and division. For instance, PPR4 (pentatricopeptide repeat 4) in maize ensures chloroplast development by binding and trans-splicing plastid rps12 pre-mRNA [55]. GLK (Golden 2-like) genes play a positive role in the regulation of chloroplast development [56]. HmAP2/ERFs (Unigene42535 and Unigene17785) in H. macrophylla are involved in chloroplast division, and their dysregulation leads to abnormal chloroplast ultrastructure, resulting in silvery-white leaf margins [54]. Whether the abnormal chloroplast ultrastructure in XJ is related to the expression of genes related to chloroplast development and division deserves further investigation.

4.3. Effects of Chlorophyll Fluorescence, Photosynthesis and Metabolites on Leaf Color

Chlorophyll fluorescence is closely related to many reaction processes in photosynthesis [57]. For instance, photosynthesis was reduced by the inhibition of CO2 assimilation caused by PSII damage in Medicago truncatula [58]. Similarly, chlorophyll a fluorescence light response curves and gas-exchange observations are combined to test the photosynthetic response to moderate drought in four genotypes of Brassica rapa [59]. In walnut trees, leaf scorch has been shown to damage the photosynthetic machinery mechanism, reduce electron transfer efficiency, and destroy PSII reaction centers [60]. In this experiment, the determination of chlorophyll fluorescence showed that the Fv/Fm of HJWL were higher than those of XJ, indicating that HJWL plants were not inhibited by light, while XJ showed focal edge leaf rot, which may be related to its photoinhibition. Additionally, the NPQ of HJWL was larger, the electron transport activity was higher, and the ΦPSII and ETR of HJWL were also higher than those of XJ, indicating that HJWL had better photosynthetic capacity under high-temperature growth conditions in summer, showing good adaptability. The electron transfer activity of XJ is low, and the destruction of photoinhibition is defended by heat dissipation. The light response curves of two kinds of ginkgo also confirmed that the photosynthetic capacity of HJWL was stronger than that of XJ.
Photosynthesis is highly sensitive to environmental changes and serves as a key indicator of plant adaptability [61]. Most leaf color mutations are determined by the altered chlorophyll or carotenoid, which can be affected by light quality and intensity [62]. For example, light intensity is a crucial environmental factor influencing plastid development and leaf color formation in the Anthurium andraeanum cultivar ‘Sonate’ [63]. Yue et al. have answered the scientific question on leaf color and light by describing the light-induced metabolism and differential accumulation of key pigment compounds affecting leaf color in photosensitive etiolated tea [64]. Similarly, chloroplast ultrastructure, pigment biosynthesis and photosynthesis were impaired in Rosa beggeriana Schrenk mutant [65]. In this study, the Pn and stomatal conductance of HJWL were higher than those of XJ almost every month, and the light response characteristics showed significant differences. Furthermore, the maximum photosynthetic rate of HJWL was significantly higher than that of XJ under different light intensities, indicating that HJWL had stronger photosynthetic capacity and was more susceptible to environmental factors. Since photosynthesis is greatly affected by complex environments, it is the result of multiple factors. Therefore, to fully understand the variation in photosynthetic capacity of golden-leaf ginkgo, it is insufficient to rely solely on basic physiological characteristics of photosynthesis and light response curves. A comprehensive analysis must also consider additional environmental factors such as temperature, water and CO2 concentration [66,67].

4.4. Analysis of Leaf Focal Edge in XJ

After mid-to-late April, the leaves of XJ become white and thin, and the phenomenon of scorched edges and rotten leaves will appear. In August, the leaves will return to green, which seriously affects the growth and landscape effect. Currently, there is limited research on the focal edge mechanism of golden-leaf ginkgo. This study found that the reason for this phenomenon may be related to the chlorophyll content, chloroplast structure integrity, photoinhibition and metabolites such as flavonoid and wax content in XJ. Our results demonstrated that XJ exhibited reduced chloroplast numbers and sizes compared to HJWL, along with distorted thylakoid membranes and impaired chlorophyll biosynthesis. These structural abnormalities led to the following: (1) disrupted chloroplast membrane biogenesis; (2) significant declines in net photosynthesis, maximum photochemical efficiency (Fv/Fm) and actual photochemical efficiency (ΦPSII). Additionally, genotyping-by-sequencing (GBS) is an extremely useful tool in the investigation and analysis of the genetic diversity of different cultivars. However, due to the limited sample size we selected, it is impossible to explain the cause of the focal edge of XJ from the perspective of population genetic evolution. It is worth mentioning that our results prove that HJWL and XJ have different genetic backgrounds, indicating that the phenomenon of focal margin in XJ may also be related to its genetic mechanism. Notably, HJWL did not show the phenomenon of burnt edges and rotten leaves during the same period. Its unique leaf coloration traits demonstrate significant ornamental value for horticultural applications and substantial potential for market promotion.

5. Conclusions

Through comprehensive analysis of pigment content, leaf morphology and photosynthetic physiology in gingko HJWL and XJ, it was found that the total chlorophyll content and carotenoids in HJWL were significantly higher than those of XJ. Anatomically, the cells of HJWL palisade tissue are long and distinct from sponge tissue. Both upper and lower epidermis were similar, the periclinal wall of the cells was smooth, no mastoid structure was formed, and single-layer thylakoids were observed in the chloroplast. In contrast, XJ showed that the boundary between the palisade tissue and the spongy tissue is blurred, and the epidermal subsidiary cells protrude outward to form a mastoid structure of different lengths. The lower epidermis of XJ developed a more obvious mastoid structure, the number of chloroplasts is less and the chloroplast lamella is loose. The chlorophyll fluorescence parameters of HJWL leaves were significantly higher than those of XJ, indicating that the ability of HJWL to inhibit laser and light resistance was stronger than those of XJ. From April to October, the Pn of HJWL was higher than that of XJ. Additionally, HJWL demonstrated higher maximum net photosynthetic rate, LCP and Rd in July and September compared to XJ, further confirming its superior photosynthetic performance. The contents of total flavonoids and wax in HJWL were also significantly higher than those in XJ. GBS showed that HJWL and XJ were obviously in different topological branches, which were significantly different varieties. These findings offer valuable insights for facilitating the breeding of new golden-leaf ginkgo varieties with enhanced horticultural value and for further investigation into characterizing HJWL’s resistance to leaf scorch.

Supplementary Materials

The following supporting information can be downloaded at: https://www.mdpi.com/article/10.3390/horticulturae11040395/s1, Figure S1: HJWL and XJ Growing in the Golden Leaves Ginkgo Germplasm Resources Garden; Figure S2: Description of Ginkgo biloba leaf color; Table S1: Sequencing data of 10 materials including Ginkgo biloba ‘Huangjinwangliang’ and ‘Xiajin’; Table S2: The chloroplasts structure of HJWL and XJ in different months; Table S3: Characteristic parameters of light response curve of Ginkgo biloba; Table S4: Regional distribution statistics of variant loci.

Author Contributions

Conceptualization, F.L. and Q.G.; methodology, Y.H.; software, F.L.; validation, W.J.; formal analysis, F.L.; resources, Y.H.; writing—original draft preparation, F.L.; writing—review and editing, Y.W., X.G. and Q.G.; project administration, funding acquisition, Q.G. All authors have read and agreed to the published version of the manuscript.

Funding

This research was funded by the National Natural Science Foundation of China (31971648), the Talent Introduction Project Study of Nanjing Forestry University (GXL2018001) on Ginkgo biloba and other important tree germplasm resources, and the Postgraduate Research & Practice Innovation Program of Jiangsu Province (KYCX23_1250).

Data Availability Statement

The article contains all the information required to support its conclusions.

Acknowledgments

Authors gratefully acknowledge all lab members for their help in collecting ginkgo leaves and data organization.

Conflicts of Interest

The authors declare no conflicts of interest.

References

  1. Agenda Academiae Sinicae Edita. Florae Reipublicae Popularis Sinicae; Science Press: Beijing, China, 1959–2004. [Google Scholar]
  2. Tian, Y.; Rao, S.; Li, Q.; Xu, M.; Wang, A.; Zhang, H.; Chen, J. The coloring mechanism of a novel golden variety in Populus deltoides based on the RGB color mode. For. Res. 2021, 1, 5. [Google Scholar] [CrossRef] [PubMed]
  3. Sun, Y.; Bai, P.; Gu, K.; Yang, S.; Lin, H.; Shi, C.; Zhao, Y. Dynamic transcriptome and network-based analysis of yellow leaf mutant Ginkgo biloba. BMC Plant Biol. 2022, 22, 465–478. [Google Scholar] [CrossRef]
  4. Wu, Y.; Guo, J.; Wang, T.; Gao, F.; Wang, G. Metabolomic and transcriptomic analyses of mutant yellow leaves provide insights into pigment synthesis and metabolism in Ginkgo biloba. BMC Genom. 2020, 21, 858. [Google Scholar] [CrossRef] [PubMed]
  5. Li, W.; He, Z.; Yang, S.; Ye, Y.; Jiang, H.; Wang, L. Construction and analysis of a library of miRNA in gold-coloured mutant leaves of Ginkgo biloba L. Folia Hortic. 2019, 1, 81–92. [Google Scholar] [CrossRef]
  6. Flexas, J.; Clemente, M.J.; Bota, J.; Brodribb, T.J.; Gago, J.; Mizokami, Y.; Nadal, M.; Perera, A.V.; Roig, M.; Sugiura, D.; et al. Cell wall thickness and composition are involved in photosynthetic limitation. J. Exp. Bot. 2021, 72, 144–156. [Google Scholar] [CrossRef]
  7. Li, W.; Yang, S.; Lu, Z.; He, Z.; Ye, Y.; Zhao, B.; Wang, L.; Jin, B. Publisher correction: Cytological, physiological, and transcriptomic analyses of golden leaf coloration in Ginkgo biloba L. Hortic. Res. 2018, 5, 5–32. [Google Scholar] [CrossRef]
  8. Yang, W.; Xu, H.; Xiao, Q.; Li, X.; Shao, Q. Combined analysis of metabolome and transcriptome provides insights into metabolisms of chlorophylls, carotenoids, and flavonoids in the yellowing leaves of ‘HAES344′ macadamia. Sci. Hortic. 2023, 308, 111600. [Google Scholar] [CrossRef]
  9. Li, S.; Li, Q.; Tang, L.; Wen, J. Pigment comparison and expression of chlorophyll metabolism genes in yellow and green Acer palmatum Thunb. ex Murray leaves. Can. J. Plant Sci. 2017, 97, 775–783. [Google Scholar] [CrossRef]
  10. Shao, G.; Liu, R.; Qian, Z.; Zhang, H.; Hu, Q.; Zhu, Y.; Chen, S.; Chen, F.; Jiang, J.; Wang, L. Transcriptome analysis reveals genes respond to chlorophyll deficiency in green and yellow leaves of Chrysanthemum morifolium Ramat. Horticulturae 2022, 8, 14. [Google Scholar] [CrossRef]
  11. Guo, X.; Zhang, P.; Fan, X.; Yang, H. Characterization and RNA-Seq analysis of yellow-green leaf mutants in Tomato. Agronomy. 2024, 14, 828. [Google Scholar] [CrossRef]
  12. Li, B.; Zhang, J.; Tian, P.; Gao, X.; Song, X.; Pan, X.; Wu, Y. Cytological, physiological, and transcriptomic analyses of the leaf color mutant yellow leaf 20 (yl20) in eggplant (Solanum melongena L.). Plants 2024, 13, 855. [Google Scholar] [CrossRef] [PubMed]
  13. Yin, G.; Wang, Y.; Xiao, Y.; Yang, J.; Wang, R.; Jiang, Y.; Huang, R.; Liu, X.; Jiang, Y. Relationships between leaf color changes, pigment levels, enzyme activity, photosynthetic fluorescence characteristics and chloroplast ultrastructure of Liquidambar formosana Hance. J. For. Res. 2022, 33, 1559–1572. [Google Scholar] [CrossRef]
  14. Van, K.O.; Snel, J.F. The use of chlorophyll fluorescence nomenclature in plant stress physiology. Photosynth. Res. 1990, 25, 147–150. [Google Scholar] [CrossRef]
  15. Junker, L.V.; Ensminger, I. Relationship between leaf optical properties, chlorophyll fluorescence and pigment changes in senescing Acer saccharum leaves. Tree Physiol. 2016, 36, 694–711. [Google Scholar] [CrossRef]
  16. Ji, S.; Zhang, Y.; Xu, M.; Zhao, M.; Chen, H.; Lu, Y.; Pang, S.; Xu, W. Characterization of low-temperature sensitivity and chlorophyll fluorescence in yellow leaf mutants of Tomato. Agronomy 2024, 14, 2382. [Google Scholar] [CrossRef]
  17. Zhang, K.; Liu, Z.; Shan, X.; Li, C.; Tang, X.; Chi, M.; Feng, H. Physiological properties and chlorophyll biosynthesis in a Pak-choi (Brassica rapa L. ssp. chinensis) yellow leaf mutant, pylm. Acta Physiol. Plant. 2017, 39, 22. [Google Scholar] [CrossRef]
  18. Guo, J.; Wu, Y.; Jiang, M.; Wu, C.; Wang, G. An LC-MS-based metabolomic approach provides insights into the metabolite profiles of Ginkgo biloba L. at different developmental stages and in various organs. Food Res. Int. 2022, 159, 111644. [Google Scholar] [CrossRef]
  19. Jurčević Šangut, I.; Šamec, D. Seasonal variation of polyphenols and pigments in Ginkgo (Ginkgo biloba L.) leaves: Focus on 3′,8″-Biflavones. Plants 2024, 13, 3044. [Google Scholar] [CrossRef]
  20. Hu, Y.; Šmarda, P.; Liu, G.; Wang, B.; Gao, X.; Guo, Q. High-depth transcriptome reveals differences in natural haploid Ginkgo biloba L. due to the effect of reduced gene dosage. Int. J. Mol. Sci. 2022, 23, 8958. [Google Scholar] [CrossRef]
  21. Hu, Y.; Zhang, Y.; Šmarda, P.; Bureš, P.; Guo, Q. Transcriptome and proteome associated analysis of flavonoid metabolism in haploid Ginkgo biloba. Int. J. Biol. Macromol. 2023, 224, 306–318. [Google Scholar] [CrossRef]
  22. Shi, J.; Zou, X.; Zhao, J.; Holmes, M.; Wang, K.; Wang, X.; Chen, H. Determination of total flavonoids content in fresh Ginkgo biloba leaf with different colors using near infrared spectroscopy. Spectrochim. Acta A Mol. Biomol. Spectrosc. 2012, 94, 271–276. [Google Scholar] [CrossRef] [PubMed]
  23. Liu, Y.; Liu, J.; Tang, C.; Anthony, U.V.; Xu, L.; Zhang, F.; Sun, J.; Chen, Y. Flavonoids-targeted metabolomic analysis following rice yellowing. Food Chem. 2023, 430, 136984. [Google Scholar] [CrossRef] [PubMed]
  24. Lenucci, M.S.; Leucci, M.R.; Piro, G.; Dalessandro, G. Variability in the content of soluble sugars and cell wall polysaccharides in red-ripe cherry and high-pigment tomato cultivars. J. Sci. Food Agric. 2008, 88, 1837–1844. [Google Scholar] [CrossRef]
  25. Simões, R.; Rodrigues, A.; Ferreira-Dias, S.; Miranda, I.; Pereira, H. Chemical composition of cuticular waxes and pigments and morphology of leaves of Quercus suber trees of different provenance. Plants 2020, 9, 1165. [Google Scholar] [CrossRef]
  26. Hwang, K.; Oh, S.; Kim, K.; Han, H.; Oh, Y.; Lim, H.; Kim, Y.; Kim, D. Genotyping-by-sequencing approaches using optimized two-enzyme combinations in Asian pears (Pyrus spp.). Mol. Breed. 2019, 39, 484–501. [Google Scholar] [CrossRef]
  27. Hu, Y.; Yu, Z.; Gao, X.; Liu, G.; Zhang, Y.; Šmarda, P.; Guo, Q. Genetic diversity, population structure, and genome-wide association analysis of ginkgo cultivars. Hortic. Res. 2023, 10, 136. [Google Scholar] [CrossRef]
  28. Hu, Y.; Hu, Q.; Ma, X.; Zhang, X.; Zheng, J. Population genetics and origin of horticultural germplasm in Clematis via genotyping-by-sequencing. Hortic. Res. 2024, 336, uhae336. [Google Scholar] [CrossRef]
  29. Yuan, G.; Sun, B.; Yuan, J.; Wang, Q. Effect of 1-methylcyclopropene on shelf life, visual quality, antioxidant enzymes and health-promoting compounds in broccoli florets. Food Chem. 2010, 118, 774–781. [Google Scholar] [CrossRef]
  30. Liu, Y.; Ren, J.; Shen, N.; Li, N.; Cui, Y.; Xin, H. Phytochemical constituents from Ginkgo biloba exocarp. Chem. Nat. Compd. 2022, 58, 926–928. [Google Scholar] [CrossRef]
  31. Sun, B.; Tian, Y.; Jiang, M.; Yuan, Q.; Chen, Q.; Zhang, Y.; Luo, Y.; Zhang, F.; Tang, H. Variation in the main health-promoting compounds and antioxidant activity of whole and individual edible parts of baby mustard (Brassica juncea var. gemmifera). RSC Adv. 2018, 8, 33845–33854. [Google Scholar] [CrossRef]
  32. Carelli, A.A.; Frizzera, L.M.; Forbito, P.R.; Crapiste, G.H. Wax composition of sunflower seed oils. J. Am. Oil Chem. Soc. 2002, 79, 763–768. [Google Scholar] [CrossRef]
  33. Doyle, J.J. Isolation of plant DNA from fresh tissue. Focus 1990, 12, 13–15. [Google Scholar]
  34. Chen, S.; Zhou, Y.; Chen, Y.; Gu, J. Fastp: An ultra-fast all-in-one FASTQ preprocessor. Bioinformatics 2018, 34, 884–890. [Google Scholar] [CrossRef]
  35. Liu, H.; Wang, X.; Wang, G.; Cui, P.; Wu, S.; Ai, C.; Hu, N.; Li, A.; He, B.; Shao, X. The nearly complete genome of Ginkgo biloba illuminates gymnosperm evolution. Nat. Plants 2021, 7, 748–756. [Google Scholar] [CrossRef]
  36. Li, H.; Durbin, R. Fast and accurate short read alignment with Burrows-Wheeler transform. Bioinformatics 2009, 25, 1754–1760. [Google Scholar] [CrossRef]
  37. Van, D.A.; Carneiro, M.O.; Hartl, C.; Poplin, R.; Del, A.G.; Levy, M.A.; Jordan, T.; Shakir, K.; Roazen, D.; Thibault, J.; et al. From fastQ data to high confidence variant calls: The genome analysis toolkit best practices pipeline. Curr. Protoc. Bioinform. 2013, 43, 101–103. [Google Scholar] [CrossRef]
  38. Wang, K.; Li, M.; Hakonarson, H. Annovar: Functional annotation of genetic variants from high throughput sequencing data. Nucleic Acids Res. 2010, 38, 164–174. [Google Scholar] [CrossRef]
  39. Alexander, D.H.; Novembre, J.; Lange, K. Fast model-based estimation of ancestry in unrelated individuals. Genome Res. 2009, 19, 1655–1664. [Google Scholar] [CrossRef]
  40. Vilella, A.J.; Severin, J.; Ureta-Vidal, A.; Li, H.; Durbin, R.; Birney, E. Ensembl compara genetrees: Complete, duplicationaware phylogenetic trees in vertebrates. Genome Res. 2009, 19, 327–335. [Google Scholar] [CrossRef]
  41. Yang, J.; Lee, S.H.; Goddard, M.E.; Visscher, P.M. GCTA: A tool for genome-wide complex trait analysis. Am. J. Hum. Genet. 2011, 88, 76–82. [Google Scholar] [CrossRef]
  42. Wu, Y.; Li, X.; Wang, T.; Guo, J.; Cao, F.; Wang, G. Ginkgo biloba microRNA profiling reveals new insight into leaf color mutation. Sci. Hortic. 2020, 265, 109189. [Google Scholar] [CrossRef]
  43. Li, J.; Wu, K.; Li, L.; Wang, M.; Fang, L.; Zeng, S. Cytological, biochemical, and transcriptomic analyses of a novel yellow leaf variation in a Paphiopedilum (Orchidaceae) SCBG COP15. Genes 2022, 13, 71. [Google Scholar] [CrossRef]
  44. Murray, D.L.; Kohorn, B.D. Chloroplasts of Arabidopsis thaliana homozygous for the ch-1 locus lack chlorophyll b, lack stable LHCPII and have stacked thylakoids. Plant Mol. Biol. 1991, 16, 71–79. [Google Scholar] [CrossRef]
  45. Falbel, T.G.; Meehl, J.B.; Staehelin, L.A. Severity of mutant phenotype in a series of chlorophyll deficient wheat mutants depends on light intensity and the severity of the block in chlorophyll synthesis. Plant Physiol. 1996, 112, 821–832. [Google Scholar] [CrossRef]
  46. Terao, T.; Katoh, S. Antenna sizes of photosystem I and photosystem II in chlorophyll b-deficient mutants of rice. evidence for an antenna function of photosystem II centers that are inactive in electron transport. Plant Cell Physiol. 1996, 37, 307–312. [Google Scholar] [CrossRef]
  47. Ladygin, V.G. Pigment composition and photosynthetic activity of pea chlorophyll mutants. Izv. Akad. Nauk. Ser. Biol. 2003, 30, 370–376. [Google Scholar] [CrossRef]
  48. Zou, Y.; Huang, Y.; Zhang, D.; Chen, H.; Liang, Y.; Hao, M.; Yin, Y. Molecular mechanisms of chlorophyll deficiency in Ilex×attenuata ‘Sunny Foster’ Mutant. Plants 2024, 13, 1284. [Google Scholar] [CrossRef]
  49. Aguilar-Méndez, E.D.; Monribot-Villanueva, J.L.; Guerrero-Analco, J.A.; De-la-Peña, C. Chlorophyll deficiency in Agave angustifolia Haw.: Unveiling the impact on secondary metabolite production. Planta 2024, 260, 77. [Google Scholar] [CrossRef]
  50. Zhu, P.; Zeng, M.; Lin, Y.; Tang, Y.; He, T.; Zheng, Y.; Chen, L. Variability in Leaf Color Induced by Chlorophyll Deficiency: Transcriptional Changes in Bamboo Leaves. Curr. Issues Mol. Biol. 2024, 46, 1503–1515. [Google Scholar] [CrossRef]
  51. Wu, Z.; Zhang, X.; Wang, J.; Wan, J. Leaf chloroplast ultrastructure and photosynthetic properties of a chlorophyll-deficient mutant of rice. Int. J. Photosynth. Res. 2014, 52, 217–222. [Google Scholar] [CrossRef]
  52. Nie, L.; Zheng, Y.; Zhang, L.; Wu, Y.; Zhu, S.; Hou, J.; Chen, G.; Tang, X.; Wang, C.; Yuan, L. Characterization and transcriptomic analysis of a novel yellow-green leaf wucai (Brassica campestris L.) germplasm. BMC Genom. 2021, 22, 258. [Google Scholar] [CrossRef] [PubMed]
  53. Zhang, X.; Ruan, R.; Zhao, F.; Li, C.; Fu, Q. Comprehensive transcriptome analysis discovers genes related to leaf color in Cymbidium ‘Sakura’ etiolated mutant. Acta Physiol. Plant 2023, 45, 12. [Google Scholar] [CrossRef]
  54. Qi, X.; Chen, S.; Wang, H.; Feng, J.; Chen, Z.; Qin, Z.; Deng, Y. Comparative physiology and transcriptome analysis reveals that chloroplast development influences silver-white leaf color formation in Hydrangea macrophylla var. maculata. BMC Plant Biol. 2022, 22, 345. [Google Scholar] [CrossRef]
  55. Schmitz-Linneweber, C.; Williams-Carrier, R.E.; Williams-Voelker, P.M.; Kroeger, T.S.; Vichas, A.; Barkan, A. A pentatricopeptide repeat protein facilitates the trans-splicing of the maize chloroplast rps12 pre-mRNA. Plant Cell. 2006, 18, 2650–2663. [Google Scholar] [CrossRef]
  56. Zubo, Y.O.; Blakley, I.; Franco-Zorrilla, J.M.; Yamburenko, M.; Solano, R.; Kieber, J.J.; Ann, E.; Loraine, A.E.; Schaller, G.E. Coordination of chloroplast development through the action of the GNC and GLK transcription factor families. Plant Physiol. 2018, 178, 130–147. [Google Scholar] [CrossRef] [PubMed]
  57. Hikosaka, K. Photosynthesis, chlorophyll fluorescence and photochemical reflectance index in photoinhibited leaves. Funct. Plant Biol. 2021, 48, 815–826. [Google Scholar] [CrossRef] [PubMed]
  58. Najar, R.; Aydi, S.; Sassi-Aydi, S.; Zarai, A.; Abdelly, C. Effect of salt stress on photosynthesis and chlorophyll fluorescence in Medicago truncatula. Plant Biosyst. 2018, 153, 88–97. [Google Scholar] [CrossRef]
  59. Pleban, J.R.; Guadagno, C.R.; Mackay, D.S.; Weinig, C.; Ewers, B.E. Rapid chlorophyll a fluorescence light response curves mechanistically inform photosynthesis modeling. Plant Physiol. 2020, 183, 602–619. [Google Scholar] [CrossRef]
  60. Xing, C.; Wang, S.; Zhang, C.; Guo, T.; Hao, H.; Zhang, Z.; Wang, S.; Shu, J. Effects of leaf scorch on chlorophyll fluorescence characteristics of walnut leaves. J. Plant. Dis. Prot. 2023, 130, 115–124. [Google Scholar] [CrossRef]
  61. Li, Y.; Gao, H.; Zhang, Z. Effects of environmental and non-environmental factors on dynamic photosynthetic carbon assimilation in leaves under changing light. Plants 2023, 12, 2015. [Google Scholar] [CrossRef]
  62. Huo, J.; Zhang, N.; Gong, Y.; Bao, Y.; Li, Y.; Zhang, L.; Nie, S. Effects of different light intensity on leaf color changes in a Chinese cabbage yellow cotyledon mutant. Front. Plant Sci. 2024, 15, 1371451. [Google Scholar] [CrossRef]
  63. Wang, Y.; Liu, S.; Tian, X.; Fu, Y.; Jiang, X.; Li, Y.; Wang, G. Influence of light intensity on chloroplast development and pigment accumulation in the wild-type and etiolated mutant plants of Anthurium andraeanum ‘Sonate’. Plant Signal. Behav. 2018, 13, e1482174. [Google Scholar] [CrossRef] [PubMed]
  64. Yue, C.; Wang, Z.; Yang, P. Review: The effect of light on the key pigment compounds of photosensitive etiolated tea plant. Bot. Stud. 2021, 62, 21. [Google Scholar] [CrossRef]
  65. Yang, Y.; Wei, F.; Jia, R.; Zhao, X.; Gan, Y.; Ge, H. Differences in leaf anatomy, photosynthesis, and photoprotective strategies in the yellow-green leaf mutant and wild type of Rosa beggeriana Schrenk. Photosynthetica 2020, 58, 1167–1177. [Google Scholar] [CrossRef]
  66. Wang, Q.; Jiang, Y.; Mao, X.; Yu, W.; Lu, J.; Wang, L. Integration of morphological, physiological, cytological, metabolome and transcriptome analyses reveal age inhibited accumulation of flavonoid biosynthesis in Ginkgo biloba leaves. Ind. Crops Prod. 2022, 187, 115405. [Google Scholar] [CrossRef]
  67. Gao, X.; Hu, Y.; Li, F.; Cao, F.; Guo, Q. Sex identification and male-female differences in Ginkgo biloba hybrid F1 generation seedlings. Forests 2024, 15, 1636. [Google Scholar] [CrossRef]
Figure 1. The color changes in HJWL and XJ from March to November. The red arrows indicate the leaf scorch characteristics in XJ. The red arrows indicate the XJ focal edge.
Horticulturae 11 00395 g001
Figure 2. The dynamic changes in HJWL and XJ leaf color. (a) The L* value. (b) The a* value. (c) The b* value. Data are given as mean ± SE (n = 3). The results of the t-test discerned the difference between the two varieties (p < 0.05). The different lowercase letters are statistically different (p < 0.05).
Horticulturae 11 00395 g002
Figure 3. The difference in pigment content in HJWL and XJ. (a) Total chlorophyll. (b) Chlorophyll a. (c) Chlorophyll b. (d) Carotenoids. The bars show the mean ± SE (n = 3). Columns with different lowercase letters are statistically different (p < 0.05).
Horticulturae 11 00395 g003
Figure 4. Microstructure of HJWL and XJ leaves. (a,b) Leaf microstructure of HJWL in June. Red arrow indicates Pa and Sp. (c,d) Leaf microstructure of HJWL in August. (e,f) Leaf microstructure of XJ in June. (g,h) Leaf microstructure of XJ in August. Red arrow indicates VB and EP. EP: epidermal papillae; LE: lower epidermis; Pa: palisade; SC: secretory cavity; Sp: spongy tissue; UE: upper epidermis; VB: vascular bundle.
Horticulturae 11 00395 g004
Figure 5. SEM of ginkgo HJWL and XJ leaves. (ad) The HJWL leaf SEM. (eh) The XJ leaf SEM. St: stomata; VZ: vein zone; IV: inner vein zone.
Horticulturae 11 00395 g005
Figure 6. TEM of ginkgo HJWL and XJ leaves. (a,d,g) The HJWL leaf TEM in May. (b,e,h) The HJWL leaf TEM in June. (c,f,i) The HJWL leaf TEM in July. (j,m,p) The XJ leaf TEM in May. (k,n,q) The XJ leaf TEM in June. (l,o,r) The XJ leaf TEM in July. Ch: chloroplast; CW: cell wall; M: mitochondria; O: osmiophilic granule; S: starch; T: thylakoid; V: vacuole.
Horticulturae 11 00395 g006
Figure 7. Chlorophyll fluorescence parameters of G. biloba. (a) Initial fluorescence yield (Fo). (b) Maximum fluorescence yield (Fm). (c) Variable fluorescence (Fv). (d) Maximum photochemical efficiency (Fv/Fm). (e) Actual photochemical efficiency (ΦPSII). (f) Non-photochemical quenching (NPQ). (g) PSII electron transfer rate (PSII). Data are given as mean ± SE (n = 3). Columns with different lowercase letters are statistically different (p < 0.05).
Horticulturae 11 00395 g007
Figure 8. Differences in photosynthetic parameters and metabolites of HJWL and XJ. (a) Net photosynthetic rate. (b) Stomatal conductance. (c) Transpiration rate. (d) Intercellular CO2 concentration. (e) Light response curve of HJWL and XJ. (f) The secondary metabolite content of HJWL and XJ. Data are given as mean ± SE (n = 3). Columns with different lowercase letters are statistically different (p < 0.05).
Horticulturae 11 00395 g008
Figure 9. Correlation heat map between physiological indicators. (a) HJWL. (b) XJ. * Indicates a significant correlation at p < 0.05.
Horticulturae 11 00395 g009
Figure 10. Genetic structure of ginkgo HJWL and XJ. (a) Plot of CV error for K from 1 to 10 in STRUCTURE analysis. (b) ADMIXTURE analysis results for K = 2. (c) Principal component analysis of 10 germplasm. (d) Phylogenetic tree for 10 ginkgo germplasm.
Horticulturae 11 00395 g010
Disclaimer/Publisher’s Note: The statements, opinions and data contained in all publications are solely those of the individual author(s) and contributor(s) and not of MDPI and/or the editor(s). MDPI and/or the editor(s) disclaim responsibility for any injury to people or property resulting from any ideas, methods, instructions or products referred to in the content.

