3.1. Experimental Data Obtained and Correlations Between Them
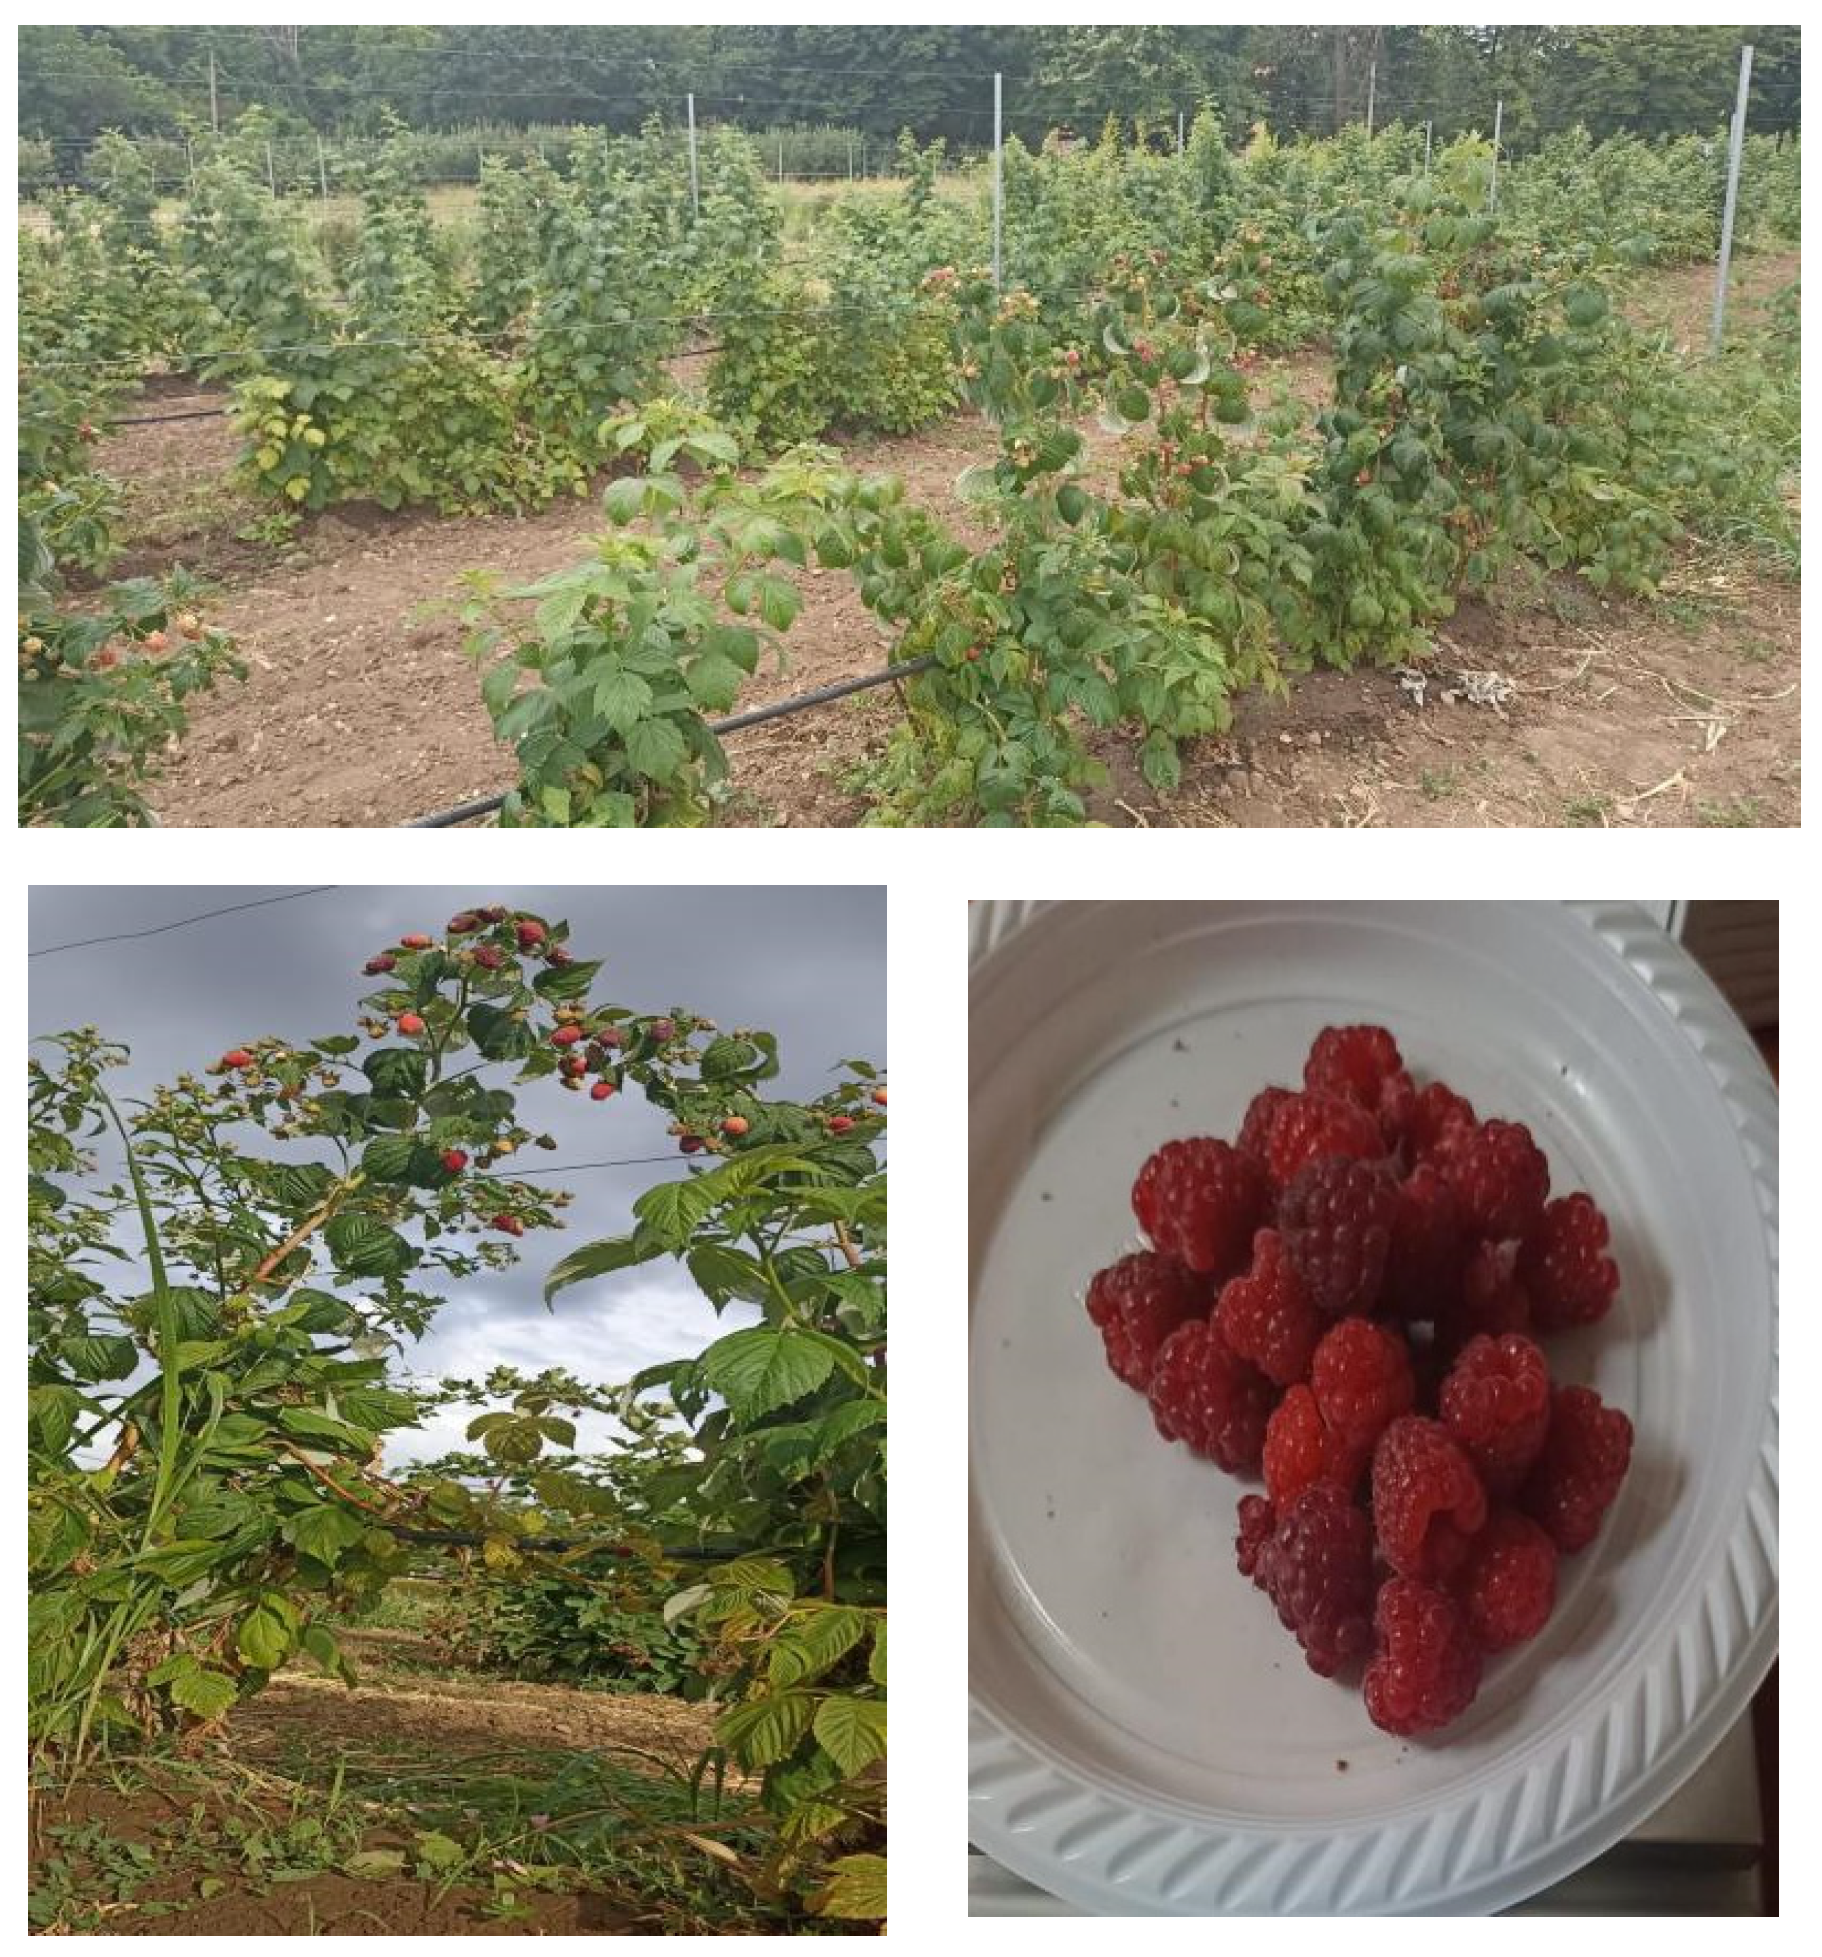
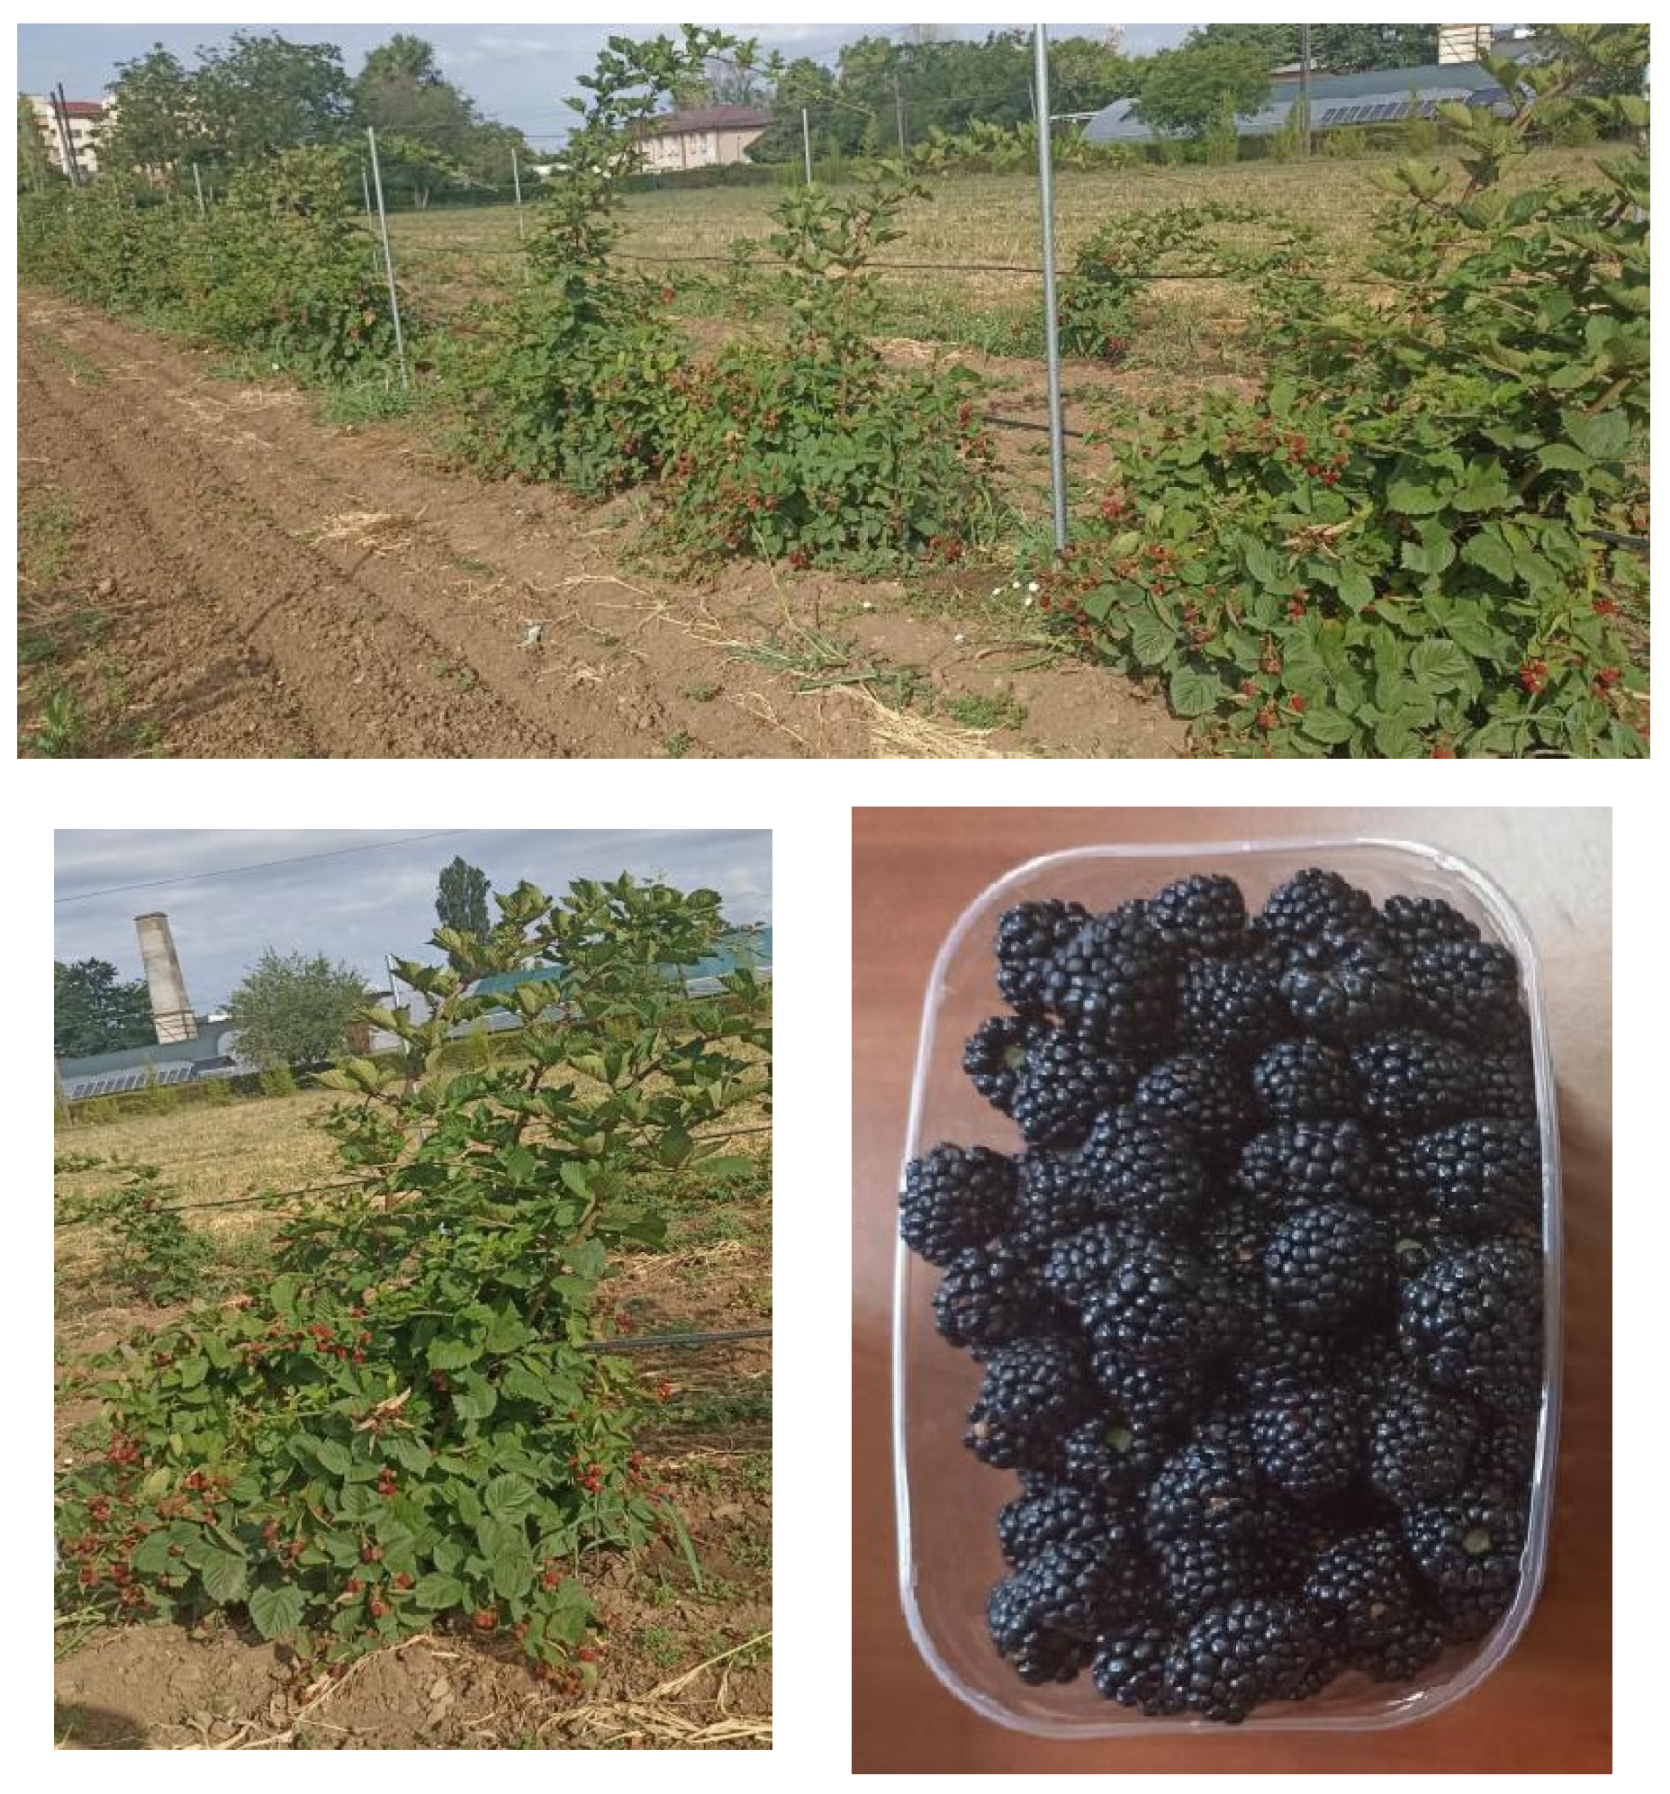
Depending on the temperatures during this period, the ripening of raspberry fruits begins in the first decade of June and continues until October, and the ripening of blackberry fruits begins in the second decade of June and ends at the end of August, both crops with some deviations depending on the temperatures established during this period.
Table 5 presents the vegetative and productive parameters monitored and measured in raspberry and blackberry plants.
The results regarding the vegetative indicator average number of ripe fruits report that there are significant variations in the values over the five-month period, which ranged from 32 to 115 for raspberries and 18 to 327 for blackberries (
Table 5). The average for the five-month period of the first year of cultivation of the two plants was 389 pieces for raspberries and 473 pieces for blackberries, which shows that the two varieties of berries were very productive from the first year of fruiting. The average height of the shoots at the end of the vegetation period for the two plants studied was increasing for both raspberries (1400 mm) and blackberries (3474 mm).
Regarding average stem thickness at the end of the vegetation period, it was 8.54 mm for raspberries and 12.78 mm for blackberries, significantly higher between June and July for raspberries (the increase being 1.25 mm between the two months), with the smallest increase in stem diameter for raspberries being recorded between July and August (0.15 mm). For blackberries, a significant increase in stem diameter was recorded between July and August (1.07 mm) and the smallest between September and October (0.48 mm). Therefore, the values recorded for thickness required the application of a support system for the two crops from the first year of vegetation to ensure plant growth. According to [
18], large, thick shoots produce more fruit-bearing branches.
The productivity of the plants was at its maximum in June and July for raspberries (≈250 g/month/plant), the first harvest; and the second harvest was lower, ≈70–160 g/plant. In the case of blackberries, only in the first three months of the five were fruits harvested; maximum productivity was reached in July and was 1252 g/plant.
By applying an ANOVA test, it was observed that there were significant differences between the measurement months for all analyzed parameters (plant height, stem diameter, fruit weight and number of fruits), with a statistical significance level of p < 0.05. Then, to identify between which months there were significant differences for each parameter separately and for each crop, the post hoc Tukey test was applied, which identified significant differences between the measurement months for all parameters, both for raspberries and blackberries. In raspberries, plant height and fruit weight varied significantly between June and October, and the number of fruits was higher in July and September than in August. In blackberries, plant height and fruit weight showed significant differences between July and subsequent months (August, September), and the number of fruits decreased significantly after July. Therefore, these differences reflect seasonal variations in plant growth and fruit production, with maxima in June and July and significant decreases in August and September.
Next, a t-test was applied to compare the means of the two crops, raspberries and blackberries, for each parameter and for each month and to determine whether the differences between them are statistically significant. The results showed that blackberries are significantly taller and have thicker stems than raspberries in all months. In terms of fruit production, blackberries have heavier and more numerous fruits in June and July, but the differences disappear in August, September and October, when production decreases significantly for both crops.
Applying the t-test, it was found that the differences between raspberries and blackberries were statistically significant for plant height and stem diameter in all months (p < 0.05). In the case of fruit weight and number of fruits, the differences were significant in June and July (p < 0.05) but not in August, September or October (p > 0.05)
Table 6 presents the correlations between the parameters investigated in this paper.
In raspberries, a very high correlation dependence was reported from correlation analyses, between height indicators and shoot thickness but also between height and the number of harvested raspberry fruits (0.99) (
Table 6), a fact also supported in the work [
18].
In blackberries, a very high correlation dependence was reported from correlation analyses, between height indicators and fruit weight (0.99). Small correlations exist between the number of harvested fruits and fruit weights of both studied berry varieties.
Therefore, a high to very high correlation dependence between shoot height and thickness, shoot height and ripe fruit weight, and shoot height and ripe fruit number was reported throughout the growing season. There is a very strong relationship between plant height and stem diameter (r = 0.99 for raspberry and r = 0.98 for blackberry), suggesting that taller plants usually have thicker stems. Fruit weight and number of fruits have a moderate correlation (r = 0.68 for raspberry and r = 0.58 for blackberry), indicating that a higher number of fruits does not necessarily imply a higher weight per fruit. All variables are intercorrelated, showing that plant size influences fruit production and the selection of plants with desired characteristics in agriculture. There are significant relationships between these plant characteristics throughout the growing season, and they may be particularly useful for researchers and farmers studying plant behavior under specific environmental conditions.
These correlations could suggest that by managing shoot height (through pruning, proper care, fertilization or irrigation), fruit production can be optimized, both in terms of quantity (number of fruits) and quality (fruit weight). This information can be extremely valuable for optimizing agricultural practices and increasing yields.
In the case of raspberry and blackberry crops, from the analysis of the mentioned correlations, the growth parameters that are most related to crop yield are plant height and stem diameter. According to the correlations, on the one hand plant height has a very strong correlation (r = 0.99) with the number of fruits and fruit weight. This suggests that taller plants tend to have a higher yield, as they are able to support more fruits and heavier fruits. Vertical plant growth is an important indicator of vigorous development and the ability to support a higher production. On the other hand, the very strong correlation (r = 0.96) between stem diameter and the number of fruits and fruit weight indicates that a larger stem diameter is associated with higher fruit production. Thick stems are generally a sign of a healthy and robust plant, and are able to support more and larger fruits, which directly contributes to the yield.
Therefore, both plant height and stem diameter are growth parameters that significantly influence the yield of raspberry and blackberry crops, having very strong correlations with the number and weight of fruits. Therefore, optimizing the vertical development of plants should be a priority in crop management to maximize fruit production.
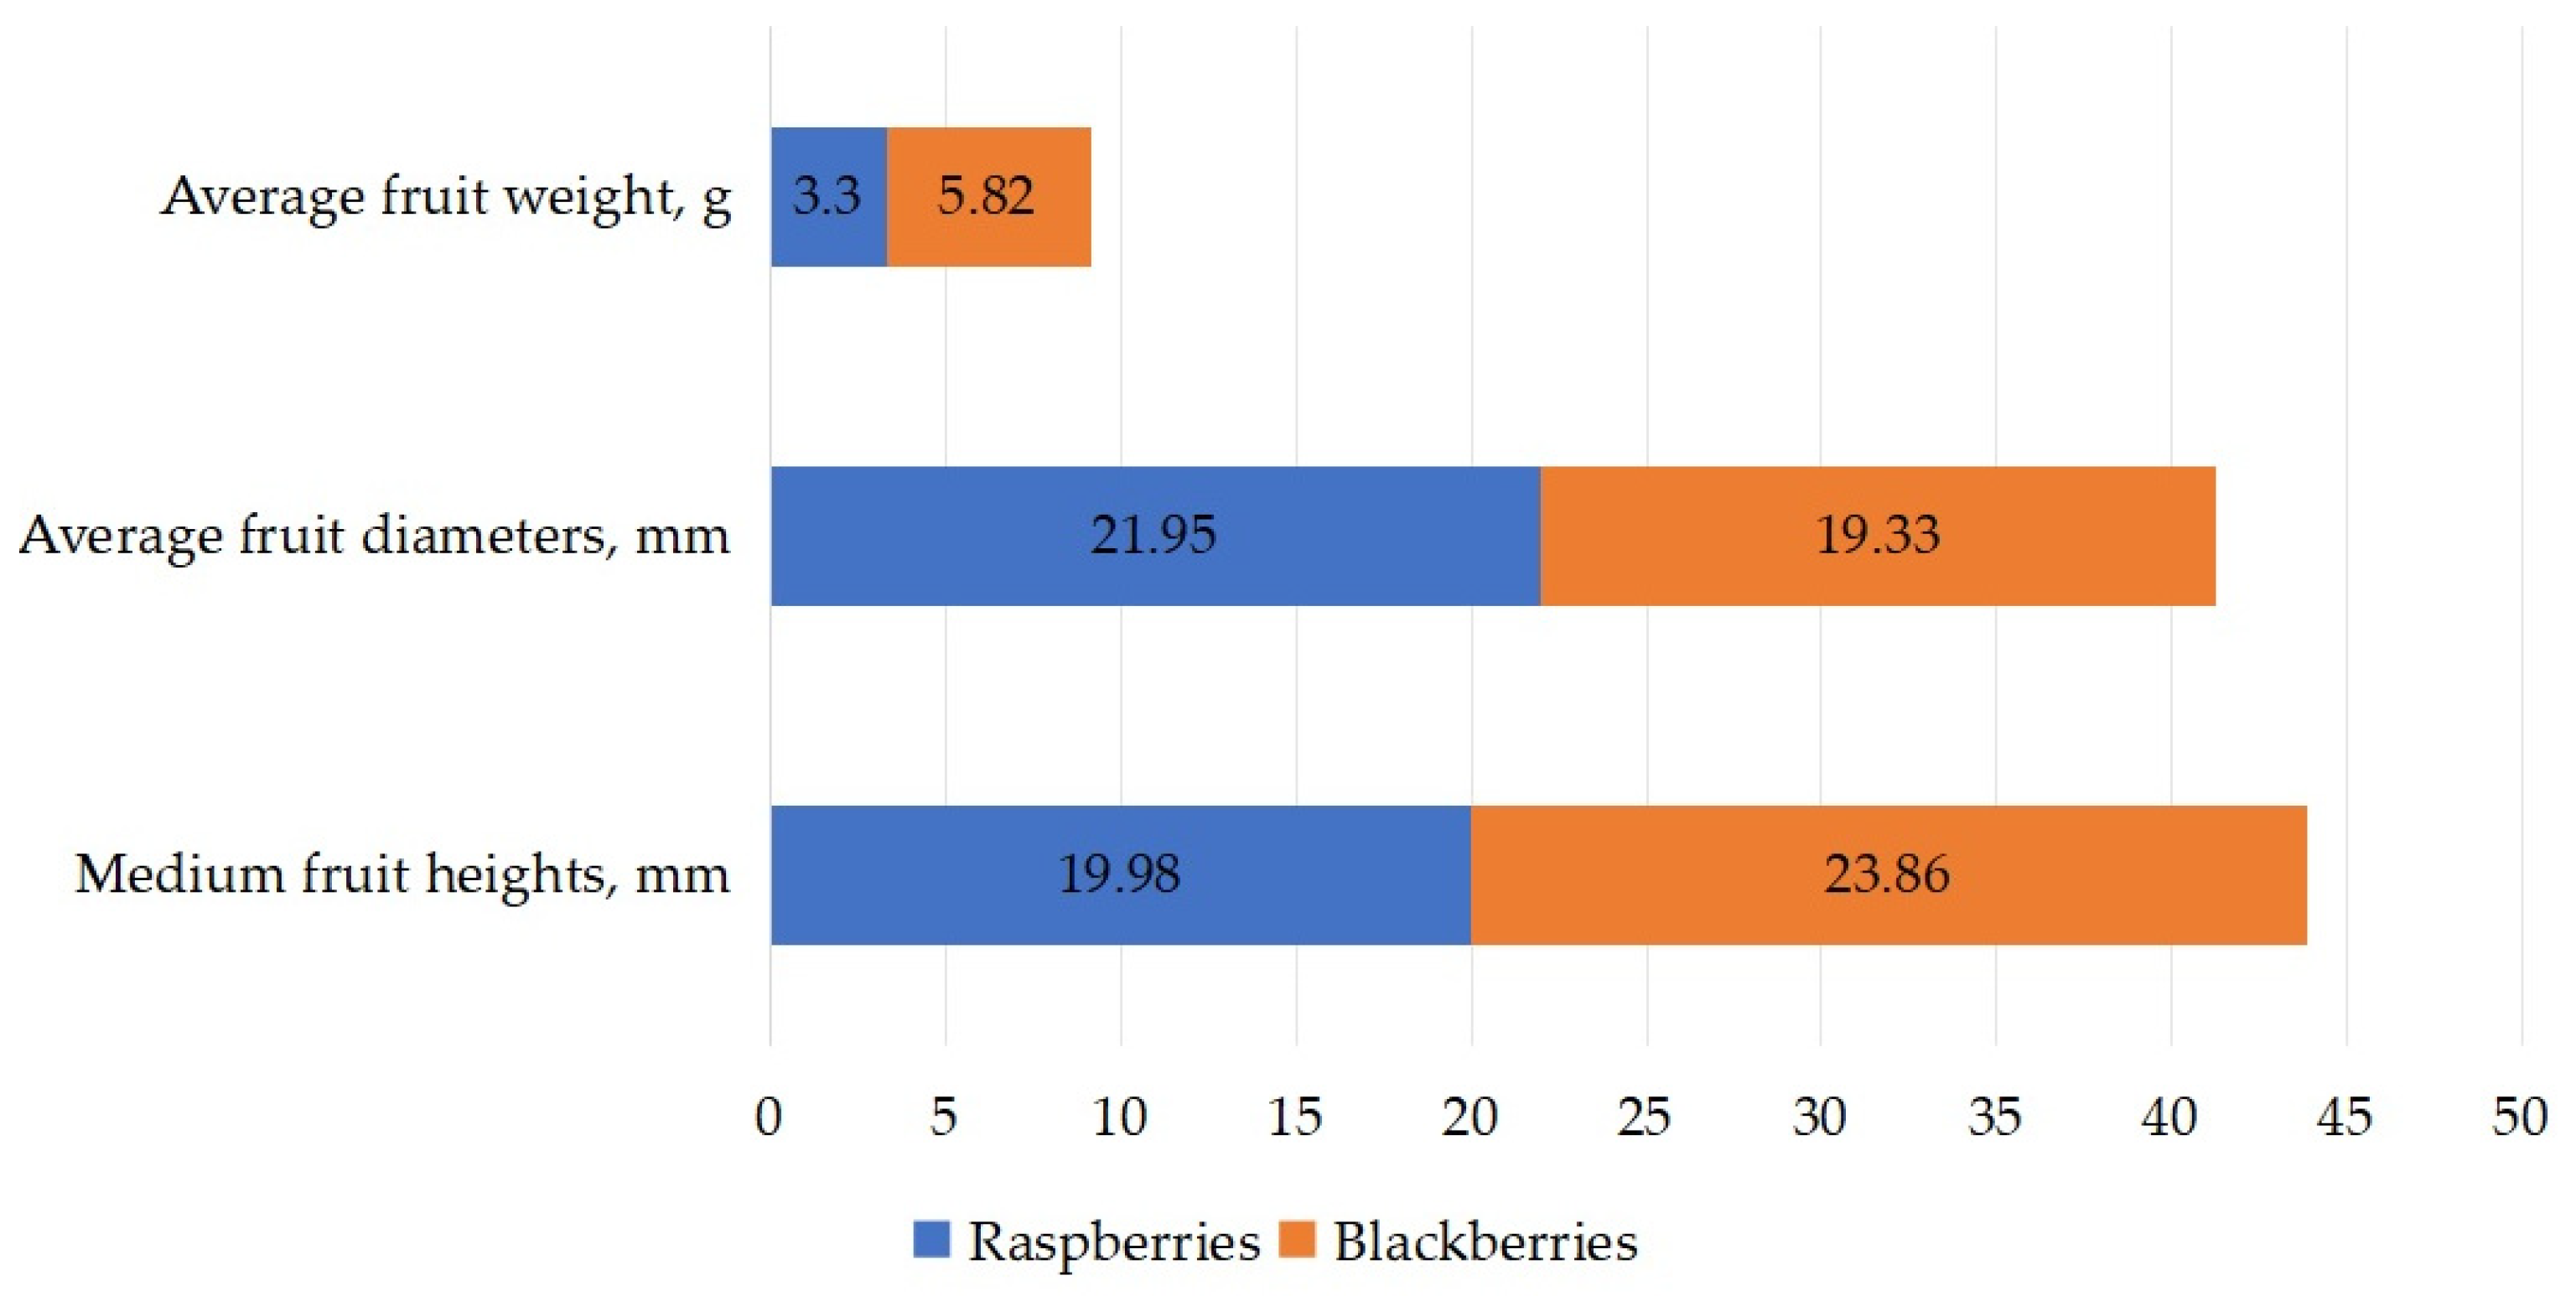
Average dimensions for ripe fruits of the two studied berry varieties are presented in
Figure 4.
The weight of the fruits of the two varieties indicates the value of 5.82 g/fruit for blackberries and 3.3 g/fruit for raspberries. If in the case of mass, the blackberry is heavier than the raspberry, in the case of diameter, it is larger for raspberries at 21.95 mm than for blackberries at 19.33 mm. In general, raspberry fruits have a smaller diameter than blackberry fruits, but there is some variability depending on the type of variety and growing conditions. The “Delniwa” raspberry variety is a hybrid variety specially developed to produce large fruits if the growing conditions are provided precisely with its cultivation technology. Regarding the heights of the fruits, because blackberries have a more elongated shape, they are taller (23.86 mm) than raspberry heights (19.98 mm).
3.2. Statistical Models for the Cumulative Production of a Raspberry and Blackberry Plant, Depending on Vegetative and Productive Indices, During the First Year of Vegetation
The data found in the experiments described in
Table 5 were used to obtain statistical mathematical models by linearization and interpolation.
In this paper, we chose to analyze the experimental data using both linear and polynomial (2nd, 3rd and 4th degree) and hyperbolic models to provide a complete perspective on the dynamics of raspberry and blackberry crops. Linear models, although useful for a first understanding of the data, failed to capture the significant nonlinear variations observed in fruit production and plant growth. In contrast, polynomial models provided a more accurate approximation, allowing the identification of seasonal trends and production tipping points.
3.2.1. Application of the Linearized Model on Experimental Data of Raspberry and Blackberry Crops
Based on the experimental results presented in
Table 5, the logarithmic equation (Equation (1)) was applied, resulting in the linearized model coefficients, the model interpretation and the correlation coefficient (r) for each parameter and crop, shown in
Table 7.
where ln(y) is the natural logarithm of the parameter, y is the measured parameter, the dependent variable, (e.g., plant height, stem diameter, fruit weight, number of fruits); x is the month, the independent variable (June, July, August, September, October) used for linearization; the coefficient a (slope) shows the rate of increase or decrease of the parameter per month, of y as a function of x; the coefficient b (intercept) represents the initial value of the parameter, the value of ln(y) when x = 0.
Table 7 shows that the linearized models provide a good approximation of the data, with correlation coefficients (r) close to 1 for most parameters. Plant height and stem diameter show a constant increase throughout the season, while fruit weight and number decrease significantly in August. These results suggest that the linearized models are suitable for analyzing plant growth but may be insufficient to describe sudden variations in fruit production.
Next, to obtain the real values of the parameters from the linearized models, we applied the exponential to both sides of the equation; this transformation is necessary to interpret the results in real units of measurement (m, mm, g). The values calculated with the exponential were very close to the experimental data, which confirms that the linearized model is accurate.
By applying the linearized model and exponential to experimental data of raspberry and blackberry crops, we have obtained a clear understanding of their growth dynamics and productivity. Raspberries and blackberries have constant growth, but different rhythms. Raspberries produce fruit consistently, with a peak in June–July and a slight recovery in September, while blackberries have high production in early summer but drop dramatically in August. Therefore, this model can help farmers optimize harvest and resources, adapting irrigation and fertilization to prevent yield decline.
3.2.2. Application of Polynomial and Hyperbolic Models on Experimental Data of Raspberry and Blackberry Crops
The following are 2nd, 3rd and 4th degree interpolations of the production/plant at the monthly harvest of ripe fruits, depending on certain vegetative and productive indices, such as average plant height, average stem diameter and number of ripe fruits harvested.
Polynomial interpolations of the production/raspberry and blackberry plant (P) during the fruiting, ripening and harvesting period (approximately five months for raspberries and three months for blackberries) depend on three vegetative and productive indices (Ivr), namely, average plant height, average stem diameter and number of fruits harvested during the first vegetative year.
The general form of the interpolation polynomial (degrees one to four) is
The general form of a hyperbola is
The coefficients of the polynomials (1) are given in
Table 8, and those of the hyperbola (2) are given in
Table 9.
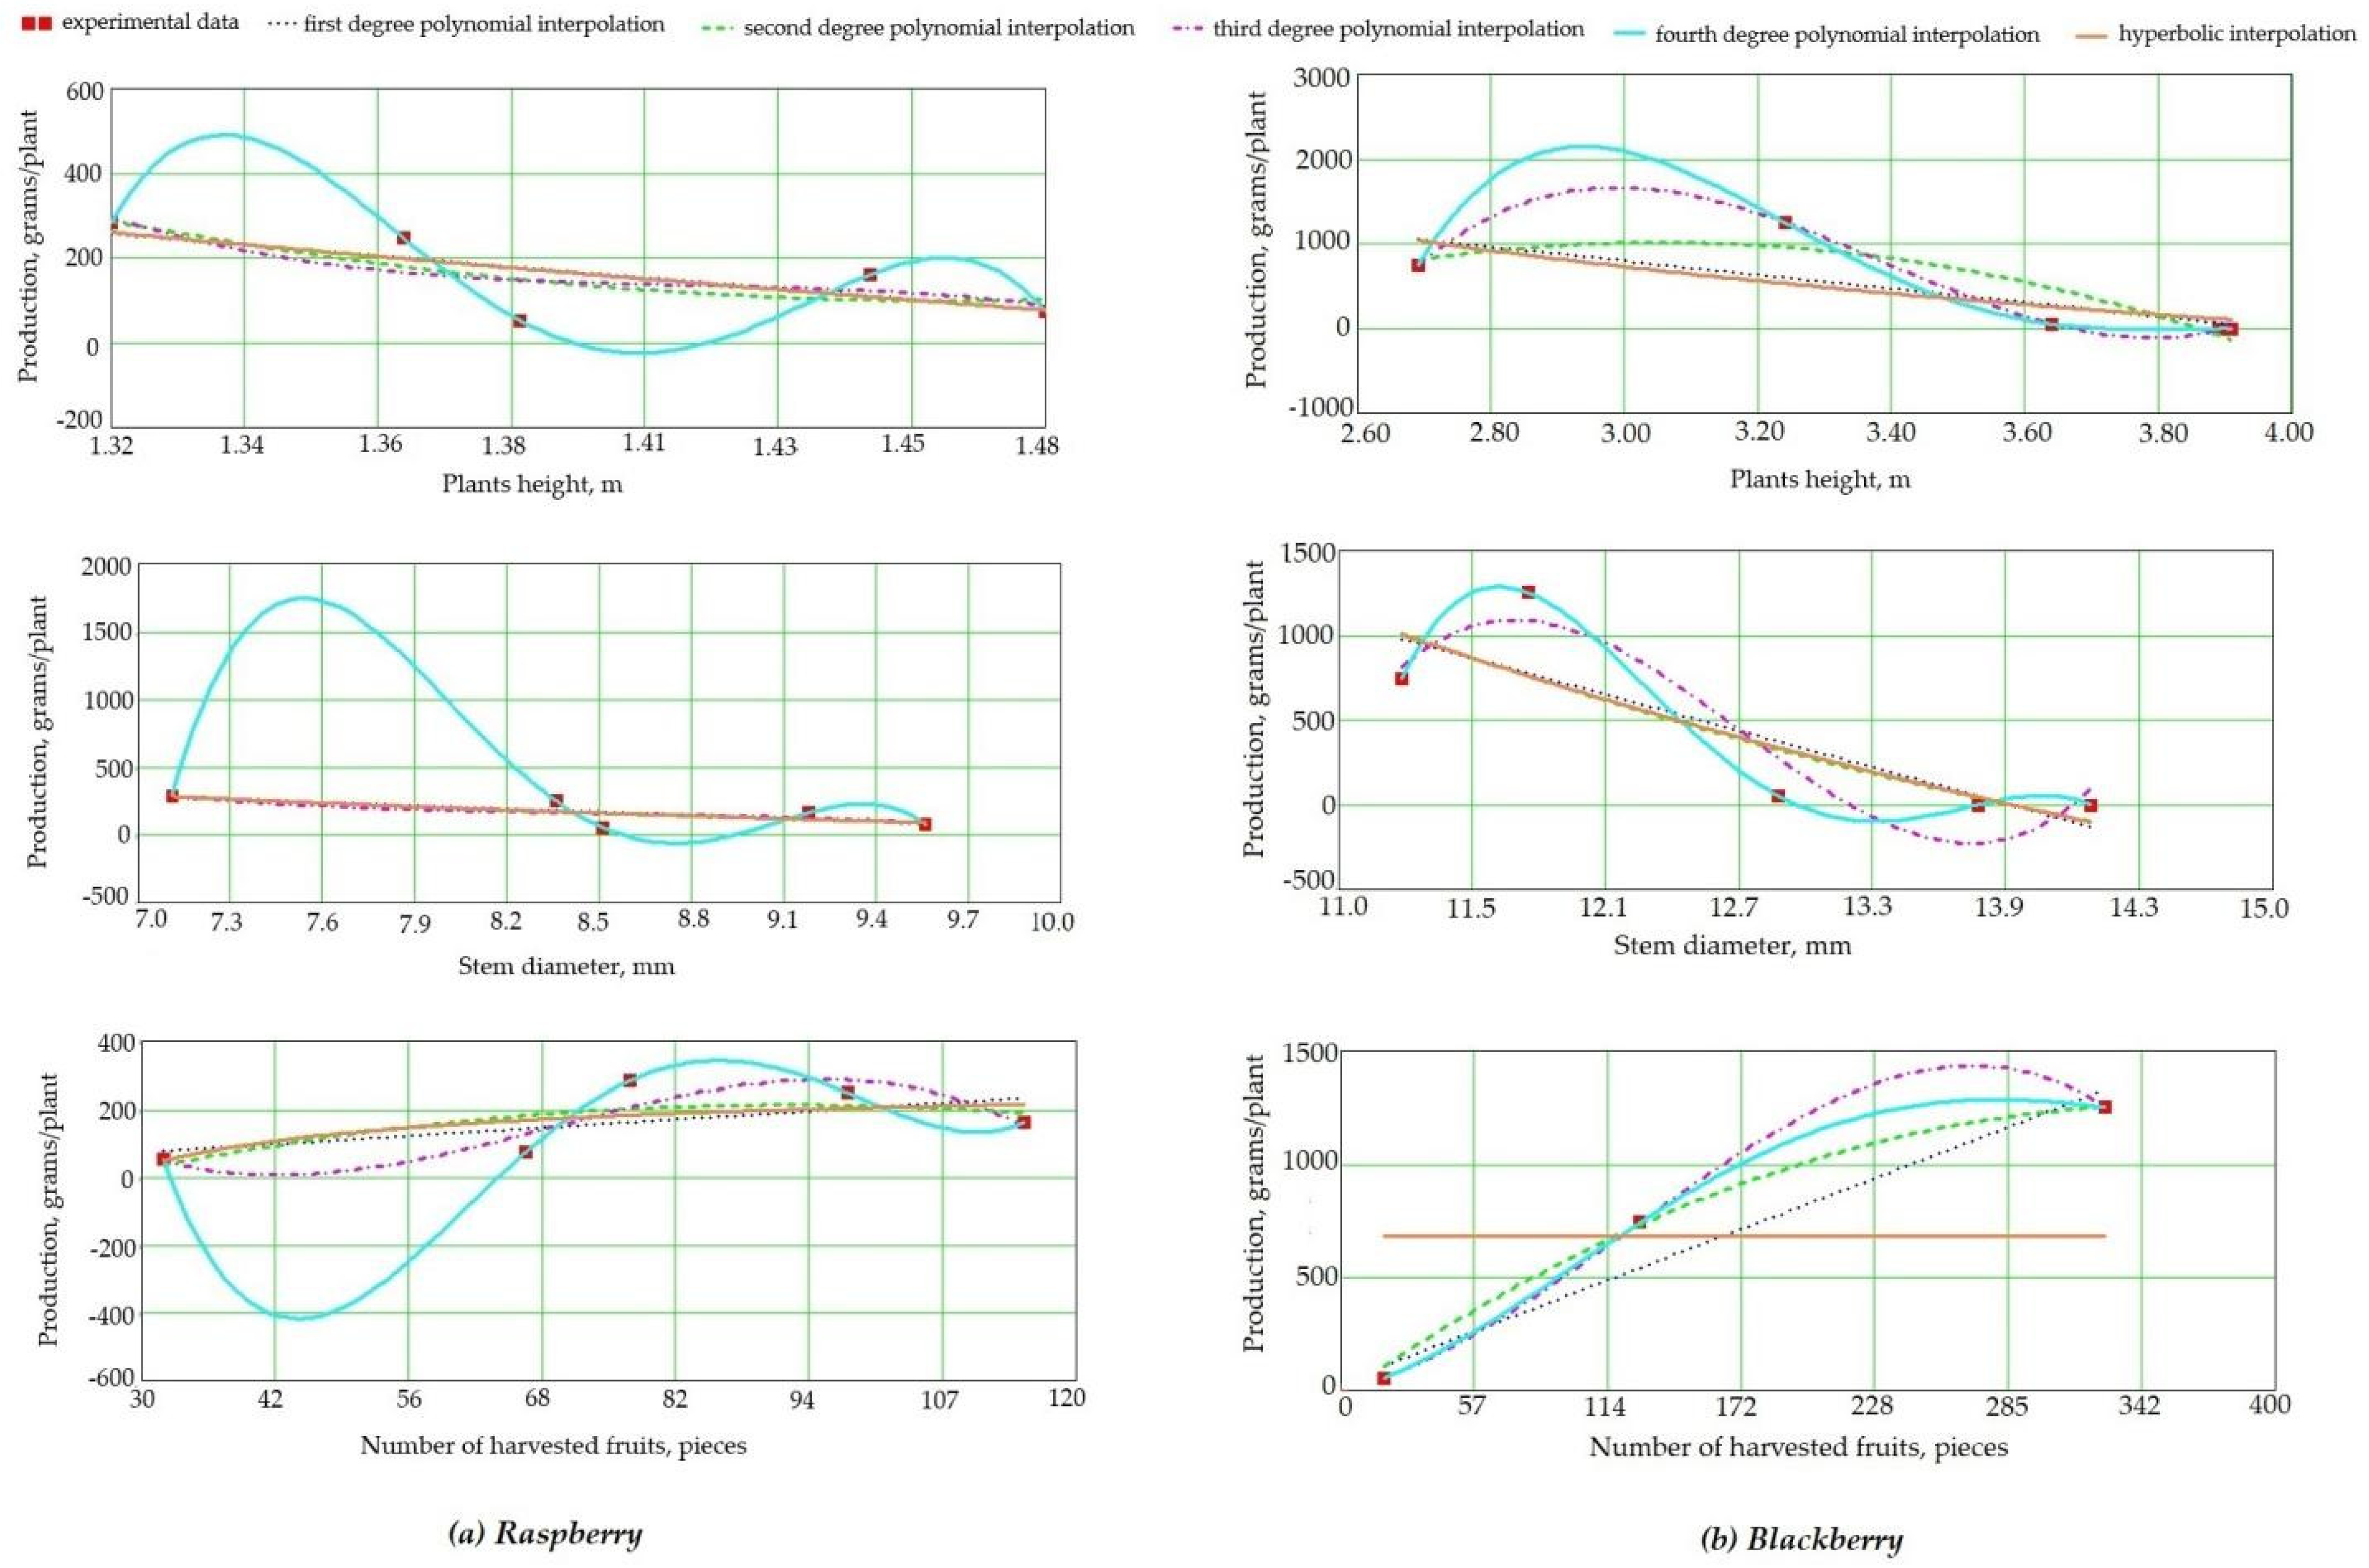
The graphical representations of the polynomial interpolations of fruit production/plant (raspberry, blackberry) at harvest depending on plant height, stem diameter and number of ripe fruits harvested are shown in
Figure 5.
The interpolation formulas can be used to forecast raspberry and blackberry production at the end of the vegetation period for each of the studied plants. The forecast will be made, however, only within the limits of the interval of each vegetation and reproduction index given by their minimum and maximum values used in the experiments.
A first conclusion shows that interpolation polynomials of degrees one and two are the most usable because they have small variations between the experimental points. Polynomial curves of degree three and four show relatively large variations between the experimental points and therefore their use presents the risk of producing large errors, although, for example, restricting ourselves only to the set of experimental points, the polynomial of degree four passes exactly through the experimental points.
In general, the interpolation curves show a decreasing trend in productivity per plant (at the final stage of vegetation/harvest), depending on the height of the shoots and the diameter of the stem, and the number of ripe fruits harvested. For this reason, a polynomial Formula (1) and a hyperbolic interpolation Formula (2) were considered, which prove adequate with some exceptions in which the experimental data do not detect the above-mentioned trend.
The statistical mathematical models provided by Formulas (1) and (2), whose generic coefficients, for each specific case, are given in
Table 4 and
Table 5, can be used for interpolation (calculation of any productivity for a raspberry or blackberry plant, respectively, only in the experimental interval considered for the values of plant height, stem diameter and number of ripe fruits).


 ,
, 
