Abstract
Food fraud is a matter of great interest, particularly when organic productions are involved. Therefore, policymakers and institutions are asked to introduce new effective official control methods, not only based on documentary compliance to EU regulations. Lately, an integrated approach based on the use of isotopic, chemical and biological data treated by chemometrics has been suggested to authenticate organic products. The present research aims to validate the beforementioned integrated approach for the reliable classification of organically and conventionally grown fennel productions obtained by applying different treatments at diverse percentages of mineral fertilizers. Moreover, to the best of our knowledge, for the first time, an N-fixing plant (alfalfa), as an agroecological service crop in intercropping fennel, was introduced. Physicochemical parameters (fresh weight, total soluble solids, total acidity, consistency, Commission Internationale de l’Eclairage (CIE) lightness (L*), green-red (a*), blue-yellow (b*) color components), total phenolic content, in vitro antioxidant activity, total and inorganic N, and stable isotope ratios (15N/14N, 13C/12C, and 34S/32S) analyses were performed over a two-year field trial and further multivariate discriminant analysis was performed. The physicochemical parameters were not affected by the differential growing practice while antioxidant activity showed higher values in the organic treatments. The conventional treatments increased the NO3− values over 440% compared to the organic ones and the lowest values were found when alfalfa was used for intercropping. δ(15N) of fennel, δ(34S) of fennel and δ(15N) of leaves showed great discriminatory potential, with respect to the applied agronomic practice. However, these parameters alone were not sufficient as biomarkers for differentiating cultivation methods. Instead, the proposed innovative tool demonstrated that only a comprehensive multivariate approach was able to achieve a correct classification of grouped cases. Furthermore, the discrimination between organic and conventional horticultural products showed feasible results, even when N-fixing plants were incorporated in organic practice, thus avoiding misinterpretations solely based on the isotopic N fingerprint. These promising findings highlight the potential of this method and suggest that further research should extend its application to other horticultural crops to confirm and expand upon the current results.
1. Introduction
Nowadays, the conversion of cropland from conventional to organic agriculture is constantly increasing, sustained by both consumers’ high sensitivity to sustainability issues and institutional policy targets introduced by the European Green Deal strategic initiatives package [1] and the United Nations’ sustainable development goals [2]. In this context, farmers are encouraged to implement the conversion to organic farming, also taking into account that the quality of organic products is more profitable on the markets, compared to that of conventional ones. Data from the Italian utilized agricultural area (UAA) in 2023, showed, thanks to the support offered by the Common Agriculture Policy (CAP) [3], a significant growth reaching 2.5 million hectares (+4.5% compared to 2022, equal to +106 thousand hectares) [4]. This increase shortens the gap from the target of 25% of organic UAA to be achieved by 2030, as set by the European Commission within the Farm to Fork Strategy [1]. In the last year, the Italian organic horticultural crop production has recorded an increase of 1% respect to the previous year [4]. Taking into consideration the great efforts and challenges to be faced by the farmers where organic horticultural crop production is concerned, this growth represents a fairly interesting perspective in terms of the continuity of the whole supply chain.
The conversion to organic farming requires the adoption of sustainable practices aimed at eliminating the use of synthetic fertilizers and pesticides. Thereby, with the aim of increasing the fertility of the soil and preventing pests and pathogens attacks, organic farmers are required to apply only the allowed organic fertilizers and plant protection products, while implementing sustainable measures to avoid crop production losses. In organic vegetable rotations, the introduction of cover crops, planted either before or concurrent with a cash crop, may provide many beneficial ecosystem services, which could both sustain agricultural production and promote environmental protection [5]. Different cover crop species have been evaluated as a tool to improve agroecosystem resilience to control the weeds, pest occurrence, preserve in-field biodiversity, and therefore, to increase crop production [6]. The implementation of these agroecological practices requires redesigning existing cropping systems, which are typically relatively undiversified. One of these practices is intercropping, which consists of coexistence of two or more crop species simultaneously in the same field with different spatial arrangements [7]. In sustainable agricultural systems, and, in particular, in organic vegetable production, the intercropping can provide many beneficial ecosystem services and could be used in many horticultural systems to reduce the nitrogen (N) supply of cash crops. Specifically, when leguminous cover crops are introduced, atmospheric N fixation enhances nitrogen-use efficiency. The use of self-reseeding annual legumes, such as alfalfa, may play a crucial role in Mediterranean organic farming by reducing the need for external agricultural inputs [8].
However, the effort made by responsible farmers to carry out high-yield, safe and environmentally compatible horticultural organic productions may clash with the incorrect behavior of some deceitful producers who adopt fraudulent agronomic practices not allowed in organic farming. According to current European Regulation (EU) 2018/848 on the organic production and labeling of organic products [9], official controls must be carried out in accordance with Regulation (EU) 2017/625 [10]. This regulation establishes that official control methods must include an examination of documents, traceability records and other records which may be relevant for the assessment of compliance with the rules. However, to ensure high yields and avoid phytosanitary threats, fraudulent farmers adopt unfair practices and produce fictitious farm registers to the control bodies. That is why the possibility to unequivocally trace the origin of organic products is of great relevance to reassure the consumers who consciously choose to buy organic products. Organic trade associations and consumer federations are thus pressingly asking for the implementation of a traceability system based on reliable and reproducible analytical tools. Since organic authenticity has increasingly been a matter of interest, over the last two decades, many studies have proposed analytical methods to discriminate organic vs. conventional farming products on the basis of isotopic fractionation of the N source used as fertilizer [11,12,13]. The possibility of differentiating two samples on the basis of isotopic analysis is related to the N isotopic fractionation that happens in raw materials, i.e., the deflection from the natural isotopic allotment of N, the N isotopic ratio (15N/14N), as a consequence of natural biogeochemical processes. Specifically, the production and maturation of organic fertilizers cause a preferential volatilization of the lighter isotope; therefore, the resulting N isotopic ratio in organic fertilizers turns to be significantly higher respect to synthetic ones. It has been widely demonstrated that this difference is also reflected in the harvested crops [14,15,16]. However, some controversial studies have also reported that N isotopic ratio may not be discriminatory for all the crops and management conditions. Indeed, it has been demonstrated that when organic fertilizers are applied in conventional agriculture, or when crops with low N requirement are concerned, the N isotopic ratio alone may not allow a reliable discrimination [17,18]. Moreover, specifically targeting horticultural crop productions, the application of N-fixing plants as cover crops or agroecological service crops in organic agriculture could have an impact on the N isotopic signature of the harvested crop leading to the misclassification of real organic horticultural products.
Very recently, an integrated approach based on the use of isotopic, chemical and biological data treated by chemometrics has been suggested by the authors to authenticate organic products [19]. This approach has been further tested and validated for the cauliflower crop in different productive and environmental conditions [20]. In this study, different treatments were carried out and compared, including organic, conventional, and mixed ones at different percentages of mineral fertilizers, including the application of a non-N-fixing plant, the horseradish (Raphanus sativus L.), as an agroecological service crop. However, there is a lack of knowledge about the validation of this approach to different crops, environments and while applying N-fixing plants as cover crops.
Based on what has been stated so far, the present research aims are to test and validate the beforementioned integrated approach as a reliable analytical tool to improve organic fennel authenticity. To achieve a reliable classification of organically and conventionally grown fennel productions, different treatments representing diverse percentages of mineral fertilizers were applied. Moreover, to the best of our knowledge, the first time a N-fixing plant (alfalfa) was introduced was as an agroecological service crop in intercropping fennel. The proposed validated tool will help to protect the efforts made by responsible organic farmers while preventing food frauds committed by some deceitful organic producers who adopt fraudulent agronomic practices, including the use of synthetic fertilizers, which is not allowed in organic farming.
2. Materials and Methods
2.1. Field Experiment Setup, Experimental Design, Crop Production and Plant Material Determinations
A two-year experimental field trial was carried out at the Council for Agricultural Research and Economics in the Research Centre for Agriculture and Environment, in the experimental farm “Campo 7” (located in Metaponto (MT)—South Italy, lat. 40°24′ N; long 16°48′ E and 8 m.a.s.l.). The soil of the experimental farm is classified as Vertic Cambisols according to WRB classification. It contains 42, 39, and 19% of clay, loam, and sand, respectively. It is also characterized by about 25 g∙kg−1 of organic matter, 759 mg∙kg−1 of exchangeable potassium, 31.1 mg∙kg−1 of Olsen phosphorus, pH 7.8 and 0.48 mS∙cm−1 of electrical conductivity. We decided to investigate the presence of N content only in the bulbs and not in the soils, since fennel is consumed as fresh vegetable, and the nitrate level is a limiting factor for consumer health. Therefore, we focused on the crop production and N content in bulbs.
In the study, here reported, two years of fennel cultivation (Aurelio/Augusto F1 cv—Cycle: 150 days) are presented, during the 2018 and 2019 cropping seasons. According to the Köppen–Geiger classification, the area falls under the Csa climate, characterized by hot, dry summers and mild, wet winters. The average monthly temperatures (September to December) during each cropping cycle (16.9 and 15.9 °C in the first and second cycle, respectively) were quite close to averages of the long-term value (15.3). The cumulative rainfall recorded during the fennel field experiment was 206.2 and 342.4 mm in the first and second cycle, respectively, compared to 244.8 mm in the long period.
Six fertilization strategies, placed on three field strips of the experimental field were compared as follows: (1) “Organic” as pelleted animal manure (3% N) applied at transplanting in a soil managed without synthetic fertilization in the last several years; (2) “Mix-organic” with 1/3 N by pelleted animal manure at transplanting + 2/3 as synthetic N (i.e., UREA) one month after transplanting, in a soil without synthetic fertilization for several years; (3) “Conventional” with only synthetic N fertilization, in a soil in which chemical fertilization has always been managed using conventional techniques, by using UREA as 1/2 N at the transplanting + 1/2 one month after transplanting; (4) “Mix conventional-a” carried out in a soil in which chemical fertilization has always been managed using conventional techniques. Fertilization was performed at the transplanting with 1/3 N by pelleted animal manure + 2/3 with synthetic N one month after transplanting; (5) “Mix conventional-b” carried out in a soil in which chemical fertilization has always been managed using conventional techniques. Fertilization was performed at the transplanting with 2/3 pelleted animal manure + 1/3 with synthetic N one month after transplanting; (6) “Organic + agro-ecological practices (Organic + AEP)” with N applied at transplanting and only as organic fertilizer of vegetable origin (Vegand: 4–1.4–0). This latter treatment was a part of a long-term filed experiment [21], in which different agroecological practices are being tested. In particular, in fennel cropping system the alfalfa (Medicago sativa L.) was used as intercropping to sustain the cash crop and to increase N utilization efficiency of the entire system. The total amount of fertilizer (organic plus mineral) was 120 kg∙ha−1 for each elementary plot, which is the normal amount of fertilizer applied for this crop by the organic producers. Each elementary plot consisted of 57.6 m2, replicated 4 times. Based on the percentage of organic and mineral fertilizers (pellet, Vegand, and UREA) applied for each treatment, we calculated the right amount of organic and/or mineral fertilizers distributed in each treatment in one solution (at transplanting) or two times (transplanting and one month after), according to the fertilizer strategies adopted and above described.
The fennel crops were transplanted on 06th and 10th September 2018 and 2019, respectively, with a spacing of 0.30 m per row and 0.80 m between rows (about 240 plants for each treatment). To avoid the fertilizer contamination among the treatments we separated the plot along the row for 1 m. Moreover, we collected the plants for the analyses in the center of each elementary plot to be sure that there was any possible contamination among fertilizer treatments. The harvest occurred at the commercial maturity on 28 November 2018 and 4 December 2019, respectively. Pathogens control was the same in all N fertilization strategies, according to the European regulation for organic productions. In particular, even if two of the three fields were not conducted according to organic production, we decided to apply the same procedure for crop husbandry at all treatments. Finally, we adopted the same agronomical practices (no irrigation, weed control, etc.) at all treatments even if they were cultivated in different fields, in order to attribute the difference only at the fertilizer strategies.
Every year in June and at the fennel harvest (late November and early December in 2018 and 2019, respectively), one soil sample for each elementary plot (6 treatments × 4 replicates = 24 samples) was collected. To have a more representative sample we collected five sub-samples of 0–30 cm from each plot randomly along the diagonal of each plot, and they were pulled into one sample for the chemical analyses. We did this operation manually with a hand auger. At the fennel harvest, we collected the plants samples in the middle of each elementary plot. Each plant was divided into leaves and fennel marketable yield for each elementary plot (24 samples).
The physicochemical parameters (fresh weight, total soluble solids, total acidity, consistency, CIE L*, a*, b* color components) were determined on fresh fennel bulb samples, while total phenolic content, in vitro antioxidant activity, total and inorganic N, and stable isotope ratio (15N/14N, 13C/12C, and 34S/32S) analyses were performed on freeze-dried fennel bulbs. Stable isotope ratio analyses were also performed on fertilizers (15N/14N), soil samples (15N/14N and 34S/32S) and leaves samples (15N/14N, 13C/12C, and 34S/32S). All the samples (soil, leaves, and bulbs) were analyzed, with four experimental replicates for each treatment for each year of experimentation. Each experimental replicate was analyzed in triplicate.
2.2. Physicochemical Parameters
A representative sample of four bulbs was collected at commercial maturity from each of the six treatments and was used for determining the physicochemical parameters. Fennel plant fresh weight (g) for each treatment was expressed as average value (of four measurements). The total acidity (TA) was determined by automatic titration (Mettler Toledo, Greifensee, Switzerland, DL 25) of the fennel bulb juice with a 0.1 M NaOH alkaline solution and expressed as % of oxalic acid. The pH was measured with a pH meter (Mettler Toledo, Greifensee, Switzerland, DL 25). A digital refractometer (ATAGO, Minato-ku, Tokyo, Japan, RX-5000) was used to determine the total soluble solids (TSS) which were expressed as °Brix of the fennel bulb juice. The firmness was measured at two opposite points per fennel bulb using a texture analyzer (Zwick/Roell (Ulm, Germany), DO-FB0.5 TS model 2002) and expressed in N. Finally, the color analysis was evaluated on four equidistant points of the equatorial part of the fennel bulb and it was expressed as CIE L*, a*, b* values using a colorimeter (Minolta, Chiyoda-ku, Tokyo, Japan, CR-300).
2.3. In Vitro Antioxidant Activity
The in vitro antioxidant activity was measured through two assays based on spectrophotometric and spectrofluorimetric methods. It was evaluated on freeze-dried fennel bulb samples (500 mg) obtained from the six different agronomic plots. Samples were extracted in 100 mL of an hydroalcoholic solution (ethanol:water, 80:20 v/v) at 1% citric acid kept stirring at 120 rpm for 24 h at room temperature. The extraction procedure was repeated again on the residue obtained by filtration. Then, the two extracts were combined and further distilled under vacuum in a rotavapor lab system to remove ethanol. The concentrated extracts were then used for the determination of the antioxidant activity by Folin–Ciocalteu Reagent (FCR) and Oxygen Radical Absorbance Capacity (ORAC) assays. Both assays were used as they are based on two different reaction mechanisms, an electron-transfer (ET) and an hydrogen atom transfer (HAT) reaction, respectively [22]. Therefore, they might be representative of the antioxidant capacity exerted by different classes of compounds present in the raw sample.
2.3.1. Folin–Ciocalteu Reagent (FCR)
The FCR colorimetric method was applied as previously described [20] with some modifications. This colorimetric assay was used to determine the total phenolic content as a measure of the total antioxidant capacity. Diluted samples (1:20, v/v) of the concentrated extracts were mixed with 5 mL of FC commercial reagent (previously diluted with water 1:10 v/v) and 4 mL of a 7.5% sodium carbonate solution. After reacting for 2 h at room temperature in the dark, the absorbance was spectrophotometrically measured at 765 nm, and the concentration of total phenolic was expressed as mg (±) gallic acid equivalents (mg GAE∙g−1 DW).
2.3.2. Oxygen Radical Absorbance Capacity (ORAC)
The ORAC assay was performed on appropriately diluted samples (1:50, v/v) of the concentrated aqueous extracts as previously described [19] on a Wallac 1420 Victor III 96-well plate reader (Perkin Elmer, Shelton, DC, USA). The assay was carried out using fluorescein (116 nM) as the target molecule for the free radical attack from the AAPH (153 mM) peroxyl radical generator, Trolox (1 µM) as the control standard and phosphate buffer (pH 7.0) as the blank. Results were expressed as μmoles of Trolox equivalents (µmol TE∙g−1 DW).
2.4. Total and Inorganic N on Fennel Bulb Samples
To determine total N (mg∙kg−1) after dry matter digestion, the Kjeldahl method was adopted, using the AutoKjeldahl Unit K-370 (Buchi, Flawil, Switzerland) [14,23].
Nitrate and ammonium were determined as follows: 25.0 g of ground and freeze-dried sample were transferred into a 200 mL glass flask, added with 100 mL of distilled water, homogenized by stirring in a water bath, at a temperature of (+80 °C) for 20 min. Once cool, the sample was filtered and 5.0 mL of the first filtrate was discarded, whereas the subsequent filtrate was collected. The filtrate was used for nitrate and ammonium determinations [24]. The concentration was performed by a continuous flow colorimetry auto-analyzer (Flow SyS Systea, Anagni, Italy).
2.5. Stable Isotope Ratio Analysis
Freeze-dried fennel bulb samples were subjected to 13C/12C, 15N/14N, and 34S/32S analyses using an isotope ratio mass spectrometer (Delta plus XP Thermo Finnigan, Bremen, Germany) equipped with an elemental analyzer (EA Flash 1112 Thermo Finnigan, Bremen, Germany). The values of the isotopic ratios were expressed in δ‰ and calibrated against international reference materials including NBS-22 oil (IAEA) for δ13C and glycine (USGS 64) for δ15N measurement. Hair USGS 42 (δ34S = +7.84 ± 0.25‰), USGS 43 (δ34S = +10.46 ± 0.22‰), and barium sulfates IAEA-SO-5 and NBS 127 (IAEA) were used for 34S/32S calibration.
As far as soil and fertilizers samples are concerned, the analysis of δ15N was carried out by weighing 25 mg for soil samples and 1 to 7 mg for fertilizer samples, based on their elemental composition, into tin capsules and measuring them using an EA Flash 1112 (Thermo Finnigan). The isotopic values, expressed in delta per mil, were calculated relative to a laboratory working standard (casein, δ15N = +7.38), which was calibrated against international reference materials: IAEA-NO-3 (IAEA—International Atomic Energy Agency, Vienna, Austria, δ15N = +4.7‰) and L-glutamic acid USGS 40 (δ13C = −26.39‰ and δ15N = −4.52‰) (U.S. Geological Survey, Reston, VA, USA). Sulfur values were measured using a Vario Cube (Elementar Analysensysteme GmbH, Langen-Selbold, Germany), with 20 mg of sample weighed into tin capsules. The values were calculated relative to the international reference material (USGS 42, Tibetan hair, δ34S = 7.84‰) and an internal working standard (flour, δ34S = 0.41‰).
The CNS values of fennel leaves were obtained using a Vario Cube (Elementar Analysensysteme GmbH, Langen-Selbold, Germany) by weighing 2 mg of sample into tin capsules. Isotopic ratios were determined relative to one internal standard (casein δ13C = −21.98‰, δ15N = 7.38‰) for C and N, and using two points for sulfur: one international reference material (USGS 42, Tibetan hair δ34S = 7.84‰) and an internal reference material (flour, δ34S = 0.41‰). The internal reference standards were calibrated against internationally recognized materials, as follows:
- For δ13C: fuel oil NBS-22 (δ13C = −30.03‰), sucrose IAEA-CH-6 (δ13C = −10.45‰), and L-glutamic acid USGS 40 (δ13C = −26.39‰ and δ15N = −4.52‰).
- For δ15N: L-glutamic acid USGS 40 and potassium nitrate IAEA-NO-3 (δ15N = +4.7‰).
- For δ34S: barium sulfate IAEA-SO-5 (δ34S = +0.5‰) and NBS 127 (δ34S = +20.3‰).
The maximum acceptable standard deviations for repeatability were set at 0.1‰ for δ13C, 0.2‰ δ15N, and 0.3‰ δ34S.
The stable isotope composition of a substance is commonly represented using the delta (δ) notation, with values expressed in parts per thousand (‰) or in the SI unit Urey (1 mUr = 1‰), as recommended by the IUPAC. This notation describes the variations in the molar ratio (R) of the heavy to light isotopes of an element, or the ratio of a rare to a common stable isotope relative to a defined reference standard. The calculation follows this equation:
where ref represents the international measurement standard, sample refers to the analyzed material, and iE/jE denotes the isotope ratio between the heavier and lighter isotopes. The delta values are multiplied by 1000 and are typically expressed in “per mil” (‰) units. Alternatively, following the International System of Units (SI), they can be reported as “milliUrey” (mUr), as recommended by Coplen [25].
2.6. Statistical and Chemometric Multivariate Analysis
The statistical differences in the mean values of all the determined parameters were determined through variance analysis (ANOVA) and the treatment means separation was performed by Tukey’s post hoc test (STATSOFT 6.0 software—Statsoft Italia srl, Vigonza, Italy). The analysis of variance was first carried out considering two fixed factors (“years” and “fertilization treatments”). Considering that the factor “years” and the interaction between the two factors were not significant (p > 0.01) for most of the investigated parameters, in this study we present the average values for each treatment in the two years of experimentation. The discriminating ability of the implemented system was tested by a multivariate statistical tool, the linear discriminant analysis (LDA) by using the IBM SPSS Statistics (version 20) software (IBM corporation; Armonk, NY, USA) with the within-class covariance matrix as classification model. The aim of the chemometric multivariate analysis was to determine whether all the determined variables could discriminate among the samples belonging to the six different treatments including three theses whose fertilization was entirely (“Organic”; “Organic + AEP”) or mainly (“Mix-Organic”) organic and three theses whose fertilization was entirely (“Conventional”) or mainly conventional (“Mix-Conventional-a”; “Mix-Conventional-b”). Therefore, a linear discriminant analysis was performed with the aim of investigating differences between groups on the basis of the attributes of the analyzed variables for each case. The performed discriminant analysis created a number of discriminant functions which minimized the possibility of misclassifying cases into their respective groups or categories, indicating which attributes contributed most to group separation. The number of the generated discriminant functions is always one less than the number of the groups; thus, in our study five discriminant functions were produced.
3. Results and Discussion
3.1. Physicochemical and Qualitative Fennel Parameters
The results of the physicochemical and qualitative fennel parameters are reported in Table 1. The values for each parameter are reported as mean of the two years of experimentation. No significant differences were found among treatments for all the parameters; they were not affected by climate conditions which were comparable in the two cropping cycles. Similar results were previously reported for fennel cv. ‘Giulio’ and ‘Helvia’ in a study aimed at comparing conventional and organic vegetable farming systems in a long-term experimental field [26]. Even if two years are not enough to draw general conclusion, it is possible to confirm that slight meteorological differences did not modify physicochemical and qualitative fennel performance. The plant fresh weight values recorded at harvest for the six treatments were consistent with the study by Atta-Aly for sweet fennel var. ‘Dolce’ [27]. The different types of N fertilization did not affect the plant fresh weight at harvest, thus indicating that the supplied mineral fertilizer (“Conventional”) the organic amendments (“Organic” and “Organic + AEP” treatments), and their coformulations (“Mix-organic”, “Mix conventional-a” and “Mix conventional-b” treatments) fulfilled the fennel plants’ N requirements. For the agroecological point of view, this result indicated that it is possible to substitute totally or partially mineral fertilizers with organic ones without reducing fennel performances [28]. Indeed, during the two years of trial, in all the treatments the plants were thick and compact, with a rounded head already in the early stages of growth. As far as pH, TA and TSS are concerned, the recorded values were in agreement with the levels reported for these parameters in previous studies on fennel var ‘Azoricum’ cv. ‘Augusto’ and ‘Tiziano’ [29] and ‘Clio’ [30]. The pH values ranged from 6.42 ± 0.20 of the “Organic” treatment to 6.78 ± 0.06 of the “Mix conventional-a” treatment while TA showed values ranging from 0.28 ± 0.01% of oxalic acid of the “Mix conventional-b” treatment to 0.36 ± 0.02% of oxalic acid of the “Organic” treatment. TSS varied from 5.07 ± 0.23 °Brix of the “Organic + AEP” treatment to 5.68 ± 0.41 °Brix of the “Mix-organic”. The CIE L* a* b* values of the fennel samples for each treatment were in accordance with the values reported in previous studies [28,29] putting in evidence that no differences on the color coordinates of the fennel bulbs were produced as a result of the different type and percentage of fertilizer distributed. Firmness was not affected by the growing practice and its levels showed no statistically significant differences among treatments, showing values ranging from 74.59 ± 2.53 N of the “Conventional” treatment to 81.10 ± 1.53 N of the “Organic” one, showing that, once again, this agronomical practice cannot produce any effect to the genetical and environmental sources of variations. The results have highlighted how the differential fertilization and agronomic practice applied in the six different treatments did not produce any significant difference on the main physicochemical parameters, demonstrating that fennel plants’ N requirements were equally fulfilled.

Table 1.
Physicochemical and qualitative fennel bulb parameters. The data reported are average values ± standard errors (p ≤ 0.01)., relating to four experimental replicates for each treatment for two years of experimentation (N = 8).
3.2. In Vitro Antioxidant Activity
The total polyphenolic content measured through FCR assay and expressed as mg of gallic acid equivalents g-1 DW, showed (Figure 1) statistically significant differences among the six treatments (p ≤ 0.01). Higher values were found in the “Organic” treatment (18.17 ± 0.28 mg GAE∙g−1 DW), intermediate values in the Mix-organic” and “Organic + AEP” treatments (16.70 ± 0.30 mg GAE∙g−1 DW and 15.75 ± 0.68 mg GAE∙g−1 DW, respectively) and lower ones in the three conventional treatments (15.71 ± 0.46, 15.40 ± 0.41, and 14.98 ± 0.68 mg GAE∙g−1 DW, for “Mix conventional-b”, “Mix conventional-a”, and “Conventional”, respectively). The recorded total polyphenolic values were in accordance with the values reported for fennel cv. ‘Chiarino’ by Ninfali et al. in a previous work [31]. The differences found among the six treatments are in accordance with what previously reported by Salama et al. [32] who showed that organic and bio-organic fertilization produced an increase in total polyphenolic content in ‘Dolce’ and ‘Zefa fino’ fennel compared with conventional fertilization. As for ORAC assay, significant differences (p ≤ 0.01) were found among the treatments which partially reflected those found for total polyphenolic content. Indeed, higher values were recorded in the “Organic” (2785.39 ± 21.94 ORAC units) and “Mix-organic” (2743.04 ± 85.17 ORAC units) treatments while the lowest values were found in “Mix conventional-b” (2207.99 ± 82.31 ORAC units) and “Organic + AEP” (2378.03 ± 46.34 ORAC units). The ORAC assay’s sensitivity to different types of antioxidants and the specific conditions of the assay may account for this variation respect to the FCR assay. It is widely recognized that ORAC units are an expression of the antioxidant quality of raw food. Indeed, a daily intake of raw vegetables providing at least 3000–5000 ORAC units has been previously recommended to prevent the incipience of free radicals at a physiological level [33]. Our results show a relevant contribution of fennel in terms of antioxidant capacity, in accordance with another research [31]. The higher accumulation of secondary metabolites exerting relevant antioxidant capacities in organic fertilization treatments, compared to conventional ones, has also been reported for other horticultural products, such as cauliflower [19]. Moreover, a systematic review by Baranski et al. [34], based on an extensive dataset of 343 peer-reviewed publications, confirmed that organic crops have higher concentrations of polyphenols and a higher antioxidant activity. For over a decade, it has been suggested that the accumulation of secondary metabolites in organic products is linked to a C:N ratio unbalance. This imbalance is based on a transient nitrogen deficiency in organic management which induces the biosynthesis of carbon-rich phenylpropanoids [35]. In addition, it has been recently suggested that the organic farming practices promote a metabolism shift that ensures a continuous supply of carbon skeletons for the biosynthetic demands of organic plants [36]. Our results have shown that organic management produced a significant increase in total phenolics and ORAC units supporting the accumulation of carbon-rich phenylpropanoids as a consequence of the organic farming practice.
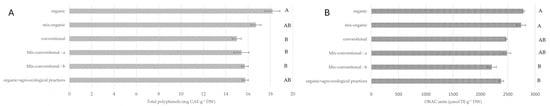
Figure 1.
Total polyphenol content (A) and ORAC units (B) in fennel bulbs (four experimental replicates for each treatment for two years of experimentation; N = 8) ± standard errors. Different letters indicate statistically significant differences (p ≤ 0.01).
3.3. Total and Inorganic Nitrogen on Fennel Bulb Samples
In Table 2 the average concentrations of total N, total inorganic N, NO3− and NH4+ in fennel bulbs of the six different treatments are reported. Both the total N and total inorganic N showed significantly (p ≤ 0.01) higher values in the “Organic + AEP” treatment, showing that the alfalfa consociation contributed to the N availability for the cash crop. As expected, for both these parameters the significantly lowest values (p ≤ 0.01) were detected in the “Organic” treatment. Synthetic N sources of the “Conventional”, “Mix conventional-a” and “Mix conventional-b” treatments produced a significant increase (p ≤ 0.01) in nitrate content compared to the organic treatments. In particular, as mean value, the conventional treatments increased the NO3− values over 440% compared to the organic ones, without increasing the fennel growth and production (as shown in Table 1). Being that fennel is consumed as a fresh vegetable, the nitrate level is a limiting factor for consumer health. It has been recommended that fresh vegetables with nitrate levels exceeding 1000 mg∙kg−1 of fresh weight may constitute a risk for human health [37]. Our results confirmed that nitrate levels in the different treatments were far below this limit; therefore, fennel can be considered safe for consumption as fresh product.
Table 2.
Total N, total inorganic, nitrate, and ammonium N concentrations in fennel bulb. The data reported are average values ± standard errors, relating to 4 experimental replicates for each treatment for two years of experimentation (N = 8).
Furthermore, the “Organic + AEP” treatment was part of a long-term experiment in which agroecological practices were studied [21]. These practices likely contributed to increase the efficiency of nutrient use, by retaining excess N after the harvest of commercial crops and enhancing its availability for subsequent commercial crops [38,39]. This is evident from the higher content of total N in the fennel bulb. On the other hand, the nitrate content was lower in this treatment since the mineralization is modulated. Furthermore, the presence of alfalfa (Medicago sativa L.) in the soil may have determined an increase in organic carbon, thus improving the availability of N in the soil as the soil organic matter mineralized [40]. The presence of alfalfa as cover crop may have also increased the soil microbial biomass pool [41,42] with notable positive effects also on the cash crop.
3.4. Stable Isotope Ratios Analysis
3.4.1. Analyses of 15N/14N on Fertilizers
The fertilizers used in this study exhibited δ(15N) values (Table 3) that align well with the ranges previously reported by Bateman and Kelly [11,17] for various types of fertilizers. Specifically, synthetic nitrogen fertilizers tend to have stable nitrogen isotope values close to zero, typically ranging between −2 and 2‰. In this study, the measured values were 0.0‰ and 0.5‰, consistent with expectations. The nitrogen in these fertilizers originates from atmospheric nitrogen (δ(15N) atm = 0‰), with minimal fractionation occurring during their production. Conversely, as expected, organic fertilizers displayed noticeably higher δ(15N) values. In particular, the animal-derived fertilizer showed the highest values (8.6‰), while the plant-derived fertilizer had comparatively lower values (5.0‰). These differences are attributable to the source materials and their respective nitrogen cycles before application.
Table 3.
δ(15N) values determined in the fertilizer samples.
3.4.2. Analyses of 15N/14N 13C/12C and 34S/32S on Fennel Bulb Samples
The Box and Whisker plots reported in Figure 2 are referred to the results of the stable isotope ratio analysis of 15N/14N [δ(15N)], 13C/12C [δ(13C)] and 34S/32S [δ(34S)] in fennel bulb samples of the six different treatments.
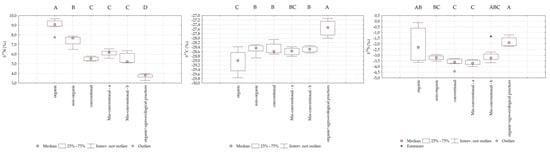
Figure 2.
Boxplot of 15N/14N [δ(15N)], 13C/12C [δ(13C)] and 34S/32S [δ(34S)] in fennel bulb samples (four experimental replicates for each treatment for two years of experimentation; N = 8). Different letters indicate statistically significant differences (p ≤ 0.01).
As regards the δ(15N) values, our results showed a clear effect of the fertilization on its relative values in the different treatments. The δ(15N) highest values (9.03 ± 0.19‰, p ≤ 0.01) was recorded in the “Organic treatment”. The “Mix-organic” treatment showed significantly lower values (7.42 ± 0.18‰, p ≤ 0.01) with respect to the “Organic” plot while the three conventional treatment showed even lower values, in particular “Conventional”, “Mix conventional-a” and “Mix conventional-b” were equal to 5.52 ± 0.07‰, 6.11 ± 0.11‰ and 5.54 ± 0.18‰, respectively. The lowest values were recorded in the “Organic + AEP” treatment (3.73 ± 0.07‰). As previously widely assessed [11,12,18,20,43], the N isotope ratio (15N/14N) can be recognized as a reliable indicator of the applied agricultural regime, due to the favored volatilization of NH4+ having the lighter N isotope during the generation of organic manures which causes significant increases in its value. At the same time, it has been postulated that if green manure based on N-fixing plants (i.e., leguminous crops) is applied in crop rotation in the organic management production, the reliability of the discrimination can result significantly affected [18,20]. The results of our study highlighted that the alfalfa (Medicago sativa L.), used to sustain the cash crop and to increase N utilization efficiency, produced a significant effect on the fractionation of the N isotope which reflected on significantly lower levels of its ratio (15N/14N). Therefore, although the “Organic + AEP” plot was fertilized only with an organic fertilizer of vegetable origin, the δ(15N) analysis produced values compatible with a synthetic mineral fertilization, thus putatively leading to a misclassification of the samples collected in this plot, if δ(15N) alone was considered as indicator of the growing practice. It could also be considered that this latter treatment was carried out in an experimental field in which agroecological practices have been adopted for several years, and these procedures are encouraged by policymakers, which would increase environmental production sustainability [44]. Therefore, if we consider only the δ(15N) value as a tool for N fertilization traceability we will possibly have a misunderstanding reading of results, with wrong legislation rules.
The δ(13C) values of fennel showed significant differences (p ≤ 0.01) among the treatments. The highest values were recorded in the “Organic + AEP” (−27.55 ± 0.11‰) samples, intermediate ones in “Mix-organic” (−28.49 ± 0.07‰), “Conventional” (−28.48 ± 0.08‰), “Mix conventional-a” (−28.59 ± 0.05‰) and “Mix conventional-b” (−28.50 ± 0.04‰) treatments, whereas the lowest values were found in “Organic” (−29.04 ± 0.17‰). Our results are in agreement with previous studies that have shown significant lower δ(13C) values in organic onions and cabbages [45] and in organic peaches [17] due to the higher microbiological activity in the organic soil resulting in respiratory CO2 with lower δ(13C). It has also been previously demonstrated that with high N availability, as in the conventional plots, the photosynthetic rate increases, thus reducing the discrimination of the enzyme RuBisCo against 13CO2. This determines higher δ(13C) values in conventional plots in comparison to the organic ones [17,43]. Indeed, our results confirm this finding as the “Organic” treatment showed the lowest δ(13C) values. In addition, although being an organically grown treatment, the “Organic + AEP” thesis showed the highest δ(13C) values, probably due to the higher N availability for the cash crop due to the consociation of alfalfa as intercropping which further increased the rate of the photosynthesis. In line with this evidence, the “Organic + AEP” treatment showed higher total N, total inorganic N and NH4+ contents, as already shown in Section 3.3.
The different agronomic practices applied produced effects on the δ(34S) values. Significantly lower values (p ≤ 0.01) were found for the “Conventional” (−3.64 ± 0.12‰) and “Mix conventional-a” (−3.67 ± 0.07‰) treatments compared to “Organic” (−2.06 ± 0.50‰) and “Organic + AEP” (−1.81 ± 0.13‰). It is known that sulfur isotope ratio may provide supplementary information for the applied agricultural practice, as it is strictly related to the soil and the sulfate fertilizer employed [46,47]. Our results demonstrate that the soil of the conventional plots, which is different from the soil of the organic ones, produced useful insights into the discrimination of the agricultural regime.
3.4.3. Analyses of 15N/14N and 34S/32S on Soils
Figure 3 presents the boxplots of δ(15N) and δ(34S) values in the soil across the six fertilization treatments analyzed in this study. The impact of conventional, organic, and mixed fertilization strategies was statistically evaluated. Significant differences (p ≤ 0.01) were observed for δ(34S) between “Organic” and “Mix-conventional-b” treatments, despite partial overlap between the two groups. This finding aligns with previous studies [46], which suggest that, although fertilizer type influences δ(34S) values, this parameter is more sensitive to geographical origin than to the agricultural system. The consistency in δ(34S) variability across the six tested treatments supports this hypothesis, as these similarities are likely driven by geological soil characteristics, microbial activity, and proximity to the sea [46]. On the other hand, the ANOVA test identified more pronounced statistically significant differences (p ≤ 0.01) in δ(15N) values, based on agricultural practices. A tendency for higher δ(15N) values was observed in organic and mixed-organic treatments, in soils with a longer history of organic management, which resulted in statistically significant differences compared to the lowest values recorded in the mixed-conventional treatment b. Conversely, conventional, mixed-conventional a, and agroecological treatments displayed δ(15N) values that were not statistically different from each other and from the previous theses, falling within an intermediate range. This δ(15N) pattern reflects the lasting influence of fertilization practices implemented in recent years, leaving a detectable isotopic imprint on the soil. Consequently, soils with a long-term history of organic management tend to exhibit higher δ(15N) values than those under conventional farming. Soils managed through agroecological practices showed intermediate δ(15N) values, which, while distinct, were not entirely separable from those of organically and conventionally managed soils.
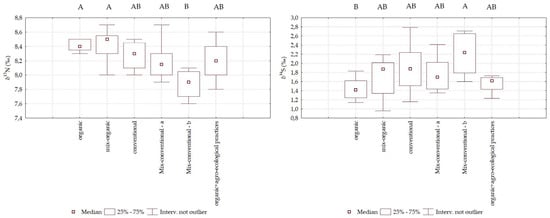
Figure 3.
Boxplot of 15N/14N [δ(15N)] and 34S/32S [δ(34S)] in the soil samples (four experimental replicates for each treatment for two years of experimentation; N = 8). Different letters indicate statistically significant differences (p ≤ 0.01).
3.4.4. Analyses of 15N/14N 13C/12C, and 34S/32S on Leaves
Figure 4 shows the distribution of δ(15N), δ(13C) and δ(34S) values in fennel leaves according to the different fertilization strategies applied. A trend toward lower δ(13C) values was observed in the conventional and conventional-mixed treatments. However, across all samples, δ(13C) remained within a narrow range around −29.0‰, which is characteristic of plants following a C3 photosynthetic pathway. Statistically significant differences were found between the conventional and conventional-mixed treatments compared to the agroecological treatment. No significant differences were observed between the organic and organic-mixed treatments, as their δ(13C) values overlapped. The δ(15N) pattern clearly reflected the fertilization practices with animal manure used during plant growth. Leaves from organically managed soils reached the highest δ(15N) values, while lower values were recorded in the other treatments. Notably, no significant differences in δ(15N) were observed between the agroecological and conventional treatments, mainly in relation to the “Organic + AEP” theses which implied the use of a leguminous crop (Medicago sativa L.) as a cover crop. In contrast, δ(34S) values revealed a distinct pattern associated with the type of fertilizer applied. The agroecological treatment displayed statistically significant differences in δ(34S) compared to the conventional and conventional-mixed treatments, indicating a clear sulfur isotopic distinction based on fertilization strategy. In this specific case, then, the combination of δ(15N) and δ(34S) can led to a complete traceability of the organic and conventional theses. The isotopic values of δ(13C), δ(15N), and δ(34S) reflect the relative isotopic ratios of fennel bulbs and can serve as primary markers for distinguishing between organic and conventional fennel in traceability studies.
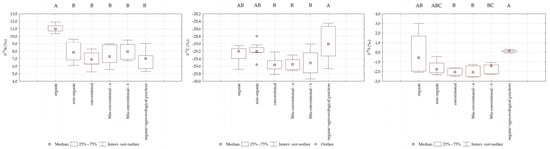
Figure 4.
Boxplot of 15N/14N [δ(15N)], 13C/12C [δ(13C)] and 34S/32S [δ(34S)] in fennel leaves (four experimental replicates for each treatment for two years of experimentation; N = 8). Different letters indicate statistically significant differences (p ≤ 0.01).
3.5. Chemometric Multivariate Analysis
Table 4 reports on the eigenvalues of the canonical discriminant functions and the relative percentages of variance and cumulated variance of the model. The higher canonical correlation coefficients, which are an expression of the multiple correlation between the variables and the discriminant functions, were recorded by the first two discriminant functions, 0.966 and 0.958, respectively. Indeed, the first two functions expressed the 96.2% of the cumulated variance of the model, 87.8% and 8.3% for the first and the second, respectively. Table 5 provides an index of the importance of each variable for the group separation where the sign (+/−) indicates the direction of the relationship. Considering the values of the standardized coefficients of the first canonical discriminant function, TSS (1.953), NO3− (1.646), δ(15N) of fennel (1.596), δ(34S) of fennel (−1.424) and δ(15N) of leaves (1.384) stand out as those that strongly predict allocation of the samples to a group. All the other variables were less successful as predictors. As a matter of fact, our results have highlighted that the variables which mostly contributed to the discrimination of fennel samples among the six different fertilization strategies groups were the differential accumulation of TSS and nitrates and the isotopic N and S signature in fennel bulbs and leaves. The original classification results showed a perfect group prediction as all the cases lied on the diagonal and 100.0% of original grouped cases were correctly classified (Table 6). In order to evaluate the power of the discriminant functions, a cross-validation was performed. It means that a leave-one-out classification was performed and the developed discriminant functions were used to further categorize the case that was left out. The procedure is automatically repeated in turn with each case left out. It was previously indicated that the overall predictive accuracy of the discriminant functions can be considered as acceptable if it is 25% larger than that due to chance [48]. In our study, the cross-validated classification showed that overall 77.1% of cases were correctly classified. We had six different groups with equal sizes so the right classification of a jack-knifed case could be achieved with a 1/6 chance (~17%). Thus, the 77.1% of correct classification for the overall cross-validated grouped cases was a very high percentage achieved, much larger than that due to chance and this confirms the great predictive accuracy of our implemented model. Figure 5 shows the combined-groups plot in which the first two discriminant functions represent the cartesian axes. As it can be noted, with respect to the first canonical discriminant function which alone displays the 87.8% of the variance, treatments are well discriminated and only a limited overlapping of the cases from treatments “Conventional” and “Mix-Conventional-b” can be detected. As far as function 2 (accounting for further 8.3% of the variance) is concerned, the three theses whose fertilization was entirely (“Organic”; “Organic + AEP”) or mainly (“Mix-Organic”) organic are well discriminated with respect to the three theses whose fertilization was entirely (“Conventional”) or mainly conventional (“Mix-Conventional-a”; “Mix-Conventional-b”).
Table 4.
Eigenvalues of the canonical discriminant functions engendered by LDA.
Table 5.
Standardized coefficients of the canonical discriminant functions.
Table 6.
LDA classification results.
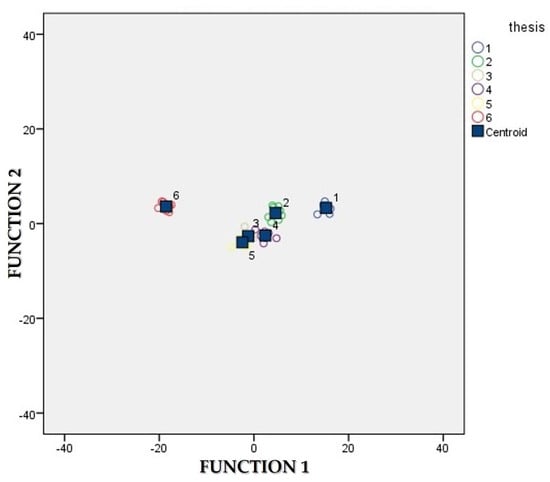
Figure 5.
Graphical representation of the first two canonical discriminant functions. Treatments: (1) “Organic”; (2) “Mix-Organic”; (3) “Conventional”; (4) “Mix-Conventional-a”; (5) “Mix-Conventional-b”; and (6) “Organic + Agroecological practices”.
Our results demonstrated that the joint use of physicochemical, nutritional and isotopic variables combined with their multivariate chemometric treatment can overcome the misclassification of a fennel sample of unknown agronomic origin (organic or conventional), also in the cases where mixed fertilization strategies are applied, thereby confirming what previously reported for cauliflower [19]. In addition, to the best of our knowledge, the presented innovative tool demonstrated for the first time that the discrimination between organic and conventional horticultural products is feasible even when N-fixing plants are applied in organic practice, thereby avoiding misinterpretations univocally based on the isotopic N fingerprint.
4. Conclusions
The different types of N fertilization did not affect the plant fresh weight at harvest, thus indicating that the supplied mineral fertilizer (“Conventional”) the organic amendments (“Organic” and “Organic + AEP” treatments) and their coformulations (“Mix-organic”, “Mix conventional-a” and “Mix conventional-b” treatments) fulfilled the fennel plants’ N requirements. In addition, the conventional treatments increased the NO3− values over 440% compared to the organic ones, without increasing the fennel growth and production with possible negative effects on human health, if fertilizers doses might be increased.
Given the urgent need for innovative tools to trace N fertilization in organic farming and assist stakeholders, retailers, and policymakers in preventing food fraud, we propose a multivariate approach applied to an open-field fennel cultivation case study. Different agronomic treatments were tested and compared, including organic, conventional, and mixed fertilization strategies with varying proportions of mineral fertilizers. Furthermore, agroecological service crops were introduced as a sustainable alternative to traditional organic and conventional methods using a leguminous crop for the fertilization of the soil. The findings of our study indicated that multivariate linear discriminant analysis (LDA), including the investigated parameters as variables, achieved the correct classification of the grouped cases from the six different agronomic treatments, showing a great predictive accuracy of the implemented model. This demonstrated that even if none of the parameters alone may be considered as a reliable biomarker of the agronomic practice, a comprehensive multivariate approach can contribute to reliably trace the organic origin of the crop. Key contributors to the classification model included total soluble solids (TSS), nitrate (NO3−), δ(15N) of fennel, δ(34S) of fennel, and δ(15N) of leaves. To the best of our knowledge, the presented innovative tool demonstrated for the first time that the discrimination between organic and conventional horticultural products is feasible even when N-fixing plants are applied in organic practice, thereby avoiding misinterpretations based univocally on the isotopic N fingerprint. These promising results highlight the potential of this method and suggest that further research should extend its application to other horticultural crops to confirm and expand upon the current findings.
Author Contributions
Conceptualization, L.B., F.M. and S.F.; methodology, G.B., M.A., L.B., F.M., A.F., M.D., N.T., B.T. and S.F.; software, S.F.; validation, L.B., F.M. and S.F.; formal analysis, L.B., F.M. and S.F.; investigation, G.B., M.A., L.B., F.M., A.F., M.D., N.T., B.T. and S.F.; resources, S.F.; data curation, L.B., A.R. and S.F.; writing—original draft preparation, L.B., F.M., M.D. and S.F.; writing—review and editing, G.B., M.A., L.B., A.R., F.M., A.F., M.D., N.T., B.T. and S.F.; visualization, L.B., F.M. and S.F.; supervision, S.F.; project administration, S.F.; funding acquisition, S.F. All authors have read and agreed to the published version of the manuscript.
Funding
This research was funded by Italian Ministry of Agriculture, Food Sovereignty and Forestry, grant number 93173/2017, ‘Application of innovative methods for the traceability of organic farming products’—INNOVABIO project.
Data Availability Statement
Data are available from the authors.
Acknowledgments
The authors acknowledge Rosalba Scazzarriello, Marco Favale and Francesco Rinaldi for their field management and technical assistance.
Conflicts of Interest
The authors declare no conflicts of interest.
References
- European Commission. Available online: https://commission.europa.eu/strategy-and-policy/priorities-2019-2024/europeangreen-deal_en (accessed on 10 February 2025).
- United Nations. Available online: https://www.un.org/sustainabledevelopment/ (accessed on 10 February 2025).
- COMMISSION IMPLEMENTING DECISION Approving the Amendment of the 2023–2027 CAP Strategic Plan of Italy for Union Support Financed by the European Agricultural Guarantee Fund and the European Agricultural Fund for Rural Development CCI: 2023IT06AFSP001. Available online: https://ec.europa.eu/transparency/documents-register/detail?ref=C(2023)6990&lang=en (accessed on 10 February 2025).
- ISMEA Database ‘Bio in Cifre’. Available online: https://www.sinab.it/sites/default/files/BIo%20in%20cifre%202024_0.pdf (accessed on 10 February 2025).
- Blackshaw, R.E.; Moyer, J.R.; Huang, H.C. Beneficial effects of cover crops on soil health and crop management. In Recent Research Developments in Soil Science; Pandalai, S.G., Ed.; Research Signpost: Trivandrum, India, 2005; pp. 15–35. [Google Scholar]
- Wezel, A.; Casagrande, M.; Celette, F.; Vian, J.-F.; Ferrer, A.; Peigné, J. Agroecological practices for sustainable agriculture. A review. Agron. Sustain. Dev. 2014, 34, 1–20. [Google Scholar] [CrossRef]
- Diacono, M.; Persiani, A.; Testani, E.; Montemurro, F. Sustainability of agro-ecological practices in organic horticultural: Yield, energy-use and carbon footprint. Agroecol. Sustain. Food Syst. 2020, 44, 726–746. [Google Scholar] [CrossRef]
- Masiunas, J.B. Production of vegetables using cover crop and living mulches: A review. J. Veg. Crop Prod. 1998, 4, 11–31. [Google Scholar]
- Regulation (EU). 2018/848 of the European Parliament and of the Council of 30 May 2018 on Organic Production and Labelling of Organic Products and Repealing Council Regulation (EC) No 834/2007; EU: Maastricht, The Netherlands, 2018; Available online: https://eur-lex.europa.eu/legal-content/EN/TXT/?uri=CELEX%3A02018R0848-20230221 (accessed on 10 February 2025).
- Regulation (EU). 2017/625 of the European Parliament and of the Council of 15 March 2017 on Official Controls and Other Official Activities Performed to Ensure the Application of Food and Feed Law, Rules on Animal Health and Welfare, Plant Health and Plant Protection Products, Amending Regulations (EC) No 999/2001, (EC) No 396/2005, (EC) No 1069/2009, (EC) No 1107/2009, (EU) No 1151/2012, (EU) No 652/2014, (EU) 2016/429 and (EU) 2016/2031 of the European Parliament and of the Council, Council Regulations (EC) No 1/2005 and (EC) No 1099/2009 and Council Directives 98/58/EC, 1999/74/EC, 2007/43/EC, 2008/119/EC and 2008/120/EC, and Repealing Regulations (EC) No 854/2004 and (EC) No 882/2004 of the European Parliament and of the Council, Council Directives 89/608/EEC, 89/662/EEC, 90/425/EEC, 91/496/EEC, 96/23/EC, 96/93/EC and 97/78/EC and Council Decision 92/438/EEC (Official Controls Regulation); EU: Maastricht, The Netherlands, 2017; Available online: https://eur-lex.europa.eu/legal-content/EN/TXT/?uri=CELEX%3A02017R0625-20220128 (accessed on 10 February 2025).
- Bateman, A.S.; Kelly, S.D.; Jickells, T.D. Nitrogen Isotope Relationships between Crops and Fertilizer: Implications for Using Nitrogen Isotope Analysis as an Indicator of Agricultural Regime. J. Agric. Food Chem. 2005, 53, 5760–5765. [Google Scholar] [CrossRef]
- Rapisarda, P.; Calabretta, M.L.; Romano, G.; Intrigliolo, F. Nitrogen Metabolism Components as a Tool to Discriminate between Organic and Conventional Citrus Fruits. J. Agric. Food Chem. 2005, 53, 2664–2669. [Google Scholar] [CrossRef]
- Wassenaar, L.I.; Kelly, S.D.; Douence, C.; Islam, M.; Monteiro, L.; Abrahim, A.; Rinke, P. Assessment of rapid low-cost isotope (δ15N, δ18O) analyses of nitrate in fruit extracts by Ti(III) reduction to differentiate organic from conventional production. Rapid Commun. Mass. Spectrom. 2022, 36, e9259. [Google Scholar] [CrossRef]
- Inácio, C.T.; Chalk, P.M.; Magalhães, A.M.T. Principles and Limitations of Stable Isotopes in Differentiating Organic and Conventional Foodstuffs: 1. Plant Products. Crit. Rev. Food Sci. Nutr. 2015, 55, 1206–1218. [Google Scholar] [CrossRef]
- Bontempo, L.; van Leeuwen, K.A.; Paolini, M.; Holst Laursen, K.; Micheloni, C.; Prenzler, P.D.; Ryan, D.; Camin, F. Bulk and compound-specific stable isotope ratio analysis for authenticity testing of organically grown tomatoes. Food Chem. 2020, 318, 126426. [Google Scholar] [CrossRef]
- Gatzert, X.; Chun, K.P.; Boner, M.; Hermanowski, R.; Mäder, R.; Breuer, L.; Gattinger, A.; Orlowski, N. Assessment of multiple stable isotopes for tracking regional and organic authenticity of plant products in Hesse, Germany. Isot. Environ. Health Stud. 2021, 57, 281–300. [Google Scholar] [CrossRef]
- Bateman, A.S.; Kelly, S.D.; Woolfe, M. Nitrogen Isotope Composition of Organically and Conventionally Grown Crops. J. Agric. Food Chem. 2007, 55, 2664–2670. [Google Scholar] [CrossRef]
- Laursen, K.H.; Mihailova, A.; Kelly, S.D.; Epov, V.N.; Bérail, S.; Schjoerring, J.K.; Donard, O.F.X.; Larsen, E.H.; Pedentchouk, N.; Marca-Bell, A.D.; et al. Is it really organic?—Multi-isotopic analysis as a tool to discriminate between organic and conventional plants. Food Chem. 2013, 141, 2812–2820. [Google Scholar] [CrossRef] [PubMed]
- Fabroni, S.; Bontempo, L.; Campanelli, G.; Canali, S.; Montemurro, F. Innovative Tools for the Nitrogen Fertilization Traceability of Organic Farming Products. Horticulturae 2023, 9, 723. [Google Scholar] [CrossRef]
- Campanelli, G.; Amenta, M.; Bontempo, L.; Leteo, F.; Montemurro, F.; Platani, C.; Timpanaro, N.; Torrisi, B.; Fabroni, S. Innovative Tools for Nitrogen Fertilization Traceability in Organic Farming Products: A Cauliflower Case Study. Horticulturae 2024, 10, 94. [Google Scholar] [CrossRef]
- Persiani, A.; Diacono, M.; Montemurro, F. The impact of long-term organic horticultural systems on energy outputs and carbon storages in relation to extreme rainfall events. Eur. J. Agron. 2024, 161, 127398. [Google Scholar] [CrossRef]
- Huang, D.; Ou, B.; Prior, R.L. The Chemistry behind Antioxidant Capacity Assays. J. Agric. Food Chem. 2005, 53, 1841–1856. [Google Scholar] [CrossRef]
- Torrisi, B.; Giuffrida, A.; Stagno, F.; Intrigliolo, F.; Canali, S.; Trinchera, A.; Pompili, L.; Nisini, L. Application of organic fertiliseres in a orange orchard in Southern italy: Efects on soil fertility trees nutritional status, yield and quality of fruits. Proc. Int. Soc. Citric. 2004, 2, 649–653. [Google Scholar]
- Nerdy, N.; De Lux Putra, E. Spectrophotometric method for determination of nitrite and nitrate levels in broccoli and cauliflower with different fertilization treatment. Orient. J. Chem. 2018, 34, 2983–2991. [Google Scholar] [CrossRef]
- Coplen, T.B. Guidelines and Recommended Terms for Expression of Stable-Isotope-Ratio and Gas-Ratio Measurement Results. Rapid Commun. Mass. Spectrom. 2011, 25, 2538–2560. [Google Scholar] [CrossRef]
- Campanelli, G.; Canali, S. Crop Production and Environmental Effects in Conventional and Organic Vegetable Farming Systems: The Case of a Long-Term Experiment in Mediterranean Conditions (Central Italy). J. Sustain. Agric. 2012, 36, 599–619. [Google Scholar] [CrossRef]
- Atta-Aly, M.A. Fennel swollen base yield and quality as affected by variety and source of nitrogen fertilizer. Sci. Hortic. 2001, 88, 191–202. [Google Scholar] [CrossRef]
- Persiani, A.; Diacono, M.; Monteforte, A.; Montemurro, F. Agronomic performance, energy analysis and carbon balance comparing different fertilization strategies in horticulture under Mediterranean conditions. Environ. Sci. Pollut. Res. 2019, 26, 19250–19260. [Google Scholar] [CrossRef] [PubMed]
- Valentino, M.; Sequino, G.; De Filippis, F.; Di Monaco, R.; Cavella, S.; Torrieri, E. The effect of edible coating based on sodium caseinate and propyl gallate on the shelf life of minimally processed fennel during storage. Appl. Food Res. 2024, 4, 100462. [Google Scholar] [CrossRef]
- Artés, F.; Escalona, V.H.; Artés-Hdez, F. Modified Atmosphere Packaging of Fennel. J. Food Sci. 2002, 67, 1550–1554. [Google Scholar] [CrossRef]
- Ninfali, P.; Mea, G.; Giorgini, S.; Rocchi, M.; Bacchiocca, M. Antioxidant capacity of vegetables, spices and dressings relevant to nutrition. Br. J. Nutr. 2005, 93, 257–266. [Google Scholar] [CrossRef]
- Salama, Z.A.; El Baz, F.K.; Gaafar, A.A.; Zaki, M.F. Antioxidant activities of phenolics, flavonoids and vitamin C in two cultivars of fennel (Foeniculum vulgare Mill.) in responses to organic and bio-organic fertilizers. J. Saudi Soc. Agric. Sci. 2015, 14, 91–99. [Google Scholar] [CrossRef]
- Prior, R.L.; Joseph, J.A.; Cao, G.; Shukitt-Hale, B. Can Foods Forestall Aging? February Issue; Agricultural Research, USDA Magazine: Washington, DC, USA, 1999; pp. 15–17. [Google Scholar]
- Barański, M.; Srednicka-Tober, D.; Volakakis, N.; Seal, C.; Sanderson, R.; Stewart, G.B.; Benbrook, C.; Biavati, B.; Markellou, E.; Giotis, C.; et al. Higher antioxidant and lower cadmium concentrations and lower incidence of pesticide residues in organically grown crops: A systematic literature review and meta-analyses. Br. J. Nutr. 2014, 112, 794–811. [Google Scholar] [CrossRef]
- Brandt, K.; Leifert, C.; Sanderson, R.; Seal, C.J. Agroecosystem Management and Nutritional Quality of Plant Foods: The Case of Organic Fruits and Vegetables. Crit. Rev. Plant Sci. 2011, 30, 177–197. [Google Scholar] [CrossRef]
- Fabroni, S.; Amenta, M.; Rapisarda, S.; Torrisi, B.; Licciardello, C. Amino acid metabolism and expression of genes involved in nitrogen assimilation in common oranges cv. Valencia Late. Biol. Plant. 2022, 66, 155–162. [Google Scholar] [CrossRef]
- Karłowski, K. Azotany w warzywach--propozycje limitowania w polsce [Nitrates in vegetables--proposals for their limitation in Poland]. Rocz Panstw Zakl Hig. 1990, 41, 1–9. [Google Scholar]
- Tonitto, C.; David, M.B.; Drinkwater, L.E. Replacing bare fallows with cover crops in fertilizer-intensive cropping systems: A meta-analysis of crop yield and N dynamics. Agric. Ecosyst. Environ. 2006, 112, 58–72. [Google Scholar] [CrossRef]
- Brennan, E.B.; Boyd, N.S. Winter Cover Crop Seeding Rate and Variety Affects during Eight Years of Organic Vegetables: II. Cover Crop Nitrogen Accumulation. Agron. J. 2012, 104, 799–806. [Google Scholar] [CrossRef]
- Hu, S.; Grunwald, N.J.; van Bruggen, A.H.C.; Gamble, G.R.; Drinkwater, L.E.; Shennan, C.; Demment, M.W. Short-Term Effects of Cover Crop Incorporation on Soil Carbon Pools and Nitrogen Availability. Soil Sci. Soc. Am. J. 1997, 61, 901–911. [Google Scholar] [CrossRef]
- Brennan, E.B.; Acosta-Martinez, V. Cover cropping frequency is the main driver of soil microbial changes during six years of organic vegetable production. Soil Biol. Biochem. 2017, 109, 188–204. [Google Scholar] [CrossRef]
- Dos Santos Cordeiro, C.F.; Rodrigues, D.R.; Rocha, C.H.; Araujo, F.F.; Echer, F.R. Glomalin and microbial activity affected by cover crops and nitrogen management in sandy soil with cotton cultivation. Appl. Soil Ecol. 2021, 167, 104026. [Google Scholar] [CrossRef]
- Högberg, P.; Johnnisson, C.; Högberg, M.; Högbom, L.; Näsholm, T.; Hällgren, J.E. Measurements of abundances of 15N and 13C as tools in retrospective studies of N balances and water stress in forests: A discussion of preliminary results. Plant Soil 1995, 168, 125–133. [Google Scholar] [CrossRef]
- Diacono, M.; Trinchera, A.; Montemurro, F. An overview on agroecology and organic agriculture strategies for sustainable crop production. Agronomy 2021, 11, 223. [Google Scholar] [CrossRef]
- Georgi, M.; Voerkelius, S.; Rossmann, A.; Graßmann, J.; Schnitzler, W.H. Multielement Isotope Ratios of Vegetables from Integrated and Organic Production. Plant Soil 2005, 275, 93–100. [Google Scholar] [CrossRef]
- Kelly, S.; Heaton, K.; Hoogewerff, J. Tracing the geographical origin of food: The application of multi-element and multi-isotope analysis. Trends Food Sci. Technol. 2005, 16, 555–567. [Google Scholar] [CrossRef]
- Chung, I.M.; Han, J.; Kong, W.; Kim, J.; An, M.; Lee, J.; An, Y.; Jung, M.Y.; Kim, S. Regional discrimination of Agaricus bisporusmushroom using the natural stable isotope ratios. Food Chem. 2018, 264, 92–100. [Google Scholar] [CrossRef]
- Leech, N.; Barrett, K.; Morgan, G.A. SPSS for Intermediate Statistics: Use and Interpretation, 3rd ed.; Routledge: London, UK, 2008. [Google Scholar] [CrossRef]
Disclaimer/Publisher’s Note: The statements, opinions and data contained in all publications are solely those of the individual author(s) and contributor(s) and not of MDPI and/or the editor(s). MDPI and/or the editor(s) disclaim responsibility for any injury to people or property resulting from any ideas, methods, instructions or products referred to in the content. |
© 2025 by the authors. Licensee MDPI, Basel, Switzerland. This article is an open access article distributed under the terms and conditions of the Creative Commons Attribution (CC BY) license (https://creativecommons.org/licenses/by/4.0/).