Article

Dynamic Traits of Intracellular Water and Salt Based on Electrophysiological Measurements During Adaptations of Three Mangrove Species Under Salinity Stresses

1
School of Agricultural Engineering, Jiangsu University, Zhenjiang 212013, China
2
State Key Laboratory of Environmental Geochemistry, Institute of Geochemistry, Chinese Academy of Sciences, Guiyang 550081, China
*
Authors to whom correspondence should be addressed.
Horticulturae 2025, 11(3), 309; https://doi.org/10.3390/horticulturae11030309
Submission received: 7 January 2025 / Revised: 5 February 2025 / Accepted: 8 March 2025 / Published: 11 March 2025
(This article belongs to the Section Biotic and Abiotic Stress)

Abstract

:
Mangroves are landscape plants in coastal parks and are also typical salt-tolerant plants. Water–salt transport plays a key role in their adaptations to salinity. This research aims to study the synchronous dynamics of intracellular water–salt and plant adaptation mechanisms. Therefore, no salt and three salinity gradients, including 0.1, 0.2, and 0.4 mol/L NaCl, were applied to three mangrove plants. An electrophysiological sensor was used to non-invasively detect plant electrical signals. The results showed that mangroves’ water and salt dynamic characteristics differed under salt treatment. Rhizophora stylosa reduced the cytoplasmic salt by increasing water absorption, enhancing salt exclusion, and decreasing salt inflow. Kandelia candel managed salt by transferring it into a vacuole, diluting the intracellular salt concentrations through increased cell fluid while maintaining the salt exclusion capacity as salinity increased. Aegiceras corniculatum decreased the cellular salt influx and adapted to 0.4 mol/L NaCl by activating salt secretion. In addition, water-use, salt transport, cellular endogenous convertible energy, and photosynthetic gas exchange parameters could be used as representative factors for salt adaptation of these mangrove species. The results deepen our understanding of plant salt tolerance mechanisms and provide a new approach for timely determining plant adaptability.

1. Introduction

Mangroves are at the interface between the land and the sea [1]. In addition to providing biological habitat, protecting biodiversity, purifying the environment, and other ecological functions, they also have high ornamental value [2]. They are often used as ornamental trees in coastal parks to beautify the landscape. However, they always suffer from salinity stresses, high osmotic pressure, and low osmotic potential in the inter-tidal zone, particularly in environments with salinity exceeding 30‰; plants often experience salinity stress, which quickly leads to metabolic disorders, poor growth, and even death [3,4]. The low survival rate of mangrove afforestation greatly restricts the sustainable development of mangrove ecosystems. Research on the mechanism of salt tolerance in mangrove plants is of great significance for timely determining plant adaptabilities, improving the efficiency of mangrove planting in coastal wetlands, and further protecting the mangrove ecosystems.
Mangrove plants have a variety of ion homeostatic strategies for adapting to salt-stressed environments, including salt exclusion by roots, salt secretion by leaves, and ion compartmentalization [5,6]. Previous research has reported that Rhizophora stylosa and Kandelia candel utilized the ultrafiltration mechanism occurring in the cell membranes of the root cortex cells to separate freshwater from the saline substrate. Through selective absorption of ions and water via membrane transport proteins, the plants maintain xylem sap that is essentially NaCl-free [7]. Aegiceras corniculatum uses special leaf salt glands to secrete salt through transpiration [8]. Generally, these adaptive mechanisms of mangrove plants are not singly activated; the salt concentration in a certain plant is always regulated through the combined effects of salt expulsion, salt exclusion, and salt accumulation, which depends on the salinity and other environmental conditions [9]. As a result, mangrove plants can sometimes exhibit a very complex and unintelligible mechanism of salt tolerance. Therefore, it is necessary to explore the reason and process of the performance of the above-mentioned combined effects in mangrove plants, which helps to understand the variable adaptability of the plant.
As is known to all, plants’ photosynthesis, growth, and other metabolic activities are directly correlated with intracellular water and other substances. The mangrove plants’ water and salt use strategies are considered the key to their unique ecological adaptation [10]. Liang et al. detected the concentration, direction, and velocity of K+, H+, and Na+ ion flow between the cytoplasm and intercellular space, which has shown that the outflow of Na+ and K+ from mesophyll cells increased significantly to balance the passive absorption of excess Na+ by plants at high NaCl concentrations [11]. The molecular mechanisms have been continuously revealed [12,13]. For example, R. stylosa and A. corniculatum upregulate the genes of “salt stress” and “ion transport” to cope with salt stress [14,15,16]. K. candel inhibits membrane proteins such as tonoplast intrinsic protein (KcTIP1) to reduce water loss [17]. In addition, condensed tannins synthesized in chloroplasts are transported to the vacuole via the cytoplasm, which helps to sequester and compartmentalize excessive Na+ into the vacuole [18]. Studies by Ali Solangi et al. have reported that the salt storage capacity of A. corniculatum and K. candel plants depended on the cell vacuole volume [19]. Mimura et al. studied the suspension-cultured cells of Bruguiera gymnorrhiza using a microscope and observed a rapid increase in vacuolar volume under salt stress; the salt storage can be imagined [20]. In short, what is clear is that plant cells have strategies to cope with salt stress. In 2022, Ali Solangi et al. established the intracellular water utilization parameters and salt transfer parameters based on the inherent electrophysiological characteristics and defined salt outflow capacity (C1), salt dilution capacity (C2), and salt ultrafiltration capacity (C3). These parameters reflected the water and salt status of A. corniculatum and Kandelia obovate plants at each treatment level. They could determine the salt-resistant capacities of plants subjected to rewatering and SNP treatments, which could be verified by the photosynthetic performance of those two plant species. The results showed that the electrophysiological parameters had the potential to rapidly and accurately address the salt-resistant capacity of those mangrove plants [21]. However, in many cases, the transmembrane of salt ions in plants is always coupled with water transport. The investigation focuses on the ion transport through the cell membrane or the water movement, which makes it difficult to comprehensively and timely explain the complex changes in intracellular salt concentration. Therefore, the synchronous characteristics of water and salt transport within cells should be considered when studying the ion homeostatic strategies of mangrove plants. In particular, how could those mangrove plants exhibit the salt outflow, dilution, and ultrafiltration effects? What was the role of the dynamics of water and salt transport in regulating the salt outflow, dilution, and ultrafiltration effects in plant leaf cells?
Plant electrophysiological technology has great advantages in timely sensing changes in information within plant cells and can rapidly determine plant physiological responses under stress environments. Its development has brought new opportunities for studying the dynamic mechanisms of intracellular water and salt in mangrove plants. Plant electrical signals are considered to be related to plant physiological processes and transmission of information [22]. They were first founded in 1967 [23]. The electrical properties of plant cells originate from the cell membrane, which forms a double electric layer. Each plant cell can be approximately regarded as a concentric sphere capacitor with inductor and resistor functions [24]. Cell membranes are selectively permeable to various ions, ionic groups, and electric dipoles. The electrolyte solution on both sides of the membrane is regarded as two pole plates of the capacitor; the cell membrane is the medium between the pole plates, and various types of organelles in the cell are equivalent to the resistor. Many aligned cells make up the leaf capacitor by plasmodesmata. The electrophysiological properties of plant cells are modified by changes in cell water content and cell membrane permeability, which respond rapidly to stressful environments [25,26]. We intend to use an electrophysiological sensor composed of an LCR instrument and a self-made parallel plate capacitor to capture the electrical information of plants non-invasively. By measuring the physiological impedance (Z), physiological resistance (R), physiological capacitance (C), physiological capacitive reactance (XC), and physiological inductive reactance (XL) of plant leaves under different clamping forces, we establish the dynamics models of intracellular water–salt transport and cellular endogenous convertible energy based on the Gibbs Free Energy equation and Nernst equation. The dynamics model parameters representing the transport and use processes of water–salt and cellular endogenous convertible energy are then calculated. This technique has the advantage of revealing detailed information about the transport, hold, and utilization of intracellular substances. It will help to study the synchronous variations in intracellular water and salts, characterize the real-time information of plant cellular endogenous convertible energy, and explain the performance of water and salt status in plants at a moment or over a period of time.
Therefore, those horticultural ornamental mangroves including R. stylosa (Rhizophoraceae), K. candel (Rhizophoraceae), and A. corniculatum (Primulaceae), which are typical salt-tolerant plants, were used as experimental materials in this study; the three mangrove plants differed in leaf structure, growth environment, and salt management strategies (Table 1) [8,27]. Since a variety of adaptation mechanisms, including root salt exclusion and leaf salt secretion of mangrove plants, have been determined, we further hypothesize that the combined effects of salt exclusion and accumulation in a single plant vary with the degree of salt stress in which process the synchronous variations in the intracellular water and salt play a key role. In this study, we intend to use the electrophysiological sensor to detect the electrical signals of plants, compare the water and salt dynamic characteristics of mangrove plants under different salinities, and explain the whole process adaptation mechanisms of mangrove plants with the increased salt stress level. In addition, there are also interspecific differences in salt tolerance and salt management strategies of plants. This study also aims to analyze their salt adaptation mechanisms and differences from the perspective of synchronous characteristics of intracellular water and salt. The research results can provide a new method and foundation for further research on the timely and accurate monitoring of mangrove plants’ adaptability under tidal fluctuations and guide the management and protection of mangrove ecosystem functions.

2. Materials and Methods

2.1. Plant Materials and Treatments

The experiments were carried out in the greenhouse of Jiangsu University (32°11′ N, 119°25′ E). The one-year-old R. stylosa, K. candel, and A. corniculatum plants with uniform growth were used as experimental materials, and the average heights were 40 cm, 25 cm, and 50 cm, respectively. The plant materials were all provided by Quanzhou Tongqing Mangroves Technology Co. Ltd., Fujian, China. The culture environment was as follows: air relative humidity (75 ± 5) %, daytime/night cycle temperature (30 °C/20 °C), and light intensity (280 ± 10) μmol·m−2·s−1. The above-mentioned plant species differed in salt balance mechanism, distribution, and leaf structure [8,27] (Table 1). Initially, mangrove plants were pretreated for one week using 1/2-Hoagland solution, and then the experiments were performed.
The inter-tidal zone under regular semi-diurnal tide conditions was categorized into three classes based on the salinity: high, mid, and low tide. Mangrove plants were treated with no salt, 0.1 mol/L, 0.2 mol/L, and 0.4 mol/L NaCl solutions to simulate those mentioned above three tidal zones, while the water-logging time was set to be four h per half day. The salinity gradually increased daily until the set salinity gradient was reached. A self-made simulated tidal device was used to control the waterlogging time during the experiments. The treatments lasted for 60 days. During the treatment period, tap water was added every two days to maintain salinity, and the salt water was reconfigured monthly to prevent algae contamination (Figure 1).

2.2. Plant Height Increment and Leaf Water Potential (ΨLw)

The height from top to ground of the plant was determined before and after the stress treatments using a centimeter scale, and the post-treatment minus pre-treatment value was the plant height increment, which meant the plant height increment during the 60 days treatment period. Leaf water potential (ΨLw) was measured using a dew point water potential meter (C-52-SF Psypro, Wescor, Logan, UT, USA). The measurements at each treatment level were performed in triplicate.

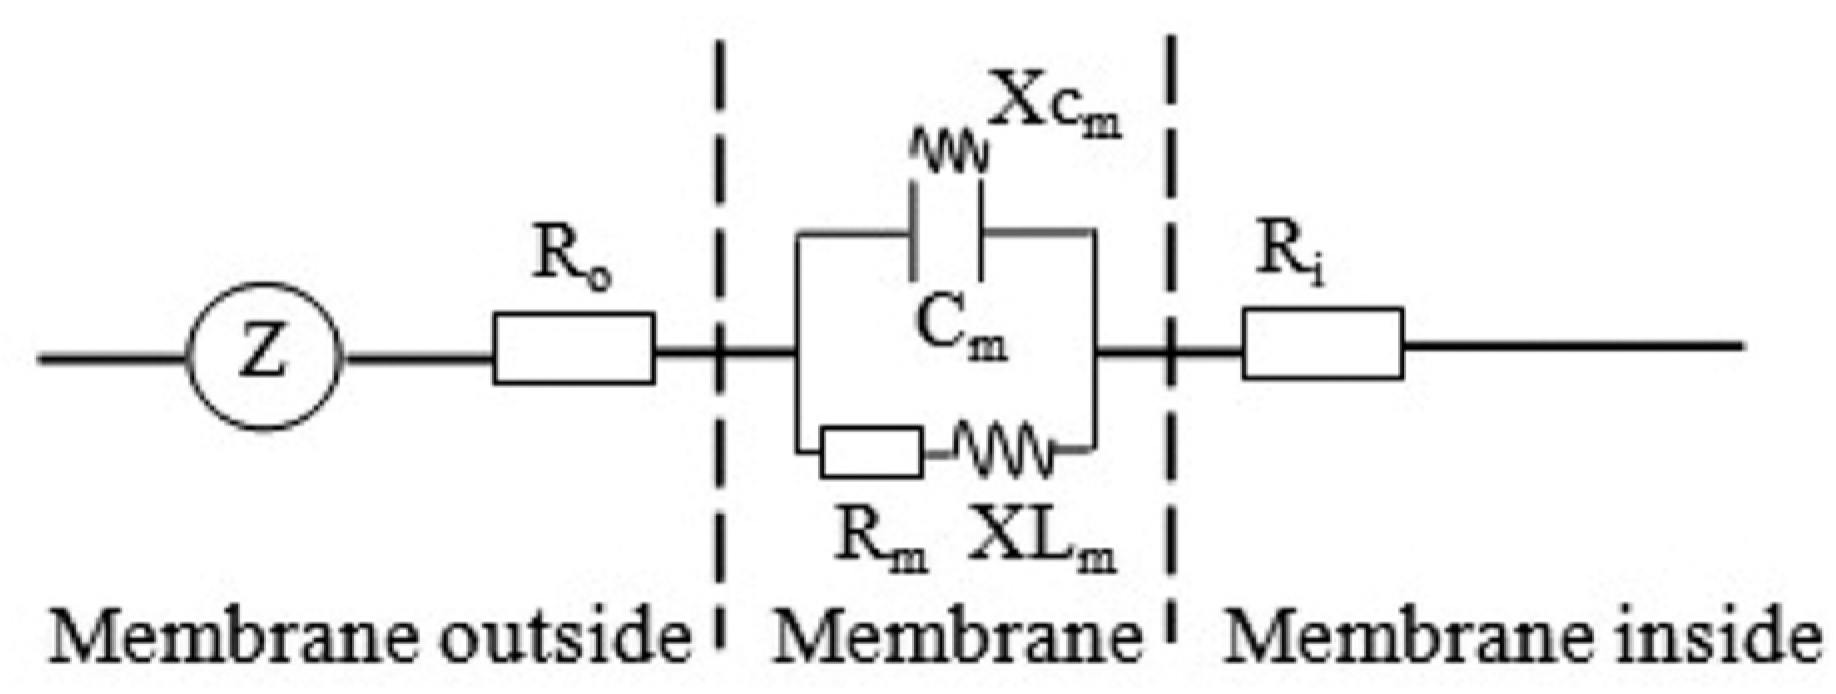
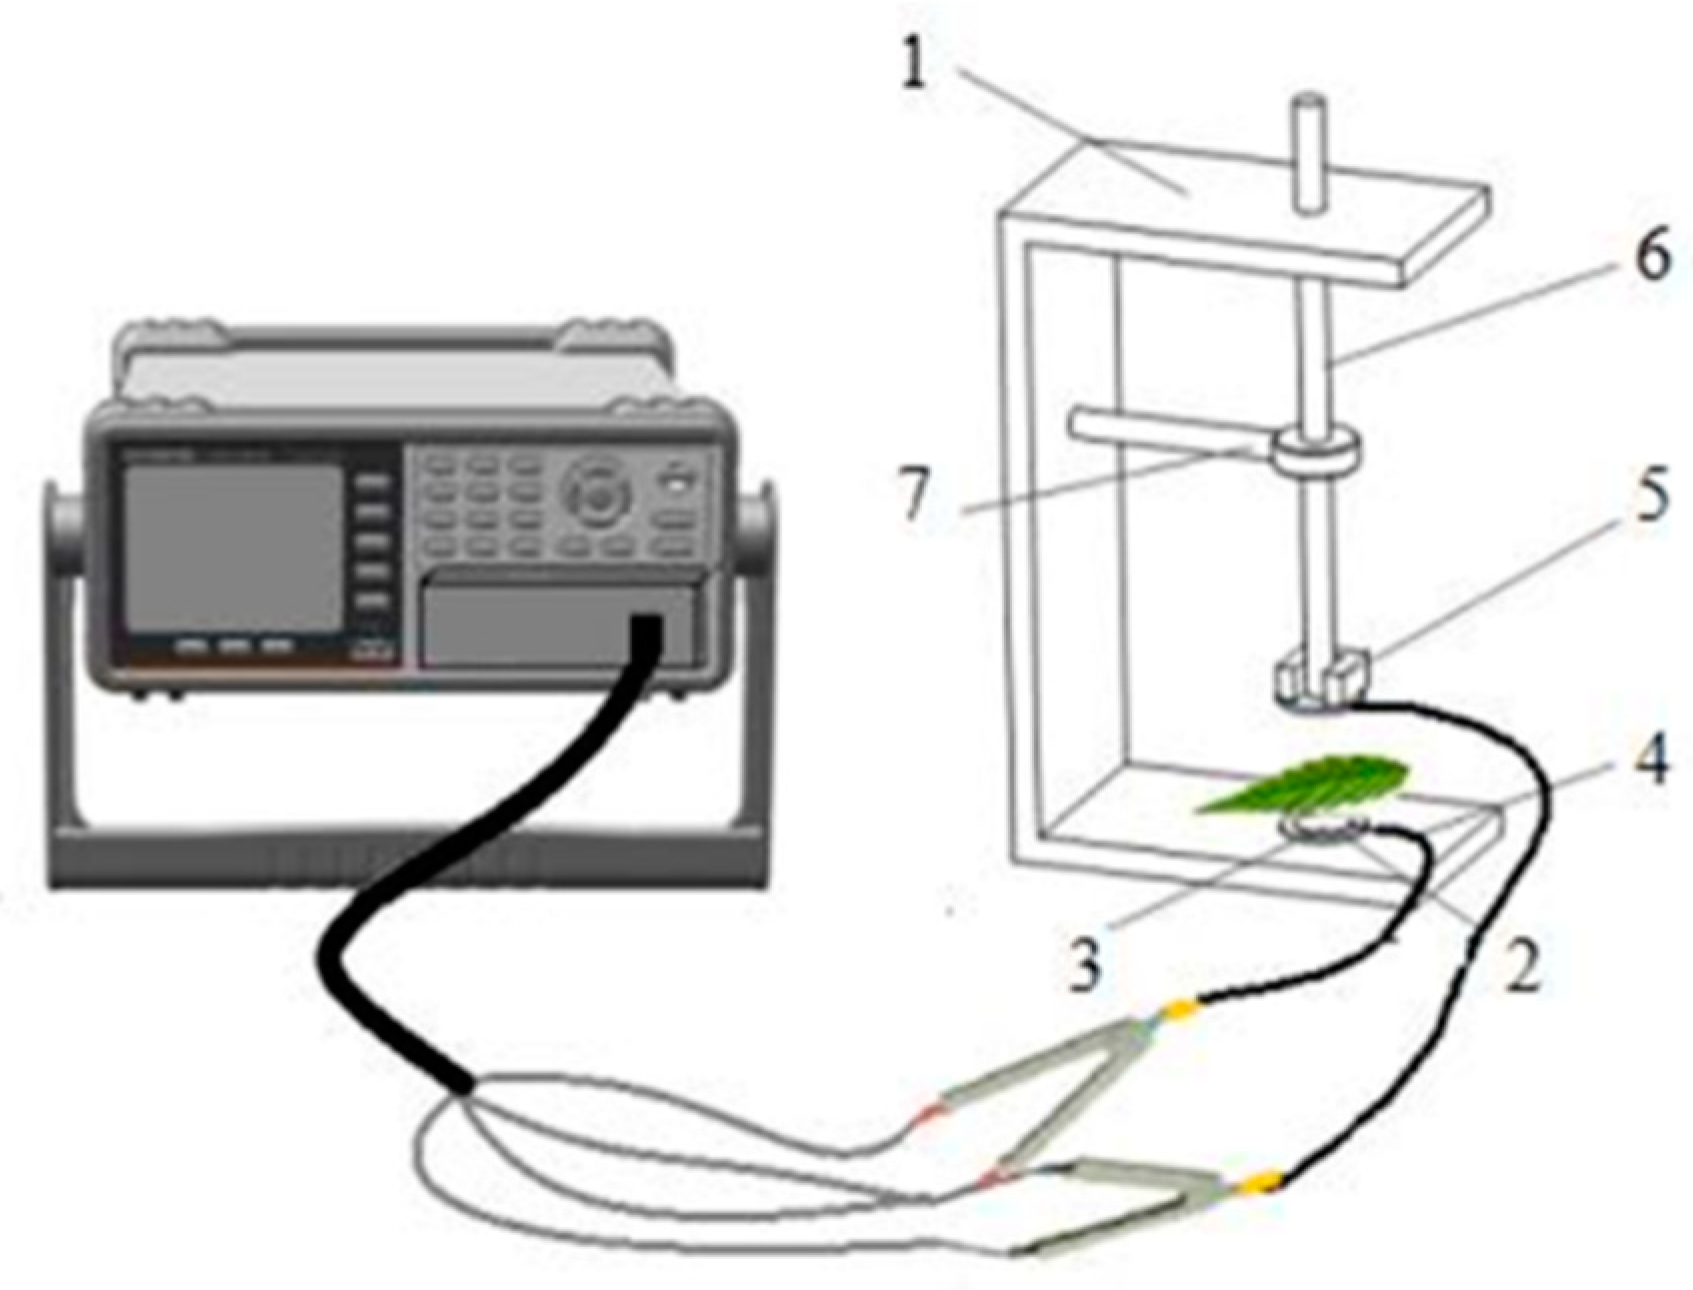
2.3. Electrophysiological Parameters Measurement and Dynamics Model Parameters Calculation

Each cell of a plant can be approximately regarded as a concentric spherical capacitor. The diagram of a simplified equivalent circuit of the cell is shown in Figure 2 [25]. Fresh and uniform leaves were selected for online measurement. The leaves were clamped between the parallel electrode plates (Figure 3) connected with the LCR instrument (Model 3532-50, Hioki, Nagano, Japan). The voltage and frequency were 1.5 V and 3 kHz, respectively [28,29]. The Z (MΩ), R (MΩ), and C (pF) of plant leaves were measured by changing the clamping force with weights (100 g) under different pressures of 1.1 N, 2.1 N, 3.1 N, 4.1 N, 5.1 N, 6.1 N, 7.1 N, and 8.1 N. Ten data sets were taken for calculation and processing under each clamping force. The measurements were performed in quintuplicate at each treatment level. XC (MΩ) and XL (MΩ) were calculated according to Equations (1) and (2) (Supplementary Materials) [25].
Xc = 1 2 π fc
1 X L = 1 Z 1 R 1 Xc
where XC is capacitive reactance, π is 3.1416, f is frequency, C is capacitance, XL is inductive reactance, Z is impedance, and R is resistance.
The clamping force and electrophysiological parameters (Z, R, C, XC, and XL) were fitted and analyzed using SigmaPlot 12.5 to determine the intrinsic electrophysiological parameter of the plant leaves (F = 0) with the fitted equations. Inherent electrophysiological parameters include inherent impedance (IZ), inherent resistance (IR), inherent capacitive reactance (IXC), and inherent inductive reactance (IXL). Then, the inherent capacitance (ICP) is calculated according to the relationship between XC and C (Equation (1)). The dynamics model parameters can be calculated according to the established dynamics models of intracellular water and salt (Supplementary Materials). The intracellular water-use indices of plant leaves were calculated, including leaf intracellular water-holding capacity (LIWHC), leaf intracellular water-use efficiency (LIWUE), and leaf intracellular water-holding time (LIWHT) [25,30]. The calculation formulas were as follows:
LIWHC = ( IC P ) 3
LIWUE = d LIWHC
LIWHT = IC P × IZ
where d is the specific effective thickness of the leaf.
The cell membrane’s state directly reflects the plant’s physiological state, and the cell membrane plays a key role in the absorption and transport of salt ions. The plant’s salt active/passive transport capacity can be reflected through electrophysiological parameters, which are calculated according to the method described by Zhang et al. [31]. The salt transfer parameters of plant leaves were calculated, including leaf intracellular salt active transport capacity (LISAC), leaf intracellular salt passive transport capacity (LISPC), leaf intracellular salt flux per unit area (LIUSF), leaf intracellular salt transfer rate (LISTR), and leaf intracellular salt transport capacity (LISTC) [20]. The calculation formulas were as follows:
LISAC = IX L 1 IR 1
LISPC = IX C 1 IR 1
LIUSF = IR IX C + IR IX L
LISTR = IC P 3 IC P × IZ
LISTC = LIUSF × LISTR
Cellular endogenous convertible energy represents an additional form of energy input, distinct from the energy captured through photosynthesis. It is endogenous energy stored in the electrical component ICR. Plant leaf cellular endogenous convertible energy based on Z (ΔGZ) and plant leaf cellular endogenous convertible energy based on R (ΔGR) were calculated according to Equations (12) and (13), and the deduced formulas were shown in Supplementary Materials [32,33]:
Δ G Z = lnk 1 lny 1 b 1 × d
Δ G R = lnk 2 lny 2 b 2 × d
Similar to the derived formulas for ΔGZ and ΔGR, plant leaf cellular endogenous convertible energy based on XC (ΔGXC) is obtained. The higher the value, the more energy stored by leaf cells to metabolize capacitive substances (especially water).
Δ G XC = lnk 3 lny 3 b 3 × d
Similar to the formula derived from ΔGXC, the cellular endogenous convertible energy based on (XL) of plant leaf cells (ΔGXL) is obtained. The higher the value, the more energy stored by leaf cells to metabolize sensitive substances (especially active transport).
Δ G XL = lnk 4 lny 4 b 4 × d

2.4. Photosynthetic Gas Exchange Parameters

After 60 days of treatment, the plant’s fourth and fifth fully expanded leaves were used to measure photosynthetic gas exchange parameters. The net photosynthetic rate (PN, μmol·m−2·s−1), stomatal conductance (gs, mol·m−2·s−1), leaf intercellular CO2 concentration (Ci, μmol·mol−1), and transpiration rate (E, mmol·m−2·s−1) were recorded using a portable Li-6400XT Photosynthesis Measurement System (LI-COR, Lincoln, NE, USA). The measurements were performed in quintuplicate at each treatment level. In addition, intrinsic water-use efficiency (IWUE, μmol·mol−1) and water-use efficiency (WUE, μmol·mmol−1) were calculated according to the following formulas [20]:
IWUE = P N gs
WUE = P N E

2.5. Statistical Analysis

Microsoft Office Excel (version 2019, Microsoft, Redmond, WA, USA) was used to preliminarily sort out the experimental data. SigmaPlot (version 14.0, Systat Software Inc., San Jose, CA, USA) software was used to fit. One-way ANOVA analyzed statistical significance (p ≤ 0.05) with Duncan’s multiple comparisons using data statistical software SPSS (version 13.0, SPSS, IBM, Armonk, New York, NY, USA). The Principal Component Analysis APP (version 1.5) in Origin 2022 software (version 2022, Origin Lab, Northampton, MA, USA) is used for the PCA. Excel 2019 and Origin 2022 software were used for charting.

3. Results

3.1. Effects of Salinity on Growth Indices and Leaf Water Potential (ΨLw)

The plant height increment of R. stylosa at no salt and 0.1 mol/L NaCl did not differ significantly but were considerably lower than that at 0.4 mol/L (Table 2). The plant height increment of K. candel was remarkably different, with the highest observed value at 0.2 mol/L level. However, there was an insignificant difference in the plant height increment of A. corniculatum at each salinity level. The salinity had no remarkable influence on ΨLw of each kind of mangrove. However, the ΨLw value of A. corniculatum was the highest under the same salinity among the three plant species, followed by R. stylosa.

3.2. Effects of Salinity on Electrophysiological Parameters

The fitted curves equation of leaf clamping force (F) versus C, R, Z, XC, and XL for the three plant species at each salinity level were clearly significant (p < 0.0001). Based on these estimated parameters, three mangrove plants’ leaf intracellular water-use parameters under different salinity treatments were calculated (Table 3). The LIWHC values of R. stylosa at no salt, 0.1, and 0.2 mol/L were considerably lower than those at 0.4 mol/L. The LIWHC values of K. candel at 0.2 and 0.4 mol/L were significantly higher than those at no salt and 0.1 mol/L. There was no significant difference in LIWHC values of A. corniculatum at all levels. The LIWUE of R. stylosa at no salt was significantly higher than that at 0.4 mol/L, and the LIWUE of A. corniculatum was considerably higher at 0.4 mol/L salinity compared to others. The LIWHT values of R. stylosa at both 0.2 and 0.4 mol/L showed unclear differences. However, they were significantly lower than the values observed at no salt and 0.1 mol/L. The LIWHT of three mangroves at no salt was higher than those of other treatments. The LIWHC of K. candel was significantly higher than those of R. stylosa and A. corniculatum at each salinity treatment level. In contrast, LIWUE was higher in A. corniculatum than in the other two plants. The LIWHT value of K. candel was the smallest among the three mangrove plants.
The LISAC and LISPC values of R. stylosa decreased with the salinity increase. The LISAC and LISPC of K. candel and A. corniculatum were the highest at no salt. Overall, with the increase in salinity, the value of LISAC/LIUSF increased, while the value of LISPC/LIUSF decreased. The LISAC of the three mangrove plants at no salt was 1.25, 1.30, and 1.24 times higher than that at 0.4 mol/L, and the LISPC at no salt treatment was 2.00, 1.61, and 2.65 times higher than that at 0.4 mol/L treatment. The LIUSF value of R. stylosa at 0.4 mol/L was considerably lower than that at no salt. The effects of different salinity treatments on the LIUSF of K. candel were insignificant. At the same time, the value of A. corniculatum at no salt was significantly higher than the other treatment levels. The LISTR value of R. stylosa at 0.4 mol/L was significantly higher than that at no salt. The LISTR of K. candel subjected to 0.2 and 0.4 mol/L treatment levels was significantly higher than other treatment levels. However, salinity did not significantly affect the LISTR of A. corniculate. The values were considerably lower compared to those at 0.4 mol/L treatments. The LISTC values of K. candel at 0.2 and 0.4 mol/L were considerably higher than those at no salt and 0.1 mol/L (Table 4).
Except for 0.1 mol/L, the LISAC and LISPC values at other treatments of A. corniculatum were higher than those of R. stylosa. Among the three mangrove plants, K. candel had the lowest LISAC and LISPC values. At each treatment, the LIUSF of K. candel was lower than that of R. stylosa and A. corniculatum, but its LISTR and LISTC were higher than those of R. stylosa and A. corniculatum at all treatments. Among the three plants tested, the value of LISAC/LIUSF was lower (17.11–41.97%), and LISPC/LIUSF was higher (58.03–82.89%). Overall, LISPC was dominant in LIUSF.
The ΔGR of R. stylosa at no salt treatment had the maximum value. And the ΔGR of K. candel at 0.4 mol/L treatment was significantly lower than those at other treatments. However, there was no significant difference in ΔGR of A. corniculatum among various treatments. The ΔGZ of the three mangrove plants had a minimum value at 0.4 mol/L treatment. At this treatment, the values of R. stylosa and A. corniculatum were not significantly different from other treatments, whereas the values of K. candel were significantly lower. There was no significant difference in ΔGXC of R. stylosa values among the different treatments. The pattern observed for A. corniculatum is similar to that of the R. stylosa. The ΔGXC of K. candel at 0.2 mol/L treatment was significantly higher than those at no salt and 0.4 mol/L treatments. Furthermore, the ΔGXL value of R. stylosa and A. corniculatum decreased with the increase in NaCl concentration, though this change was not statistically significant. In contrast, the ΔGXL of K. candel at 0.2 mol/L treatment was significantly higher than those observed in neither salt nor 0.4 mol/L treatments. There were no significant differences in cellular endogenous convertible energy at each treatment between R. stylosa and A. corniculatum. In contrast, the cellular endogenous convertible energy values of K. candel were significantly higher than those of both R. stylosa and A. corniculatum (Table 5).
R. stylosa exhibited high LIWHT and LISPC/LIUSF, medium LISAC, LISPC, LIUSF, LISTR, and LISTC, but low LIWHC, LIWUE, LISAC/LIUSF, ΔGR, ΔGZ, ΔGXC, and ΔGXL. K. candel showed a high LIWHC, LISTR, LISTC, LISAC/LIUSF, ΔGR, ΔGZ, ΔGXC, and ΔGXL, but a low LIWUE, LIWHT, LISAC, LISPC, LIUSF and LISPC/LIUSF. A. corniculatum showed a relatively high LIWUE, LIWHT, LISAC, LISPC, LIUSF and LISPC/LIUSF, and low LIWHC, LISTR, LISTC, LISAC/LIUSF, ΔGR, ΔGZ, ΔGXC, and ΔGXL. (Table 6).

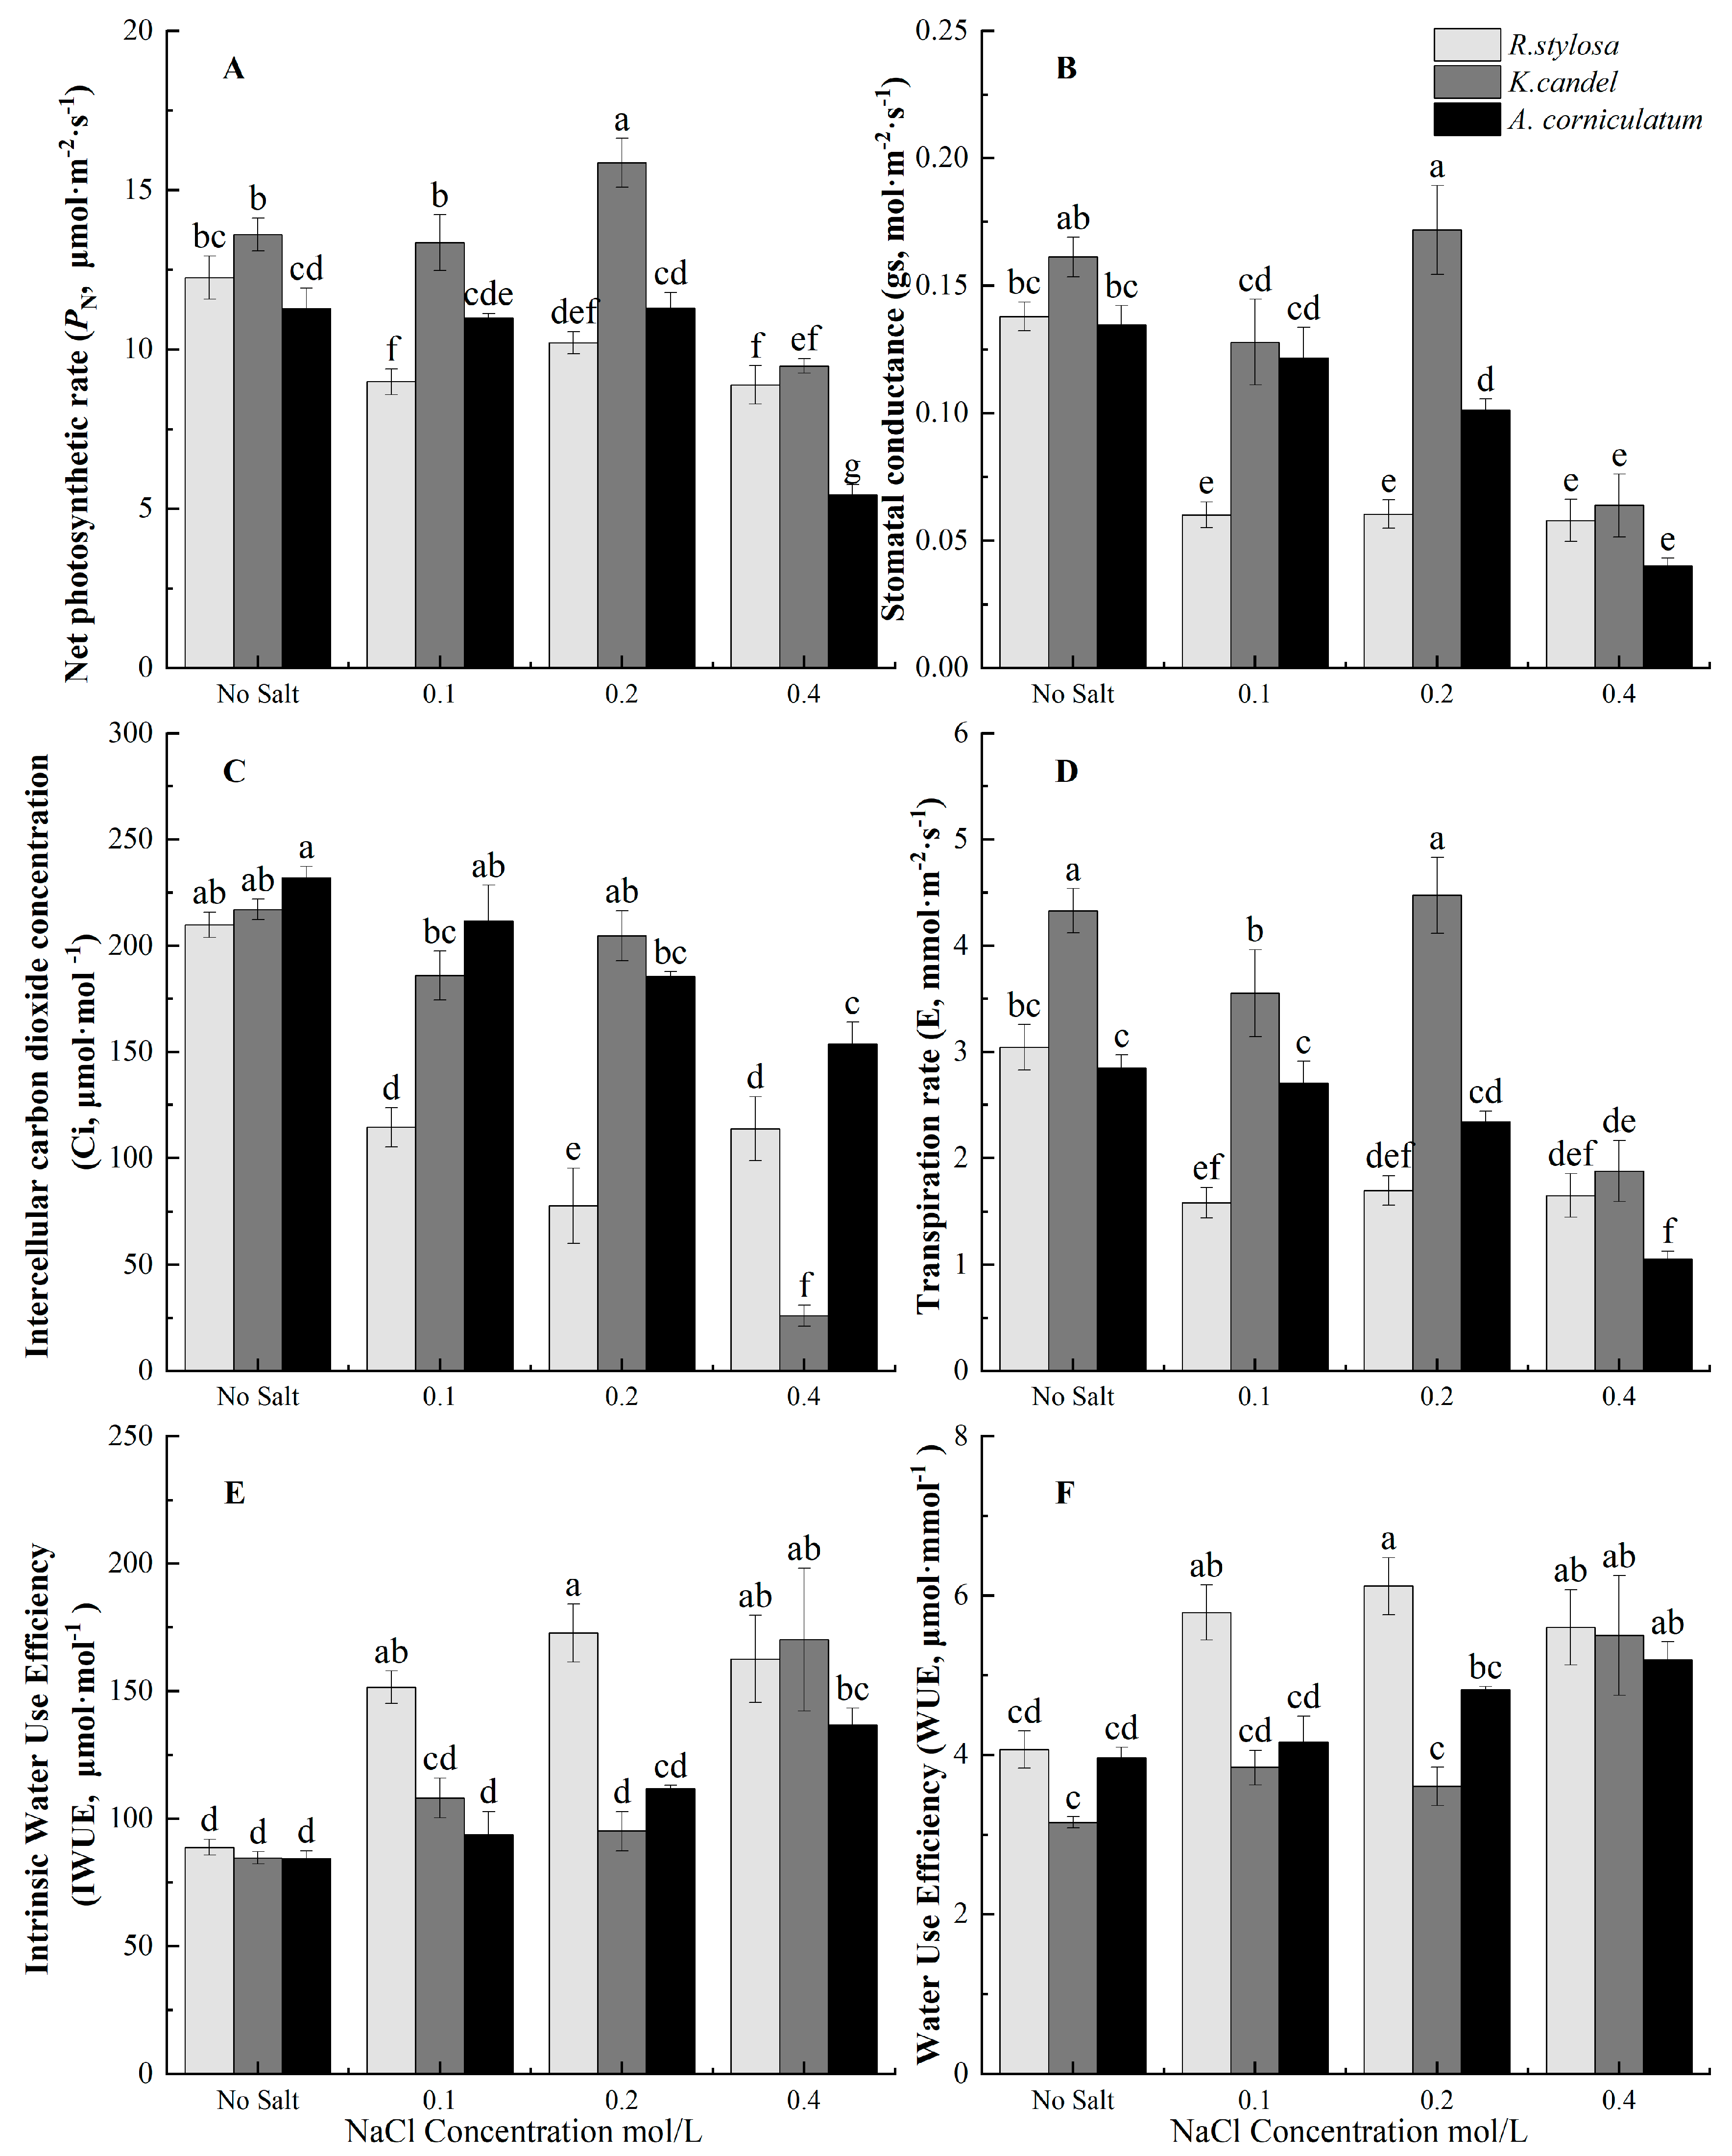
3.3. Effects of Salinity on Photosynthetic Gas Exchange Parameters

R. stylosa plants growing at no salt treatment level exhibited a significantly higher PN than those subjected to NaCl treatments. The PN of K. candel varied significantly among different salt treatment levels and exhibited the highest value at 0.2 mol/L. While the PN of A. corniculatum displayed an insignificant variation among no salt, 0.1, and 0.2 mol/L treatments, it significantly decreased at the 0.4 mol/L treatment level. The PN of K. candel was higher than that of the other two mangrove plants among all salinity treatment levels (Figure 4A).
The gs value of R. stylosa at no salt was significantly higher than that at other salinity treatment levels. The gs of K. candel did not exhibit a significant difference between no salt and 0.2 mol/L treatment levels but were considerably higher than those at 0.1 and 0.4 mol/L. The gs of A. corniculatum did not significantly differ at the no salt and 0.1 mol/L treatment levels. However, it exhibited a decreasing trend of gs with increasing salinity levels from 0.1 to 0.4 mol/L. There was a significant effect of salinity on gs of the three mangrove species. There was no significant difference in gs for each tested species between R. stylosa and A. corniculatum at no salt and 0.4 mol/L. Additionally, the gs of K. candel was significantly higher than that of R. stylosa and A. corniculatum at 0.2 mol/L level (Figure 4B).
The Ci values of R. stylosa were substantially higher at no salt than the other salinity treatment levels. The Ci of K. candel was not considerably different at no salt to 0.2 mol/L treatment levels but was significantly higher than the value at 0.4 mol/L level. The Ci value of A. corniculatum at 0.4 mol/L was significantly lower than those at no salt and 0.1 mol/L treatment levels. There were statistically significant differences in the Ci values of the three mangroves at no salt. At 0.1 and 0.2 mol/L, the Ci of R. stylosa was considerably lower than K. candel and A. corniculatum. The Ci of R. stylosa was significantly lower than that of A. corniculatum at the 0.1 and 0.2 mol/L levels. This value was lower for K. candel than for A. corniculatum at 0.1 and 0.4 mol/L (Figure 4C).
The E values of R. stylosa at no salt were considerably higher compared to other salinity treatment levels. The E of K. candel did not significantly vary at no NaCl and 0.2 mol/L treatments but differed significantly from 0.1 and 0.4 mol/L, with the lowest value at 0.4 mol/L. The E of A. corniculatum at 0.4 mol/L salinity treatment level was considerably lower than those at other treatment levels. Among the different plants, the E was significantly lower in R. stylosa than that in K. candel and A. corniculatum at 0.1 mol/L. Meanwhile, the value of K. candel was considerably higher than that of A. corniculatum at no salt and 0.2 mol/L (Figure 4D).
At no NaCl treatment, the IWUE value of R. stylosa was significantly lower than that at other treatments, reaching the maximum value at 0.2 mol/L. From no NaCl to 0.2 mol/L treatment, there was no significant effect on the IWHC of K. candel, but the values were significantly lower than this at 0.4 mol/L treatment. There was no significant difference in the IWHC of A. corniculatum between no NaCl and 0.1 mol/L treatment, and the value reached the maximum at 0.4 mol/L treatment. Among these three mangrove plant species, there was no significant difference in the IWHC values at no NaCl and 0.4 mol/L. Additionally, at the 0.1 and 0.2 mol/L treatments, there was no significant difference in the IWHC between K. candel and A. corniculatum, but these values were significantly lower than that of R. stylosa (Figure 4E). Moreover, we observed a similar pattern in the WHC as in the IWHC (Figure 4F).

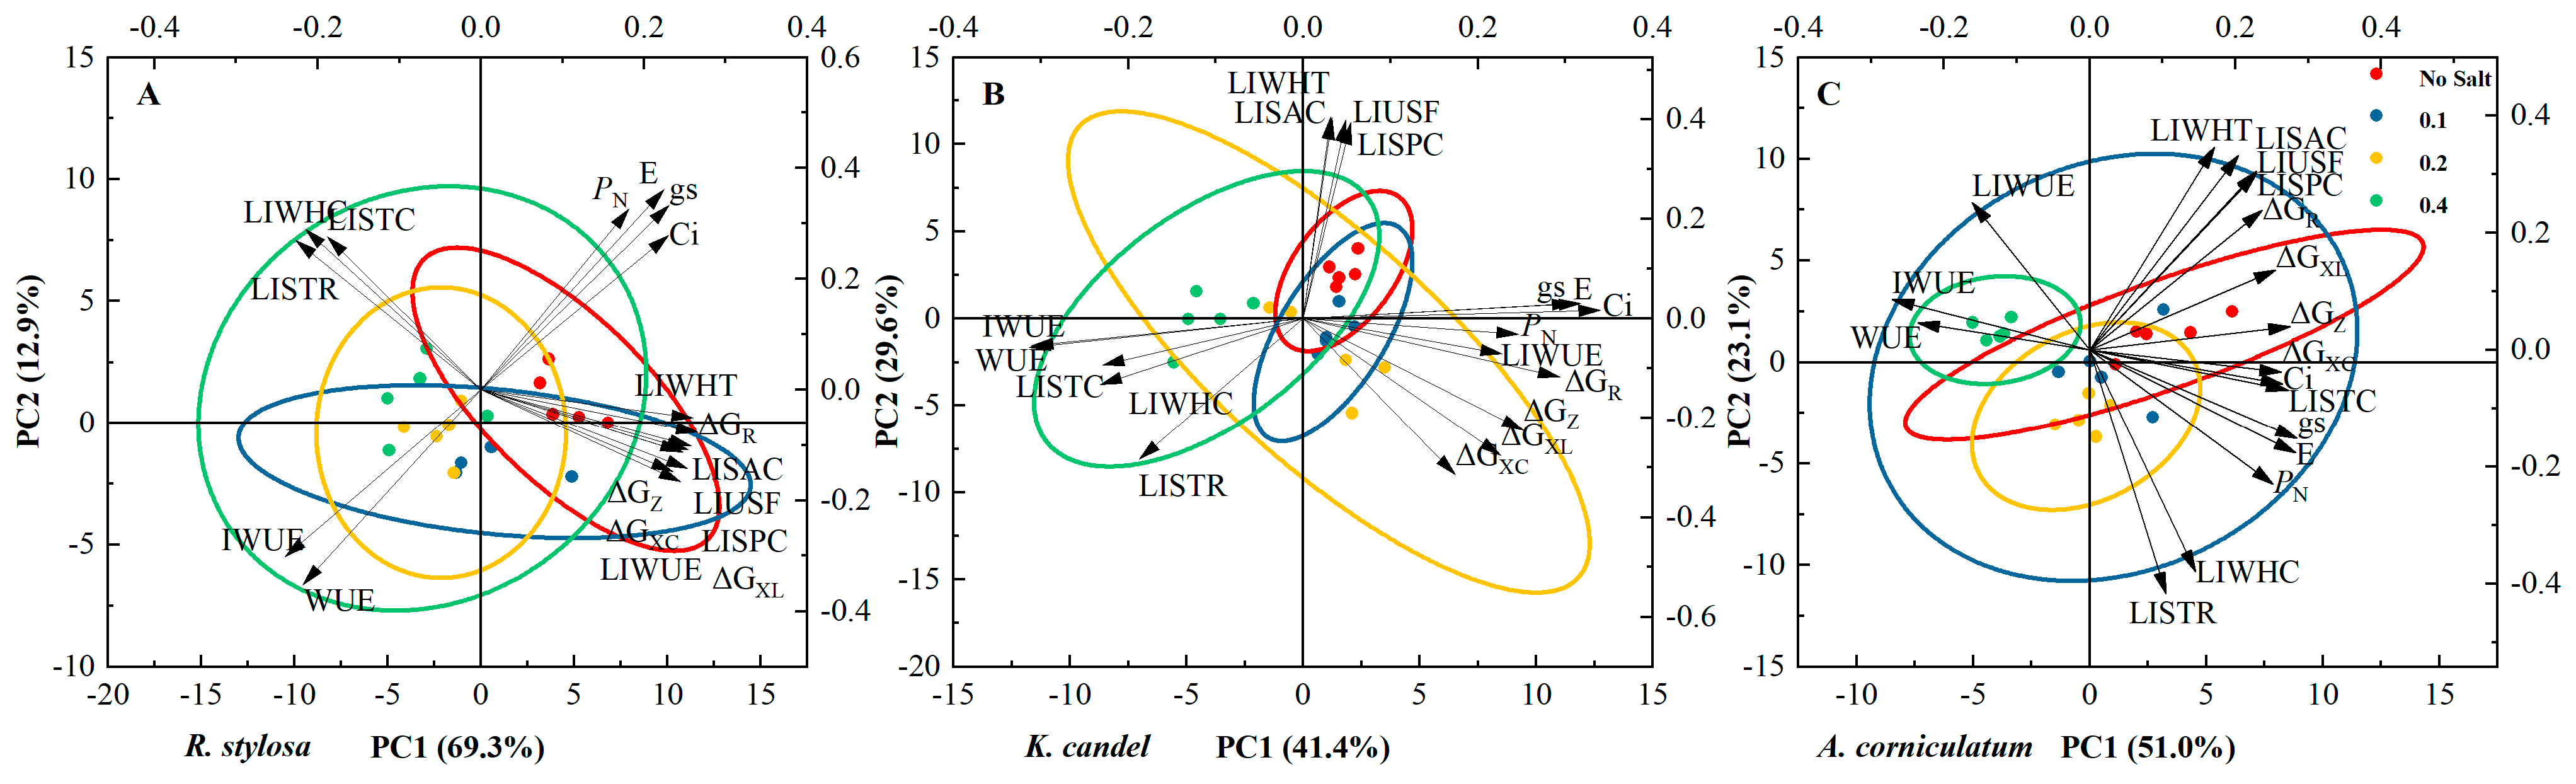
3.4. Principal Component Analysis

The variance contribution of the first two principal components of R. stylosa can reach 82.2%, among which PC1 and PC2 explain 69.3% and 12.9% of the total variance, respectively. ΔGR, LIWHT, and LISAC have a strong first principal component load, while E and gs have a strong second principal component load (Figure 5A). The variance contribution rate of the first two principal components of K. candel can reach 71.0%, of which PC1 and PC2 explain 41.4% and 29.6% of the total variance, respectively. Ci and E have strong first principal component loads, and LIWHT, LISAC, LIUSF, and LISPC have strong second principal component loads (Figure 5B). The variance contribution rate of the first two principal components of A. corniculatum can reach 74.1%, of which PC1 and PC2 explain 51.0% and 23.1% of the total variance, respectively. E, gs, LISTC, and ΔGZ have a strong first principal component load LIWHT, and LISAC have a strong second principal component load (Figure 5C). Therefore, water-use, salt transport, cellular endogenous convertible energy, and photosynthetic gas exchange parameters can be used as representative factors of physiological indexes of mangrove plants under different salt treatments.

4. Discussion

Salt stress is a major environmental stress that affects plant growth and development [34]. Mangrove plants show a very complex salt tolerance mechanism when adapting to salt stress. In this study, we used the electrophysiological sensor to capture plant electrical signals in a timely and non-invasive manner to explore the synchronous dynamic traits of intracellular water and salt in mangrove plants. We proposed hypothetical patterns of intracellular water and salt transport in the three mangrove plants under salinity conditions (Figure 6). In addition, there were also interspecific differences in ion homeostasis strategies at the plant cell level, and the dynamic characteristics of their intracellular water and salt transport were compared.
Are plant electrical signals reliable in characterizing plant salt tolerance and dynamics? Solute concentration, cell volume, and ion permeability depend on salt and water content in cells under salt stress, and they will inevitably change the dielectric constant of leaf tissue, which finally affects the electrophysiological parameters of plants, including ICP, IR, IZ, IXC, and IXL [35]. Under a salt environment, water loss reduces the turgor pressure; plant cells will further shrink, and cell volume declines, which can be reflected by the ICP value. Cell membrane proteins include binding proteins (intrinsic proteins) and surface proteins (peripheral proteins). Their composition and content are most closely related to salt transport, which can be reflected by XC and XL [36]. In addition, the biological mechanism of mangrove plants against high osmotic pressure in high salt environments also includes synthesizing antioxidant enzymes and accumulating soluble substances in the body [37,38]. These substances increased the electrolyte concentration in leaf cells, resulting in higher IXC, IR, and IZ values. The LIWHC, LIWUE, and LIWHT are related to cell volume and intracellular water use. The salt transfer parameters calculated using IR, IZ, IXC, and IXL could represent the salt efflux capacity of the plant. LISAC and LISPC reflect the transmembrane transport of salt.
Another issue is that the results under different clamping forces are not comparable. How can we reconcile the electrical information of plants after applying different pressures to their intrinsic information? In the previous study, we established the relationship models between the pressure and plant electrical parameters [25]. The IZ, IR, IXC, and IXL are calculated when the applied pressure on the leaf is equal to zero according to the three-parameter exponential equation between R, Z, XC, XL, and pressure. It is considered that this value can truly reflect the intrinsic electrical characteristics of plants. Then, the ICP is calculated according to the relationship between XC and C. This is because plants have electrical properties of low capacitance and high resistance, which makes the direct measurement of C prone to noise interference. The ICP calculated by IXC with less fluctuation is more stable and reliable. By doing this, the defects of the traditional methods for obtaining plant electrophysiological information can be overcome.

4.1. Responses of Rhizophora Stylosa to Salinity

Compared with the freshwater environment, the leaf transpiration of R. stylosa at 0.1 mol/L treatment was reduced, while the LIWHC and LISTR showed slight increases, and the LIUSF decreased slightly. These results indicated that the cytoplasm absorbed water and expanded, meanwhile decreasing the cellular salt influx. Although the salt dilution kept the same intensity as that at the no salt level, this salt-dilution effect at 0.1 mol/L level clearly reduced the cytoplasmic salt concentration and played an important role in the plant adaptation [39,40].
At 0.2 mol/L treatment, the LIWHT of R. stylosa was significantly lower than that at 0.1 mol/L treatment, which reduced the available water-holding time for physiological metabolisms of the plant. In addition, the salt transport parameters were also affected by the increase in salinity. Salt ions passively enter through nonselective cation channels and accumulate in the cytoplasm of plant cells in salt-containing environments. At the same time, the intracellular Na+ actively fluxes out or compartmentalizes across the plasma membrane and the vacuole membrane [5,41]. At this treatment level, the LIUSF decreased slightly, but the LISAC/LIUSF ratio increased by 1.31 times. It indicated that plants remarkably enhanced the capacity to transport salt ions actively but decreased the passive diffusion of salt ions into cells. As a result, the efflux of salt from cells was increased, alleviating the toxic effect of ions on the cytoplasm of plants. In short, R. stylosa plants at this level excluded salt ions from cells, enhanced salt rejection ability, and mitigated salt toxicity, which the increase in photosynthesis, IWUE, WUE, and plant height could also reflect [42].
At 0.4 mol/L salinity treatment, the LIWHC of R. stylosa increased sharply, and the LISTC was also improved. Plants responded to stress by diluting and accelerating the transport of intracellular salt. Additionally, compared with other NaCl treatments, there was no significant change in the LIWUE, LISTR, and photosynthetic of R. stylosa at 0.4 mol/L treatment level, and the ∆H had a higher value compared with those at no salt and 0.1 mol/L level but showed no clear difference with that at 0.2 mol/L level. This might be attributed to the salt exclusion by roots of R. stylosa, which prevents it from reaching the leaves through the transmission of rhizomes. The ion transporters on the root cell membrane of R. stylosa might be activated at this treatment level. These proteins can specifically recognize and transport beneficial ions such as K+ and Ca2+, and reduce the absorption of Na+ to ensure that the intracellular ion concentration is at an appropriate level [43]. This ion balance strategy provides favorable conditions for maintaining normal photosynthesis and stem elongation of R. stylosa.
Furthermore, R. stylosa plants growing at no salt treatment level exhibited a clearly significantly higher photosynthetic capacity than those subjected to NaCl treatments, attributed to the highly opening stomata and sufficient water supply. However, the halophytes, including R. stylosa, are always bound to a minimum level of salt for optimal functioning; the treatment solution without NaCl addition seemed to be a stress condition for the growth of R. stylosa plants. Although the energy that was converted from the photosynthetic products maintained a high level for the cellular metabolic activities of plants at no salt treatment, these plants also needed to allocate some energy converted from photosynthetic products for resisting the stress condition at this treatment, which, as a result, decreased the part of photosynthetic products used for biomass accumulation and was not supported by the increase in ∆H.

4.2. Responses of Kandelia Candel to Salinity

Similarly to R. stylosa, the gs of K. candel at 0.1 mol/L treatment was lower than that in the freshwater environment. At this treatment level, the LISAC/LIUSF of K. candel increased while the LISPC/LIUSF decreased, but the LIWHC did not change significantly. It implied that the leaf intracellular water status of K. candel remained stable, and the salt ion content was relatively reduced, alleviating the toxic effects of ions. In general, its ultrafiltration effect was significantly enhanced.
Compared with 0.1 mol/L, the salinity increased at 0.2 mol/L, which did not change the water potential of K. candel, but the dynamics of the intracellular water and salt showed obvious variations. K. candel relied mainly on the intracellular water and salt regulation mechanisms to adapt to the salt environment. On the one hand, the LISTR and LISTC were significantly accelerated, which separated the salt absorbed by plants into vacuoles and was conducive to the transfer and accumulation of salt [41,42]. On the other hand, improving LIWHC increased the cell fluid content, which strengthened the salt dilution ability. Nevertheless, LIUSF, LISAC, and LISPC values did not change compared to those at the 0.1 mol/L level, and the salt exclusion ability was equivalent. Previous studies have found that PN decreased with an increase in stress [44]. The results of this study were inconsistent with those findings. The stomata of K. candel were open and the transpiration was strengthened to a 0.2 mol/L level. The reason might be that the above-mentioned multiple salt adaptation mechanisms worked together to ensure the normal physiological activities and growth and development of K. candel plants. Therefore, we speculated that this treatment was the optimum salt concentration for the growth of K. candel in this study. In other words, moderate salinity can promote the growth of K. candel, similar to the effects observed in other halophytes [45,46].
Compared with the 0.2 mol/L treatment, there was no significant change in water potential, intracellular water use, and salt transfer parameters at 0.4 mol/L, which indicated that the salt accumulation, salt dilution, and salt exclusion abilities of plants were comparable at these treatments. IWHC and WHC increased at this treatment, seemingly maintaining water balance through gas exchange parameters. We speculate that the energy stored from photosynthesis and the cellular endogenous convertible energy are two forms of energy input, and these energies are mainly used for growth, material metabolism such as ion uptake, resisting adversity, and other life activities. In this treatment, the stomatal closure of K. candel plants hindered the diffusion of atmospheric CO2 to the carboxylation sites within the chloroplasts, resulting in a decrease in the Ci, CO2 assimilation rate and PN; the cellular endogenous convertible energy is significantly reduced. These two processes work together to reduce energy input. Furthermore, the plant height increment was markedly reduced, while the salt transport parameter changes were insignificant. These results showed that, during this treatment, the energy consumption of ion absorption was unchanged, and the energy consumption of resisting adversity was greatly increased.

4.3. Response of Aegiceras Corniculatum to Salinity

Compared with the plants at no salt treatment, the water uses and photosynthetic indices of A. corniculatum plants at 0.1 mol/L did not change remarkably. At this treatment level, the cell volume remained stable, the intracellular water was sufficient, and the use of light energy to synthesize organic matter was not affected. Although the LIUSF decreased, plants increased the proportion of LISAC but decreased the proportion of LISPC at this level, and salt exclusion and ultrafiltration played important roles in plant adaptation.
At 0.2 mol/L treatment level, the cell volume of A. corniculatum was kept stable, but the salt influx into cells was decreased. These results indicated that A. corniculatum plants were influenced by the salinity at this level, but root salt exclusion was still the main way to resist adversity. However, the increase in salt concentration did not impact the fundamental life activities of A. corniculatum leaves in utilizing light energy synthesis to synthesize organic matter.
At high salinity treatment (0.4 mol/L), A. corniculatum plants closed the stomata and weakened the transpiration to reduce water loss, thereby diminishing the PN. Xu et al. studied the photosynthesis of Myoporum bontioides under salt stress and reported similar results [47]. The alternations of mesophyll or chloroplasts induced by salt stress limited the CO2 assimilation in mangroves [48]. Plants at this level increased the three kinds of water-use efficiency to alleviate the adverse effects of water deficit caused by salt stress [49]. The salinity increases at this level did not cause significant changes in salt transport parameters and cellular endogenous convertible energy, and the plant height growth and water potential all remained constant. These results indicated that A. corniculatum plants did not store salt in their body after absorbing it but discharged the salt out of the body through salt glands, therefore maintaining the ion homeostasis in the plant. It has been confirmed that salt-secreting plants accurately regulate the salt load in metabolically active leaf tissues to adapt to extreme environmental conditions through salt glands [50]. The mechanism of salt secretion played a key role in adapting A. corniculatum to a high-salt environment [41].

4.4. Comparison of the Salt Adaptation Mechanisms Among Three Mangrove Plants According to the Electrophysiological Information

Mangroves have evolved different adaptation mechanisms over their long-term evolution process [51]. We tried to use electrophysiological information to explain the long-term salt adaptation mechanisms and the differences between the three mangroves from the perspective of intracellular water and salt dynamics. With increased salt concentration, the LIUSF and LISPC values of the three mangrove plants decreased, and the increased LISAC/LIUSF ratio and decreased LISPC/LIUSF ratio indicated that the amount of salt influx into cells decreased. This result confirmed that the three mangrove plants not only filtered the excess salt through ultrafiltration of the root but also presented salt exclusion at the cellular level. However, in contrast, the LIUSF value of A. corniculatum was higher than that of R. stylosa and K. candel, which indicated that a higher amount of salt was transported to the plant through the roots, in other words, the salt exclusion ability of the roots of A. corniculatum was relatively weak. Meanwhile, the intracellular salt transport rate of A. corniculatum leaves remained stable, and the evapotranspiration fluctuated less with salinity at 0.4 mol/L, which proved that this mangrove plant species mainly relied on salt glands to adapt to the high salt environment rather than the intracellular adaptation mechanism. In addition, K. candel had the highest LIWHC of the other two plant species, which might be attributed to its larger leaf cell size and vacuole volume, which supported its better water storage and salt dilution capacities [19]. Furthermore, the LIWHT extension of R. stylosa kept the intracellular salt dilution, protecting the cell structure and maintaining the water flow. The representative factors for the adaptability of the three mangrove species at salt treatment are predominantly centered around water utilization, salt transport, cellular endogenous convertible energy, and photosynthetic gas exchange parameters, with distinctions among species. For R. stylosa, variations in ΔGR, LIWHT, and LISAC significantly influence its overall adaptive response. Additionally, the process of balancing water and gas exchange via stomatal regulation plays a crucial role in accounting for the remaining variance in its response to salt stress [52]. In contrast, for K. candel, the carbon dioxide utilization and water-loss processes have the greatest impact on its adaptation to salt. The dynamic regulation mechanism of intracellular water–salt balance supplements the first principal component, enabling the plant to adapt to the salt environment. A. corniculatum mainly responds to changes in the saline environment through stomatal regulation and alterations in salt transport and cellular endogenous convertible energy. These processes are closely associated with changes in the plant’s growth or overall physiological state; the leaf intracellular water-holding time and salt active transport capacity further fine-tune the plant’s water and salt status, facilitating better adaptation to the salt environment.

5. Conclusions

The synchronous variations in leaf intracellular water and salt explained the effects of salt dilution, salt exclusion and salt accumulation in R. stylosa, K. candel, and A. corniculatum; the adaptabilities of these plants differed with different salt stress levels. R. stylosa reduced cytoplasmic salt concentration by absorbing large amounts of water while decreasing salt inflow at 0.1 mol/L NaCl treatment; they decreased the water used for metabolisms and slightly improved the salt exclusion at 0.2 mol/L. This plant at 0.4 mol/L enhanced salt dilution and exclusion. K. candel showed a cellular ultrafiltration effect at 0.1 mol/L and transferred and accumulated salt in the vacuole, meanwhile diluting the intracellular salt by increasing cell fluid and maintaining the salt exclusion capacity at 0.2 and 0.4 mol/L treatments. A. corniculatum exhibited salt exclusion and ultrafiltration effects at 0.1 and 0.2 mol/L treatments, and decreased the cellular salt influx, whereas it adapted to treatment by activating the salt secretion. In addition, the representative factors of salt treatment adaptability of the three mangrove species were also different among species but mainly concentrated on water-use, salt transport, cellular endogenous convertible energy, and photosynthetic gas exchange parameters. These insights will help to understand the adaptability of mangrove plants further and provide guidance for the timely protection of mangrove ecosystems.

Supplementary Materials

The following supporting information can be downloaded at: https://www.mdpi.com/article/10.3390/horticulturae11030309/s1, The derivation formula of internal relationship between electrophysiological parameters and gripping force and the derivation formula of leaf intracellular water and salt transport and cellular endogenous convertible energy.

Author Contributions

Conceptualization, Y.W. and D.X.; methodology, Y.W. and D.X.; validation, Q.C.; formal analysis, J.W. and Q.Z.; investigation, J.W. and Q.Z.; data curation, Q.C. and J.W.; writing—original draft preparation, J.W.; writing—review and editing, Y.W., D.X. and M.R.Q.P.; project administration, Y.W. and D.X; funding acquisition, Y.W. and D.X. All authors have read and agreed to the published version of the manuscript.

Funding

This research was funded by the National Key Research and Development Program of China [No. 2021YFD1100300], and the Priority Academic Program Development of Jiangsu Higher Education Institutions [PAPD-2023-87].

Data Availability Statement

The raw data supporting the conclusions of this article will be made available by the authors on request.

Conflicts of Interest

The authors declare no conflicts of interest.

References

  1. Kauffman, J.; Arifanti, V.; Basuki, I.; Kurnianto, S.; Novita, N.; Murdiyarso, D.; Donato, D.; Warren, M. Protocols for the measurement, monitoring, and reporting of structure, biomass, carbon stocks and greenhouse gas emissions in tropical peat swamp forests. Environ. Sci. 2016, 221, 006429. [Google Scholar] [CrossRef]
  2. Wang, W.; Wang, M. The Mangroves of China; Science Press: Beijing, China, 2007. [Google Scholar]
  3. Reef, R.; Lovelock, C.E. Regulation of Water Balance in Mangroves. Ann. Bot. 2015, 115, 385–395. [Google Scholar] [CrossRef] [PubMed]
  4. Fu, Z.W.; Feng, Y.R.; Gao, X.; Ding, F.; Li, J.H.; Yuan, T.T.; Lu, Y.T. Salt stress-induced chloroplastic hydrogen peroxide stimulates pdTPI sulfenylation and methylglyoxal accumulation. Plant Cell 2023, 35, 1593–1616. [Google Scholar] [CrossRef]
  5. Munns, R.; Tester, M. Mechanisms of Salinity Tolerance. Annu. Rev. Plant Biol. 2008, 59, 651–681. [Google Scholar] [CrossRef]
  6. Krauss, K.W.; Ball, M.C. On the Halophytic Nature of Mangroves. Trees 2013, 27, 7–11. [Google Scholar] [CrossRef]
  7. Nizam, A.; Meera, S.P.; Kumar, A. Genetic and Molecular Mechanisms Underlying Mangrove Adaptations to Intertidal Environments. iScience 2022, 25, 103547. [Google Scholar] [CrossRef] [PubMed]
  8. Tomlinson, P.B. The Botany of Mangroves; Cambridge University Press: New York, NY, USA, 1986. [Google Scholar]
  9. Sreeshan, A.; Meera, S.P.; Augustine, A. A Review on Transporters in Salt Tolerant Mangroves. Trees-Struct. Funct. 2014, 28, 957–960. [Google Scholar] [CrossRef]
  10. Lee, S.Y.; Primavera, J.H.; Dahdouh-Guebas, F.; McKee, K.; Bosire, J.O.; Cannicci, S.; Diele, K.; Fromard, F.; Koedam, N.; Marchand, C.; et al. Ecological Role and Services of Tropical Mangrove Ecosystems: A Reassessment. Glob. Ecol. Biogeogr. 2014, 23, 726–743. [Google Scholar] [CrossRef]
  11. Liang, M.; Hu, F.; Xie, D.; Chen, Z.; Zheng, Q.; Xie, Q.; Zheng, F.; Liu, D.; Jian, S.; Chen, H.; et al. Physiological Measurements and Transcriptome Survey Reveal How Semi-Mangrove Clerodendrum inerme Tolerates Saline Adversity. Front. Plant Sci. 2022, 13, 882884. [Google Scholar] [CrossRef]
  12. Wu, X.; Li, J.; Song, L.Y.; Zeng, L.L.; Guo, Z.J.; Ma, D.N.; Wei, M.Y.; Zhang, L.D.; Wang, X.X.; Zheng, H.L. NADPH oxidase-dependent H2O2 production mediates salicylic acid-induced salt tolerance in mangrove plant Kandelia obovata by regulating Na+/K+ and redox homeostasis. Plant J. 2024, 118, 1119–1135. [Google Scholar] [CrossRef]
  13. Zeng, L.L.; Song, L.Y.; Wu, X.; Ma, D.N.; Song, S.W.; Wang, X.X.; Zheng, H.L. Brassinosteroid enhances salt tolerance via S-nitrosoglutathione reductase and nitric oxide signaling pathway in mangrove Kandelia obovata. Plant Cell Environ. 2024, 47, 511–526. [Google Scholar] [CrossRef] [PubMed]
  14. Ball, M.C. Salinity Tolerance in the Mangroves Aegiceras corniculatum and Avicennia marina. I. Water Use in Relation to Growth, Carbon Partitioning, and Salt Balance. Funct. Plant Biol. 1988, 15, 447–464. [Google Scholar] [CrossRef]
  15. Feng, X.; Li, G.; Xu, S.; Wu, W.; Chen, Q.; Shao, S.; Liu, M.; Wang, N.; Zhong, C.; He, Z.; et al. Genomic Insights into Molecular Adaptation to Intertidal Environments in the Mangrove Aegiceras corniculatum. New Phytol. 2021, 231, 2346–2358. [Google Scholar] [CrossRef] [PubMed]
  16. Miryeganeh, M.; Saze, H. The First De Novo Transcriptome Assembly and Transcriptomic Dynamics of the Mangrove Tree Rhizophora stylosa Griff. (Rhizophoraceae). Int. J. Mol. Sci. 2021, 22, 11964. [Google Scholar] [CrossRef] [PubMed]
  17. Basyuni, M.; Baba, S.; Kinjo, Y.; Putri, L.A.P.; Hakim, L.; Oku, H. Salt-Dependent Increase in Triterpenoids Is Reversible upon Transfer to Fresh Water in Mangrove Plants Kandelia candel and Bruguiera gymnorrhiza. J. Plant Physiol. 2012, 169, 1903–1908. [Google Scholar] [CrossRef]
  18. Huang, H.; Zhuang, L.; Tang, H.; Guo, Z.; Li, Q.; Lin, Z.; Dai, M.; Wang, X.; Wang, Y.; Zheng, H.; et al. Biosynthesis-Based Spatial Metabolome of Condensed Tannin Reveals Its Role in Salt Tolerance of Non-Salt-Secretor Mangrove Kandelia obovata. Plant Cell Environ. 2024, 48, 39503313. [Google Scholar] [CrossRef]
  19. Ali Solangi, K.; Wu, Y.; Xing, D.; Ahmed Qureshi, W.; Hussain Tunio, M.; Ali Sheikh, S.; Shabbir, A. Can Electrophysiological Information Reflect the Response of Mangrove Species to Salt Stress? A Case Study of Rewatering and Sodium Nitroprusside Application. Plant Signal. Behav. 2022, 17, 2073420. [Google Scholar] [CrossRef]
  20. Mimura, T.; Kura-Hotta, M.; Tsujimura, T.; Ohnishi, M.; Miura, M.; Okazaki, Y.; Mimura, M.; Maeshima, M.; Washitani-Nemoto, S. Rapid Increase of Vacuolar Volume in Response to Salt Stress. Planta 2003, 216, 397–402. [Google Scholar] [CrossRef]
  21. Ali Solangi, K.; Wu, Y.; Chen, Q.; Ahmed Qureshi, W.; Xing, D.; Hussain Tunio, M.; Ali Shaikh, S. The Differential Responses of Aegiceras corniculatum and Kandelia candel under Salt Stress and Re-Watering Phase. A Study of Leaf Electrophysiological and Growth Parameters. J. Plant Interact. 2021, 16, 307–320. [Google Scholar] [CrossRef]
  22. Lou, C.H. Messenger transmission of electrochemical waves in higher plants. Acta Biophys. Sin. 1996, 4, 739–745. (In Chinese) [Google Scholar]
  23. Sinyukhin, A.M.; Britikov, E.A. Action Potentials in the Reproductive System of Plants. Nature 1967, 215, 1278–1280. [Google Scholar] [CrossRef]
  24. Zhang, C.; Wu, Y.; Su, Y.; Xing, D.; Dai, Y.; Wu, Y.; Fang, L. A Plant’s Electrical Parameters Indicate Its Physiological State: A Study of Intracellular Water Metabolism. Plants 2020, 9, 1256. [Google Scholar] [CrossRef] [PubMed]
  25. Gallé, A.; Lautner, S.; Flexas, J.; Fromm, J. Environmental Stimuli and Physiological Responses: The Current View on Electrical Signalling. Environ. Exp. Bot. 2015, 114, 15–21. [Google Scholar] [CrossRef]
  26. Blackman, C.; Brodribb, T. Two Measures of Leaf Capacitance: Insights into the Water Transport Pathway and Hydraulic Conductance in Leaves. Funct. Plant Biol. 2011, 38, 118–126. [Google Scholar] [CrossRef]
  27. Shi, L. Distribution, growth environment and environmental adaptability of mangroves in China. Mar. Inf. 2002, 4, 14–18. (In Chinese) [Google Scholar] [CrossRef]
  28. Zhang, M.; Wu, Y.; Xing, D.; Zhao, K.; Yu, R. Rapid Measurement of Drought Resistance in Plants Based on Electrophysiological Properties. Trans. ASABE (Am. Soc. Agric. Biol. Eng.) 2015, 58, 1441–1446. [Google Scholar] [CrossRef]
  29. Javed, Q.; Wu, Y.; Xing, D.; Azeem, A.; Ullah, I.; Zaman, M. Re-Watering: An Effective Measure to Recover Growth and Photosynthetic Characteristics in Salt-Stressed Brassica napus L. Chil. J. Agric. Res. 2017, 77, 78–86. [Google Scholar] [CrossRef]
  30. Wei, P.; Li, H.; Wu, Y.; Zhang, C. Association of the electrical parameters and photosynthetic characteristics of the tea tree manifests its response to simulated karst drought. Plant Signal. Behav. 2024, 19, 2359258. [Google Scholar] [CrossRef]
  31. Zhang, C.; Su, Y.; Wu, Y.; Li, H.; Zhou, Y.; Xing, D. Comparison on the Nutrient Plunder Capacity of Orychophragmus Violaceus and Brassica Napus L. Based on Electrophysiological Information. Horticulturae 2021, 7, 206. [Google Scholar] [CrossRef]
  32. Chen, T.; Wu, Y.; Xing, D.; Duan, R. Effects of NaHSO3 on Cellular Metabolic Energy, Photosynthesis and Growth of Iris pseudacorus L. Horticulturae 2022, 8, 185. [Google Scholar] [CrossRef]
  33. Duan, R.; Xing, D.; Chen, T.; Wu, Y. Effects of Different Inorganic Nitrogen Sources of Iris pseudacorus and Iris japonica on Energy Distribution, Nitrogen, and Phosphorus Removal. HortScience 2022, 57, 698–707. [Google Scholar] [CrossRef]
  34. Zhao, S.; Zhang, Q.; Liu, M.; Zhou, H.; Ma, C.; Wang, P. Regulation of Plant Responses to Salt Stress. Int. J. Mol. Sci. 2021, 22, 4609. [Google Scholar] [CrossRef] [PubMed]
  35. De Jong, S.M.; Addink, E.A.; Doelman, J.C. Detecting Leaf-Water Content in Mediterranean Trees Using High-Resolution Spectrometry. Int. J. Appl. Earth Obs. Geoinf. 2014, 27, 128–136. [Google Scholar] [CrossRef]
  36. Nguyen, C.T.; Kurenda, A.; Stolz, S.; Chételat, A.; Farmer, E.E. Identification of Cell Populations Necessary for Leaf-to-Leaf Electrical Signaling in a Wounded Plant. Proc. Natl. Acad. Sci. USA 2018, 115, 10178–10183. [Google Scholar] [CrossRef]
  37. Theerawitaya, C.; Samphumphaung, T.; Cha-um, S.; Yamada, N.; Takabe, T. Responses of Nipa Palm (Nypa fruticans) Seedlings, a Mangrove Species, to Salt Stress in Pot Culture. FLORA 2014, 209, 597–603. [Google Scholar] [CrossRef]
  38. Slama, I.; Abdelly, C.; Bouchereau, A.; Flowers, T.; Savouré, A. Diversity, Distribution and Roles of Osmoprotective Compounds Accumulated in Halophytes under Abiotic Stress. Ann. Bot. 2015, 115, 433–447. [Google Scholar] [CrossRef]
  39. Flowers, T.J.; Colmer, T.D. Salinity Tolerance in Halophytes. New Phytol. 2008, 179, 945–963. [Google Scholar] [CrossRef]
  40. Zhang, J.; Shi, H. Physiological and Molecular Mechanisms of Plant Salt Tolerance. Photosynth. Res. 2013, 115, 1–22. [Google Scholar] [CrossRef]
  41. Kosová, K.; Prášil, I.T.; Vítámvás, P. Protein Contribution to Plant Salinity Response and Tolerance Acquisition. Int. J. Mol. Sci. 2013, 14, 6757–6789. [Google Scholar] [CrossRef]
  42. Fang, F.; Gui, H.; Li, Z.; Zhang, X. Physiological Adaptation of Six Mangrove Seedlings to Different Salinity. Bull. Bot. Res. 2023, 43, 881–889. (In Chinese) [Google Scholar]
  43. Ankit, A.; Kamali, S.; Singh, A. Genomic & Structural Diversity and Functional Role of Potassium (K+) Transport Proteins in Plants. Int. J. Biol. Macromol. 2022, 208, 844–857. [Google Scholar] [CrossRef] [PubMed]
  44. Li, N.; Chen, S.; Zhou, X.; Li, C.; Shao, J.; Wang, R.; Fritz, E.; Hüttermann, A.; Polle, A. Effect of NaCl on Photosynthesis, Salt Accumulation and Ion Compartmentation in Two Mangrove Species, Kandelia candel and Bruguiera gymnorhiza. Aquat. Bot. 2008, 88, 303–310. [Google Scholar] [CrossRef]
  45. Yuan, F.; Xu, Y.; Leng, B.; Wang, B. Beneficial Effects of Salt on Halophyte Growth: Morphology, Cells, and Genes. Open Life Sci. 2019, 14, 191–200. [Google Scholar] [CrossRef]
  46. Alhaddad, F.A.; Abu-Dieyeh, M.H.; ElAzazi, E.-S.M.; Ahmed, T.A. Salt Tolerance of Selected Halophytes at the Two Initial Growth Stages for Future Management Options. Sci. Rep. 2021, 11, 10194. [Google Scholar] [CrossRef]
  47. Xu, H.M.; Tam, N.F.Y.; Zan, Q.J.; Bai, M.; Shin, P.K.S.; Vrijmoed, L.L.P.; Cheung, S.G.; Liao, W.B. Effects of Salinity on Anatomical Features and Physiology of a Semi-Mangrove Plant Myoporum bontioides. Mar. Pollut. Bull. 2014, 85, 738–746. [Google Scholar] [CrossRef]
  48. Parida, A.K.; Das, A.B.; Mittra, B. Effects of NaCl Stress on the Structure, Pigment Complex Composition, and Photosynthetic Activity of Mangrove Bruguiera parviflora Chloroplasts. Photosynthetica 2003, 41, 191–200. [Google Scholar] [CrossRef]
  49. Hao, G.; Jones, T.J.; Luton, C.; Zhang, Y.; Manzane, E.; Scholz, F.G.; Bucci, S.J.; Cao, K.; Goldstein, G. Hydraulic Redistribution in Dwarf Rhizophora mangle Trees Driven by Interstitial Soil Water Salinity Gradients: Impacts on Hydraulic Architecture and Gas Exchange. Tree Physiol. 2009, 29, 697–705. [Google Scholar] [CrossRef]
  50. Chen, X.; Wegner, L.H.; Gul, B.; Yu, M.; Shabala, S. Dealing with Extremes: Insights into Development and Operation of Salt Bladders and Glands. Crit. Rev. Plant Sci. 2023, 43, 158–170. [Google Scholar] [CrossRef]
  51. Sugihara, K.; Hanagata, N.; Dubinsky, Z.; Baba, S.; Karube, I. Molecular Characterization of cDNA Encoding Oxygen Evolving Enhancer Protein 1 Increased by Salt Treatment in the Mangrove Bruguiera gymnorrhiza. Plant Cell Physiol. 2000, 41, 1279–1285. [Google Scholar] [CrossRef]
  52. Chen, C.I.; Lin, K.H.; Huang, M.Y.; Wong, S.L.; Liao, T.S.; Chen, M.N.; Weng, J.H.; Hsueh, M.L.; Lai, Y.H.; Wang, C.W. Photosynthesis in Response to Different Salinities and Immersions of Two Native Rhizophoraceae Mangroves. Cells 2022, 11, 3054. [Google Scholar] [CrossRef]
Figure 1. Experimental design and setup diagram. This device was composed of two pumps, a time switch, a bucket, a culture tank, and a water pipe to simulate tidal changes.
Horticulturae 11 00309 g001
Figure 2. Simplified equivalent circuit of cells. Where Z = impedance, Cm = capacitance of membrane, Rm = resistance of membrane, Xcm = capacitive reactance of membrane, XLm = inductive reactance of membrane, Ro = resistance outside the membrane, Ri = resistance inside the membrane.
Horticulturae 11 00309 g002
Figure 3. Schematic of the parallel-plate capacitor: 1: bracket, 2: foam board, 3: electrode; 4: wire, 5: iron, 6: plastic bar, 7: fixation clamp.
Horticulturae 11 00309 g003
Figure 4. Changes in photosynthetic gas exchange parameters and two kinds of water-use efficiency of mangroves under different salinity stresses. (A) Net photosynthetic rate (PN, µmol·m−2·s−1); (B) stomatal conductance (gs, mol·m−2·s−1); (C) Intercellular carbon dioxide concentration (Ci, µmol·mol−1); (D) Transpiration rate (E, mmol·m−2·s−1); (E) Intrinsic water use efficiency (IWUE, µmol·mmol−1); (F) Water use efficiency (WUE, µmol·mmol−1). (Note: Different letters appear above the error bars of the same parameter when subsequent values differ significantly at p ≤ 0.05, according to one-way ANOVA, n = 5).
Horticulturae 11 00309 g004
Figure 5. Principal component analysis (PCA) of three mangrove plants under different salinity stresses. (A) R. stylosa, (B) K. candel, (C) A. corniculatum.
Horticulturae 11 00309 g005
Figure 6. The hypothetical patterns of intracellular water and salt transport in mangrove leaves under different salt levels: (A) R. stylosa, (B) K. candel, (C) A. corniculatum. Among them, the arrow’s thickness represents the inflow and outflow amounts of substances through the cell. It should be noted that the increase or decrease in the parameters in this figure is just a relative concept compared to that at no salt treatment but does not mean the absolute value or ratio. R. stylosa reduced the cytoplasmic salt by increasing water absorption while decreasing salt inflow at 0.1 mol/L NaCl. K. candel transferred salt into a vacuole, diluting the intracellular salt by increasing cell fluid at 0.2 and 0.4 mol/L. A. corniculatum exhibited salt exclusion and ultrafiltration at 0.1 and 0.2 mol/L NaCl, then decreased the cellular salt influx and adapted to 0.4 mol/L NaCl by activating salt secretion.
Horticulturae 11 00309 g006
Table 1. Comparison between R. stylosa, K. candel, and A. corniculatum.
Plant SpeciesSalt Balance Mechanisms HabitatsLeaf Anatomy
R. stylosaSalt exclusionMid-tidal ZoneDorsiventral leaf with thick upper epidermal cuticle and high tannin content
K. candelSalt exclusionLow-mid tide ZoneIsobilateral leaf, thick upper and lower epidermal cuticle, white crystals in endodermis, fenestrated and spongy tissues, high tannin content
A. corniculatumSalt exclusion
Salt secretion
Low-mid tide ZoneDorsiventral leaf, upper and lower epidermal cuticle thick and with salt glands, low tannin content
Table 2. Plant height increment during the 60 days treatment period and water potential under different salinity.
SpeciesNaCl Concentration/mol·L−1∆H/mmΨLw/Mpa
R. stylosaNo salt35.00 ±2.89 cd−1.55 ± 0.05 ab
0.130.00 ±5.00 d−1.59 ± 0.03 bc
0.246.67 ± 4.41 bc−1.54 ± 0.04 ab
0.450.33 ± 3.18 b−1.65 ± 0.04 bc
K. candelNo salt46.67 ± 3.33 bc−2.09 ± 0.14 d
0.133.33 ± 1.67 cd−1.70 ± 0.10 bc
0.276.67 ± 6.01 a−1.63 ± 0. 06 bc
0.415.00 ± 7.64 e−1.94 ± 0.31 cd
A. corniculatumNo salt13.33 ± 4.41 e−1.35 ± 0.03 ab
0.113.33 ± 7.26 e−1.32 ± 0.02 ab
0.226.67 ± 1.67 de−1.18 ± 0.03 a
0.421.67 ± 1.67 de−1.56 ± 0.17 ab
Note: mean ± SE (n = 3), the same letter in the same column indicates that the difference is not significant at the 0.05 level.
Table 3. Leaf intracellular water-use indices at each salinity treatment level.
SpeciesNaCl Concentration/mol L−1LIWHCLIWUE (×10−1)LIWHT
R. stylosaNo salt313.80 ± 49.14 de1.28 ± 0.29 bcd48.41 ± 0.59 ab
0.1496.97 ± 49.29 de0.86 ± 0.14 cde46.54 ± 1.72 ab
0.2667.72 ± 93.62 cd0.55 ± 0.06 de39.45 ± 0.86 c
0.41164.21 ± 154.21 b0.36 ± 0.08 e38.59 ± 1.39 c
K. candelNo salt1183.06 ± 72.84 b0.57 ± 0.04 de38.54 ± 1.35 c
0.11128.80 ± 122.25 bc0.78 ± 0.15 cde26.27 ± 2.02 d
0.22618.53 ± 319.66 a0.46 ± 0.12 de24.98 ± 3.28 d
0.42832.50 ± 400.19 a0.25 ± 0.03 e28.70 ± 2.77 d
A. corniculatumNo salt170.22 ± 18.89 de1.69 ± 0.37 b51.39 ± 0.70 a
0.1182.90 ± 28.21 de1.45 ± 0.16 bc46.49 ± 2.14 ab
0.2353.10 ± 37.80 de0.87 ± 0.12 cde40.29 ± 1.67 c
0.453.05 ± 6.72 e3.16 ± 0.67 a44.30 ± 1.84 bc
Note: mean ± SE (n = 5), the same letter in the same column indicates that the difference is not significant at the 0.05 level.
Table 4. Salt transfer parameters of leaves at each salinity treatment level.
SpeciesNaCl Concentration/mol L−1LISACLISPCLIUSFLISTRLISTCLISAC/LIUSF (%)LISPC/LIUSF (%)
R. stylosaNo salt0.79 ± 0.01 ab2.29 ± 0.16 bc3.09 ± 0.17 b6.52 ± 1.06 d19.56 ± 2.58 de25.71%74.29%
0.10.77 ± 0.05 b2.12 ± 0.4 bcd2.89 ± 0.45 bc10.78 ± 1.15 cd29.58 ± 3.01 cd26.64%73.36%
0.20.63 ± 0.02 c1.18 ± 0.07 de1.82 ± 0.09 cde17.04 ± 2.62 cd30.59 ± 4.08 cd34.95%65.05%
0.40.63 ± 0.02 c1.15 ± 0.07 de1.77 ± 0.08 cde30.24 ± 3.86 bc52.92 ± 6.18 b35.28%64.72%
K. candelNo salt0.60 ± 0.02 c1.08 ± 0.08 de1.68 ± 0.10 de30.94 ± 2.39 bc51.44 ± 3.21 b35.90%64.10%
0.10.42 ± 0.03 d0.58 ± 0.06 e1.01 ± 0.09 e43.69 ± 5.57 b43.09 ± 4.70 bc41.93%58.07%
0.20.40 ± 0.05 d0.56 ± 0.09 e0.96 ± 0.14 e107.48 ± 10.83 a100.42 ± 13.63 a41.97%58.03%
0.40.46 ± 0.04 d0.67 ± 0.09 e1.12 ± 0.13 de103.77 ± 21.03 a109.84 ± 15.42 a40.67%59.33%
A. corniculatumNo salt0.88 ± 0.02 a4.26 ± 0.75 a5.14 ± 0.77 a3.30 ± 0.33 d17.73 ± 4.31 de17.11%82.89%
0.10.77 ± 0.05 b2.57 ± 0.78 b3.34 ± 0.83 b4.02 ± 0.78 d12.57 ± 2.90 de23.05%76.94%
0.20.65 ± 0.03 c1.26 ± 0.10 cde1.91 ± 0.12 cde8.74 ± 0.79 cd16.71 ± 2.00 de34.05%65.95%
0.40.71 ± 0.03 bc1.61 ± 0.23 bcde2.31 ± 0.26 bcd1.18 ± 0.11 d2.82 ± 0.51 e30.55%69.45%
Note: mean ± SE (n = 5), the same letter in the same column indicates that the difference is not significant at the 0.05 level.
Table 5. Cellular endogenous convertible energy of leaves at each salinity treatment level.
SpeciesNaCl Concentration/mol L−1ΔGRΔGZΔGXCΔGXL
R. stylosaNo salt76.28 ± 7.38 bc91.42 ± 9.79 bc95.81 ± 10.7 d80.85 ± 8.01 d
0.161.09 ± 6.90 bc77.61 ± 8.91 bc82.02 ± 9.96 d66.59 ± 6.99 d
0.237.39 ± 4.81 c55.23 ± 5.04 bc65.76 ± 4.87 d48.13 ± 4.54 d
0.434.68 ± 8.40 c52.56 ± 9.48 c63.06 ± 9.62 d45.31 ± 8.22 d
K. candelNo salt187.71 ± 11.55 a178.24 ± 6.83 a171.33 ± 6.82 bc178.37 ± 7.03 bc
0.1219.26 ± 19.35 a218.95 ± 15.50 a229.39 ± 14.80 ab225.31 ± 12.33 ab
0.2196.13 ± 38.72 a229.01 ± 52.32 a284.72 ± 62.32 a253.92 ± 55.59 a
0.496.19 ± 12.79 b112.95 ± 11.83 b156.63 ± 19.11 c133.17 ± 13.78 c
A. corniculatumNo salt75.50 ± 14.48 bc83.83 ± 15.70 bc85.50 ± 16.16 d75.77 ± 14.37 d
0.147.97 ± 11.47 c70.50 ± 11.16 bc75.56 ± 12.22 d55.04 ± 10.98 d
0.239.27 ± 6.65 c64.92 ± 6.09 bc77.21 ± 6.46 d52.38 ± 6.43 d
0.438.65 ± 3.19 c38.96 ± 2.41 c39.41 ± 2.51 d38.52 ± 2.46 d
Note: mean ± SE (n = 5), the same letter in the same column indicates that the difference is not significant at the 0.05 level.
Table 6. Differences among leaf intracellular water-use parameters, salt transfer parameters, and cellular endogenous convertible energy in R. stylosa, K. candel, and A. corniculatum at each treatment.
Plant SpeciesLeaf Intracellular Water-Use ParametersSalt Transfer ParametersCellular Endogenous Convertible Energy
LIWHCLIWUELIWHTLISACLISPCLIUSFLISTRLISTCLISAC/
LIUSF
LISPC/
LIUSF
ΔGRΔGZΔGXCΔGXL
R. stylosalowlowhighmiddlemiddlemiddlemiddlemiddlelowhighlowlowlowlow
K. candelhighlowlowlowlowlowhighhighhighlowhighhighhighhigh
A. corniculatumlowhighhighhighhighhighlowlowlowhighlowlowlowlow
Disclaimer/Publisher’s Note: The statements, opinions and data contained in all publications are solely those of the individual author(s) and contributor(s) and not of MDPI and/or the editor(s). MDPI and/or the editor(s) disclaim responsibility for any injury to people or property resulting from any ideas, methods, instructions or products referred to in the content.

