Article

Influence of Supplementary Blue and Far-Red Light on the Morphology and Texture of Ocimum basilicum L. Grown in Controlled Environments

1
USDA-ARS Food Quality Laboratory, Beltsville, MD 20705, USA
2
USDA-ARS Environmental Microbiology and Food Safety Laboratory, Beltsville, MD 20705, USA
3
Department of Nutrition and Food Science, University of Maryland, College Park, MD 20742, USA
*
Author to whom correspondence should be addressed.
Horticulturae 2025, 11(3), 287; https://doi.org/10.3390/horticulturae11030287
Submission received: 27 January 2025 / Revised: 28 February 2025 / Accepted: 3 March 2025 / Published: 6 March 2025
(This article belongs to the Section Protected Culture)

Abstract

:
Basil (Ocimum basilicum L.) is highly sensitive to environmental conditions and is an ideal candidate for cultivation in controlled environment agriculture (CEA). Light-emitting diode technology has become essential in CEA, offering precise control over light intensity, spectrum, and duration. This study investigated how supplemental blue light, far-red light, or their combination influences basil biomass, morphology, texture, and color when added to a white + red light spectrum. Basil ’Prospera’ and ’Amethyst’ were exposed to five light treatments for 14–28 days: white + red at 180 µmol∙m−2∙s−1 (W) as the control, and four treatments with an additional 60 µmol∙m−2∙s−1 of either white + red (+W60), blue (+B60), far-red (+FR60), or a combination of B and FR (+B30+FR30), for a total photon flux density of 240 µmol∙m−2∙s−1. The results demonstrated that +B60 and +W60 light treatments increased leaf thickness by 17–20% compared to the +FR60 treatment. Conversely, texture analysis revealed that +FR60-treated leaves had higher puncture resistance, with ’Amethyst’ and ’Prospera’ requiring 1.57 ± 0.43 N and 1.45 ± 0.35 N of force, respectively, compared to 1.19 ± 0.32 N and 1.1 ± 0.21 N under +B60. These findings suggest that tailored light recipes in CEA can optimize basil quality, allowing growers to modify traits like leaf color, thickness, and toughness.

1. Introduction

Basil (Ocimum basilicum L.) is a widely consumed herb known for its distinct aroma and flavor profile and is a staple ingredient in culinary dishes across the globe [1]. It is commonly enjoyed both fresh and dried and has become one of the most popular herbs in North America [2]. Additionally, basil contains various health-promoting compounds that aid in stress relief and improve skin health [3]. Basil also possesses antimicrobial properties due to the essential oils that have been found to have anti-pathogenic effects [4]. In addition to essential oils, basil is rich in tannins, phenols, flavonoids, and anthocyanins, all of which contribute to the plant’s health benefits and culinary popularity [2,5]. Basil is traditionally grown outdoors or in greenhouses. Sipos et al. [6] noted that basil cultivated in controlled-environment agriculture (CEA) systems are capable of developing richer flavors compared to those grown in traditional open-field settings, although, due to lower light levels indoors, certain supplemental wavebands of light may need to be added to further enhance essential oil content [5]. Finally, its high economic value and suitability for fresh or processed consumption make it a great option for cultivation in fully controlled environments [7].
A defining feature of CEA is the ability to control environmental parameters critical for crop production, including light, temperature, and CO2 concentrations. Furthermore, CEA enables year-round and local production of crops such as basil [8]. Basil also prefers constant warm temperatures (25–30 °C) with direct sunlight and high daily light integrals, all of which can be precisely managed in CEA [6,9]. CEA allows growers to precisely adjust the photoperiod, photon flux density (PFD), and light spectrum, thereby regulating plant growth, morphology, and phytochemical synthesis [10,11]. Compared to traditional horticultural light fixtures, such as high-pressure sodium or fluorescent lamps, light-emitting diode (LED) fixtures offer several advantages, including lower power consumption and heat output, increased durability and reliability, and precise control of the light spectrum, PFD, and photoperiod [11,12,13,14,15]. Furthermore, LEDs provide researchers with the ability to conduct precisely controlled lighting studies to determine the optimal light environment for various crops suited for indoor production [16].
Plant photoreceptors regulate various morphological and biochemical responses triggered by different wavebands of light. Cryptochrome photoreceptors detect and respond to blue (B; 400–499 nm) and ultraviolet (UV) light while phytochromes are the primary photoreceptors for red (600–699 nm) and far-red (FR; 700–799 nm) light [17,18,19,20]. Such waveband-dependent responses are leveraged in CEA to alter plant morphology and nutrient content [10,21,22,23]. For instance, plants exposed to a higher PFD of B light exhibit shorter stems, thicker leaves, and darker coloration compared to those grown under a lower PFD of B light [24,25]. Conversely, FR light tends to increase stem length and promote leaf expansion but may diminish leaf coloration [16]. Additionally, FR light enhances photosynthesis both indirectly, by increasing leaf area for light capture, and directly, through the Emerson Enhancement Effect [26].
Previous research has described the effects of supplemental narrow-band light on greenhouse-grown basil [1,27,28,29,30]. For example, Jeong et al. [28] investigated the interactive effects of supplemental FR light and temperature on the morphological and growth parameters of greenhouse-grown basil. Carvalho et al. [1] reported the effects of supplemental light on the growth, metabolism, and volatile compounds of greenhouse and CEA-grown sweet basil. Larsen et al. [29] discussed the effect of the PFD on basil grown in greenhouses and vertical farms. Fewer studies have reported the effects of B and FR light on basil grown in fully controlled environments [29,31,32]. Many studies focus on the effects of individual waveband treatments on basil. However, since growers commonly use multi-spectrum lighting for plants, research on the combined effects of multiple wavebands, such as B and FR light, is particularly valuable. Further research could help researchers and growers gain a deeper understanding of how B and FR light interact with basil, and how each waveband can be utilized to enhance basil growth and optimize its quality attributes.
Additionally, while CEA-grown basil is traditionally cultivated in greenhouses using soil or soil-like substrates, it can also be successfully grown in hydroponic systems [6]. Hydroponics are beneficial to CEA because they are more space and water-efficient compared to traditional methods of cultivation [33]. However, limited research is available on the impact of different LED spectra on the leaf texture of hydroponically grown basil. Yue et al. [34] analyzed consumer preferences for aquaponically grown basil in a greenhouse versus a warehouse and found that consumers preferred aquaponically grown basil over basil cultivated in a soilless potting medium. Walters et al. [9] found that consumers preferred the color and texture of basil grown hydroponically under higher PFD of light. Although research exists on consumer preferences for hydroponically grown basil, further studies are needed to better understand how different light treatments, particularly B and FR light, influence basil’s texture and color. These insights could provide valuable information for the CEA industry, ultimately benefiting basil consumers. We selected two cultivars for this study ‘Amethyst’ from the purple-leaf variety and ‘Prospera’ from the green-leaf variety—due to their commercial relevance and to investigate whether green and purple basil varieties respond differently to variations in the light spectrum.
The objectives of this study were to (1) determine the interactive effects of supplemental B and FR light on the biomass accumulation, morphology, texture, and coloration of hydroponically grown basil; and (2) investigate whether the response to +B60 and +FR60 treatments is dependent on basil cultivars, e.g., green- versus purple-leaf basil. We predicted that supplemental B light would lead to a reduction in stem length and leaf expansion and a decrease in overall biomass but also increase leaf thickness and enhance leaf coloration of basil. Additionally, we anticipated that FR light, in contrast to B light, would promote increased stem elongation and biomass accumulation while concurrently leading to the development of thinner leaves. We hypothesized that a combined treatment of B and FR light would produce basil with desirable traits, such as larger, thicker leaves, higher yields, and darker colors, due to the synergistic effect of the two wavebands.

2. Materials and Methods

2.1. Plant Cultivation

We conducted experiments at the USDA-ARS Beltsville Agriculture Research Center, MD location in walk-in temperature-controlled Environmental Growth Chambers (Model GR-48; Chagrin Falls, OH, USA). We sowed Genovese green-leaf ‘Prospera’® Compact DMR (PL4) F1 Pelleted basil seeds and Genovese purple-leaf ‘Amethyst’ Basil Improved seeds (Johnny Seeds; Winslow, ME, USA) into hydrated, 200-cell Rockwool sheets (Grodan; Roermond, The Netherlands). We added one seed to each 2.5 × 2.5 cm cell and misted rockwool sheets with water. We covered the seeds and let them germinate in the dark for 24 h in a temperature-controlled growth chamber at 28 °C. One day after seed sowing, we exposed basil plants to a total photon flux density (TPFD; 300–800 nm) of 180 µmol∙m−2∙s−1 of white (5000 K) + red (peak = 665 nm) (Table 1) at a photoperiod of 20 h. We covered the plants with a humidity dome, which was removed on day 7. On day 14, we transplanted basil seedlings into deep water culture (DWC) hydroponic systems and exposed them to their respective light treatments (Table 1). Each DWC system contained a 56 × 113 cm flood bath (Active Aqua; Shoemakersville, PA, USA) connected to a 115 L reservoir (Active Aqua; Petaluma, CA, USA) with recirculating nutrients. There were 5 DWC systems in total (one for each light treatment). In each bath, we placed a 2.5 cm polystyrene foam raft (Uline; Pleasant Prairie, WI, USA) consisting of 82 holes that were drilled with spaces 7.6 cm apart from the center of each hole. We fit each hole on a raft with a 2.5 cm net cup (Lapond). We circulated nutrients throughout each DWC containing 15-5-20 N-P-K (Jack’s nutrients; Allentown, PA, USA) at a concentration of 0.66 g/L (150 ppm N) of water plus Pennington Epsom salt (9.8% magnesium, 12.9% combined sulfur) (Pennington; Madison, GA, USA) at 0.26 g/L of water. An HI9814 waterproof portable pH/EC/TDS meter (Groline; Smithfield, RI, USA) was used to record the pH and electrical conductivity (EC) of the nutrient solution. The target pH (5.8–6.2) and EC (1.5 dS∙m−1) were maintained by replenishing the nutrients one week after transplant. We placed mylar (Ontario, CA, USA) covered panels between light treatments to negate light pollution between treatments and improve light uniformity within treatments. We placed a HOBO 4-channel analog data logger (HOBO; Bourne, MA, USA) in the chamber to monitor temperature and relative humidity. Average values for temperatures and relative humidity for the first replication were 28 ± 0.86 °C and 30 ± 3.1%. For the second replication, the temperature was 28 ± 1.3 °C and the relative humidity was 24 ± 7.5%.

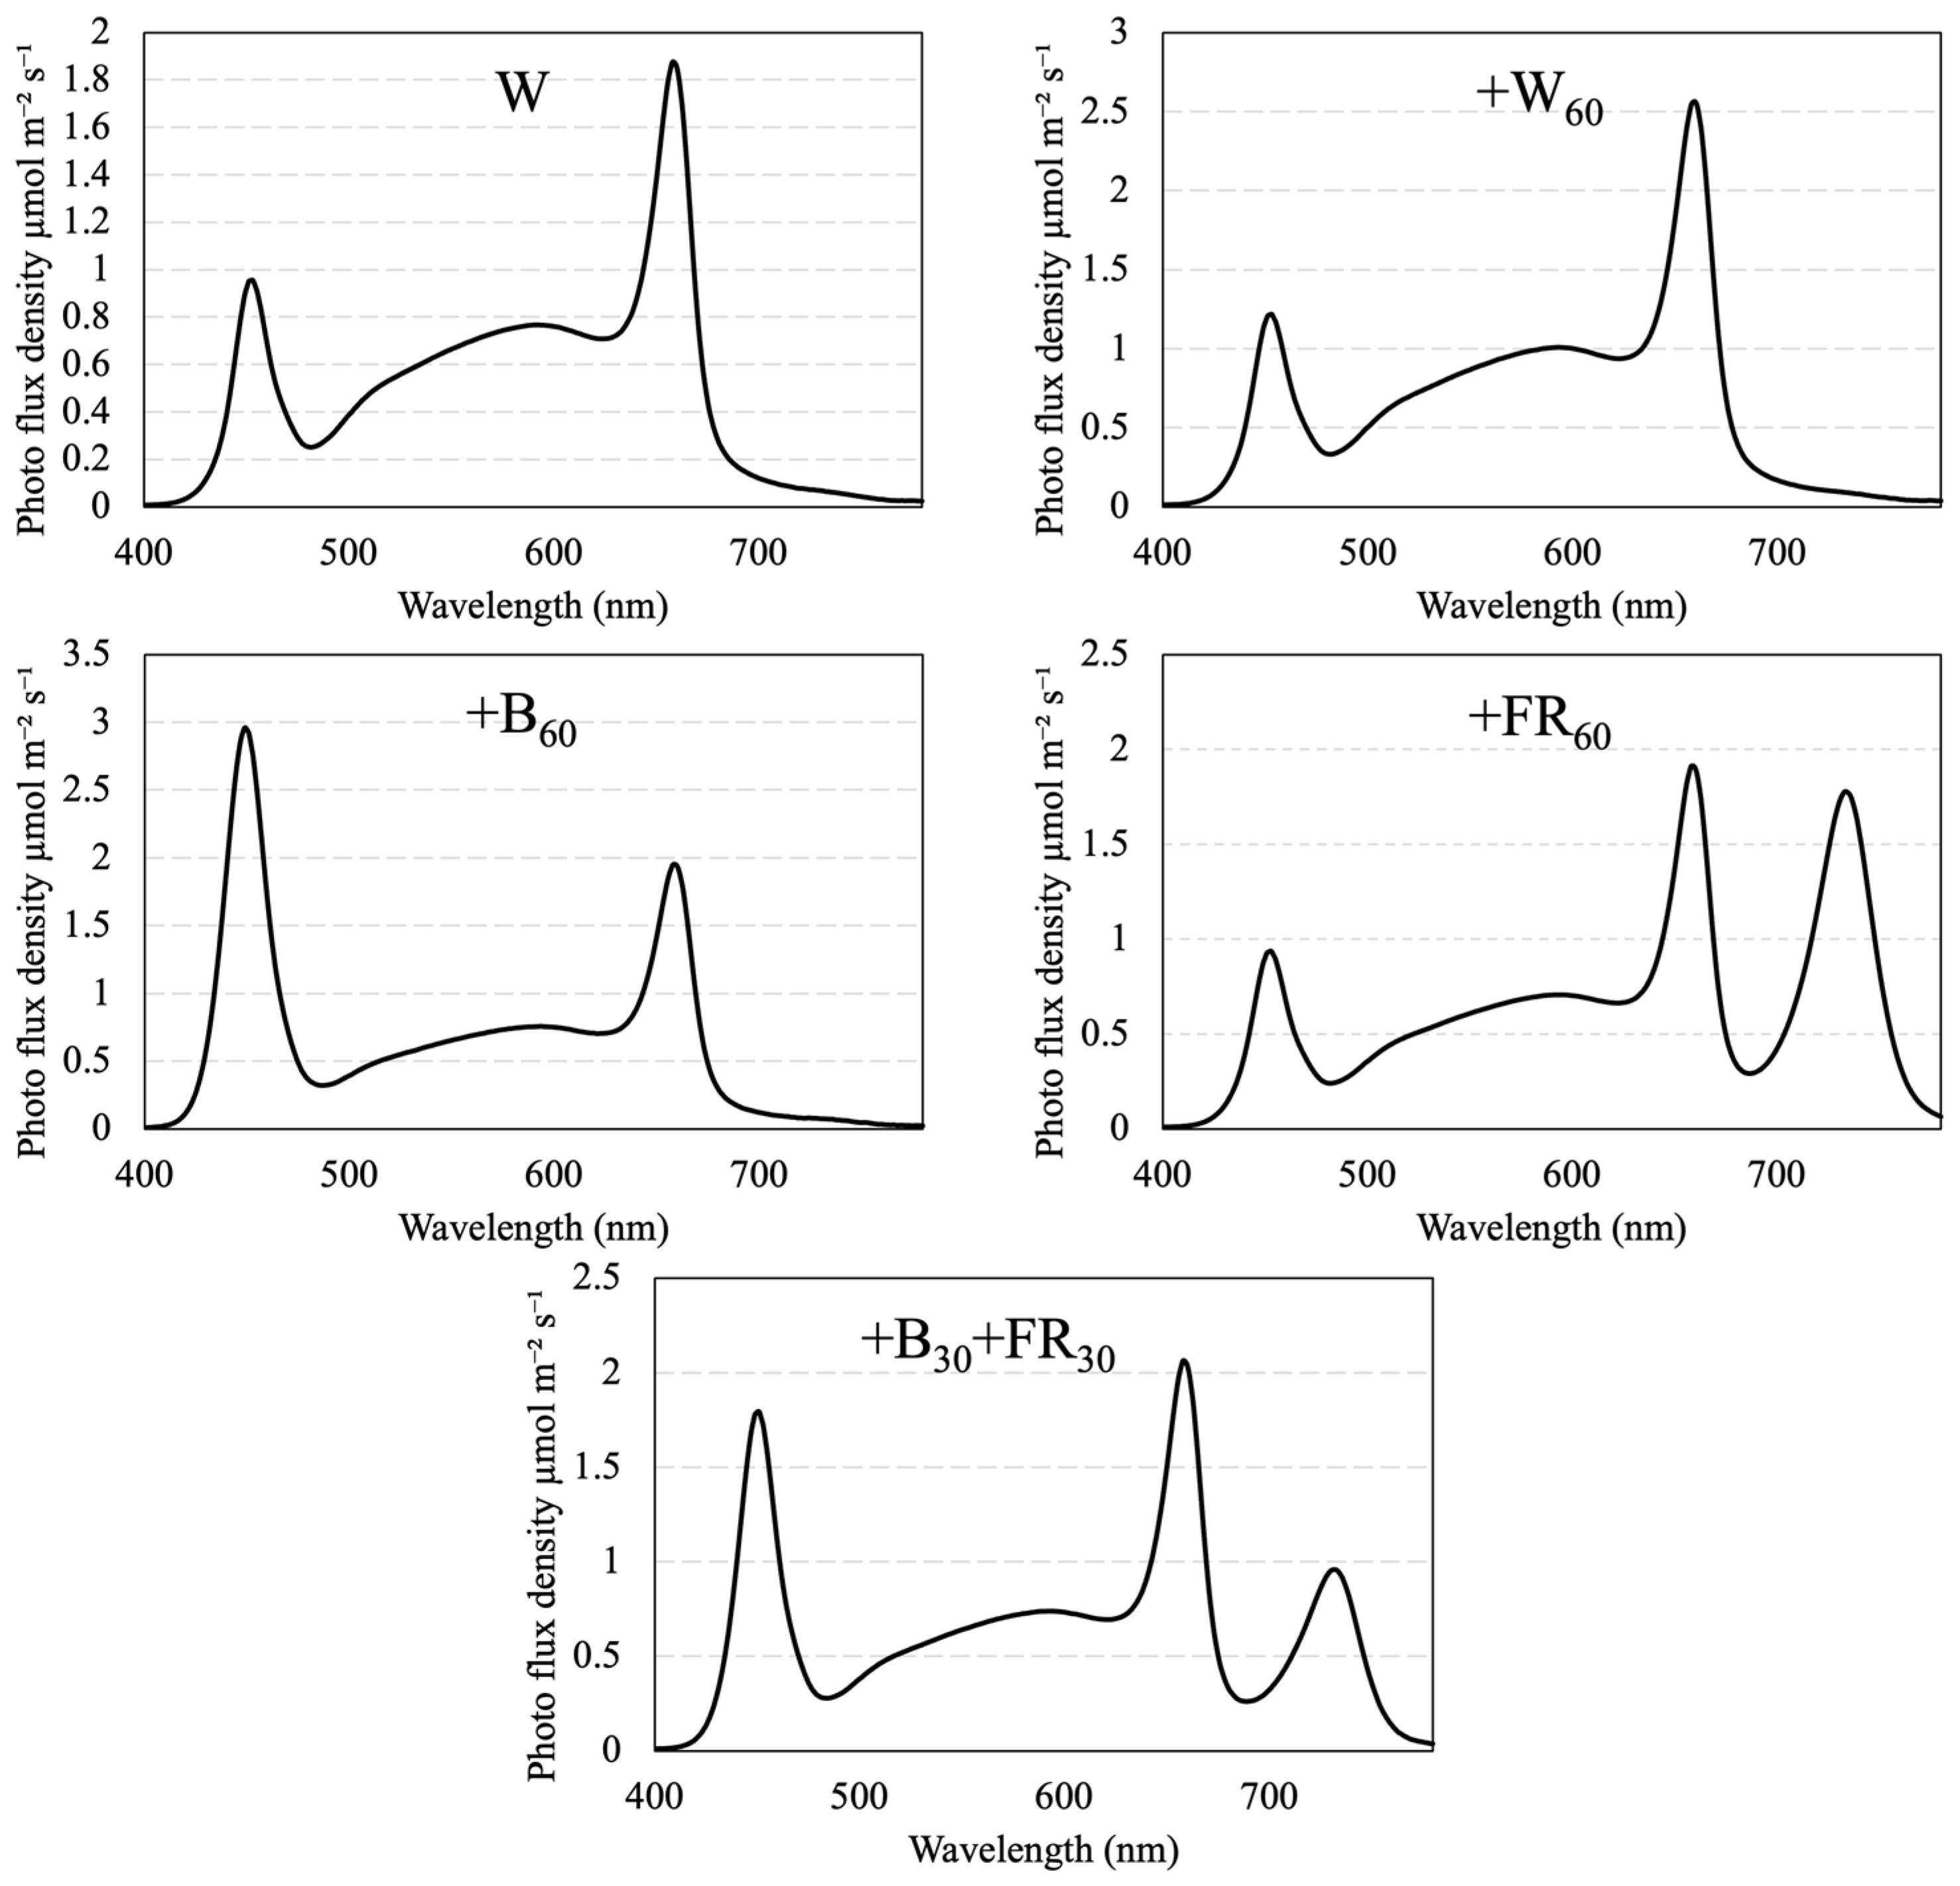
2.2. Light Treatments

We hung three Alina touch lights (RAYN; Middleton, WI, USA) over each DWC at 25 cm intervals and 50 cm above the top of the growth surface. We grew seedlings under a TPFD of 180 µmol∙m−2∙s−1 of white (5000 K) + red (peak = 665 nm) (Table 1) broadband light spectrum (W) and a photoperiod of 20 h from days 1 through 14. On day 14 after transplant, the plants were exposed to their respective light treatments delivered for a 20 h photoperiod. A 20 h photoperiod was chosen because longer photoperiods have been shown to improve plant growth and basil can tolerate up to 24 h photoperiods [27,35]. Those treatments included a negative control spectrum of low white (W) and a second positive control spectrum of high white supplemented with 60 µmol∙m−2∙s−1 of white + red (3:1) (+W60). The three other treatments consisted of the W baseline treatment with an additional 60 µmol∙m−2∙s−1 of B (peak = 451 nm) (+B60), FR (peak = 735 nm) (+FR60), or 30 µmol∙m−2∙s−1 of B + 30 µmol∙m−2∙s−1 of FR (+B30+FR30) (Table 1, Figure 1). To create the light treatments, we measured and averaged the TPFD and spectrum at nine representative spots in the plant canopy using a LI-COR-180 portable spectroradiometer (LI-COR; Tucson, AZ, USA).

2.3. Determination of Biometric Indicators

For growth and morphology measurements, we randomly selected ten plants per cultivar per light treatment and disassembled them. We took images of the plants following similar protocols to Bornhorst et al. [36]. Briefly, we arranged plant pieces face-up on a white sheet of paper and placed them in a portable foldable photo studio (Amazon Basic; Seattle, WA, USA). We took a top-view image for each plant at a shooting distance of 61 cm with a Nikon D850 with a 60 mm lens. The following camera settings were used: aperture f/13, shutter speed 1/125, ISO1250, EXP 0, no flash, and white balance 5910 K. Images were calibrated against a photograph of the X-rite color checker ruler using Image Pro® Premier E 9.2 (Media Cybernetics; Rockville, MD, USA) and segmented into purple leaf (for Amythest only), green leaf, and stem areas using the “smart segment” tool. Each leaf area was analyzed for its area (mm2) and area-weighted L* (lightness), a* (red/green), b* (yellow/blue), hue angle, and chroma values [37]. We measured the stem lengths with the line tool by recording the shortest distance from the bottom where the plant was cut to the top where the stem and petiole meet. We measured stem width at the point between the bottom set of leaves and the next highest notch of leaves. We counted leaves greater than 1 cm in length directly from the images.
After the plants were photographed, we added the entire plant above the rockwool to pre-weighed bags and weighed for fresh mass. We froze plants in a Sanyo −80 °C freezer (Los Angelos, CA, USA), freeze-dried them for 4 days, and then measured the dry mass.

2.4. Chlorophyll Fluorescence Measurements

All data collection and measurements were performed on day 28. For chlorophyll fluorescence and stomatal conductance determination, we randomly selected five plants per cultivar per light treatment and performed the measurements using an LI-600 porometer/fluorometer (LI-COR, Lincoln, NE, USA) with 0.75 cm2 aperture at a 150 μmol∙s−1 flow rate. For each set of measurements, we used the top two fully expanded leaves from each plant (n = 10). Toward the end of the 4 h darkness period, we captured dark-adapted fluorescence and stomatal conductance measurements (4 h of darkness). After 1 h of light exposure, we took light-adapted measurements on the same plants and leaves. Chlorophyll fluorescence measurements provide non-destructive assessments of photosynthetic activity and are reliable indicators of plant stress [38]. We took light-adapted measurements to evaluate the real-time photosynthetic performance of basil plants grown under different light treatments. We conducted dark-adapted measurements to assess the impact of light treatments on overall plant health and the potential efficiency of the photosynthetic apparatus in the absence of light.

2.5. Leaf Texture and Surface Density Analysis

We conducted texture analysis puncture tests using a Stable Micro Systems Texture analyzer (Godalming, Surrey, UK). We randomly chose ten plants from each cultivar and treatment. The top four leaves from each plant were used in the analysis. Of the four leaves, the top two were used once and the larger two leaves were sectioned in half allowing for two measurements. Such procedures led to six measurements per plant, or a total of 60 measurements per cultivar per light treatment. We placed a leaf into a pre-designed attachment that secured the leaf between two pieces of clear polyvinyl chloride (PVC), similar to previous studies. Other studies used a similar setup to secure their leaves for a puncture test [39,40]. There was a 6 mm diameter opening on the clear PVC attachment. We used a 3 mm cylindrical stainless-steel probe to puncture the opening of the attachment through the leaf at a speed of 1.0 mm s−1 to deformation of 8 mm. Punctures were made on the leaf portion away from the main stem. We collected the forces to puncture each leaf for each replicate.
We conducted surface density and leaf thickness measurements using three plants per cultivar per light treatment. The top four leaves were chosen from each plant. We removed tissue from the flat areas away from stems with a 12 mm cork borer (Fisher scientific, Waltham, MA, USA). A total of 16 tissue samples were collected from the four leaves, weighed, and placed into 50 mL plastic tubes. We froze the samples at −80 °C and dried them in a freeze dryer at −50 °C. After 3 d of freeze drying, we removed the samples and collected and recorded the dry mass. To calculate leaf thickness, leaves were considered laminar. We estimated leaf thickness through calculations following procedures used by Vile et al. [41]. We used the following equation:
L T = 1 ρ F × 1 S L A × L D M C
where
LT = leaf thickness.
ρ F = leaf fresh mass/volume.
SLA = specific leaf area.
LDMC = leaf dry matter content.
It was assumed that ρ F = 1. SLA is the ratio of leaf surface area to dry mass. The LDMC was determined by measuring the fresh and dry mass of each sample.

2.6. Experimental Design and Data Analysis

We arranged this experiment as a randomized complete block design containing two replications in time. We used R statistical analysis software version 4.4.1 (R Core Team, 2014) for statistical analysis and the creation of figures. To determine treatment effects, we conducted an analysis of variance and Tukey’s honestly significant difference test (α = 0.05) using R packages ‘dplyr’ [42] and ‘agricolae’ [43].

3. Results

3.1. Biomass Accumulation and Plant Morphology

‘Amethyst’ basil grown under +FR60 and +B30+FR30 light treatments had 87% and 78% higher fresh mass, respectively, than those grown under W (Table 2). Additionally, ‘Amethyst’ basil grown under the +W60 and +B60 treatments had 42% and 29% higher fresh mass, respectively, than those grown under the W treatment. For ‘Prospera’ basil, treatments +FR60, +B30+FR30, and +W60 increased the fresh mass by 56%, 57%, and 49%, respectively, while treatment +B60 led to a 24% increase in fresh mass compared to the W control. The dry mass for each cultivar had similar differences as the fresh mass. For ‘Amethyst’ basil, the +B30+FR30 and +FR60 treatments were 34% and 32% greater than the +B60 treatment. For ‘Prospera’ basil, the +B30+FR30, +FR60, and +W60 treatments were 30%, 36%, and 20% greater than the +B60 light treatment.
Basil leaf numbers varied for both cultivars and among light treatments, as shown in Table 2. Adding +FR60 light to the spectrum increased the leaf number of ‘Amethyst’ and ‘Prospera’ basil by 84% and 47%, respectively, compared to the W treatment. Additionally, the ‘Amethyst’ basil leaf number increased by 32% and 18% for the +FR60 and +W60 treatments compared to the +B60 treatment. For ‘Prospera’ basil, the +W60, +FR60, and +B30+FR30 light treatments produced 14%, 19%, and 15% more leaves, respectively, compared to the +B60 treatment, the latter of which led to a similar leaf number as did the W treatment.
Supplemental +FR60 light increased the stem length of ‘Amethyst’ and ‘Prospera’ basil by 117% and 69%, respectively, compared to the W control. In comparison, treatments +W60 and +B30+FR30 led to a lesser increase in stem length ranging from 3% to 79% (Table 2). On the other hand, additional +B60 light did not significantly (p > 0.05) change the stem length for either cultivar. For stem width, the widest stems were observed in ‘Prospera’ basil under the +B30+FR30 treatment, while ‘Amethyst’ basil exhibited the widest stems under both the +FR30 and +B30+FR30 treatments (Table 2).

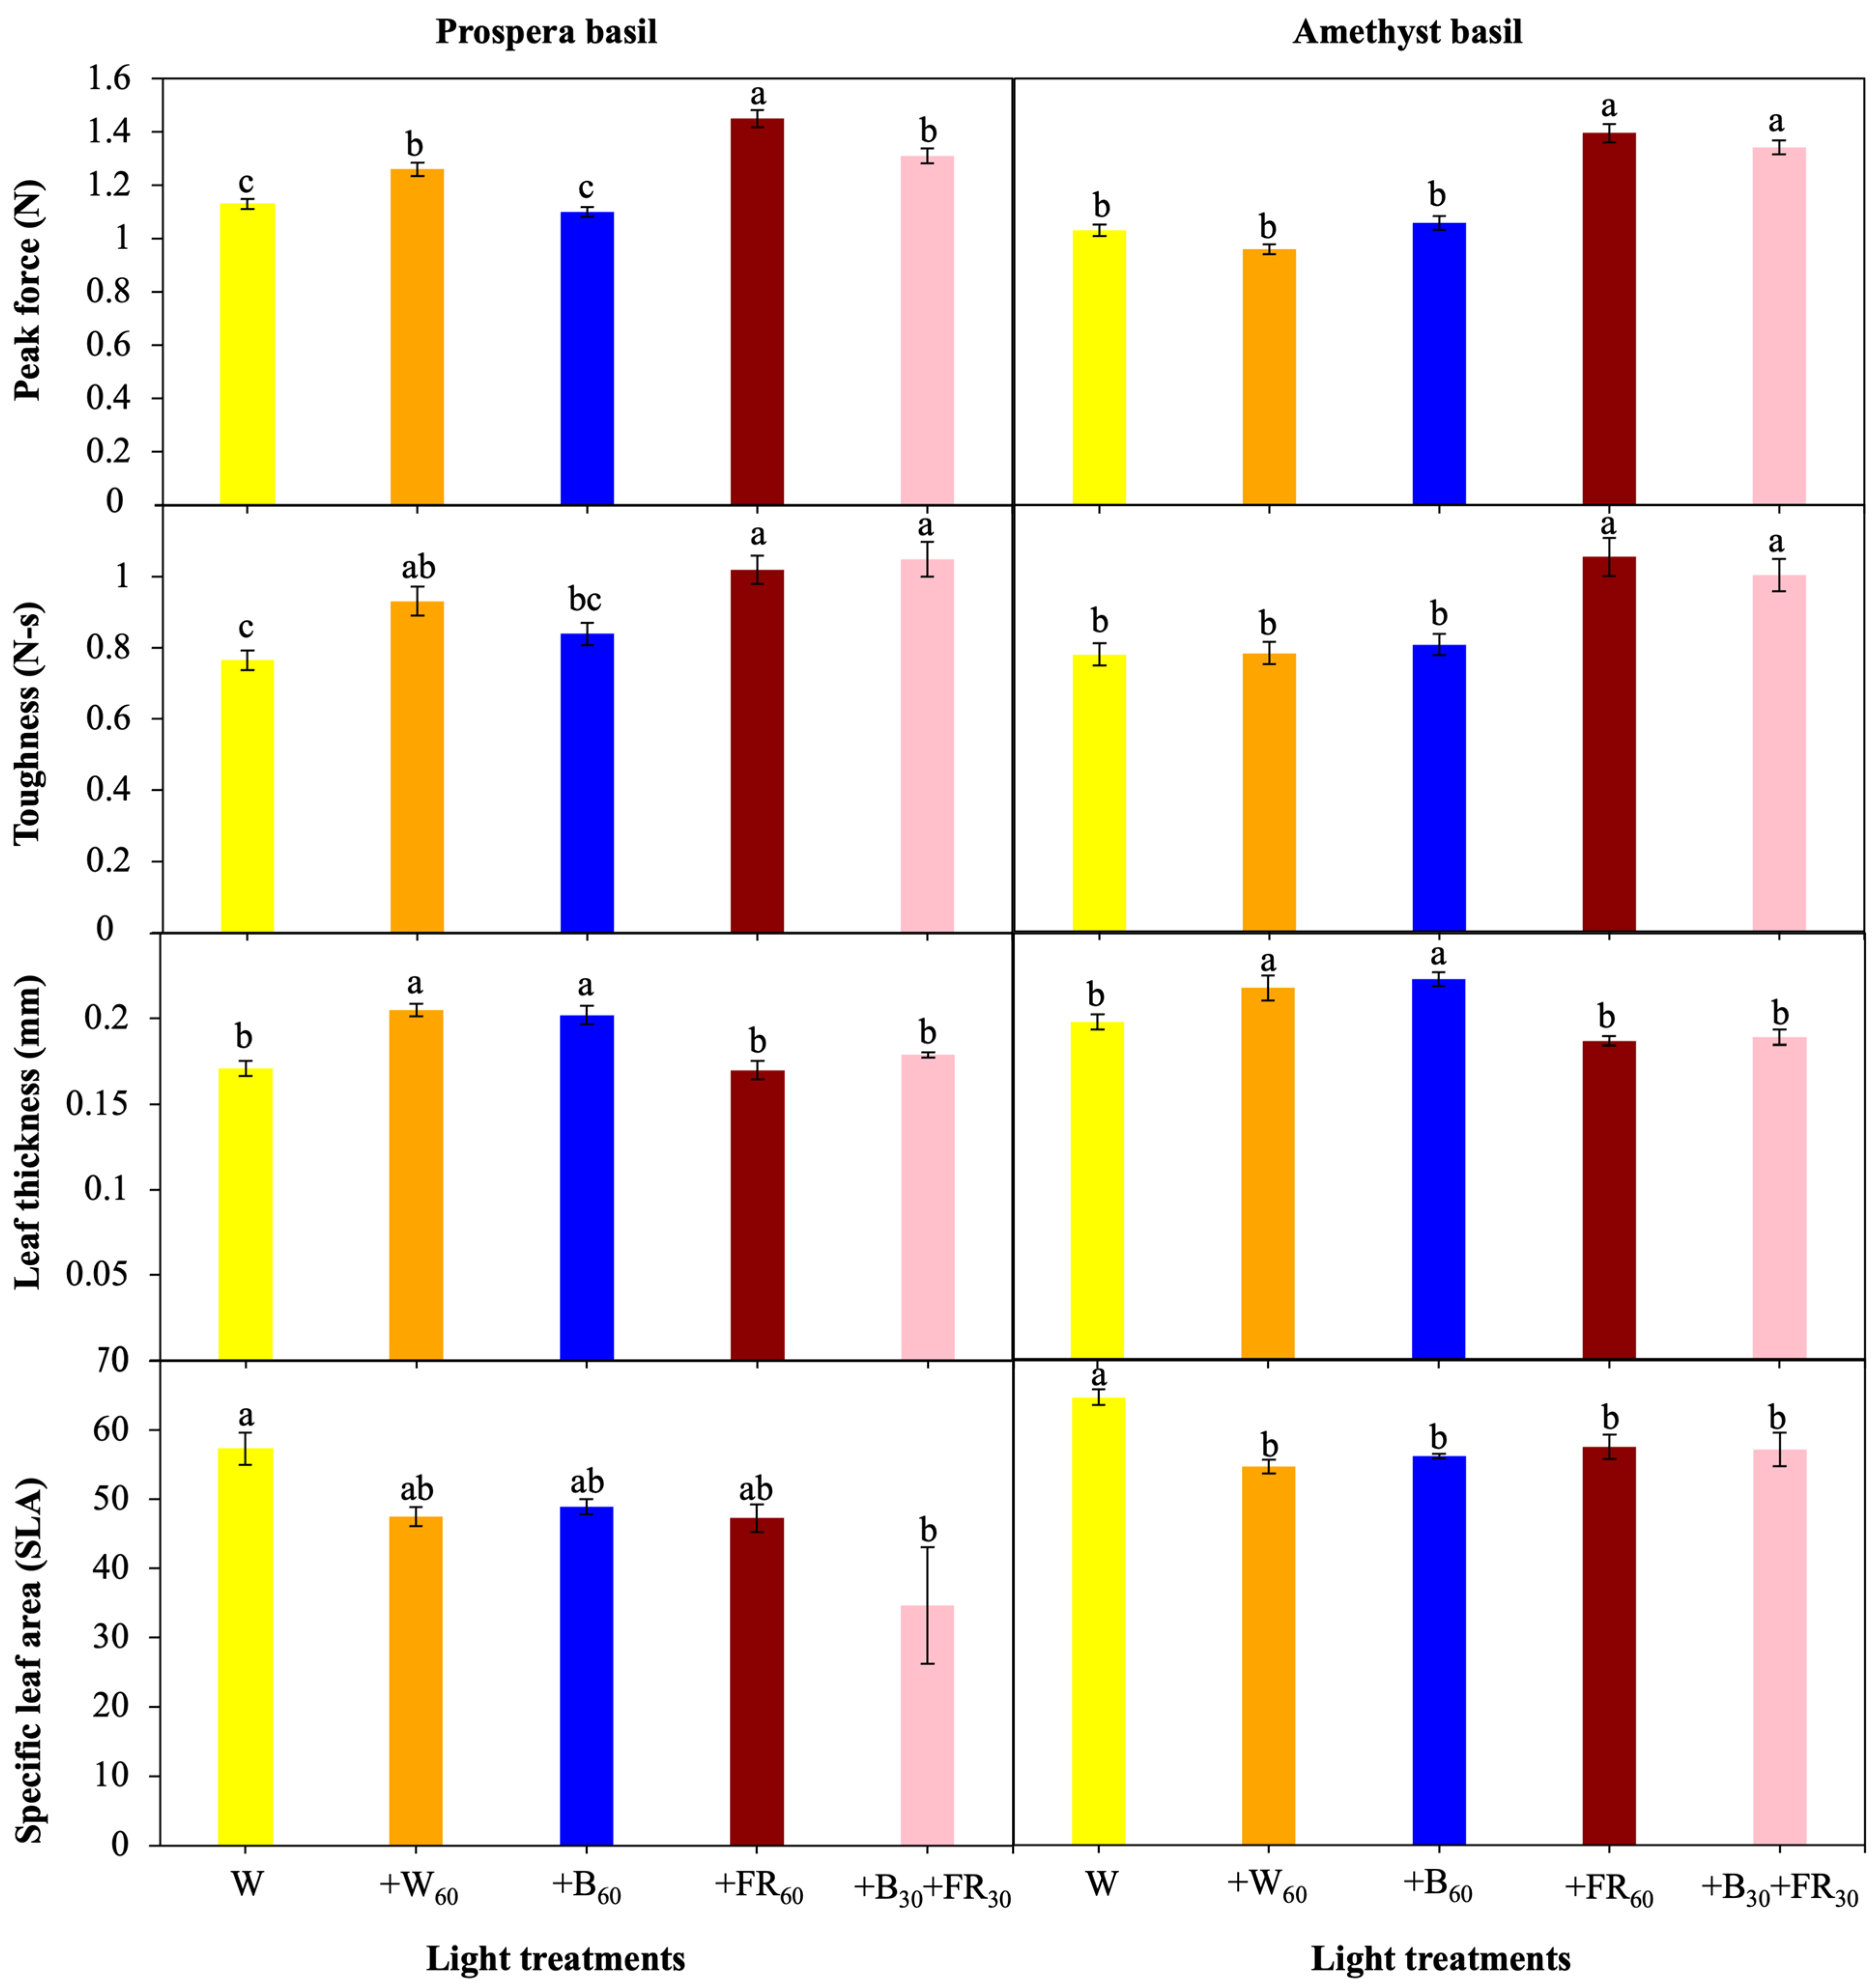
3.2. Leaf Texture and Thickness

The textures of basil leaves were characterized in two metrics, i.e., peak puncture force and area under curve (AUC), both of which were derived from the force-displacement chart. Peak force is the maximum force required to puncture through a leaf, while AUC is the total force required to puncture the leaf. As seen in Figure 2, ‘Amethyst’ basil grown under +FR60 and +B30+FR30 treatments required the most force to puncture through the leaves (1.57 ± 0.43 N and 1.51 ± 0.33 N), followed by those grown under +FR60, W, and +W60 treatments (1.19 ± 0.32 N, 1.16 ± 0.27 N, and 1.08 ± 0.23 N). Similarly, ‘Prospera’ basil grown under additional +FR60 light required the most force (1.45 ± 0.35 N) to puncture through the leaves, followed by those grown under +B30+FR30 (1.31 ± 0.3 N) and +W60 treatments (1.26 ± 0.27 N). The abovementioned peak force values were significantly (p < 0.05) greater than those for W (1.13 ± 0.19 N) and +B60 treatments (1.10 ± 0.21 N).
The results of AUC were generally in line with those of the peak puncture force measurement. The area under the force–displacement curve is a metric to indicate the toughness of leaves. For ‘Amethyst’ basil, the +FR60 and +B30+FR30 treatments produced tougher leaves (1.23 ± 0.06 N·s and 1.17 ± 0.05 N·s) than the +B60, W, and +W60 treatments (0.94 ± 0.03 N·s, 0.91 ± 0.04 N·s, and 0.91 ± 0.04 N·s). Likewise, ‘Prospera’ basil grown under the +FR60 and +B30+FR30 treatments was tougher (1.02 ± 0.04 N·s and 1.05 ± 0.05 N·s) than the +B30 and W treatments (Figure 2).
For the ‘Prospera’ basil, the +B60 and +W60 treatments produced leaves that were thicker (0.20 ± 0.01 mm and 0.21 ± 0.01 mm) than the W, +FR30, and +B30+FR30 treatments (0.17 ± 0.01 mm, 0.17 ± 0.01 mm, and 0.18 ± 0.01 mm) (Figure 2). Likewise, the ‘Amethyst’ basil grown under +B60 and +W60 had thicker leaves (0.22 ± 0.01 mm and 0.22 ± 0.01 mm) than the W, +FR30, and +B30+FR30 treatments (0.19 ± 0.01 mm, 0.19 ± 0.01 mm, and 0.19 ± 0.01 mm) (Figure 2). For ‘Amethyst’ basil, the leaves under the +B60 and +W60 treatments were 13% and 10% thicker than the leaves under the W treatment. In contrast, +FR60 and +B30+FR30 treatments reduced leaf thickness by 5% compared to the control. For ‘Prospera’ basil, the leaves under +B60 and +W60 treatments were about 18% and 20% thicker than the leaves under W, +FR60, and +B60+FR60 light treatments.

3.3. Chlorophyll Fluorescence and Leaf Coloration

PhiPSII, the effective quantum yield of photosystem II, indicates that plants efficiently utilize absorbed light for photosynthesis. Fv/Fm, a dark-adapted measurement, represents the maximum efficiency of photochemistry in photosystem II. These metrics are valuable for understanding how light treatments affect the photosynthetic efficiency of plants. Light- and dark-adapted chlorophyll fluorescence measurements were conducted to estimate the effects of supplemental light treatments on basil photosynthetic parameters (Table 3). When any supplemental light treatment was added, thereby increasing the PFD, the electron transport rate (ETR) of ‘Prospera’ basil increased by up to 89% compared to the control. A similar trend was found for ‘Amethyst’ basil, except that additional +FR60 light did not increase ETR compared to the control (W). Adding +FR60 light to the spectrum increased phiPSII by 39% compared to the control for ‘Prospera basil, while additional +FR60 and +B30+FR30 light increased phiPSII by approximately 14% for ‘Amethyst’ basil. Furthermore, adding +W60 or +B60 light to the spectrum did not increase phiPSII for either cultivar. Adding FR light to the spectrum increased Fv/Fm for both cultivars, with additional +B30+FR30 light increasing Fv/Fm for ‘Prospera’ basil, but not for ‘Amethyst’ basil. Finally, additional B light did not affect Fv/Fm for either cultivar.
Leaf color differences between the two basil cultivars were apparent across the various light treatments (Supplementary Figures S1 and S2), in line with the average L*a*b* values shown in Table 4 and Table 5. During the image analysis of ‘Amethyst’ basil, we segmented the leaves into green and purple sections and analyzed them to compare the different colors because some light treatments produced leaves with two distinct colors. ‘Amethyst’ basil exhibited the darkest purple color under +B60 and +W60 treatments, with the lowest L* values compared to +FR60. The +B30+FR30, +B60, and +W60 treatments resulted in the lowest hue values, indicating increased red pigmentation in the leaves compared to +FR60 and W treatments (Table 4). Furthermore, the green portion of ‘Amethyst’ basil leaves grown under the +FR60 treatment had the highest hue value, signifying more green coloration in the green part of the leaves compared to all other treatments. For ‘Prospera’ basil, plants grown under +B60, W, and +W60 light had darker leaves, indicated by lower L* values, compared to those grown under the +FR60 and +B30+FR30 treatments (Table 5). Additionally, ‘Prospera’ basil grown under the +FR30 and +B30+FR30 treatments produced leaves that were more intense in green color than the W, +W60, and +B60 treatments based on their hue and chroma values (Table 5).

4. Discussion

4.1. Basil Growth and Morphology

Basil grown under +B60 light exhibited significant changes in visual traits, including darker-colored leaves, shorter stems, and reduced fresh mass. These findings align with previous research by Carvalho et al. [1] who observed shorter stems of sweet basil exposed to +B60 light. Similarly, Lin et al. [31] reported that a higher ratio of +B60 light in LED treatments led to plants that were significantly smaller in size. In the current study, the stem lengths of both cultivars grown under +B60, W, and +W60 were consistent with the results of Aldarkazli et al. [12] where no significant differences in stem lengths of sweet and Bush basil were found between their white LED treatment and B + red LED treatment. However, ‘Amethyst’ and ‘Prospera’ basil grown under the +FR60 and +B30+FR30 treatments displayed significantly (p < 0.05) longer stems and greater fresh mass than those grown under +B60, W, and +W60. This supports the findings of Rahman et al. [32], who reported a significant increase in fresh mass for sweet basil grown under light treatments including B + FR light. While some studies utilized treatments with +B60 and +FR60 mixtures [1,28,32], their focus was not comparing the +B30+FR30 mixture directly to a +B60 or +FR60 treatment alone. The B and FR supplemental treatments from those studies incorporated lower percentages of B and FR light, more R light, and contained lower PFD than our treatments [1,32]. These reasons explain why their B light treatments were larger than their white control compared to this study.
Our study revealed that both basil cultivars grown under the +B30+FR30 treatment exhibited morphological attributes more closely aligned with those grown under the +FR60 treatment, rather than the +B60 treatment, indicating that stem elongation induced by +FR60 light outweighs +B60 light’s inhibition of shade-avoidance responses [44,45]. This effect occurs because FR light reduces the active form of phytochrome, triggering shade-avoidance responses including stem elongation, which override the compact growth-promoting effects of B light [46,47,48] (Supplementary Figures S1 and S2 and Table 2). Furthermore, the morphological and growth responses observed in the current study, such as the effects of B, FR, and their combined lighting treatments, could be influenced by the relatively low background white light levels used. At higher background light intensities, chloroplasts may already receive sufficient excitation energy, diminishing the impact of additional supplemental light. This suggests an interaction between the light spectrum and PFD, where the effects of supplemental lighting are more pronounced under low background light conditions [49,50].

4.2. Chlorophyll Fluorescence

Previous studies have shown that supplemental FR light can enhance the photosynthetic capabilities and efficiency of plants compared to those grown without FR light [26]. This enhancement is largely due to FR-light-induced photosystem excitation balance, where FR light preferentially excites photosystem I (PSI), helping to alleviate pressure on photosystem II (PSII) and optimize electron transport [26].
Our results align with these findings, as basil grown under additional FR light exhibited higher phiPSII and Fv/Fm values, suggesting that FR light increases the efficiency with which absorbed photons are utilized in photochemistry. This is particularly important in environments with low PFDs, where FR light can improve light capture and use, resulting in higher overall photosynthetic performance. The increase in ETR for ‘Prospera’ basil, but not ‘Amethyst’, under FR light, suggests cultivar-specific responses to FR light, potentially influenced by differences in pigment composition or leaf structure [46]. For example, ‘Prospera’ basil possesses a greater chlorophyll content due to its deep green leaves, allowing it to more effectively utilize additional light.

4.3. Basil Leaf Coloration

In this study, the leaves of both ‘Prospera’ and ‘Amethyst’ basil grown under supplemental +B60 light were darker compared to those grown under the +FR60 and +B30+FR30 treatments. Anthocyanins, which are partially responsible for the red and blue pigmentation in leaves [10], are typically increased by B light or high light intensity, leading to darker basil leaves. This increase in anthocyanin production under B light is primarily due to the activation of cryptochromes, which are responsive to B wavelengths [51,52]. B light triggers the expression of genes involved in anthocyanin biosynthesis, such as CHS (chalcone synthase) and DFR (dihydroflavonol 4-reductase), which leads to higher accumulation of these pigments [53]. Additionally, anthocyanins serve as protective compounds that help shield leaf tissue from excess light by absorbing UV and B light, reducing photo-oxidative damage. In environments with high light intensity, particularly in the UV or B spectrum, anthocyanin accumulation can act as a defense mechanism to mitigate the harmful effects of reactive oxygen species and protect chloroplasts from light-induced stress [54,55].
Our findings are consistent with a previous study [56] where lettuce grown under a light treatment substituted with B light increased pigmentation, but the opposite was observed when it was substituted with FR light. However, in our findings, +B60 was not significantly greater than both of our controls, suggesting that a higher percentage of supplemental blue light may be needed to achieve darker leaves. Furthermore, when B light was applied with red light, anthocyanin concentrations in green and purple basil increased compared to either waveband applied alone [24]. Interestingly, significant color differences were found between basil leaves grown under the W and +W60 treatments, likely because both the W and +W60 treatments include B light, possibly surpassing the threshold required for a B light response. Both cultivars grown under the +FR60 and +B30+FR30 treatments produced leaves significantly lighter in color, which is consistent with the results observed by Meng et al. [56].
Interestingly, “Amethyst’ basil leaves grown under +B30+FR30 and +FR30 treatments exhibited pronounced green coloration at the leaf edges, a finding similar to that of Liu and van Iersel [57] who observed reduced red pigmentation in lettuce leaves exposed to FR light. This uneven coloration may result from rapid leaf expansion induced by FR light, potentially outpacing anthocyanin biosynthesis and leading to less uniform pigmentation [58]. One may consider that the +B30+FR30 treatment increased anthocyanin content per leaf but not over the entire unit, further explaining the variation in leaf color.

4.4. Leaf Thickness and Texture

Leaf thickness varied across the light treatments, with basil grown under the +B60 and +W60 treatments having the thickest leaves for both cultivars. This aligns with findings from Zheng and Van Labeke [59], who reported that B light increased leaf thickness in some species by influencing mesophyll structure, leading to a more compact arrangement of chloroplasts in a “stacked” orientation. Similarly, Falcioni et al. [60] found that B and white light increased cell thickness in tomato seedlings compared to FR light and darkness Falcioni et al. [60]). In contrast, basil grown under the W, +FR60, and +BL30+FR30 treatments had the thinnest leaves, consistent with other studies indicating that FR light can reduce mesophyll cell layers and overall leaf thickness [25].
While the influence of light spectrum on leaf morphology is well documented, its effects on physical properties such as leaf toughness and breakage resistance are less understood. In this study, puncture tests revealed that basil grown under the +FR60 and +B30+FR30 light treatments required the greatest peak force to puncture, indicating higher toughness compared to the +B60 and +W60 treatments. Additionally, these leaves had the highest area under the force–displacement curve, supporting their increased resistance to mechanical damage. Interestingly, despite being thinner, leaves grown under +FR60 and +B30+FR30 treatments were tougher than those under +W60 and +B60 treatments, suggesting that factors beyond thickness contribute to leaf mechanical properties.
One potential mechanism behind these differences in leaf toughness is FR light’s ability to modify cell wall composition and epidermal structure. FR light promotes cell expansion by reducing the active form of phytochrome (Pfr), triggering shade-avoidance responses such as stem elongation and leaf expansion [44]. However, FR-induced leaf expansion may also lead to changes in cell wall biochemical properties, including decreased lignification and modifications in pectin and hemicellulose content, which can enhance mechanical resistance despite having more pliable tissue [60]. Previous studies suggest that FR light can induce secondary cell wall reinforcement, potentially explaining the increased puncture resistance we observed in +FR60 and +B30+FR30-treated leaves [47]. In contrast, B light, despite increasing leaf thickness, is known to enhance palisade mesophyll development and chloroplast density rather than reinforcing structural integrity [49,59]. This could explain why +B60-treated basil exhibited thicker yet less tough leaves. The combination of B and FR light in the +B30+FR30 treatment resulted in morphological responses that were more similar to the FR treatment, suggesting that FR light-driven cell wall modifications may have dominated over the compact growth-promoting effects of B light.
These findings suggest that leaf toughness in basil is influenced by light-induced changes in both physical properties and biochemical composition. The texture of fresh produce is important to consumers [61,62]. Few studies have investigated consumers’ preferences for basil texture. Therefore, future research should investigate consumer preferences for basil texture to help optimize light recipes in CEA to produce basil with desirable sensory attributes.

4.5. Future Studies

Leaf coloration, size, and texture are all sensory characteristics that shape a consumer’s perception of and willingness to buy specialty plants, including basil. While it remains unclear whether a thicker or darker basil leaf is more desirable, this research lays the groundwork for future investigations. Consumer panel evaluations are essential to determine which basil leaves are preferred. Given the significant differences in color, thickness, and texture observed across basil grown under various light treatments, future sensory studies would be invaluable because light recipes will provide insights for growers to create an optimized basil plant for consumers. Additionally, given the physiological changes induced by LED treatments, there may be postharvest differences worth exploring. This research could inform future studies on whether light spectra applied during preharvest can enhance basil’s shelf life.

5. Conclusions

This study demonstrates the significant impact of supplemental B and FR light on the growth, morphology, and sensory qualities of Ocimum basilicum L. cultivars ‘Prospera’ and ‘Amethyst’ grown in a controlled environment. We found that +B60 light increased leaf thickness and enhanced dark pigmentation, while +FR60 light led to greater biomass accumulation, improved leaf toughness, and lighter leaf coloration. The combined +B30+FR60 treatment produced results more similar to +FR60 alone, especially in terms of morphological traits such as stem elongation and leaf toughness.
These findings suggest that customized light recipes using B and FR light can be effectively used in CEA to tailor basil traits such as leaf color, thickness, and texture to meet specific market demands. Additionally, the differential effects of light treatments on basil cultivars highlight the need for cultivar-specific optimization of lighting strategies to maximize both yield and quality.
Future research should explore consumer preferences for the sensory traits affected by these light treatments and investigate whether preharvest light spectra influence postharvest quality attributes such as shelf-life. The integration of these findings with other environmental factors like temperature and CO2 enrichment may further enhance the efficiency and sustainability of basil production in CEA systems.

Supplementary Materials

The following supporting information can be downloaded at: https://www.mdpi.com/article/10.3390/horticulturae11030287/s1, Figure S1: Top-view image of disassembled Prospera basil; Figure S2: Top-view image of disassembled Amethyst basil.

Author Contributions

Conceptualization, M.A.O. and N.K.; methodology, M.A.O., N.K., E.E., G.G., E.P., and Y.L.; software, N.K., M.A.O., and E.E.; validation, J.M.F., N.K., and Y.L.; formal analysis, M.A.O., N.K., E.E., and E.P.; investigation, M.A.O., N.K., E.E., E.P., G.G., Z.T., and Y.L.; data curation, M.A.O. and N.K.; writing—original draft preparation, M.A.O.; writing—review and editing, N.K., E.E., E.P., G.G., Z.T., Y.L., and J.M.F.; supervision, Y.L. and J.M.F.; project administration, Y.L. and J.M.F.; funding acquisition, Y.L. All authors have read and agreed to the published version of the manuscript.

Funding

This research was supported in part by the U.S. Department of Agriculture (USDA), National Institute of Food and Agriculture, Specialty Crop Research Initiative, Award No. 2016-51181-25403. This research was also supported in part by an appointment to the Agricultural Research Service (ARS) Research Participation Program administered by the Oak Ridge Institute for Science and Education (ORISE) through an interagency agreement between the U.S. Department of Energy (DOE) and the USDA. ORISE is managed by ORAU under DOE contract number DE-SC0014664. The authors also wish to thank Ellen Turner for technical support and proofreading of the manuscript. All opinions expressed in this paper are those of the authors and do not necessarily reflect the policies and views of USDA, ARS, DOE, or ORAU/ORISE. The use of a company name or product by the authors does not imply approval or recommendation of the product to the exclusion of others that also may be suitable.

Data Availability Statement

The original contributions presented in the study are included in the article/Supplementary Materials, further inquiries can be directed to the corresponding author.

Acknowledgments

We would also like to thank Ellen Turner for her critical review of the manuscript.

Conflicts of Interest

The authors declare no conflicts of interest.

References

  1. Carvalho, S.D.; Schwieterman, M.L.; Abrahan, C.E.; Colquhoun, T.A.; Folta, K.M. Light quality dependent changes in morphology, antioxidant capacity, and volatile production in sweet basil (Ocimum basilicum). Front. Plant Sci. 2016, 7, 1328. [Google Scholar] [CrossRef] [PubMed]
  2. Filip, S. Basil (Ocimum basilicum L.) a source of valuable phytonutrients. Int. J. Clin. Nutr. Diet. 2017, 3, 118. [Google Scholar] [CrossRef] [PubMed]
  3. Singletary, K.W. Basil: A brief summary of potential health benefits. Nutr. Today 2018, 53, 92–97. [Google Scholar] [CrossRef]
  4. Rattanachaikunsopon, P.; Phumkhachorn, P. Antimicrobial activity of basil (Ocimum basilicum) oil against Salmonella Enteritidis in vitro and in food. Biosci. Biotechnol. Biochem. 2010, 74, 1200–1204. [Google Scholar] [CrossRef]
  5. Dou, H.; Niu, G.; Gu, M.; Masabni, J.G. Effects of light quality on growth and phytonutrient accumulation of herbs under controlled environments. Horticulturae 2017, 3, 36. [Google Scholar] [CrossRef]
  6. Sipos, L.; Balázs, L.; Székely, G.; Jung, A.; Sárosi, S.; Radácsi, P.; Csambalik, L. Optimization of basil (Ocimum basilicum L.) production in LED light environments—A review. Sci. Hortic. 2021, 289, 110486. [Google Scholar] [CrossRef]
  7. Dudai, N.; Nitzan, N.; Gonda, I. Ocimum basilicum L. (Basil). In Medicinal, Aromatic and Stimulant Plants; Novak, J., Blüthner, W.-D., Eds.; Springer International Publishing: Cham, Switzerland, 2020; pp. 377–405. [Google Scholar] [CrossRef]
  8. Baghalian, K.; Hajirezaei, M.-R.; Lawson, T. Editorial: Current and future perspectives for controlled environment agriculture (CEA) in the 21st century. Front. Plant Sci. 2023, 14, 1334641. [Google Scholar] [CrossRef]
  9. Walters, K.J.; Lopez, R.G. Hydroponic basil production: Temperature influences volatile organic compound profile, but not overall consumer preference. Horticulturae 2022, 8, 76. [Google Scholar] [CrossRef]
  10. Kelly, N.; Vaštakaitė-Kairienė, V.; Runkle, E.S. Chapter 18—Indoor lighting effects on plant nutritional compounds. In Plant Factory Basics, Applications and Advances; Kozai, T., Niu, G., Masabni, J., Eds.; Academic Press: Cambridge, MA, USA, 2022; pp. 329–349. [Google Scholar] [CrossRef]
  11. Kusuma, P.; Pattison, P.M.; Bugbee, B. Chapter 7—Photon efficacy in horticulture: Turning LED packages into LED luminaires. In Plant Factory Basics, Applications and Advances; Kozai, T., Niu, G., Masabni, J., Eds.; Academic Press: Cambridge, MA, USA, 2022; pp. 115–128. [Google Scholar] [CrossRef]
  12. Aldarkazali, M.; Rihan, H.Z.; Carne, D.; Fuller, M.P. The growth and development of sweet basil (Ocimum basilicum) and bush basil (Ocimum minimum) grown under three light regimes in a controlled environment. Agronomy 2019, 9, 743. [Google Scholar] [CrossRef]
  13. Yam, F.K.; Hassan, Z. Innovative advances in LED technology. Microelectron. J. 2005, 36, 129–137. [Google Scholar] [CrossRef]
  14. Zhang, X.; Bian, Z.; Yuan, X.; Chen, X.; Lu, C. A review on the effects of light-emitting diode (LED) light on the nutrients of sprouts and microgreens. Trends Food Sci. Technol. 2020, 99, 203–216. [Google Scholar] [CrossRef]
  15. Zheludev, N. The life and times of the LED—A 100-year history. Nat. Photonics 2007, 1, 189–192. [Google Scholar] [CrossRef]
  16. Zhen, S.; Kusuma, P.; Bugbee, B. Chapter 17—Toward an optimal spectrum for photosynthesis and plant morphology in LED-based crop cultivation. In Plant Factory Basics, Applications and Advances; Kozai, T., Niu, G., Masabni, J., Eds.; Academic Press: Cambridge, MA, USA, 2022; pp. 309–327. [Google Scholar] [CrossRef]
  17. Hendricks, S.B.; Borthwick, H.A. The function of phytochrome in regulation of plant growth. Proc. Natl. Acad. Sci. USA 1967, 58, 2125–2130. [Google Scholar] [CrossRef] [PubMed]
  18. Metallo, R.M.; Kopsell, D.A.; Sams, C.E.; Bumgarner, N.R. Influence of blue/red vs. white LED light treatments on biomass, shoot morphology, and quality parameters of hydroponically grown kale. Sci. Hortic. 2018, 235, 189–197. [Google Scholar] [CrossRef]
  19. Ahmad, M. Photocycle and signaling mechanisms of plant cryptochromes. Curr. Opin. Plant Biol. 2016, 33, 108–115. [Google Scholar] [CrossRef]
  20. Cashmore, A.R.; Jarillo, J.A.; Wu, Y.-J.; Liu, D. Cryptochromes: Blue Light Receptors for Plants and Animals. Science 1999, 284, 760–765. [Google Scholar] [CrossRef]
  21. Jin, W.; Urbina, J.L.; Heuvelink, E.; Marcelis, L.F.M. Adding far-red to red-blue light-emitting diode light promotes yield of lettuce at different planting densities. Front. Plant Sci. 2021, 11, 609977. [Google Scholar] [CrossRef]
  22. Park, C.H.; Park, Y.E.; Yeo, H.J.; Kim, J.K.; Park, S.U. Effects of light-emitting diodes on the accumulation of phenolic compounds and glucosinolates in Brassica juncea sprouts. Horticulturae 2020, 6, 77. [Google Scholar] [CrossRef]
  23. Yudina, L.; Sukhova, E.; Gromova, E.; Mudrilov, M.; Zolin, Y.; Popova, A.; Nerush, V.; Pecherina, A.; Grishin, A.A.; Dorokhov, A.A.; et al. Effect of duration of led lighting on growth, photosynthesis and respiration in lettuce. Plants 2023, 12, 442. [Google Scholar] [CrossRef]
  24. Hosseini, A.; Zare Mehrjerdi, M.; Aliniaeifard, S.; Seif, M. Photosynthetic and growth responses of green and purple basil plants under different spectral compositions. Physiol. Mol. Biol. Plants 2019, 25, 741–752. [Google Scholar] [CrossRef]
  25. Landi, M.; Zivcak, M.; Sytar, O.; Brestic, M.; Allakhverdiev, S.I. Plasticity of photosynthetic processes and the accumulation of secondary metabolites in plants in response to monochromatic light environments: A review. Biochim. Biophys. Acta BBA Bioenerg. 2020, 1861, 148131. [Google Scholar] [CrossRef] [PubMed]
  26. Zhen, S.; van Iersel, M.W. Far-red light is needed for efficient photochemistry and photosynthesis. J. Plant Physiol. 2017, 209, 115–122. [Google Scholar] [CrossRef]
  27. Hammock, H.A.; Sams, C.E. Variation in supplemental lighting quality influences key aroma volatiles in hydroponically grown ‘Italian Large Leaf’ basil. Front. Plant Sci. 2023, 14, 1184664. [Google Scholar] [CrossRef] [PubMed]
  28. Jeong, S.J.; Niu, G.; Zhen, S. Far-red light and temperature interactively regulate plant growth and morphology of lettuce and basil. Environ. Exp. Bot. 2024, 218, 105589. [Google Scholar] [CrossRef]
  29. Larsen, D.H.; Woltering, E.J.; Nicole, C.C.S.; Marcelis, L.F.M. Response of basil growth and morphology to light intensity and spectrum in a vertical farm. Front. Plant Sci. 2020, 11, 597906. [Google Scholar] [CrossRef]
  30. Litvin, A.G.; Currey, C.J.; Wilson, L.A. Effects of supplemental light source on basil, dill, and parsley growth, morphology, aroma, and flavor. J. Am. Soc. Hortic. Sci. J. Amer. Soc. Hort. Sci. 2020, 145, 18–29. [Google Scholar] [CrossRef]
  31. Lin, K.-H.; Huang, M.-Y.; Hsu, M.-H. Morphological and physiological response in green and purple basil plants (Ocimum basilicum) under different proportions of red, green, and blue LED lightings. Sci. Hortic. 2021, 275, 109677. [Google Scholar] [CrossRef]
  32. Rahman, M.M.; Vasiliev, M.; Alameh, K. LED Illumination spectrum manipulation for increasing the yield of sweet basil (Ocimum basilicum L.). Plants 2021, 10, 344. [Google Scholar] [CrossRef]
  33. Kannan, M.; Elavarasan, G.; Balamurugan, A.; Dhanusiya, B.; Freedon, D. Hydroponic farming—A state of art for the future agriculture. Mater. Today Proc. 2022, 68, 2163–2166. [Google Scholar] [CrossRef]
  34. Yue, C.; Vickers, Z.; Wang, J.; Anderson, N.O.; Wisdorf, L.; Brady, J.; Schermann, M.; Phelps, N.; Venturelli, P. Consumer acceptability of aquaponically grown basil. HortScience Horts 2020, 55, 841–850. [Google Scholar] [CrossRef]
  35. Kelly, N.; Choe, D.; Meng, Q.; Runkle, E.S. Promotion of lettuce growth under an increasing daily light integral depends on the combination of the photosynthetic photon flux density and photoperiod. Sci. Hortic. 2020, 272, 109565. [Google Scholar] [CrossRef]
  36. Bornhorst, E.R.; Luo, Y.; Park, E.; Zhou, B.; Turner, E.R.; Teng, Z.; Trouth, F.; Simko, I.; Fonseca, J.M. In search of optimum fresh-cut raw material: Using computer vision systems as a sensory screening tool for browning-resistant romaine lettuce accessions. Horticulturae 2024, 10, 731. [Google Scholar] [CrossRef]
  37. Ibraheem, N.; Hasan, M.; Khan, R.Z.; Mishra, P. Understanding color models: A review. ARPN J. Sci. Technol. 2012, 2, 265–275. [Google Scholar]
  38. Maxwell, K.; Johnson, G.N. Chlorophyll fluorescence—A practical guide. J. Exp. Bot. 2000, 51, 659–668. [Google Scholar] [CrossRef]
  39. Date, M.B.; Rivero, W.C.; Tan, J.; Specca, D.; Simon, J.E.; Salvi, D.A.; Karwe, M.V. Growth of hydroponic sweet basil (O. basilicum L.) using plasma-activated nutrient solution (PANS). Agriculture 2023, 13, 443. [Google Scholar] [CrossRef]
  40. Gutiérrez-Rodríguez, E.; Lieth, H.J.; Jernstedt, J.A.; Labavitch, J.M.; Suslow, T.V.; Cantwell, M.I. Texture, composition and anatomy of spinach leaves in relation to nitrogen fertilization. J. Sci. Food Agric. 2013, 93, 227–237. [Google Scholar] [CrossRef]
  41. Vile, D.; Garnier, É.; Shipley, B.; Laurent, G.; Navas, M.-L.; Roumet, C.; Lavorel, S.; Díaz, S.; Hodgson, J.G.; Lloret, F.; et al. Specific leaf area and dry matter content estimate thickness in laminar leaves. Ann. Bot. 2005, 96, 1129–1136. [Google Scholar] [CrossRef]
  42. Wickham, H.; François, R.; Henry, L.; Müller, K.; Vaughan, D. dplyr: A Grammar of Data Manipulation. Available online: https://cran.r-project.org/web/packages/dplyr/index.html (accessed on 1 February 2023).
  43. de Mendiburu, F. Agricolae: Statistical Procedures for Agricultural Research. Available online: https://cran.r-project.org/web/packages/agricolae/index.html (accessed on 1 February 2023).
  44. Franklin, K.A.; Quail, P.H. Phytochrome functions in Arabidopsis development. J. Exp. Bot. 2009, 61, 11–24. [Google Scholar] [CrossRef]
  45. Smith, H. Phytochromes and light signal perception by plants—An emerging synthesis. Nature 2000, 407, 585–591. [Google Scholar] [CrossRef]
  46. Ballaré, C.L.; Pierik, R. The shade-avoidance syndrome: Multiple signals and ecological consequences. Plant Cell Environ. 2017, 40, 2530–2543. [Google Scholar] [CrossRef]
  47. Casal, J.J. Photoreceptor signaling networks in plant responses to shade. Annu. Rev. Plant Biol. 2013, 64, 403–427. [Google Scholar] [CrossRef] [PubMed]
  48. Lorrain, S.; Allen, T.; Duek, P.D.; Whitelam, G.C.; Fankhauser, C. Phytochrome-mediated inhibition of shade avoidance involves degradation of growth-promoting bHLH transcription factors. Plant J. 2008, 53, 312–323. [Google Scholar] [CrossRef] [PubMed]
  49. Liu, J.; van Iersel, M.W. Photosynthetic physiology of blue, green, and red light: Light intensity effects and underlying mechanisms. Front. Plant Sci. 2021, 12, 619987. [Google Scholar] [CrossRef] [PubMed]
  50. Terashima, I.; Fujita, T.; Inoue, T.; Chow, W.S.; Oguchi, R. Green light drives leaf photosynthesis more efficiently than red light in strong white light: Revisiting the enigmatic question of why leaves are green. Plant Cell Physiol. 2009, 50, 684–697. [Google Scholar] [CrossRef]
  51. Ma, Y.; Ma, X.; Gao, X.; Wu, W.; Zhou, B. Light induced regulation pathway of anthocyanin biosynthesis in plants. Int. J. Mol. Sci. 2021, 22, 11116. [Google Scholar] [CrossRef]
  52. Shalitin, D.; Yu, X.; Maymon, M.; Mockler, T.; Lin, C. Blue light–dependent in vivo and in vitro phosphorylation of arabidopsis cryptochrome 1. Plant Cell 2003, 15, 2421–2429. [Google Scholar] [CrossRef]
  53. Christie, J.M.; Blackwood, L.; Petersen, J.; Sullivan, S. Plant flavoprotein photoreceptors. Plant Cell Physiol. 2014, 56, 401–413. [Google Scholar] [CrossRef]
  54. Gould, K.S. Nature’s swiss army knife: The diverse protective roles of anthocyanins in leaves. J. Biomed. Biotechnol. 2004, 2004, 314–320. [Google Scholar] [CrossRef]
  55. Hatier, J.-H.B.; Gould, K.S. Anthocyanin function in vegetative organs. In Anthocyanins: Biosynthesis, Functions, and Applications; Winefield, C., Davies, K., Gould, K., Eds.; Springer: New York, NY, USA, 2009; pp. 1–19. [Google Scholar] [CrossRef]
  56. Meng, Q.; Kelly, N.; Runkle, E.S. Substituting green or far-red radiation for blue radiation induces shade avoidance and promotes growth in lettuce and kale. Environ. Exp. Bot. 2019, 162, 383–391. [Google Scholar] [CrossRef]
  57. Liu, J.; van Iersel, M.W. Far-red light effects on lettuce growth and morphology in indoor production are cultivar specific. Plants 2022, 11, 2714. [Google Scholar] [CrossRef]
  58. Lee, M.; Xu, J.; Wang, W.; Rajashekar, C. The effect of supplemental blue, red, and far-red light on the growth and the nutritional quality of red and green leaf lettuce. Am. J. Plant Sci. 2019, 10, 2219–2235. [Google Scholar] [CrossRef]
  59. Zheng, L.; Van Labeke, M.-C. Long-term effects of red- and blue-light emitting diodes on leaf anatomy and photosynthetic efficiency of three ornamental pot plants. Front. Plant Sci. 2017, 8, 917. [Google Scholar] [CrossRef] [PubMed]
  60. Falcioni, R.; Moriwaki, T.; Perez-Llorca, M.; Munné-Bosch, S.; Gibin, M.S.; Sato, F.; Pelozo, A.; Pattaro, M.C.; Giacomelli, M.E.; Rüggeberg, M.; et al. Cell wall structure and composition is affected by light quality in tomato seedlings. J. Photochem. Photobiol. B Biol. 2020, 203, 111745. [Google Scholar] [CrossRef] [PubMed]
  61. Meng, Q.; Boldt, J.; Runkle, E.S. Blue Radiation Interacts with Green Radiation to Influence Growth and Predominantly Controls Quality Attributes of Lettuce. J. Am. Soc. Hortic. Sci. J. Amer. Soc. Hort. Sci. 2020, 145, 75–87. [Google Scholar] [CrossRef]
  62. Wadhera, D.; Capaldi-Phillips, E.D. A review of visual cues associated with food on food acceptance and consumption. Eat. Behav. 2014, 15, 132–143. [Google Scholar] [CrossRef]
Figure 1. Emission spectra for light treatments. Low white light control (W), high white light control (+W60), blue light treatment (+B60), far-red light treatment (+FR60), and blue and far-red light combined treatment (+B30+FR30).
Horticulturae 11 00287 g001
Figure 2. Average peak force, toughness, leaf thickness, and specific leaf area (SLA) of ‘Prospera’ and ‘Amethyst’ basil. Different letters denote significant differences among means based on Tukey’s honestly significant difference test (α = 0.05).
Horticulturae 11 00287 g002
Table 1. Photon flux densities (PFD; 300–800 nm), total PFD (TPFD; 300–800 nm), photosynthetic PFD (PPFD; 400–700 nm), and percentages of blue (B; 400–499 nm), green (G; 500–599), red (R; 600–699), and far-red (FR; 700–799 nm) light in each treatment. Subscripted values of the supplemental lighting treatments denote waveband PFDs in µmol∙m−2∙s−1.
TreatmentW+W60+B60+FR60+B30+FR30
TPFD181.55242.57239.68240.51239.79
PPFD176.67235.68234.30173.10202.92
B PFD32.6542.6388.8332.0255.14
G PFD64.1383.9063.4158.8861.80
R PFD79.90109.1482.0682.2085.99%
FR PFD4.706.645.1467.1936.65%
B%17.98%17.58%37.06%13.31%22.99%
G%35.32%34.59%26.46%24.48%25.77%
R%44.01%45.00%34.24%34.18%35.86%
FR%2.59%2.74%2.14%27.94%15.28%
Table 2. Mean fresh mass (Wfresh), dry mass (Wdry), leaf number, stem length, and stem width of ‘Prospera’ and ‘Amethyst’ Basil.
CultivarTreatmentWfresh (g)Wdry (g)Leaf NumberStem Length (mm)Stem Width (mm)
‘Prospera’W8.43 c0.57 c15.7 b99.7 b4.32 c
+W6012.5 a0.90 a21.8 a103.0 b5.31 ab
+B6010.4 b0.75 b18.6 b96.2 b4.92 b
+FR6013.1 a1.02 a23.1 a168.3 a5.16 ab
+B30+FR3013.2 a0.98 a22.0 a152.1 a5.35 a
‘Amethyst’W4.72 c0.31 c10.2 d73.1 c3.52 c
+W606.74 b0.44 ab15.6 b86.7 c4.05 b
+B606.13 b0.38 bc12.7 c82.3 c3.93 bc
+FR608.88 a0.50 a18.8 a158.7 a4.81 a
+BFR608.47 a0.51 a16.6 ab131.0 b4.77 a
Means with different letters are significantly different based on Tukey’s honestly significant difference test (α = 0.05).
Table 3. Light- and dark-adapted chlorophyll fluorescence measurements.
CultivarTreatmentFsFm’ETRphiPSIIFoFmFv/Fm
‘Prospera’W161.2 a353.4 b32.69 b0.534 c91.19 a464.6 a0.804 c
+W60132.0 ab329.7 b61.82 a0.587 bc88.39 ab458.7 a0.807 c
+B60127.8 ab333.3 b59.80 a0.610 abc87.95 ab466.5 a0.811 bc
+FR60126.2 b403.2 a54.78 a0.688 a86.30 ab479.6 a0.820 a
+B30+FR30137.7 ab377.8 ab53.96 a0.635 ab83.32 b454.9 a0.817 ab
‘Amethyst’W99.0 a292.2 b42.58 b0.664 ab70.71 a362.0 b0.805 b
+W60101.1 a252.9 c59.60 a0.605 b61.12 b310.8 d0.803 b
+B6086.07 a267.9 bc55.72 a0.675 ab65.35 b345.3 bc0.811 ab
+FR60107.7 a341.5 a50.82 ab0.685 a72.79 a391.6 a0.814 a
+B30+FR3086.6 a285.7 b55.23 a0.699 a64.86 b335.5 cd0.807 ab
Means with different letters are significantly different based on Tukey’s honestly significant difference test (α = 0.05).
Table 4. Average L*a*b*, hue, and chroma values for ‘Amethyst’ basil.
Purple Section of LeafGreen Section of Leaf
TreatmentL*a*b*HueChromaL*a*b*HueChroma
W26.1 bc2.86 c1.79 bc32.13.3836.3 b−0.8 a8.84 c95.28.75
+W6024.9 c3.11 c0.90 c16.33.2436.0 b−0.48 a10.4 c92.610.4
+B6025.4 c3.33 bc1.25 bc20.73.5636.5 b−1.08 a11.1 c95.611.0
+FR6028.1 a3.84 ab4.83 a51.56.1738.1 a−3.11 b16.4 a100.816.2
+B30+FR3026.9 ab4.42 a2.30 b27.64.9937.3 a−1.23 a13.7 b95.113.6
L* (lightness), a* (red/green), b* (yellow/blue). Means with different letters are significantly difference based on Tukey’s honestly significant differences test (α = 0.05).
Table 5. Average L*a*b*, hue, and chroma values for ‘Prospera’ basil leaves.
TreatmentL*a*b*HueChroma
W40.9 b−21.5 bc31.5 b124.238.2
+W6039.7 c−20.7 a30.7 b124.037.1
+B6040.7 bc−20.9 ab30.8 b124.137.3
+FR6044.0 a−21.8 c35.5 a121.741.9
+B30+FR3044.3 a−21.9 c35.6 a121.641.8
L* (lightness), a* (red/green), b* (yellow/blue). Means with different letters are significantly difference based on Tukey’s honestly significant differences test (α = 0.05).
Disclaimer/Publisher’s Note: The statements, opinions and data contained in all publications are solely those of the individual author(s) and contributor(s) and not of MDPI and/or the editor(s). MDPI and/or the editor(s) disclaim responsibility for any injury to people or property resulting from any ideas, methods, instructions or products referred to in the content.

