Article

Impact of Salinity on Sugar Composition and Partitioning in Relation to Flower Fertility in Solanum lycopersicum and Solanum chilense

1
Groupe de Recherche en Physiologie Végétale (GRPV), Earth and Life Institute—Agronomy (ELI-A), Université Catholique de Louvain, Croix du Sud 5 (Bte L7.07.13), 1348 Louvain-la-Neuve, Belgium
2
Instituto de Investigaciones Agropecuarias (INIA—Rayentué), Av. Salamanca s/n, Sector Los Choapinos, Rengo 2540004, Chile
*
Author to whom correspondence should be addressed.
Horticulturae 2025, 11(3), 285; https://doi.org/10.3390/horticulturae11030285
Submission received: 3 February 2025 / Revised: 1 March 2025 / Accepted: 3 March 2025 / Published: 6 March 2025

Abstract

:
Salinity negatively affects flower production and fertility in tomato but the underlying mechanisms are not fully understood. One hypothesis is that salinity affects sugar partitioning by reducing photosynthesis, which in turn affects source–sink relationships and hence the development of reproductive structures. This study investigates how salt stress alters sugar composition in leaves, flowers, and phloem sap of Solanum lycopersicum and its halophyte relative Solanum chilense, and how this may explain the effects on flower production and fertility. Salt stress increased flower abortion and reduced sepal length in S. lycopersicum, while decreasing pollen grain number in S. chilense. Photosynthetic nitrogen use efficiency was also reduced in S. lycopersicum. Salinity raised myo-inositol and sucrose concentrations in S. lycopersicum leaves but only slightly altered sugar concentrations in flowers. The concentration of sucrose in the foliar exudates was higher in S. chilense as compared to S. lycopersicum, suggesting a higher export of sucrose from the leaves. These findings suggest that S. lycopersicum maintains better metabolic function under salt stress, while S. chilense sustains sugar import to sink organs. Correlations between reproductive traits and sugar dynamics indicate that sugar distribution contributes to reproductive development under salinity stress.

1. Introduction

Flowers and fruits are generally considered sink organs, as opposed to leaves, which are considered source organs [1,2]. This is because photosynthesis is lower in flowers and fruits than in vegetative organs [1,2]. Furthermore, reproductive organs have a high concentration of mitochondria, confirming their sink character [3]. Therefore, the import of sugars from the leaves to the reproductive organs is necessary to ensure their proper functioning [4]. A high concentration of sucrose in the phloem of source tissues leads to an increase in turgor pressure, which leads to the transport of sugars to sink tissues via hydrostatic pressure-induced mass flow [5,6]. In the flowers, sugars are regarded as signaling cues that enable fruit development after pollination, and regulate fruit and seed set [4,7].
Source–sink dynamics are affected by abiotic stresses that could impact sugar partitioning in plants [8]. Abiotic stresses such as salinity are deleterious for plant growth and development [9,10] and the reproductive phase is often more sensitive to abiotic stresses than vegetative phase [11,12]. In tomato, the most described symptom of salt stress is yield reduction caused by a decrease in fruit weight and/or fruit set [13,14]. This yield decrease can also be related to a decrease in flower fertility and flower production, or an increase in flower abortion [14,15,16,17,18].
The causes of the decrease in flower fertility and the increase in flower abortion under salt stress is not fully understood. The most common hypotheses are the accumulation of toxic ions in the reproductive structures or an alteration of sugar metabolism and competition among sink organs for photoassimilates [15]. The involvement of other compounds such as hormones, polyamines and osmolytes has also been demonstrated [19,20,21]. A link was found between accumulation of toxic ions (Na, Cl) and a decrease of pollen fertility in rice [22]. However, in tomato, our previous results indicate that the effects of cation accumulation or deficiency on flower fertility were not sufficient to explain the changes in fruit parameters (decrease in fruit size and seed number, and increase in sugar content) [17]. Ghanem et al. [15] reported that the failure of inflorescence to develop normally under salt stress in tomato can be better explained in terms of altered source–sink relationship. The alteration of sugar metabolism could be due to a decrease in leaf area and production and a decrease in photosynthetic performance [15]. Indeed, net photosynthesis often decreases during abiotic stresses, leading to a limitation in carbohydrates metabolism for sinks efficiency [7]. Salinity thus disturbs the source–sink relationships: the source organs are unable to maintain the same amount of photoassimilates, the sink organs are less developed, which ultimately leads to a reduction in yield [23]. The importance of carbohydrate availability for flower retention and flower fertility has been demonstrated, although the mechanisms of carbohydrate regulation on flower abscission and flower fertility are not fully understood [24,25]. Moreover, Balibrea et al. [26] showed that resistance to salt stress in tomato is more closely related to efficient use and distribution of photoassimilates than to high photosynthetic activity and carbohydrate availability, again highlighting the importance of the source–sink dynamics.
Unlike the cultivated tomato (Solanum lycopersicum) which is a glycophyte species, Solanum chilense is a wild halophyte tomato relative [14,27]. It is native to the Atacama Desert [28]. This species shows high resistance to salt stress, especially during its reproductive phase [14,17]. It maintained high yield despite salt stress and its fruit quality was not affected by salt [14]. Its greater resistance to salt as compared to S. lycopersicum may be explained by different physiological responses to salinity. Under salt stress, these two species differ in their behavior towards sodium accumulation as well as in their hormonal and antioxidant response [29,30,31]. For example, S. chilense was described as a Na+ includer species whereas S. lycopersicum was described as a Na+ excluder species [31]. In our previous experiments, we observed that the rate of inflorescence and flower abortion due to salt stress was higher in S. lycopersicum than in S. chilense despite a higher Na+ accumulation in the inflorescences of the latter [17]. However, to the best of our knowledge, the sugar metabolism has not been investigated in this species, nor has its role in resistance to salt stress during the reproductive phase.
In this study, we compared the effects of salt stress on the reproductive phase of S. lycopersicum and S. chilense, focusing on the sugar metabolism in flowers to investigate whether sugar metabolism and source–sink distribution could be related to flower production and fertility. This study aims to answer the following questions: (1) Does salt stress lead to a change in the composition and concentration of sugars in leaves, flowers and sieve? (2) Is there a relationship between flower fertility and the composition/concentration of sugars in the flowers?

2. Materials and Methods

Two independent experiments were performed one year apart under the same conditions. They follow the same experimental design and are repetitions (Figure S1). The results presented are the average of the two experiments, with a few clearly marked exceptions.

2.1. Plant Material and Growth Conditions

Seeds of S. lycopersicum (cv. Ailsa Craig, LA2838A) were obtained from the Tomato Genetics Resource Center (TGRC, University of California, Davis, CA, USA) and seeds of S. chilense Dunal. (LA4107) were obtained from INIA-La Cruz (La Cruz, Chile). They were further multiplied in the laboratory.
S. chilense seeds were pre-germinated in Petri dishes on moistened Whatmann paper for 6 days in a growth chamber (temperature of 25 °C, photoperiod of 12 h). Germinated seeds were transplanted in peat compost (DCM, Amsterdam, The Netherlands) in a temperate greenhouse (16 h, 24 ± 1.5 °C, 63 ± 8%/8 h, 21 ± 0.8 °C, 67 ± 5% day/night photoperiod, temperature and RH) with additional lighting provided by LumiGrow (Novato, CA, USA) LED lamps (650 W, red-blue, mid-day average light 181.33 ± 63.42 µmol.m−2.s−1). Twelve days after pre-germination of S. chilense seeds, S. lycopersicum seeds were sown in peat compost in the same conditions. At the second leaf stage, the plants were transplanted individually into 2.5 L pots filled with perlite/vermiculite (50% v/v). They were watered 3 times a week with modified Hoagland solution (5 mM KNO3, 5.5 mM Ca(NO3)2, 1 mM NH4H2PO4, 0.5 mM MgSO4, 25 µM KCl, 10 µM H3BO4, 1 µM MnSO4, 0.25 µM CuSO4, 1 µM ZnSO4, 10 µM (NH4)6Mo7O and 1.87 g.L−1 Fe-EDTA, pH 5.5–6). After four days of acclimatization, plants were randomly divided into 3 groups (10 to 15 plants per group) receiving 0, 60 and 120 mM NaCl (respectively 0.86, 7.07 and 12.72 mS.cm−1). Salt was added to the Hoagland solutions and plants were watered 3 times per week. The physiological stage of the plant determined the amount of watering. The substrate was never dry.

2.2. Morphological Measurements and Reproductive Development Assessment

Leaves, inflorescences and ramifications were counted on the main stem for 91 days of stress on 8 and 6 plants per condition and species for the first and the second experiments, respectively.
The area of the first mature leaf was measured using ImageJ (v1.53a) from pictures (Lumix, Panasonic DMC SZ-10, Melle, Belgium). On the first experiment, those measurements were made at 40 DASt on 5 plants per condition and species, and in the second experiment, at 49 DASt on 6 plants per condition and species. Since the time of measurement was different, only the results of the second experiment are presented.
Initial flowering time was assessed by counting the number of leaves below the first inflorescence and sympodial flowering time was assessed by counting the number of leaves between each inflorescence.
The percentage of aborted inflorescences (abortion before stage 4 according to [32]) was assessed on the main stem of the same plants as above.
The number of flower buds and flowers at anthesis per inflorescence was counted on the second inflorescence. The percentage of bud abortion in an inflorescence was calculated from these measurements (100 × number of flowers at anthesis in an inflorescence/number of flower buds in the inflorescence). Flowers at anthesis of the second inflorescence of the main stem were harvested to assess the number of floral pieces and the length of sepals, petals, stamens and pistil (8–10 flowers per condition for the first experiment and 12–20 flowers for the second experiment). The style exertion was also monitored for S. chilense (subtraction of stamen length from ovary and style length).
The number of pollen grains was estimated on two anthers of 5 flowers per condition and species in the first experiment and 10 in the second experiment. They were counted according to the protocol of [33]. Pictures were taken with the microscope connected to a camera (Polyvar Reichert-Jung, sCMEX-6, Euromex, Duiven, The Netherlands) and analyzed using ImageJ (v1.53a) with a pollen size of 5–800 pixel2 and a circularity of 0.3–1.0.
Pollen viability was assessed in the second experiment on at least 100 pollen grains per anther, in two anthers of ten flowers at anthesis per condition and species, using Alexander’s dye [34]. If a red color appeared, the pollen grain was considered viable and if a blue color appeared, the grain was considered non-viable. Stigma receptivity was assessed on 10 flowers per condition and species by detecting peroxidase activity on the stigma surface, as described by [35]. A stigma was considered receptive if a reddish-brown color developed on its surface and non-receptive if no color developed on its surface.
Flowers of the self-compatible S. lycopersicum were self-pollinated and flowers of the self-incompatible S. chilense were hand-pollinated with compatible pollen of the same species and in the same condition. Fruit set was calculated at the inflorescence level as the ratio between the number of fruits and the number of pollinated flowers, expressed as a percentage. Fruits were collected at the ripening stage to assess their quality. The sugar concentration of 7–20 fruits in the first experiment and 10 fruits in the second experiment was estimated by refractometry in degrees Brix (Eclipse, Bellingham + Stanley, Tunbridge Wells, UK). The number of seeds per fruit, fruit fresh weight (FWfr) and equatorial circumference of the same fruits were measured. Fruit FW (FWfr) was measured on 3–7 and 10 fruits per condition and species for the first and the second experiments, respectively, and the DW of the same fruits (DWfr) was measured after 3 days at 70 °C and water content of the same fruits (WCfr, in %) was calculated using the formula 100 × (FWfr − DWfr)/FWfr.

2.3. Photosynthesis Parameters

Photosynthetic and gas-exchange parameters were measured in the first experiment at 95 days after stress imposition (DASt) and in the second experiment at 70 DASt, on the 5th youngest leaf of 6 plants per condition and species. The instantaneous CO2 assimilation rate under ambient conditions (400 ppm CO2) (A) was quantified using an infrared gas analyzer (ADC BioScientific LCI-SD System Serial 33413, Hoddesdon, UK). The chlorophyll content index (CCI) was estimated using a chlorophyllometer (Opti-Sciences, CCM-200, Hudson, TX, USA) and measurements were performed in triplicates on each leaf. Net photosynthesis was corrected by CCI to obtain photosynthetic nitrogen use efficiency (PNUE) according to [36]. Only the results of the second experiment are presented because of environmental and temporal effects on the gas exchanges.

2.4. Carbohydrates Analysis

2.4.1. Carbohydrates Extraction from Leaves and Flowers

The 6th youngest leaf and inflorescences of 3 plants per condition and species were harvested at 61 (first experiment) and 85 (second experiment) DASt, respectively. Leaf and inflorescence samples were ground separately in liquid nitrogen, and total soluble sugars were extracted using ethanol 70% (v/v).

2.4.2. Apical and Foliar Phloem Sap Collection

Apical and leaf exudates were collected according to the method described by [37] and adapted by [38]. Apical stems were cut as close to the apex as possible, and 2 mL tubes filled with 1.5 mL of 1% (w/v) ultra-pure agarose in 20 mM EDTA (ethylenediaminetetraacetic acid) solution (pH 7.0) were immediately placed on the cut stump. After 16 h exudation, the tubes were removed, and agarose containing-exudates were crushed in mortar on ice with the same volume of methanol 100%. After centrifugation (8000× g, 4 °C) for 30 min, the supernatant was frozen at −20 °C and the same volume of methanol 50% (v/v) was added to the agarose pellet for re-extraction. After 4 h of stirring on ice, the samples were centrifuged for 30 min (8000× g, 4 °C). The two supernatants were pooled and filtered (Chromafil, 0.45 µm, Macherey-Nagel, Dueren, Germany) after addition of trehalose 100 µM as internal standard. Foliar exudates were extracted by plunging about 50 leaves immediately after cutting in 20 mL water containing 20 mM EDTA. They were covered with Parafilm paper and left in the dark in a humid environment for 16 h. The remaining liquid was filtered through a Chromafil filter of 0.45 µm before sugar quantification, and the leaves were dried in an oven at 70 °C to measure the leaf DW.

2.4.3. Carbohydrate Analysis

The ethanol extracts of leaves and inflorescences and the apical and foliar phloem saps were used for sugar analysis by GC-FID (Gas Chromatography coupled with a Flame Ionization Detector). The sugars analyzed were fructose, glucose, sucrose, myo-inositol and trehalose (the internal standard of extraction), and the internal standard of the reaction was mannitol. Three replicates were used per organ, condition and species. One mL of ethanol extract was air-condensated, then sugars present in the samples were converted to trimethylsilyl derivatives (TMS) using hydroxylamine hydrochloride in pyridine and hexamethyldisilazide according to [39]. One µL was injected into GC-FID (Thermo Scientific, Waltham, MA, USA) and separated on a Varian CP-Sil 5 column (length: 30 m, inner diameter: 0.32 mm, film thickness 0.25 μm) in split mode (1/10). Carrier gas was N2 (2 mL.min−1). The injector and detector were set at 250 and 300 °C, respectively. The oven temperature was started at 105 °C for 4 min, and then increased at a rate of 15 °C.min−1 to 280 °C, where it was maintained for 20 min.
The concentration of sugars in leaves and inflorescences was calculated as:
C s u g a r s = m   s u g a r s m   s a m p l e
With Csugars, concentration of each analyzed sugar in the sample (mg.g−1 fresh weight); m sugars, mass of the sugar given by the GC-FID [mg]; m sample, mass of the sample (leaves or inflorescences) [g].
The concentration of sugars in the apical exudates was calculated as:
C s u g a r s   a p i c a l   e x u d a t e s = m   s u g a r s N p l a n t
With Csugars apical exudates, concentration of each analyzed sugar in one plant [µg.plant−1]; m sugars, mass of the sugar given by the GC-FID [µg]; Nplant, number of plants (i.e., of eppendorfs).
The concentration of sugars in the foliar exudates was calculated as:
C s u g a r s   f o l i a r   e x u d a t e s = C s u g a r s × V D W
With Csugars foliar exudates, concentration of each analyzed sugar (µg.g−1 DW); Csugars, the concentration of the sugar given by the GC-FID [µg.mL−1]; V, the volume of EDTA 20 mM used to extract the foliar exudates after 16 h [mL]; DW, dry weight of the leaves used to extract foliar exudates [g].

2.5. Gene Expression by qRT-PCR

In the second experiment, the expression of 8 genes involved in sugar metabolism was analyzed in plants harvested at 85 DASt. Genes were selected based on literature [4,40,41,42,43] and on transcriptome profiling of tomato inflorescences [44]. If the sequences were not described in S. chilense, S. lycopersicum sequences were used for nucleotide blast against the National Center Biotechnology Information (NCBI) and Solanaceae Genomics Network (SGN) databases. Sequences were then aligned using BioEdit (v. 7.2.3) [45]. A first bioinformatics study of the expression of these genes was analyzed using available databases (TomExpress, SGN, [44]). The full-length tomato sequences obtained were used for primer design using Primer3Plus [46]. The specificity of the primers was checked using the PrimerBlast tool of NCBI [47]. The analyzed genes and primer sequences are listed in Table S1.
RNA was extracted from flowers and leaves of three plants per condition and species (100 mg ground material) using TRI Reagent Solution (Ambion, Austin, TX, USA) with DNase treatment (RQ1 DNase 1 U.µL−1 Promega, Leiden, The Netherlands) according to the manufacturer’s instructions. First-strand cDNA was synthesized from 1 µg of RNA using the Revertaid H Minus First Strand cDNA Synthesis Kit (ThermoFisher, Waltham, MA, USA). The concentration and purity of the RNA were measured using a NanoDrop ND-1000 spectrophotometer (ThermoFischer, Waltham, MA, USA). Transcript levels were quantified in triplicate for each of the three biological replicates using the GoTaq qRT-PCR Master Mix (Promega) in StepOnePlus real-time PCR systems (Applied Biosystems, Foster City, CA, USA). Cycling conditions were an initial denaturation of 10 min at 95 °C, followed by 40 cycles of 15 s at 95 °C and 1 min at 60 °C. The tomato housekeeping genes LeEF1-a (Elongation factor 1-alpha, Solyc06g005060) and TIP41 (TIP41-like protein, Solyc10g049850) were used as reference genes [48]. The results were expressed in arbitrary units using the calibration curve method in comparison with the expression of S. lycopersicum under control conditions. A melt-curve analysis was performed to check the specific amplifications.

2.6. Statistical Treatments

The number of leaves, ramifications and inflorescences on the main stem over time, and sugar concentrations, were presented as raw data. Other data of morphological and physiological measurements and reproductive development assessment were presented as the percentage of increase or decrease of the considered parameter in the different NaCl conditions as compared to the control in each of the species. Gene expression analysis was presented as the increase or decrease of the expression levels of all the conditions compared to S. lycopersicum at 0 mM NaCl. All treatments were analyzed using RStudio (v. 2022.02.1+461). Normality distribution and homoscedasticity were verified using the Shapiro-Wilk and Levene’s tests, respectively, and data were transformed when required. Two-ways analysis of variance (ANOVA II) was used to compare species, NaCl treatment, and their interactions. Post-hoc analyses were performed using Tukey’s multiple comparison analysis method to compare NaCl treatments in each species. Data are presented by means ± standard error.

3. Results

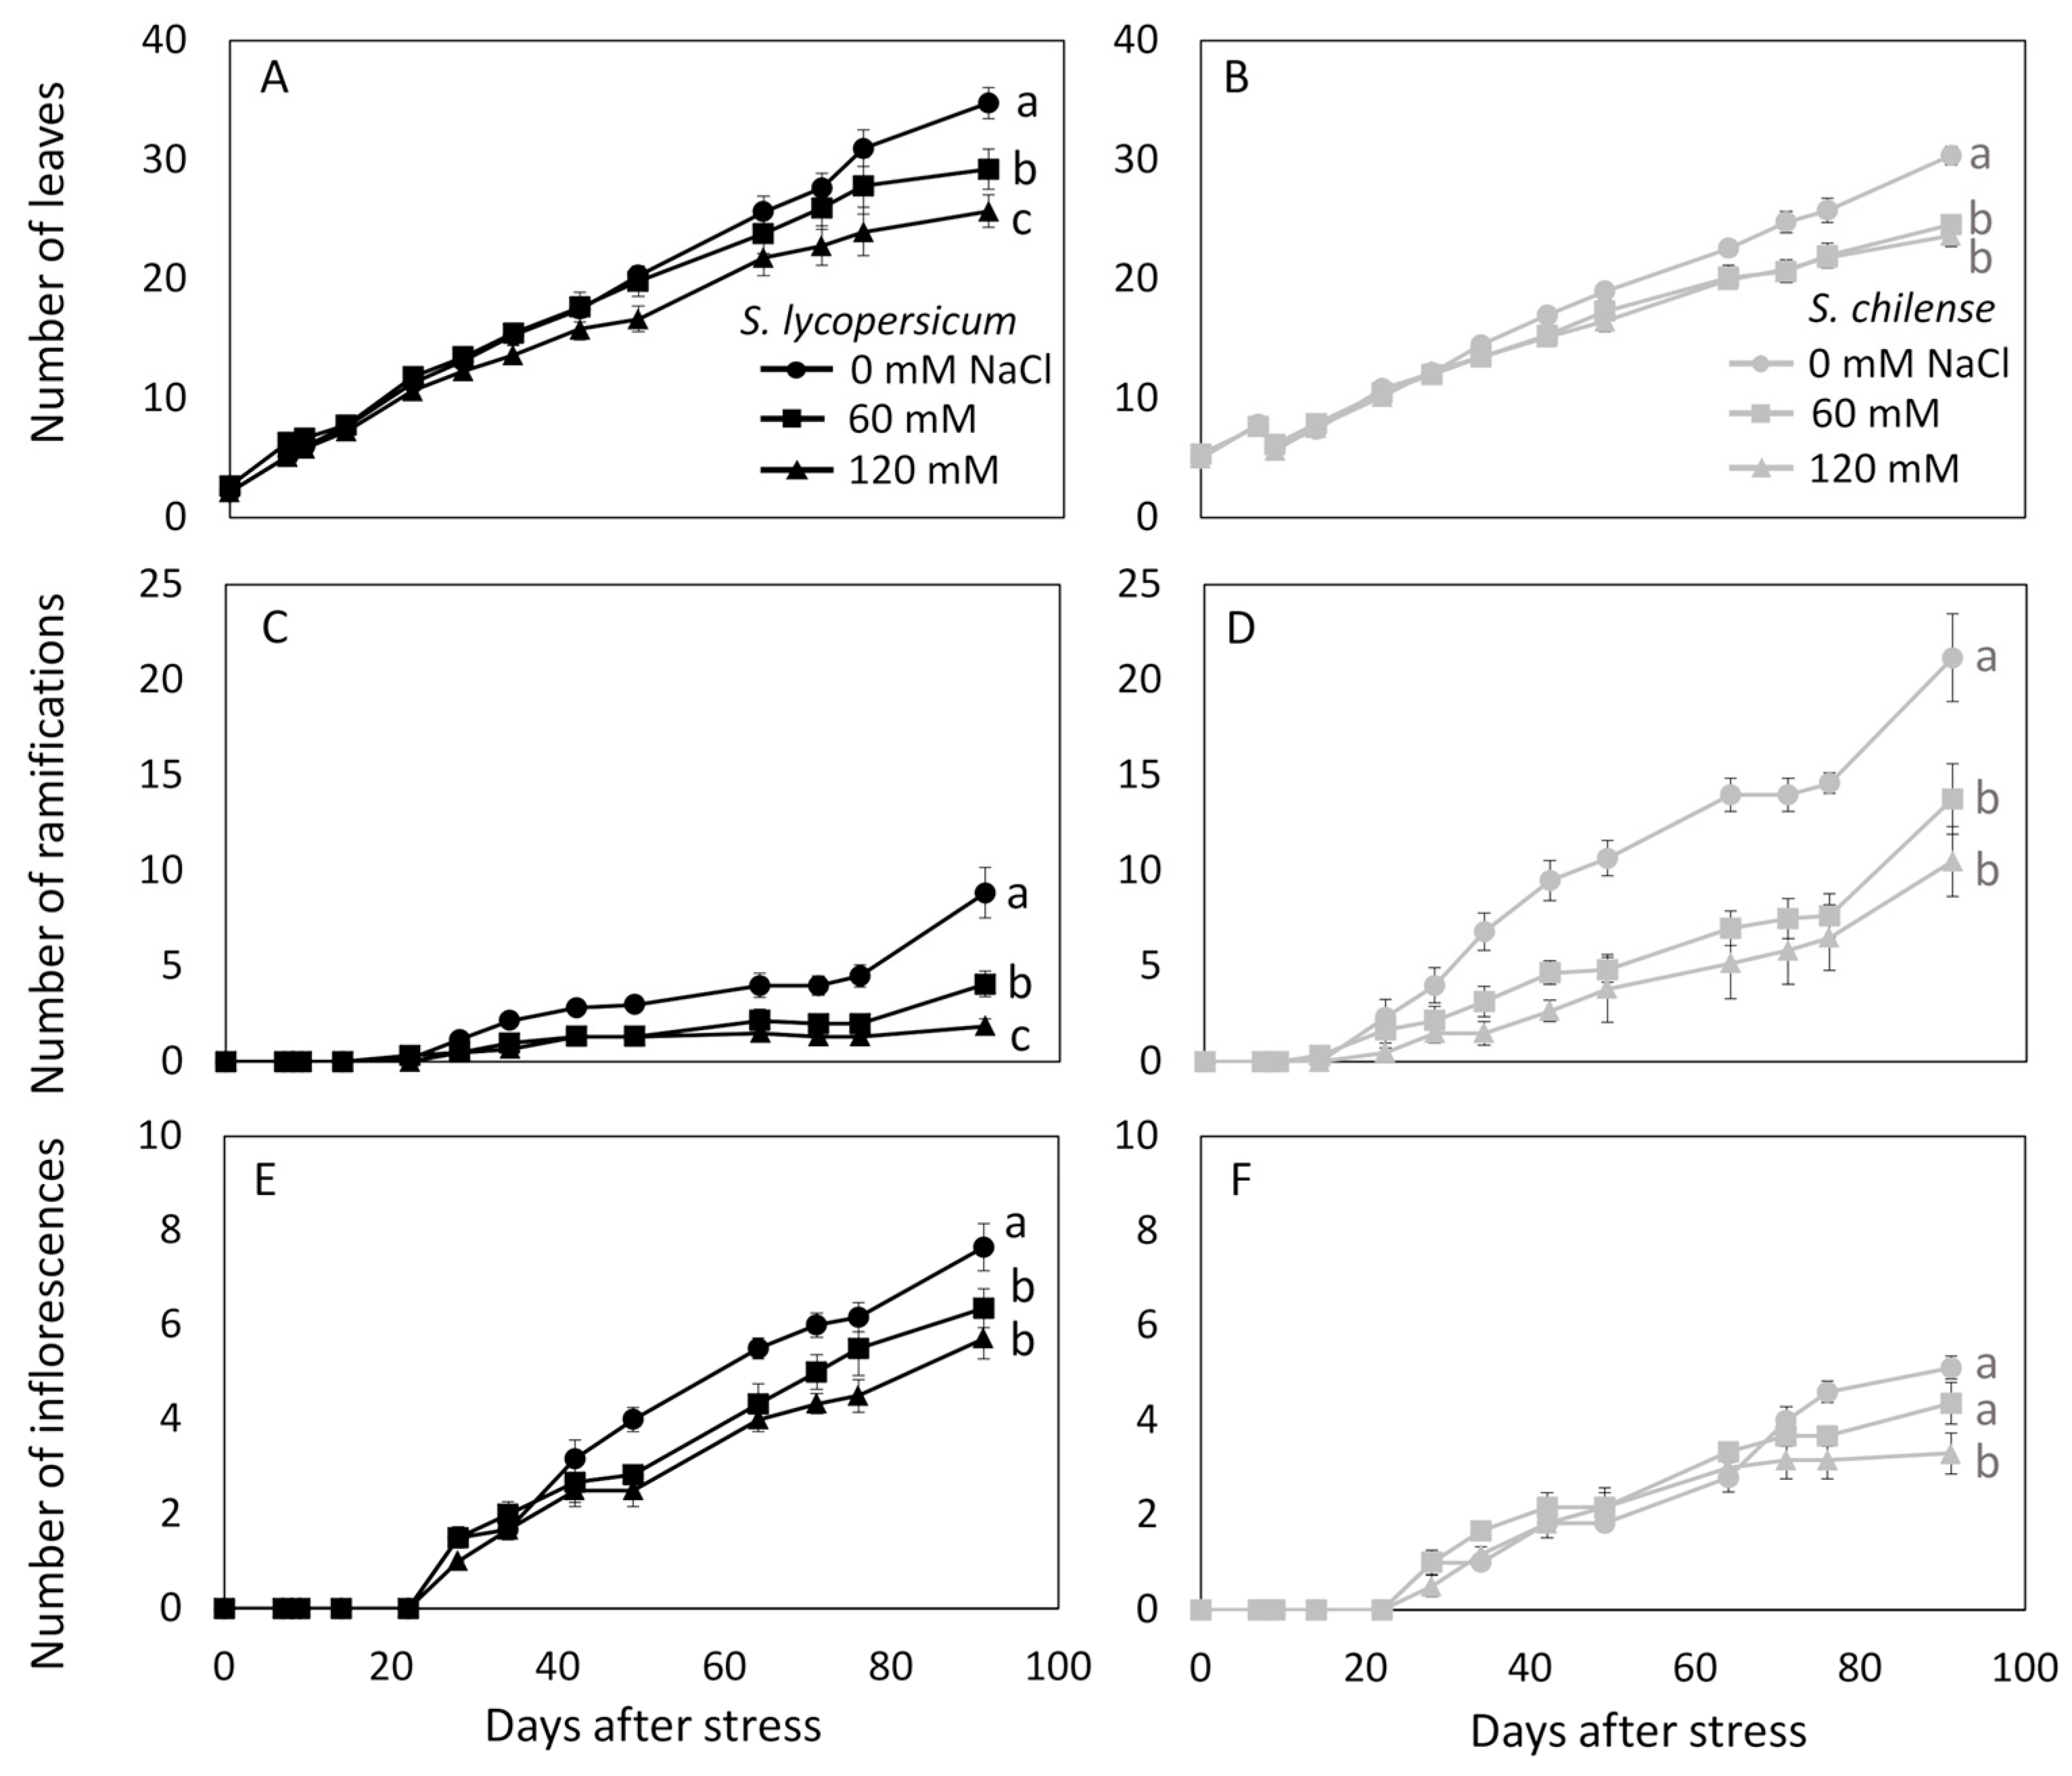
3.1. Vegetative and Reproductive Developments Under Control Conditions

S. lycopersicum and S. chilense showed several morphological differences (Figure 1A–F, Table S2). Indeed, at 0 mM NaCl, S. lycopersicum produced more leaves on the main stem but fewer ramifications than S. chilense, resulting in a bushy appearance of S. chilense (Figure 1A–D, Table S3). In addition, the leaves of S. chilense were 1.8 times smaller than those of S. lycopersicum at 49 DASt (Table S2).
Reproductive structures also differed between species under control conditions, but initial and sympodial flowering times were similar in both species (Table S2). S. lycopersicum produced almost twice as many inflorescences on the main stem than S. chilense (Figure 1E,F, Table S3). The rate of inflorescence abortion was higher in S. chilense than in S. lycopersicum while the rate of flower abortion per inflorescence was similar in both species (Table S2). Flower morphology also differed between species: the length of the sepals, petals and stamens were, respectively, 2.1, 1.2 and 1.1 times higher in S. lycopersicum than in S. chilense, respectively (Table S2). S. chilense produced 2.5 times more pollen grains per anther than S. lycopersicum, but pollen viability was higher in S. lycopersicum (Table S2).
Fruit parameters showed large differences between the two species under control conditions, despite similar fruit set (Table S2). Fruits of S. lycopersicum were larger, with a higher DW, FW and WC than fruits of S. chilense (Table S2). The number of seeds per fruit was also higher in S. lycopersicum than in S. chilense. (Table S2). However, the fruits of S. chilense were sweeter (Brix degrees 2.5 times higher) than those of S. lycopersicum (Table S2).
Photosynthesis Nitrogen Use Efficiency, expressed as the ratio between net photosynthesis (A) and Chlorophyll Content Index (CCI), was higher in S. chilense than in S. lycopersicum under control conditions (Table S2).

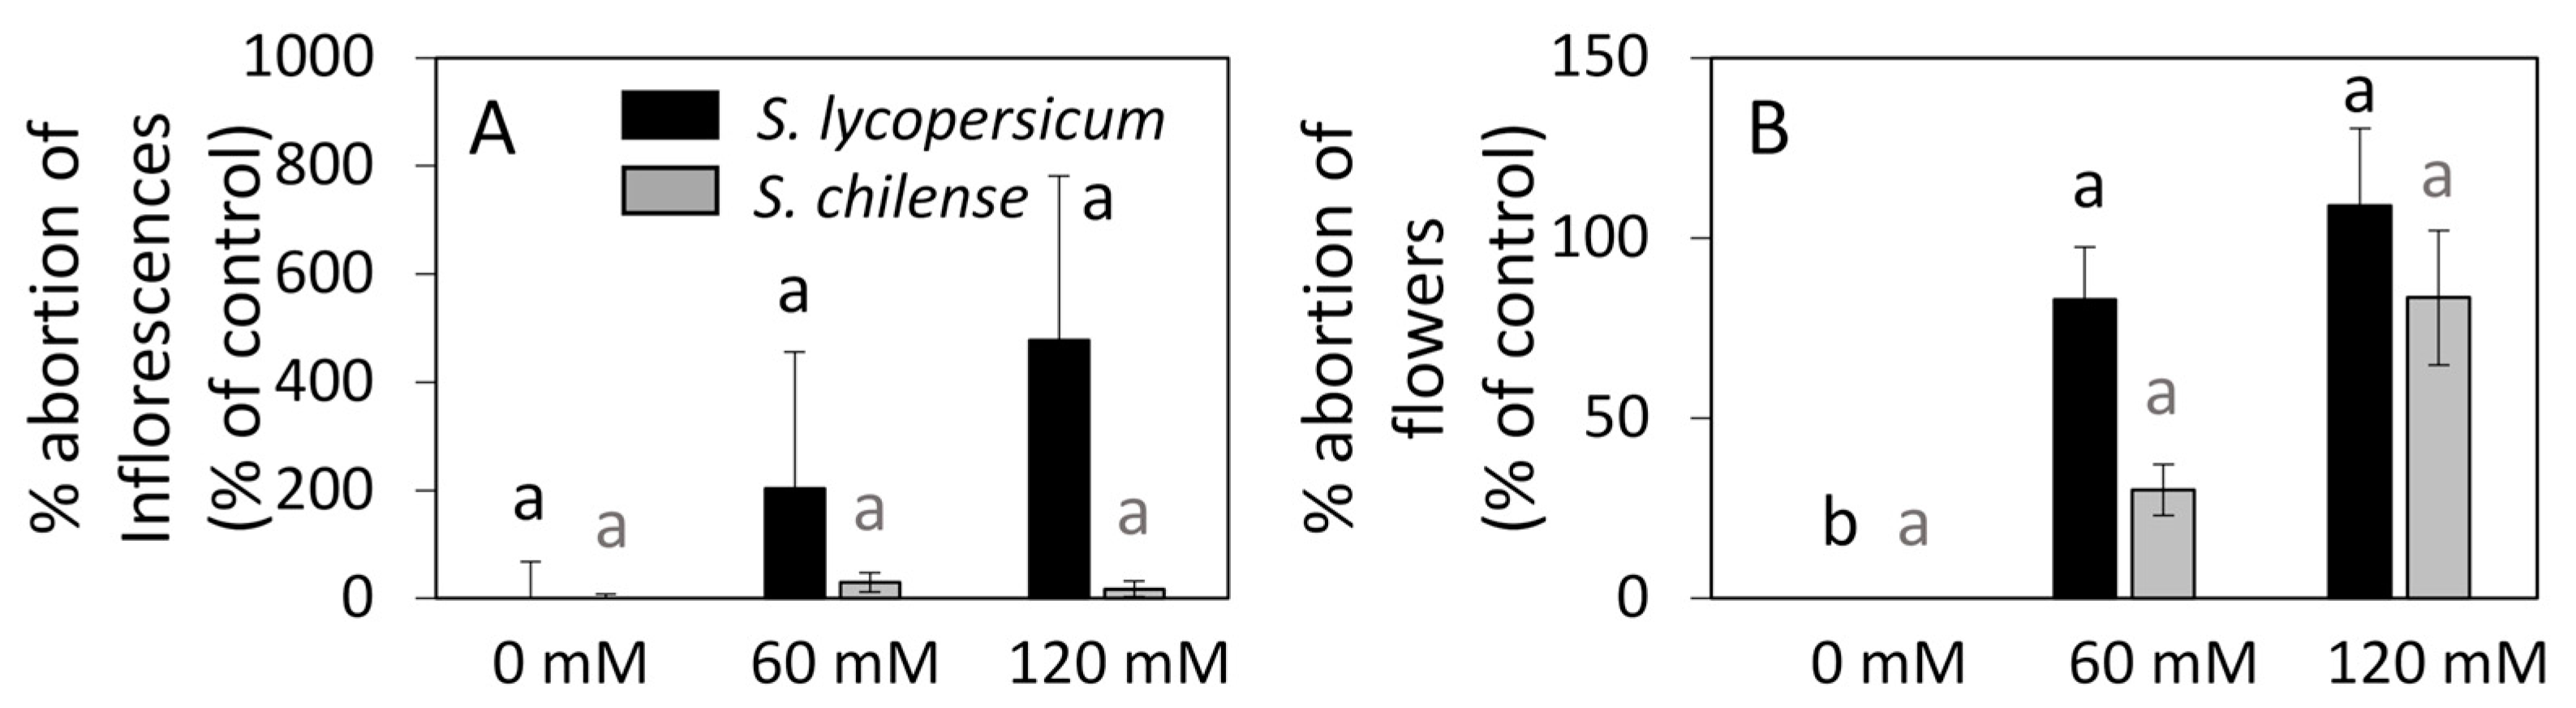
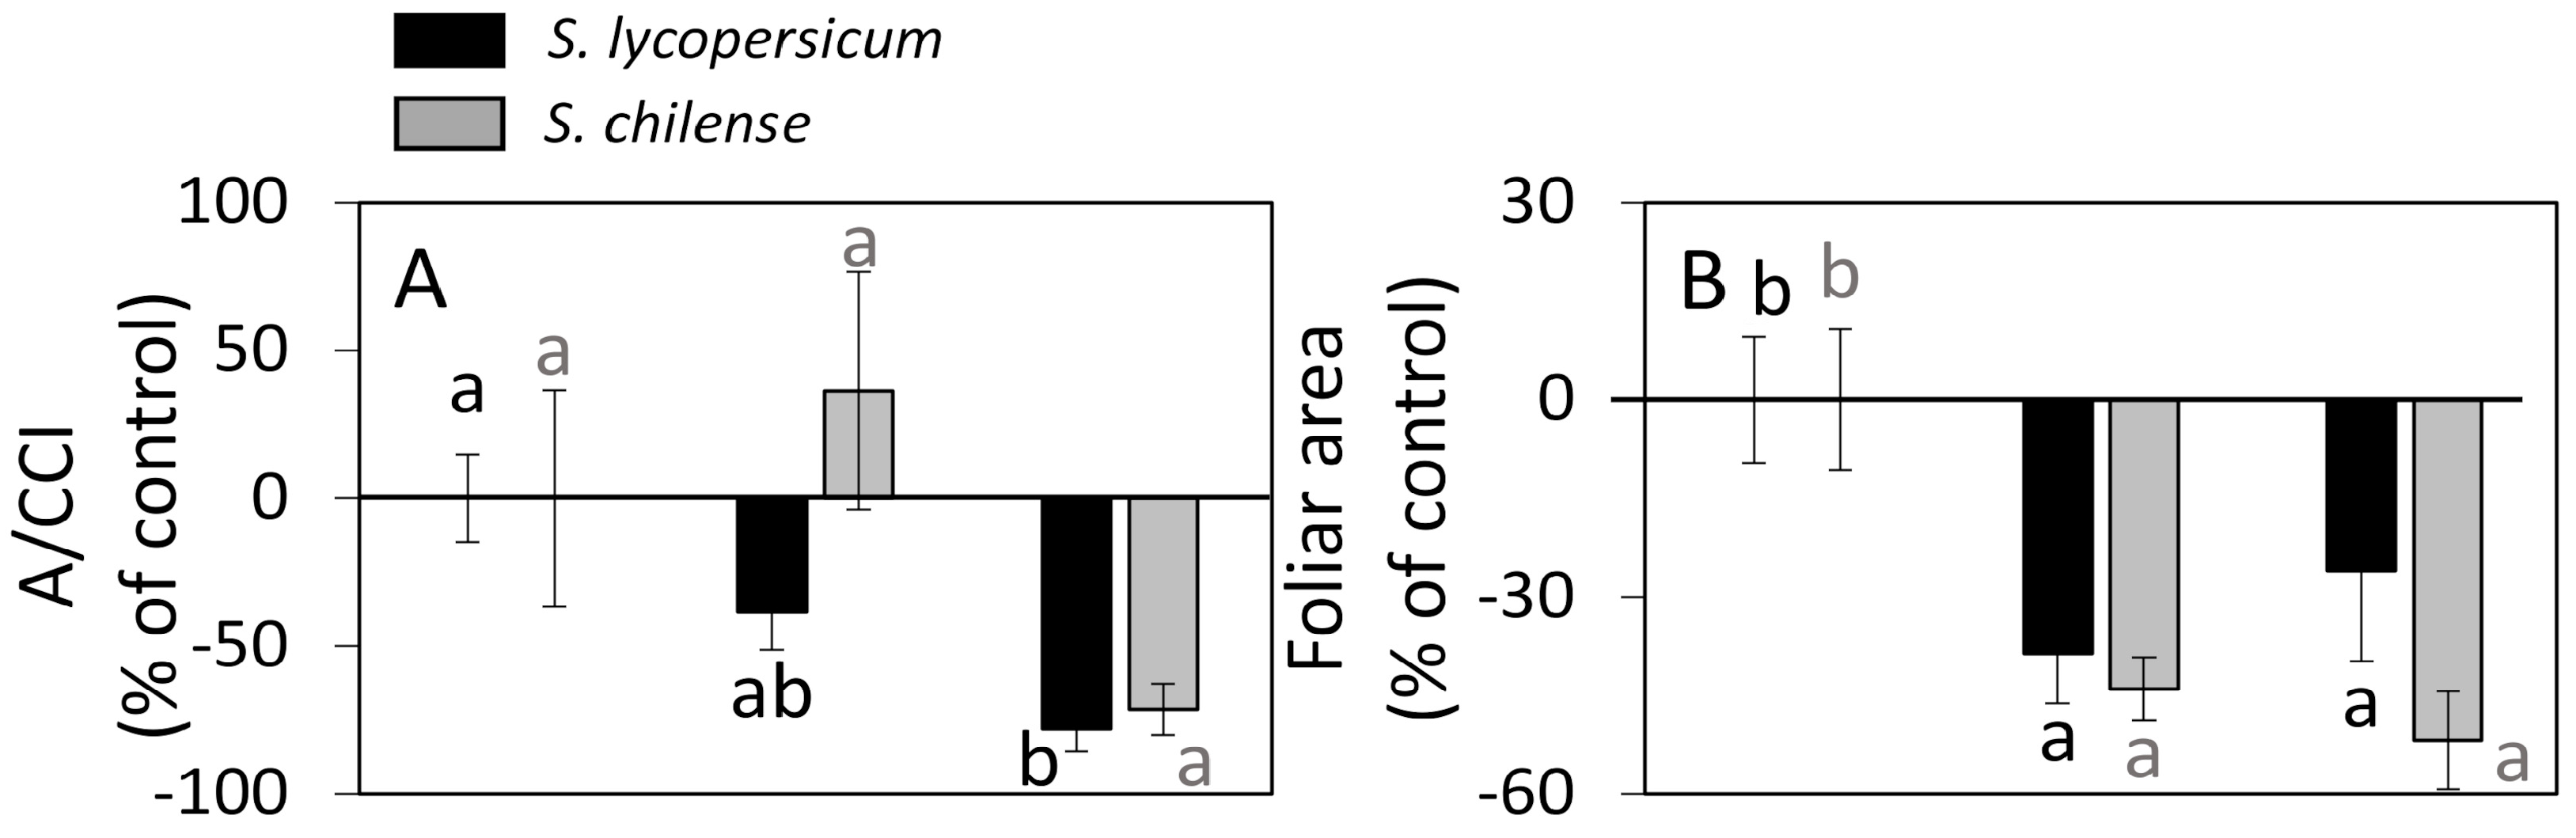
3.2. Vegetative and Reproductive Developments Under Salt Conditions

With the exception of the leaf, ramification, and inflorescence production on the main stem (Figure 1), the effects of salinity on the vegetative and reproductive parameters are expressed as relative values compared to control conditions (Figure 2 and Figure 3).
The vegetative growth of both species decreased with NaCl, showing a reduction in the number of leaves and ramifications (Figure 1A–D, Table S3), although this reduction was more gradual in S. lycopersicum than in S. chilense with NaCl concentration. Individual leaf area decreased with NaCl only in S. chilense, although there was also a tendency to decrease in S. lycopersicum (Figure 4B).
Salinity impaired the reproductive growth of both species with different effects depending on the species. The number of inflorescences on the main stem decreased in both species, with a greater effect on S. lycopersicum than on S. chilense (Figure 1E,F, Table S3). Sympodial flowering time was delayed in S. lycopersicum whereas initial flowering time was not altered by salt (Figure 2A, Table S3). Although inflorescence abortion was not significantly affected (Figure 3A, Table S3), flower abortion per inflorescence increased with salt in S. lycopersicum but not in S. chilense (Figure 3B, Table S3). Regarding flower fertility, the number of pollen grains decreased with salt only in S. chilense, while the other parameters were not significantly affected (Figure 2A, Table S3). Salt stress also modified the flower morphology: the sepal length decreased with salt in S. lycopersicum, while petal and stamen length tended to increase with salt in S. chilense (Figure 2A, Table S3).
Fruit growth and quality were almost not affected by salt in S. chilense, except for fruit FW, which decreased with salt (Figure 2B). However, salinity significantly affected S. lycopersicum fruits by decreasing fruit size, FW, DW, WC, seed number per fruit and increasing the fruit sugar concentration (Figure 2B).
Regarding photosynthesis parameters, salt significantly decreased A/CCI in S. lycopersicum (Table S2, Figure 4A).

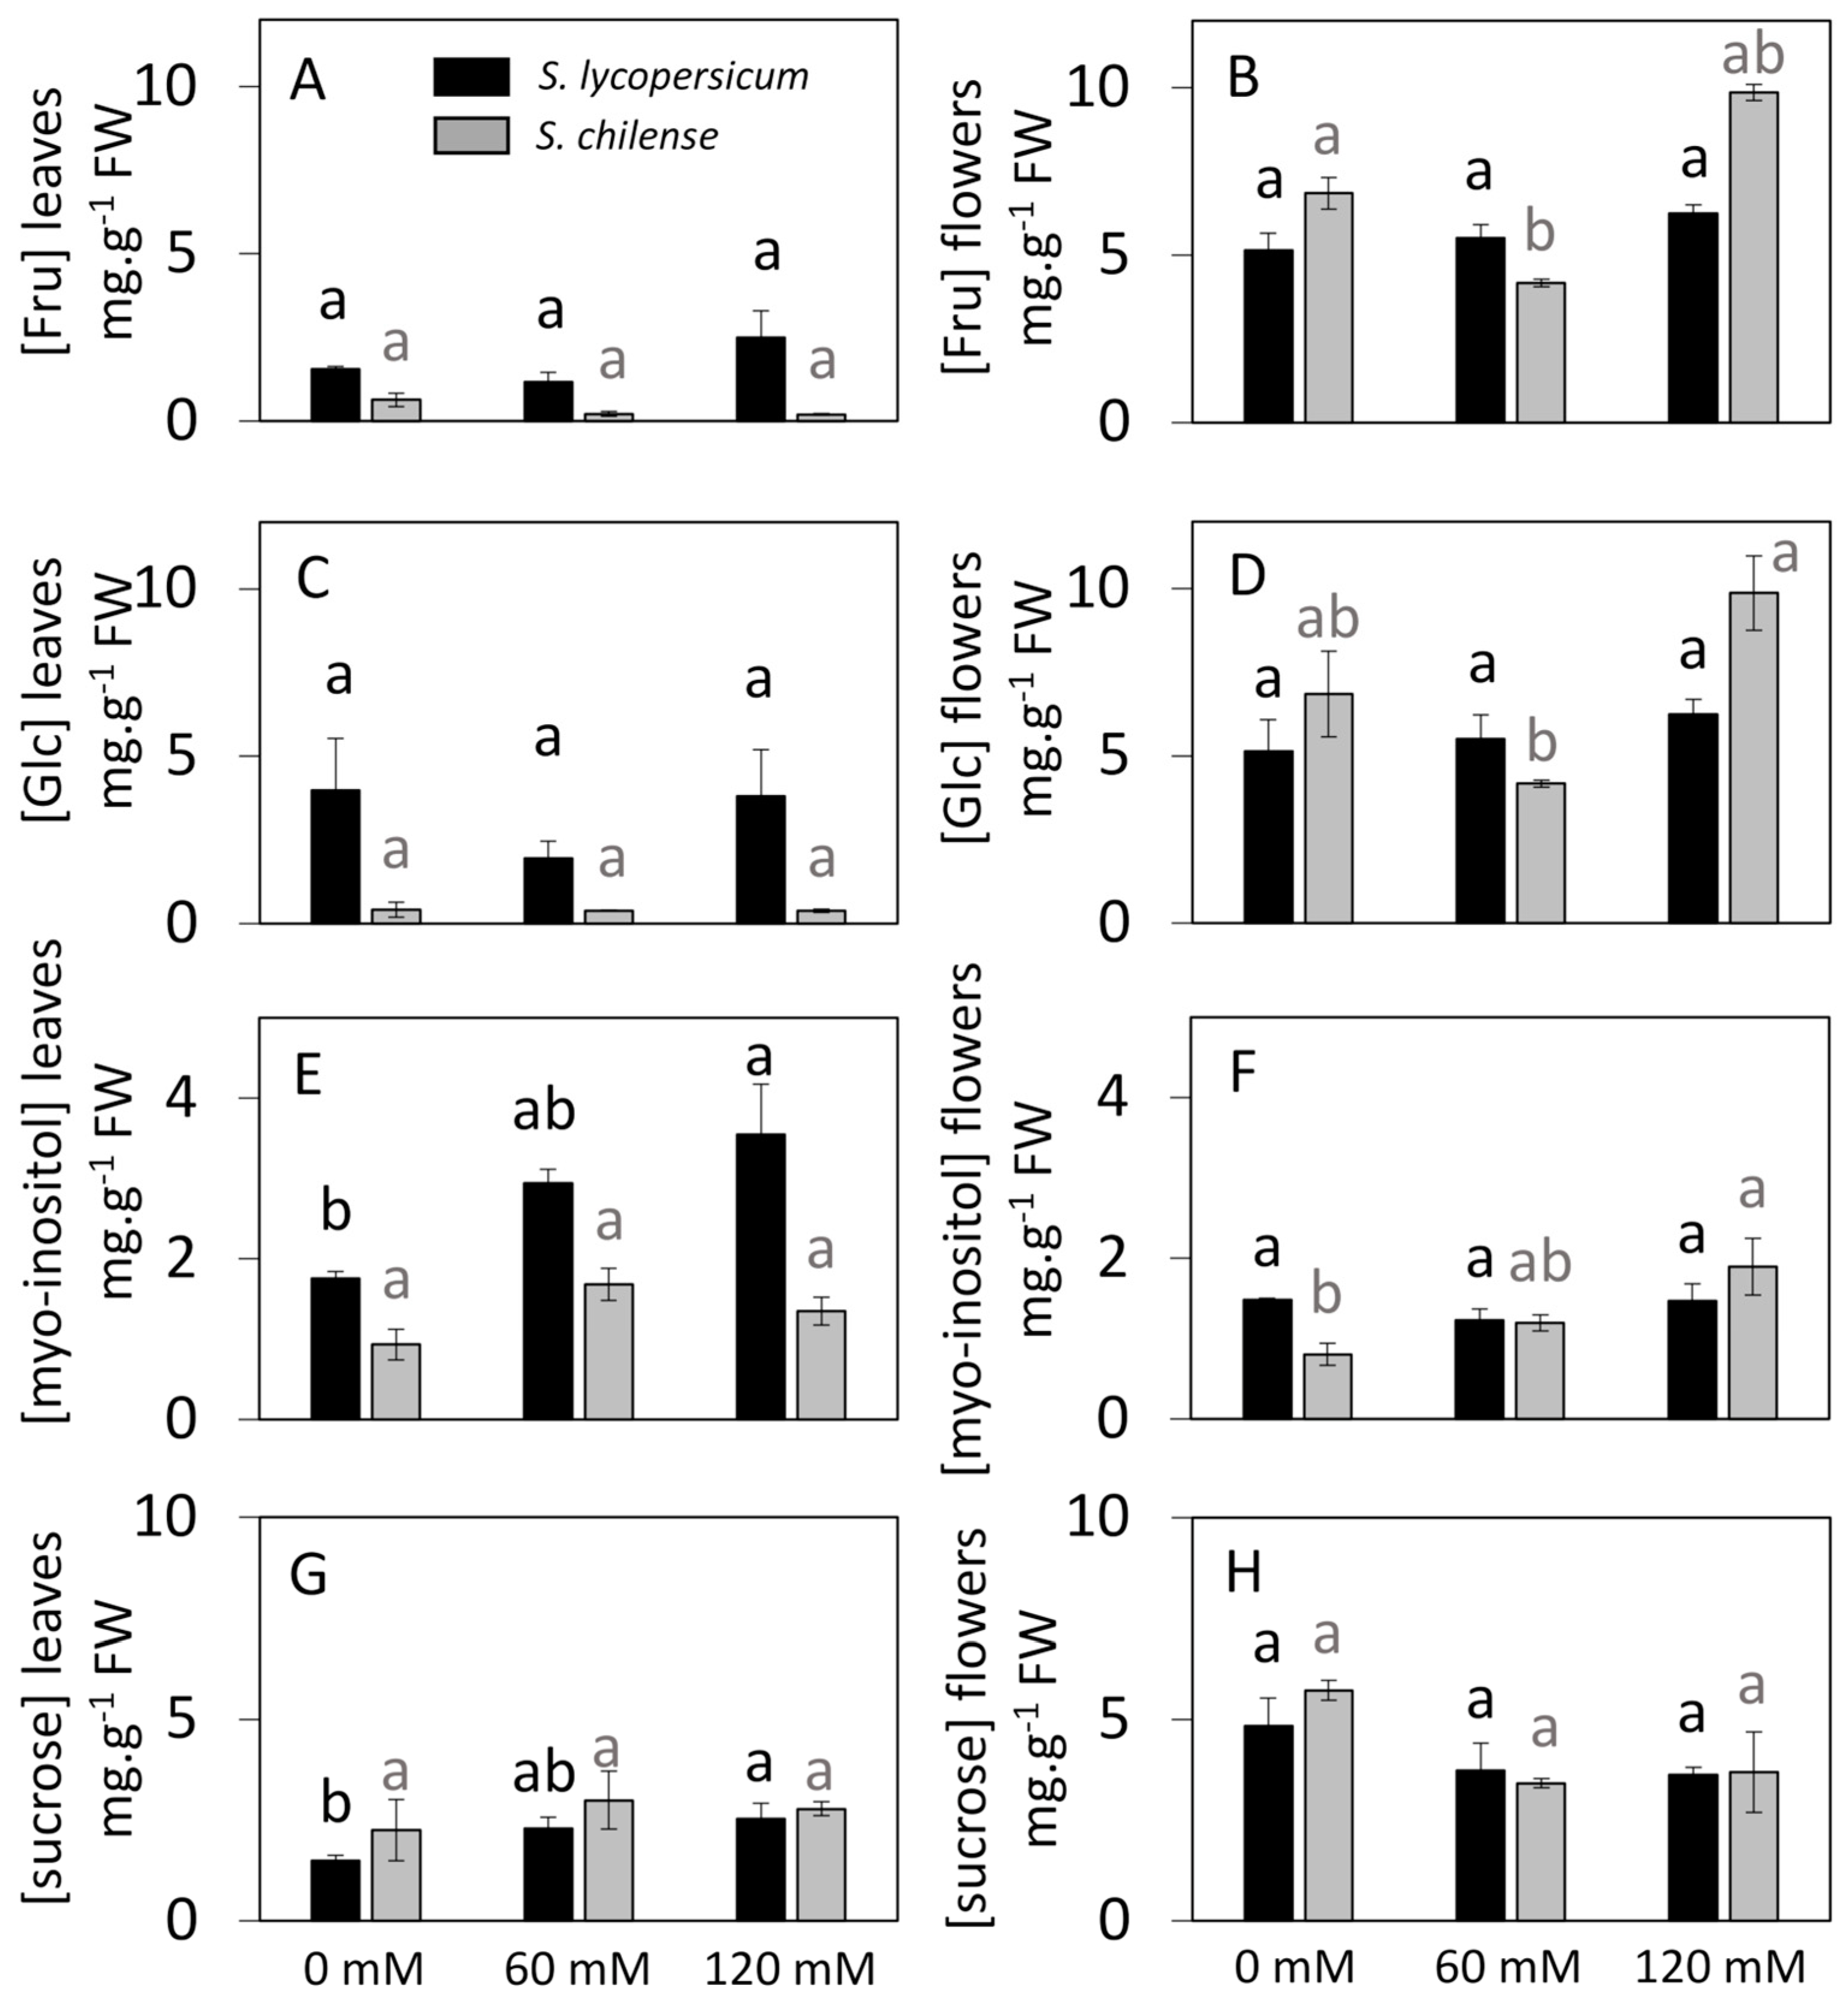
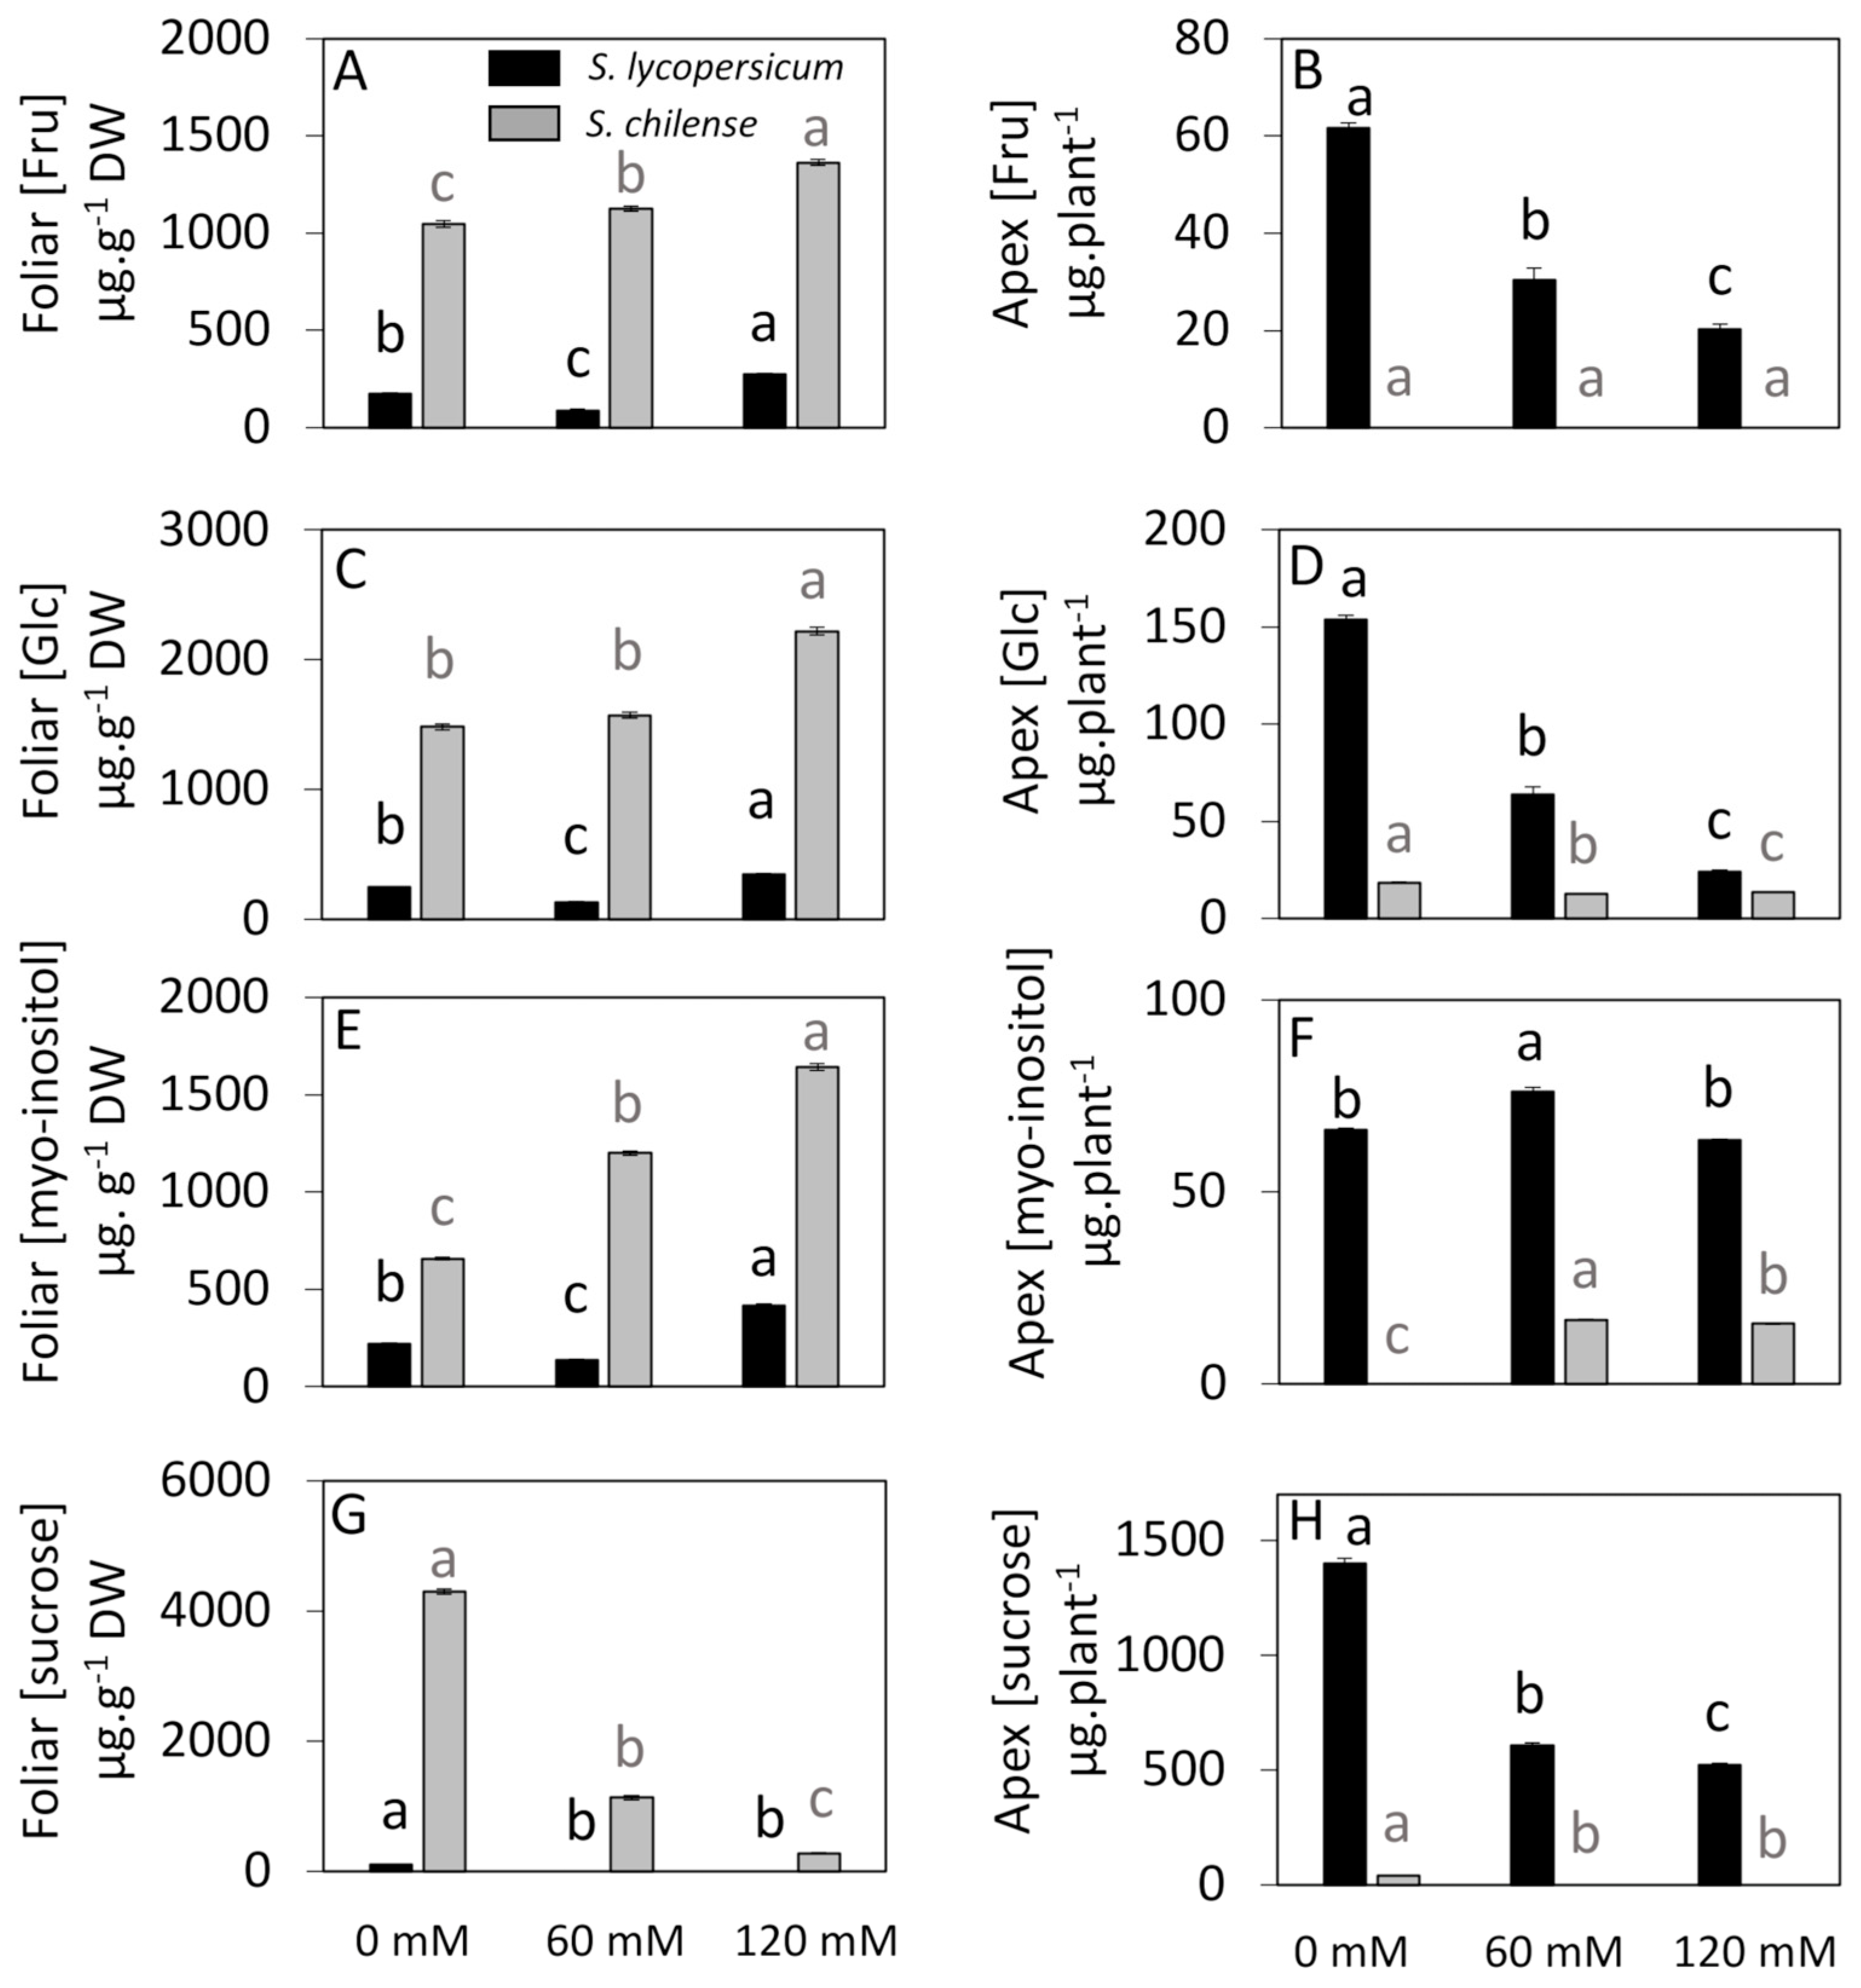
3.3. Sugar Concentrations and Distribution Under Control and Salt Conditions

The leaves of S. lycopersicum were more concentrated in fructose, glucose and myo-inositol than those of S. chilense while the sucrose concentration was similar in both species under both control and salt conditions. (Figure 5A,C,E,G, Table S3). In S. lycopersicum, glucose and fructose concentrations were stable at the different NaCl concentrations, whereas salt increased the concentrations of myo-inositol and sucrose (2-fold and 1.7-fold increase at 120 mM vs. 0 mM) (Figure 5A,C,E,G). In S. chilense, leaf sugar concentrations were stable at the different NaCl concentrations (Figure 5A,C,E,G).
In flowers, the concentration of fructose was higher in S. chilense than in S. lycopersicum and the concentration of the three other sugars was globally similar between the two species (Figure 5B,D,F,H, Table S3). However, we observed slightly lower glucose and sucrose concentrations and higher myo-inositol concentrations in S. lycopersicum flowers compared to S. lycopersicum under control conditions. The effect of NaCl on sugar concentrations in flowers was different from that in leaves. Salt did not affect the sugar concentrations in S. lycopersicum flowers, but it did in S. chilense (Figure 5B,D,F,H). In S. chilense, glucose and fructose concentrations decreased at 60 mM NaCl before increasing at 120 mM, and myo-inositol concentration increased gradually with salt (by 1.5 times between each NaCl concentration) (Figure 5B,D,E). However, the sucrose concentration in flowers was not modified in both species (Figure 5H).
In apical and foliar exudates, sugar concentrations varied depending on the sugar and the species. The concentrations of the 4 studied sugars were higher in the foliar exudates of S. chilense than in those of S. lycopersicum (Figure 6A,C,E,G, Table S3). The concentrations of fructose, glucose and myo-inositol increased with salt concentration in both species, with a higher increase in S. chilense than in S. lycopersicum between 0 and 120 mM NaCl (Figure 6A,C,E, Table S3). In contrast to the other sugars, the concentration of sucrose decreased already at 60 mM NaCl in the foliar exudates of both species (Figure 6G, Table S3).
In contrast to the foliar exudates, the concentrations of the 4 studied sugars in the apical exudates were higher in S. lycopersicum than in S. chilense (Figure 6B,D,F,H). The difference in sugar concentration in apical exudates between the two species was particularly marked under control conditions. Salt affected the sugar concentrations of the apical exudates in both species, except for fructose concentration in S. chilense (Figure 6B, Table S3). The glucose concentration decreased with NaCl in both species, but more drastically in S. lycopersicum (Figure 6D, Table S3). The myo-inositol concentration increased at 60 mM NaCl in both species (Figure 6F, Table S3), but decreased slightly at 120 mM NaCl. Sucrose decreased with NaCl in both species (Figure 6H, Table S3).

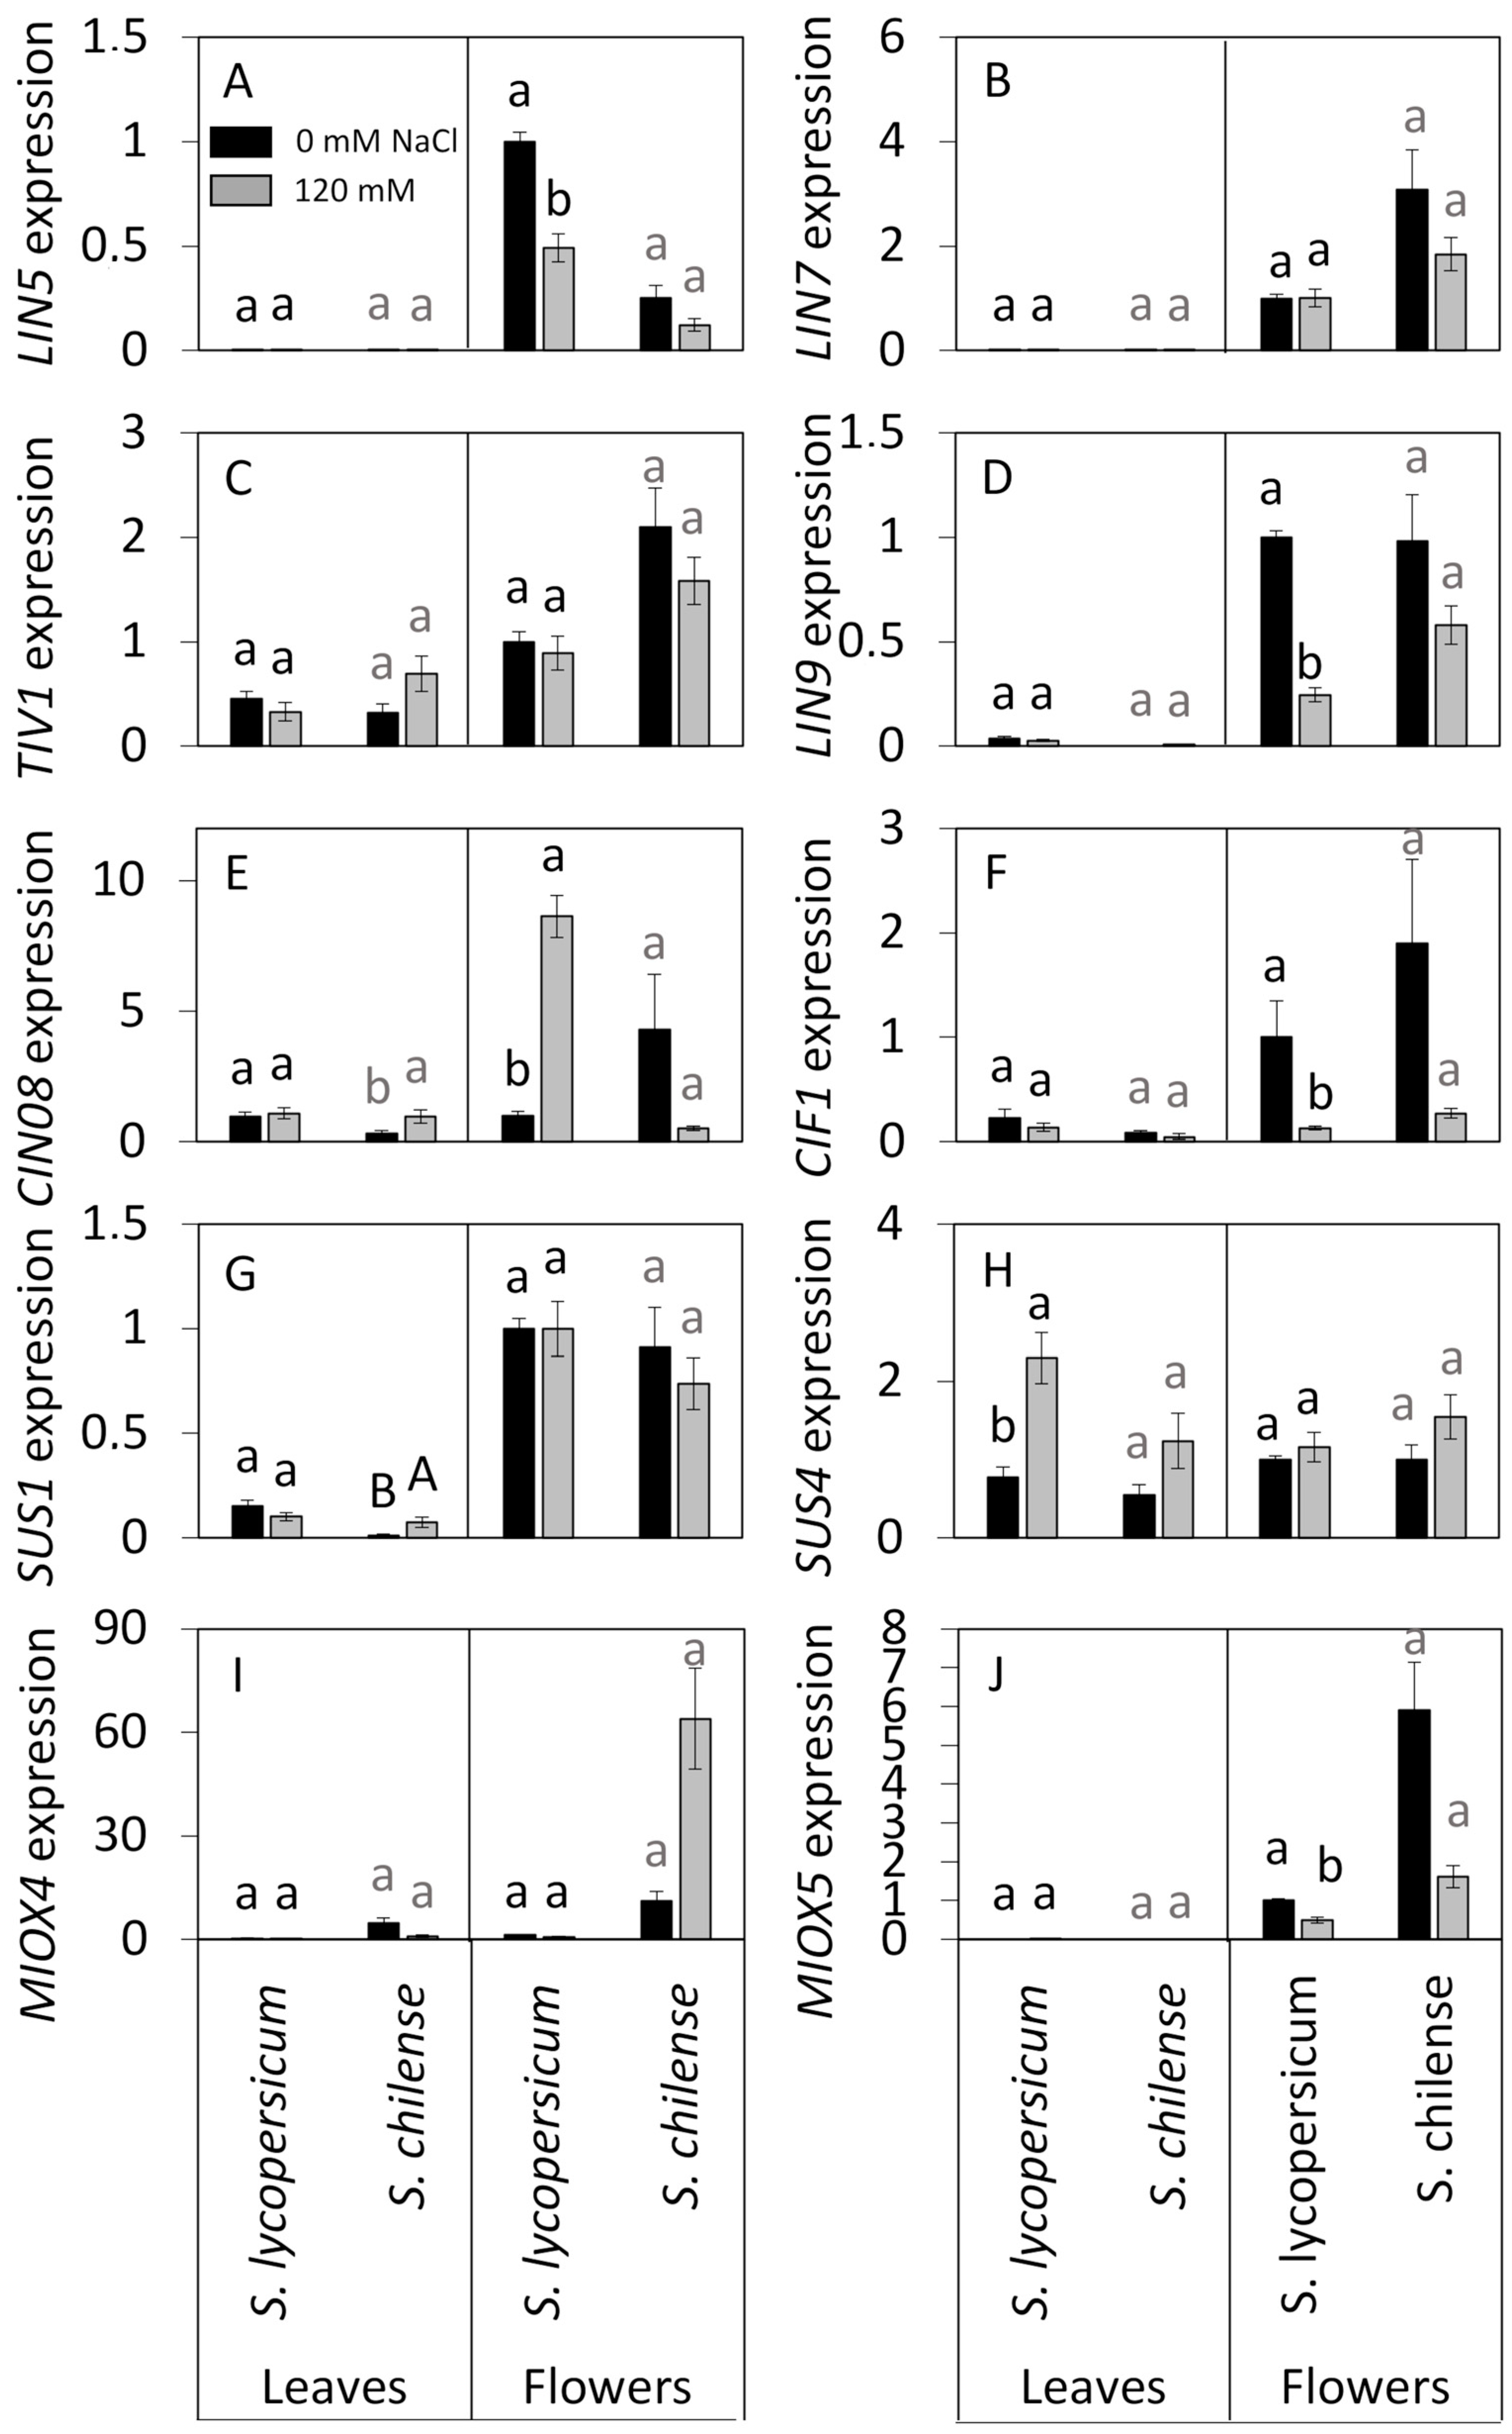
3.4. Expression Levels of Genes Involved in Sugar Metabolism Under Control and Salt Conditions

The studied genes were selected based on their function in sugar metabolism in inflorescences [4,40,41,42,43,44]. As expected, their expression levels were globally higher in flowers than in leaves (Figure 7A–J).
The expression levels of the cell wall invertases (CWIN), LIN5 and LIN7, were downregulated in leaves under NaCl treatment (Figure 7A,B, Table S3). In flowers, the expression level of LIN5 was higher in S. lycopersicum than in S. chilense (Figure 7A, Table S3), while it was opposite for LIN7, mainly under control conditions (Figure 7B, Table S3). The expression level of LIN5 decreased with NaCl in flowers of S. lycopersicum as compared to those of S. chilense, and the flower expression level of LIN7 was not affected by salt in the two species (Figure 7A,B, Table S3).
The expression level of the vacuolar invertases (VIN) TIV1 and LIN9 showed a downregulated pattern in leaves, with TIV1 having a higher expression than the other invertases in this organ (Figure 7A–E). The expression level of TIV1 was higher in flowers of S. chilense than in those of S. lycopersicum, while the expression level of LIN9 was similar in flowers of both species, mainly under control conditions (Figure 7C,D, Table S3). The expression level of TIV1 was not affected by salt whereas the expression of LIN9 was strongly downregulated by salt only in S. lycopersicum (Figure 7C,D, Table S3).
In leaves, the expression levels of the cytosolic invertase (CIN) CIN08 were similar in both species under control conditions but salt increased its expression only in S. chilense (Figure 7E, Table S3). In flowers, its expression was higher in S. chilense than in S. lycopersicum under control conditions while the opposite was true under salt conditions (Figure 7E). Salt increased the expression level of CIN08 in S. lycopersicum flowers (8-fold higher expression at 120 mM compared to 0 mM NaCl) (Figure 7E, Table S3).
In leaves, the expression level of the inhibitor of CWIN, CIF1, was higher in S. lycopersicum than in S. chilense (Figure 7F, Table S3). In flowers, its expression level was higher in S. chilense than in S. lycopersicum (Figure 7F, Table S3). Salt downregulated the expression of CIF1 in S. lycopersicum (Figure 7F, Table S3).
The expression levels of the sucrose synthase SUS1 were higher in flowers than in leaves, while the expression levels of SUS4 were similar in both organs (Figure 7G,H). In leaves, the expression levels of SUS1 and SUS4 were higher in S. lycopersicum than in S. chilense and salt upregulated SUS4 expression in S. lycopersicum and SUS1 expression in S. chilense (Figure 7G,H, Table S3). The SUS genes had stable expression levels in flowers regardless of the treatment and the species (Figure 7G,H, Table S3).
The expression levels of the myo-inositol oxygenases MIOX4 and MIOX5 were very low in leaves (Figure 7I,J). In flowers, MIOX4 expression level was also low in S. lycopersicum but it was higher in S. chilense, mainly under salt conditions. Salt did not significantly affect MIOX4 expression regardless of the treatment (Figure 7I, Table S3). The expression level of MIOX5 was also higher in the flowers of S. chilense than in those of S. lycopersicum, mainly under control conditions. The expression level of MIOX5 decreased with salt in the flowers of S. chilense (Figure 7J, Table S3).

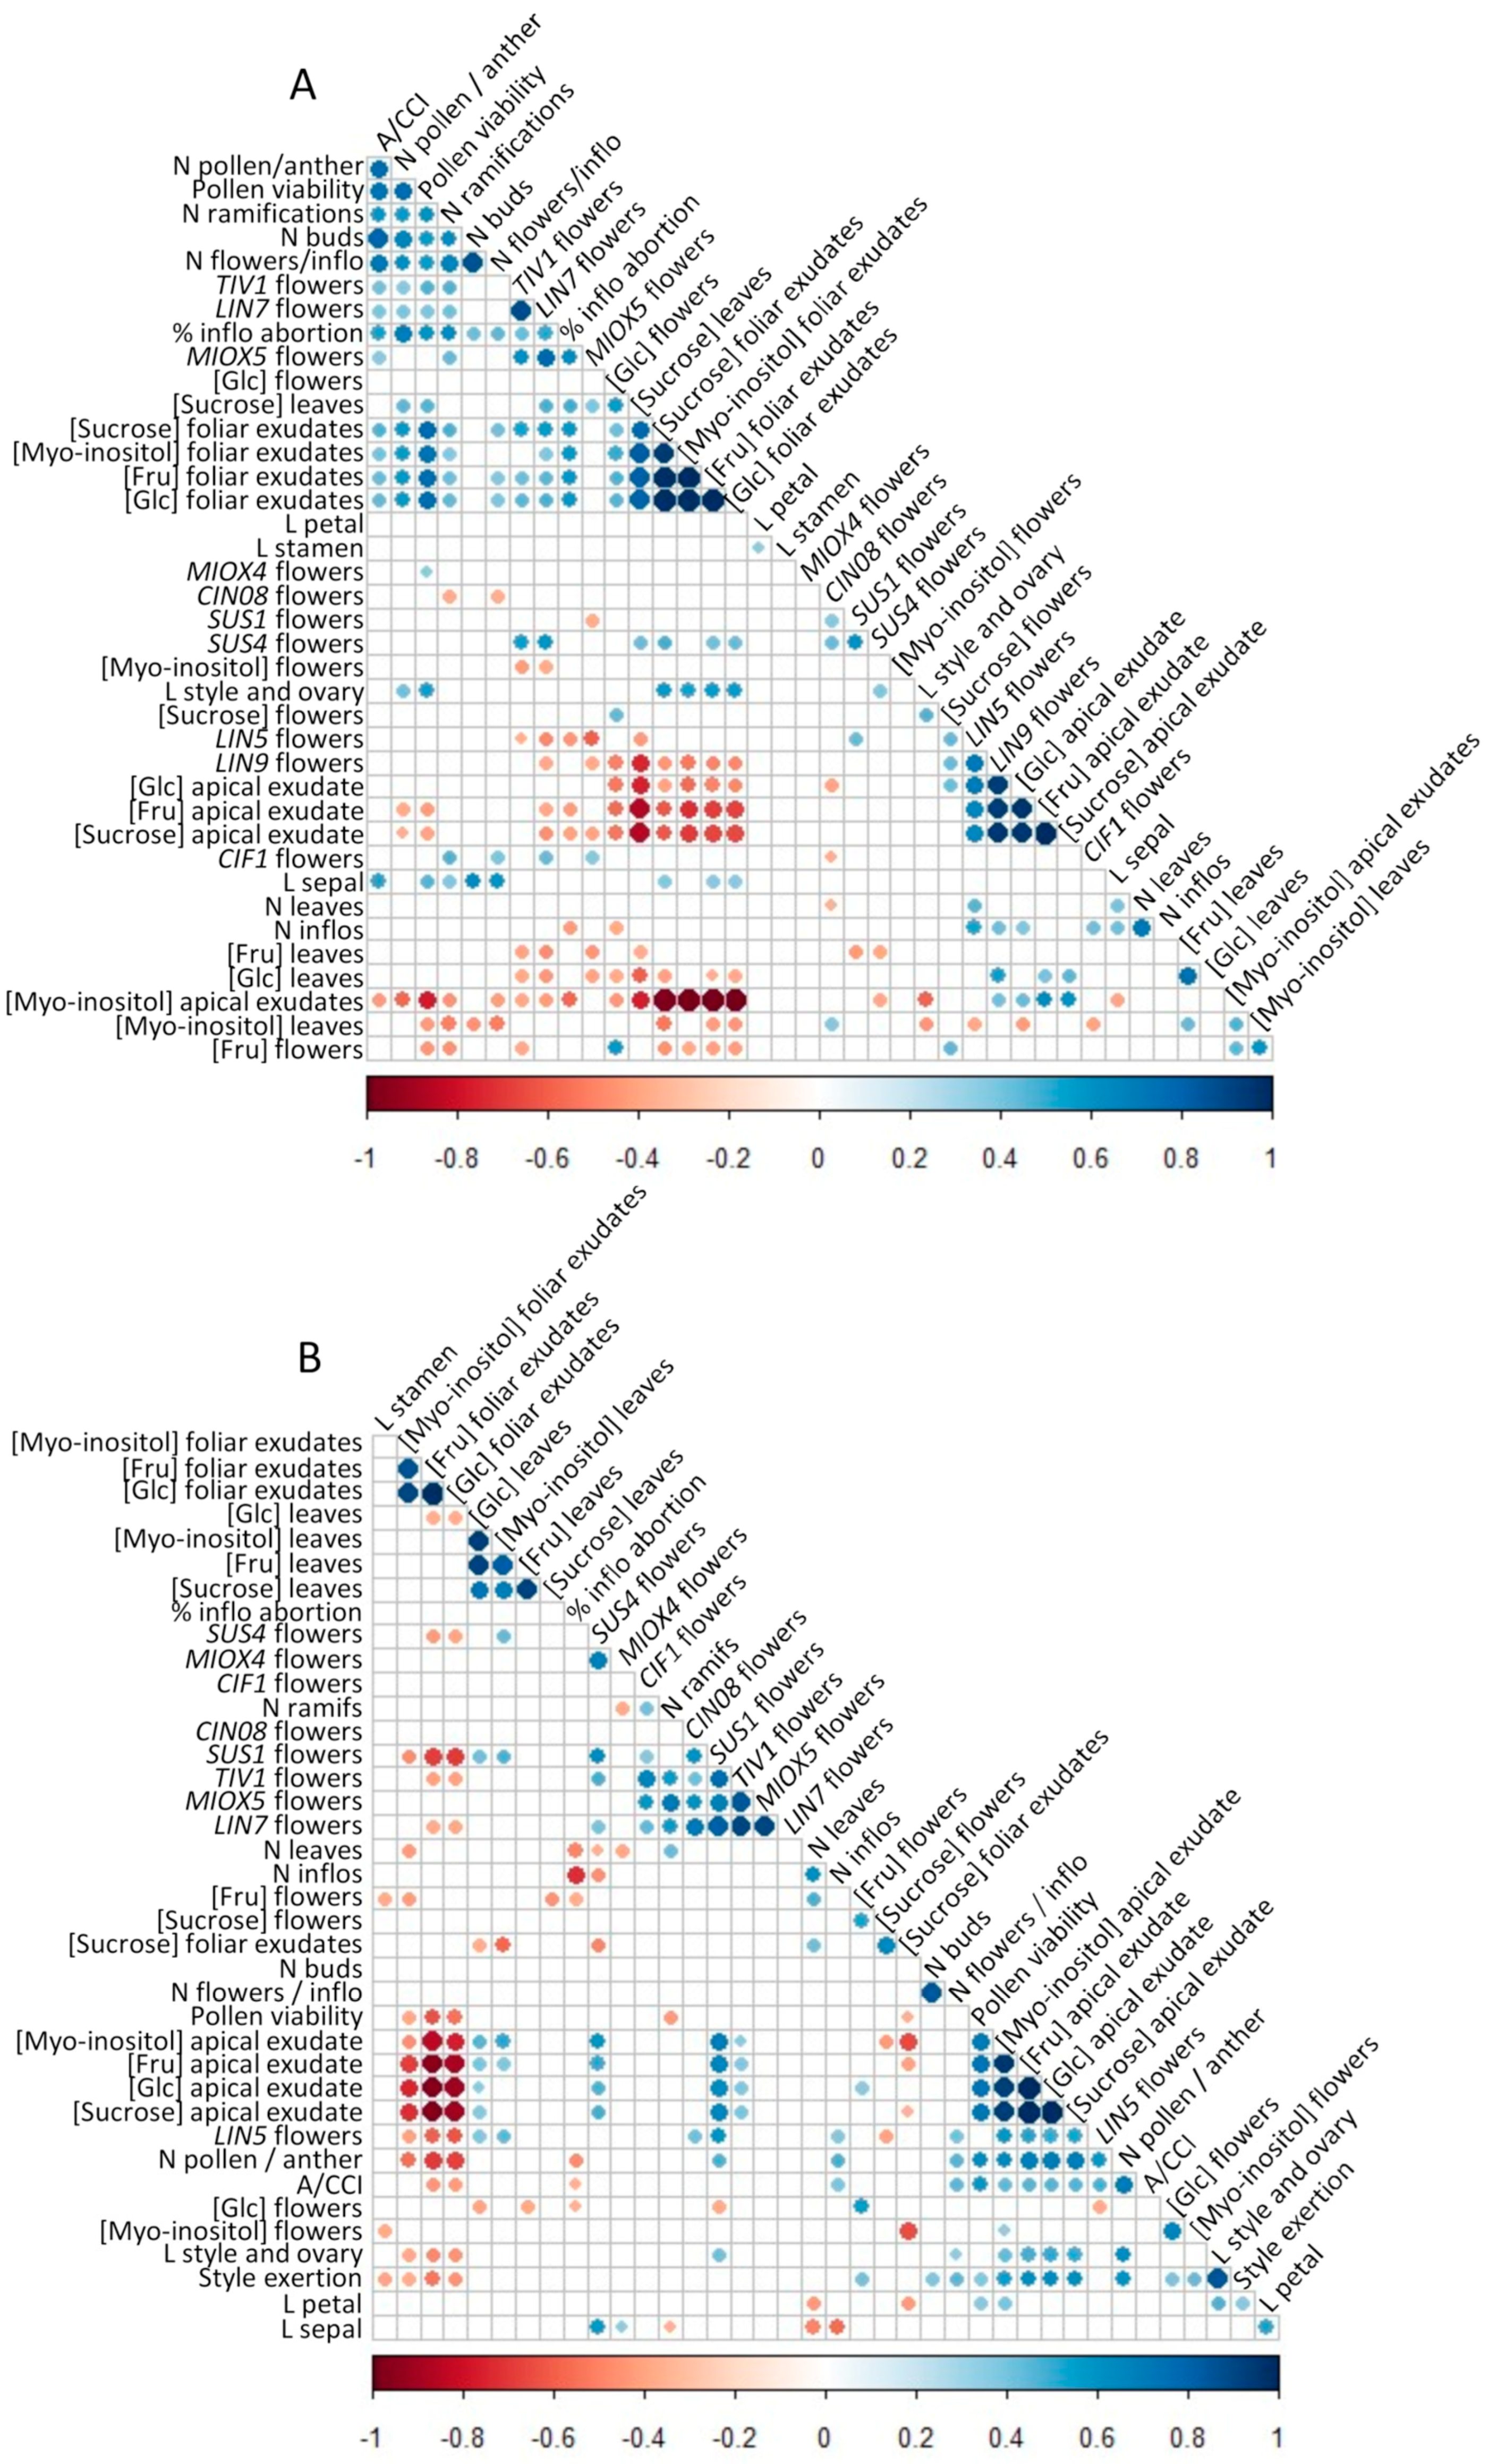
3.5. Correlations About Sugar Concentrations, Gene Expressions and Flower Fertility Parameters

Analyses of correlations among flower fertility parameters and sugar concentrations in flowers, leaves, apical and foliar exudates are shown in Figure 8. Correlations showed a different behavior between both species. Concerning S. lycopersicum, sucrose concentration in flowers was positively correlated with the number of pollen grains per anther and with the pollen viability, and the fructose concentration in flowers was negatively correlated with the pollen viability (Figure 8A). Nevertheless, no correlation was found between glucose concentration in flowers and flower fertility parameters. In S. chilense, the glucose and fructose concentrations in flowers were negatively correlated with the percentage of aborted inflorescences on the main stem, and positively with the style exertion (Figure 8B). Nevertheless, no other correlation was found between the concentrations of the three cited sugars in flowers and flower fertility parameters in S. chilense.
Generally, the correlations between the sugars concentrations and the genes expression were different between both species (Figure 8A,B). In S. lycopersicum, the expression levels of LIN5 and LIN9 were positively correlated with sucrose concentration in flowers but negatively correlated with sucrose concentration in leaves. By contrast, the expression level of LIN7 was positively correlated with the concentration of sucrose in leaves. The expression level of TIV1 was negatively correlated with concentration of fructose in flowers. In S. chilense, the expression of LIN5 was negatively correlated with the concentrations of sucrose and glucose in flowers. The expression level of SUS1 was negatively correlated with the concentration of glucose in the flowers.

4. Discussion

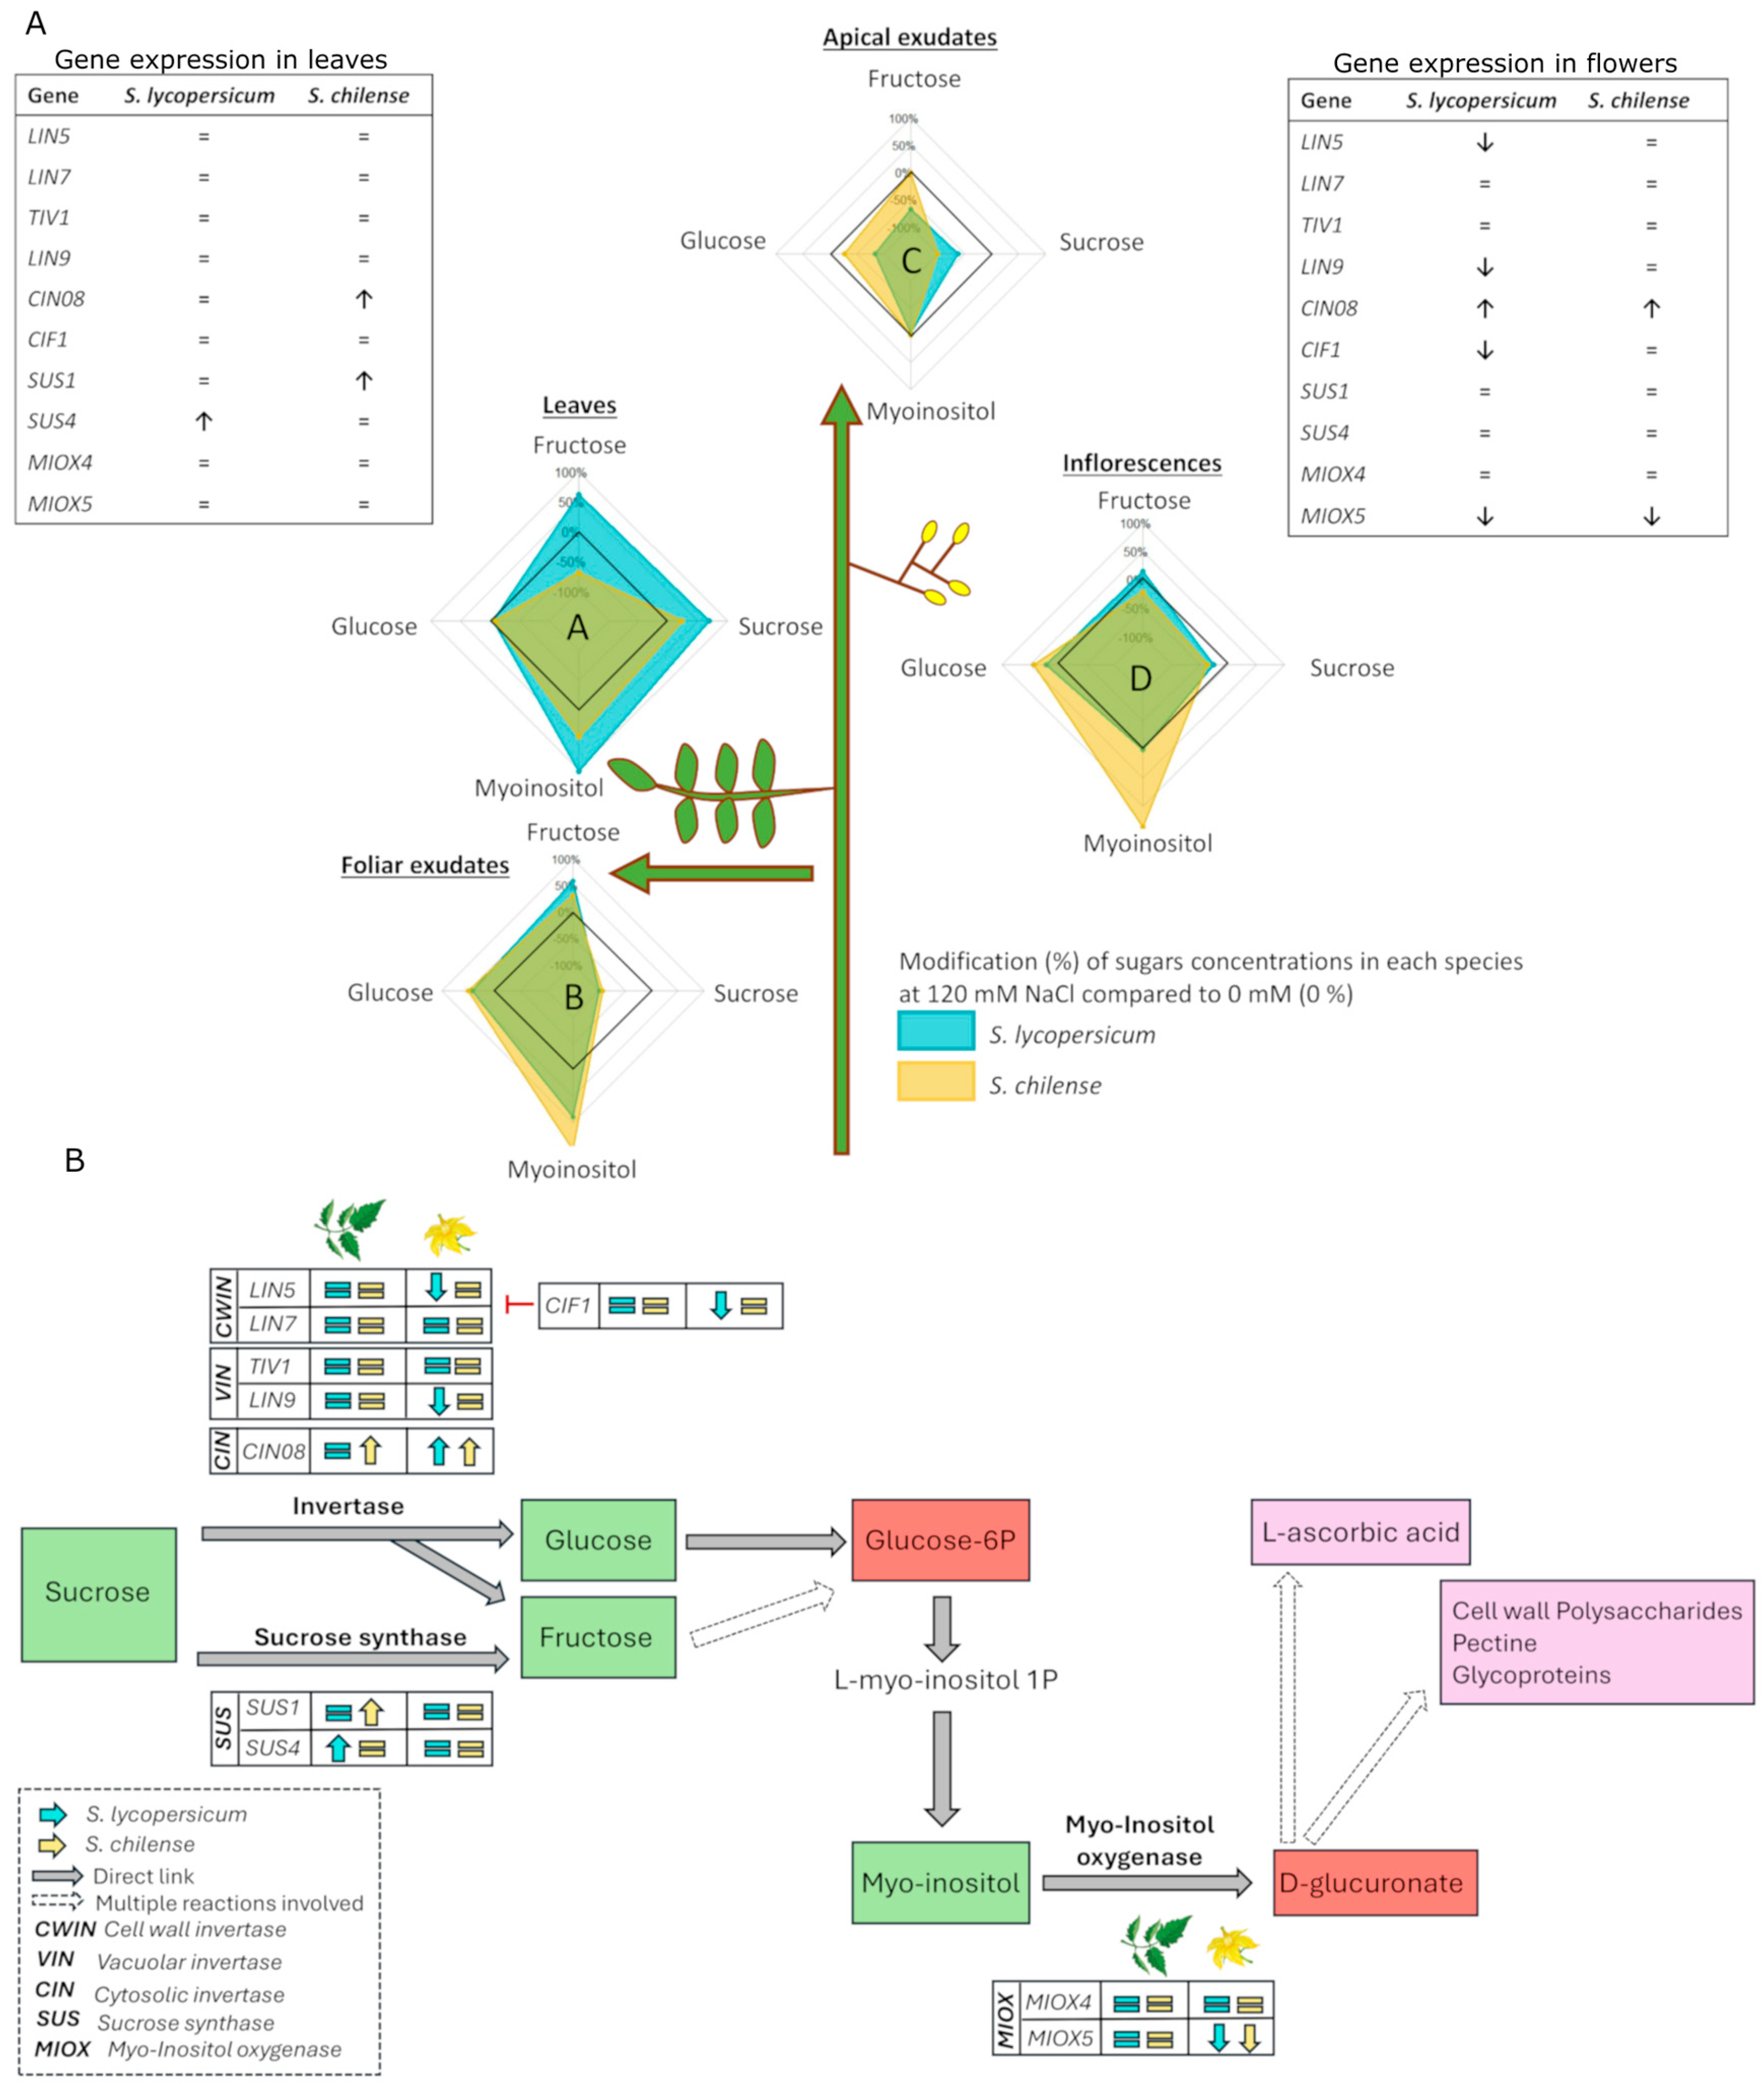
4.1. The Synthesis of Sugars Is Perturbed by Salt Stress and This Leads to a Modified Export of Sucrose from the Leaves

Salt stress induced a decrease in growth and photosynthesis performance, leading to a decrease in sugar synthesis. It also affected the proportion of the different sugars inside the same organ (Figure 9). Using our data, we could estimate the yield of net carbon assimilation at the plant level (Figure S2). This estimation showed that S. chilense was able to assimilate potentially at least 5 times more CO2 than S. lycopersicum, whatever the treatment (Figure S2). However, the leaf sugar concentration was not higher in S. chilense than in S. lycopersicum; it had to be mentioned that only soluble sugars were quantified, and that starch was not considered. In plants, starch is synthesized in leaves during the daytime from fixed carbon through photosynthesis and is mobilized at night to support continued respiration, sucrose export, and growth in the dark [49]. In this study, S. lycopersicum had a higher growth rate than S. chilense irrespective of salt treatment, these suggest that the higher sugar concentrations could be allocated to the maintenance of metabolism in this species, more than in S. chilense. However, the sugar concentration in the foliar exudates was higher in S. chilense than in S. lycopersicum, suggesting a higher sugar export from the leaves. This could support the hypothesis that S. chilense favors the import of sugars to sinks under unfavorable environmental conditions at the expense of source leaf development. Indeed, it has been suggested that slow-growing genotypes are more tolerant to environmental changes [50,51]. Moreover, it was previously shown that differences in salt tolerance between tomato genotypes could be related to differences in photoassimilates use and distribution [26].
Sucrose is the main carbon link between sources and sinks [52]. Salt increased the concentration of sucrose in the leaves of S. lycopersicum, but not in those of S. chilense, while it decreased the concentration of sucrose and increased the concentration of hexoses in the leaf exudates. Invertases and sucrose synthase play key roles in the conversion of sucrose to hexoses [5]. These enzyme activities were shown to be affected by salinity in tomato leaves [26]. However, the expression levels of the genes investigated in this study were almost not modified by salt stress in leaves. The expression levels of the cytosolic INV CIN08 and the sucrose synthase SUS1 increased with salt in S. chilense while the expression level of the sucrose synthase SUS4 increased with salt in S. lycopersicum. Hexoses transformed via INV are generally destined for storage in the vacuole whereas hexoses transformed via SUS, with hexokinases enzymes, enrich the hexose phosphate pool for glycolysis [5]. The increase of INV and SUS expression levels in source leaves could be a sign of an increased ability of the leaves to produce hexoses, which could be linked to the increase of hexoses concentrations in the foliar exudates, especially in S. chilense. Nevertheless, genes were chosen on the basis of flower expression levels, and the expression levels of leaf-specific genes were not measured. Thus, it cannot be excluded that genes encoding leaf-specific INV or SUS could be specifically expressed under salt conditions.

4.2. Salt Stress Induces a Slightly Modified Composition of Sugars in Flowers and Perturbs Flower Fertility

Sugar concentration was significantly higher in the leaf exudates in S. chilense than in S. lycopersicum, while the sugar amount was higher in the apical sap in the latter, suggesting a better sugar supply to the apex in S. lycopersicum. We observed that the stem diameter was lower in S. chilense than in S. lycopersicum, this might explain the low sugar level due to a lower sap volume. However, despite a difference in the sugar amount in the apex sap, the sugar concentrations in flowers were not very different between both species. In addition to the sugar supply through phloem, sepal photosynthesis also contributes to the sugar supply of the flowers [2]. In tomato, it has been shown that sepals are photosynthetically active but their role in flower filling is unknown [53]. Salt stress strongly decreased the sugar concentrations in the apex sap in S. lycopersicum but not in the flowers suggesting that the plant-maintained sugar supply to the developed flowers. In contrast to S. lycopersicum, salt affected the sugar concentration in the S. chilense flowers since the concentration of fructose and glucose decreased at 60 mM NaCl but increased at 120 mM NaCl. This suggests again that the plant maintained the sugar supply to the developed flowers at high NaCl concentration. However, we recognize that the maintenance of sugar concentration in the developed flowers was at the expense of the development of other flowers as indicated by the increase in inflorescence and flower abortion due to salt stress. Multiple sinks compete for the available photoassimilates, generating a priority system among them [54,55].
The increase of inflorescence abortion due to salt stress has been suggested to be linked to a perturbed sugars repartition and invertases inhibition, notably because of a low carbon flux to the anthers [15,56]. In our study, the percentage of abortion of inflorescences was linked with the sucrose concentration in flowers in S. chilense. Nevertheless, the only invertases whose expression level was decreased by salt stress in flowers were LIN5 and LIN9 in S. lycopersicum. Invertases catalyze the hydrolysis of sucrose into glucose and fructose (Figure 9B). LIN5 is known to be expressed in ovaries and LIN9 in flowers [57,58]. In S. pennellii, LIN5 is involved in the transport of photoassimilates to the fruit [55]. The expression level of LIN9 was already shown to be downregulated in presence of NaCl [58]. In S. lycopersicum, the inflorescence abortion was also correlated with the concentration of sucrose in the leaves. There was indeed an increase in sucrose concentration in the leaves of S. lycopersicum but a decrease of its concentration in foliar and apical exudates, indicating maybe a lack of export of sucrose out of the leaves, inducing an increase in inflorescence abortion. Consequently, considering our results (fewer sugars leaving the leaves, not higher sugar import into the flowers), the repartition of sugars between sinks could be perturbed during salt stress, inducing a lack of sugars to develop new inflorescences. Moreover, the expression of the SUS genes was not increased by salt in flowers in none of the species, suggesting that salt stress did not induce an increase of the sink strength [5]. Sucrose synthase participates in the reversible reaction of sucrose conversion to uridine diphosphate-glucose and fructose (Figure 9B), and is a key determinant fruit sink strength [5].
In S. lycopersicum, the correlation between the pollen parameters and the concentration of fructose and sucrose suggested an implication of these sugars in the pollen development of tomato. Sugar metabolism is indeed essential for pollen development and male fertility [59]. However, despite a modification of the concentrations of those sugars by salt in S. chilense flowers, no such correlations were observed in this species. Overall, the repartition of glucose, saccharose and sucrose in the flowers did not seem to affect the fertility parameters in our study. However, it should be noted that flower fertility parameters were little affected by salt in our study, which may explain the lack of correlations. It would have been interesting to measure sugars separately in the different reproductive organs to confirm a possible link between sugar levels in the stamens and pollen production and viability. Indeed, male fertility is often considered to be more affected by stress than female fertility [60]. We have not quantified sugars in fruit either, but Zhang et al. [55] suggested a negative correlation between fruit sugar content, fruit size and the number of seeds per fruit in tomato species.
In addition to modification of fructose and glucose concentrations in S. chilense flowers by salt, the concentration of myo-inositol increased in the apical exudates and in the flowers of this species in response to salt stress. Myo-inositol is a sugar synthesized from glucose-6-phosphate and is catabolized in D-glucuronic acid by myo-inositol oxygenases (MIOX) [43] (Figure 9B). Five MIOX genes are present in tomato [61]. Myo-inositol is involved in several metabolic pathways, including the biosynthesis of ascorbic acid [62]. In tomato, it has been reported that the increase in expression level of MIOX4 induced the increase in ascorbic acid content in fruits [61]. Therefore, the increase of myo-inositol could be a reaction of defense towards salt stress: indeed, increasing the concentration of myo-inositol in flowers could be a way to increase the ascorbic acid content and thereby increasing the salt tolerance of S. chilense, as reported in [18]. However, MIOX4 expression level stayed stable and MIOX5 expression level decreased in S. chilense with salt increase in our study, suggesting that myo-inositol would not contribute to a higher ascorbic acid content in S. chilense flowers but could rather be used to perform osmotic adjustment. Indeed, it has been shown that some species could use myo-inositol or its metabolites to maintain the osmotic balance [63]. However, the role of myo-inositol in salt response in tomato needs further investigation.
Balibrea et al. [26] suggested that the plant growth maintenance under salinity could be due to an efficient regulation of carbon allocation and partitioning in sink organs rather than to a high photosynthetic activity. In our study, the number of flowers per inflorescence was positively correlated with the photosynthetic capacity in both species, suggesting that the yield could be related to the photosynthetic performance of the plant and not only due to instability of sources/sinks relationship. However, it is important to note that other factors such as ion toxicity, oxidative stress and hormonal regulation may affect flower development and fertility [17,19,21,64]. In fact, the effect of salt stress is multifaceted [64] and explaining its impact on reproductive stage only from the perspective of carbohydrate metabolism may not be comprehensive enough.

5. Conclusions

The aim of this study was to compare the effects of salt stress on the sugar metabolism of S. chilense and S. lycopersicum and its relations to changes in flower production and fertility. Salinity increased myo-inositol and sucrose concentrations in S. lycopersicum leaves, but only slightly altered sugar concentrations in flowers. The concentration of sucrose in the foliar exudates was higher in S. chilense as compared to S. lycopersicum, indicating a higher export of sucrose from the leaves. These results suggest that S. lycopersicum maintains better metabolic function under salt stress, while S. chilense sustains sugar import to sink organs. The concentrations of sugars in flowers were only slightly related to the observed decrease in flower fertility and flower production. Flower sugar concentrations were correlated with pollen production and viability in S. lycopersicum and with inflorescence abortion in S. chilense. Altogether, our results suggest that the link between the decrease of fertility during salt stress is based on competition mechanisms between the different sinks, but may also be based on other mechanisms such as ion toxicity.

Supplementary Materials

The following supporting information can be downloaded at: https://www.mdpi.com/article/10.3390/horticulturae11030285/s1, Figure S1. Schematic flowchart of the experimental design. The timeline is shown in days before stress imposition (DBSt) for plant growth and days after stress imposition (DASt) following treatment application. Both experimental replicates (Year 1 and Year 2) are included, with key dates indicated for each methodological stage; Figure S2. Potential yield of net carbon assimilation (A, µmol.s−1) calculated by the following equation: foliar area (m2) X number of leaves at 49 days after stress imposition (DASt) X (number of ramifications at 49 DASt + 1) X photosynthetic nitrogen use efficiency (A/CCI, µmol.m2.s−1); Table S1. List of genes used in the study and characteristics of their primers; Table S2. Values of the morphological measurements and reproductive parameters at 0 mM NaCl; Table S3. Statistical analyses of the studied parameters. ANOVA 2 were performed after a check of normality and homoscedasticity. If conditions were not met, a data transformation was performed.

Author Contributions

Conceptualization, S.B., M.Q., S.L. and J.P.M.; methodology, S.B. and M.Q.; formal analysis, S.B.; investigation, S.B.; resources, S.B.; data curation, S.B. and M.Q.; writing—original draft preparation, S.B. and M.Q.; writing—review and editing, S.B., S.L., J.P.M. and M.Q.; visualization, S.B.; supervision, M.Q.; project administration, M.Q., S.L. and J.P.M.; funding acquisition, M.Q., S.L. and J.P.M. All authors have read and agreed to the published version of the manuscript.

Funding

This research was funded by the Belgian “Fonds National de la Recherche Scientifique (FRS-FNRS), grant number CDR J.0136.19, the FSR-UCLouvain 2018–2020, the Development and Research National Agency (ANID) of the Ministry of Science and Technology of Chile grant number FONDECYT n° 1220909, and by the WBI/Chili project number RI 13.

Data Availability Statement

The original contributions presented in this study are included in the article and Supplementary Materials. Further inquiries can be directed to the corresponding author.

Acknowledgments

The authors are grateful to Brigitte Van Pee, Hélène Dailly, Matthieu Leclercq, Marie-Eve Renard and Igor de le Vingne for technical support, and thank Emmanuel Iwuala for English proofreading.

Conflicts of Interest

The authors declare no conflicts of interest.

References

  1. Earley, E.J.; Ingland, B.; Winkler, J.; Tonsor, S.J. Inflorescences Contribute More than Rosettes to Lifetime Carbon Gain in Arabidopsis thaliana (Brassicaceae). Am. J. Bot. 2009, 96, 786–792. [Google Scholar] [CrossRef]
  2. Brazel, A.J.; Ó’Maoiléidigh, D.S. Photosynthetic Activity of Reproductive Organs. J. Exp. Bot. 2019, 70, 1737–1754. [Google Scholar] [CrossRef] [PubMed]
  3. Borghi, M.; Fernie, A.R. Outstanding Questions in Flower Metabolism. Plant J. 2020, 103, 1275–1288. [Google Scholar] [CrossRef] [PubMed]
  4. Li, Z.; Palmer, W.M.; Martin, A.P. High Invertase Activity in Tomato Reproductive Organs Correlates with Enhanced Sucrose Import into, and Heat Tolerance of, Young Fruit. J. Exp. Bot. 2012, 63, 1155–1166. [Google Scholar] [CrossRef]
  5. Beckles, D.M.; Hong, N.; Stamova, L.; Luengwilai, K. Biochemical Factors Contributing to Tomato Fruit Sugar Content: A Review. Fruits 2012, 67, 49–64. [Google Scholar] [CrossRef]
  6. Osorio, S.; Ruan, Y.-L.; Fernie, A.R. An Update on Source-to-Sink Carbon Partitioning in Tomato. Front. Plant Sci. 2014, 5, 0516. [Google Scholar] [CrossRef]
  7. Ruan, Y.-L.; Jin, Y.; Yang, Y.-J. Sugar Input, Metabolism, and Signaling Mediated by Invertase: Roles in Development, Yield Potential, and Response to Drought and Heat. Mol. Plant 2010, 3, 942–955. [Google Scholar] [CrossRef]
  8. Smith, M.R.; Rao, I.M.; Merchant, A. Source-Sink Relationships in Crop Plants and Their Influence on Yield Development and Nutritional Quality. Front. Plant Sci. 2018, 9, 1889. [Google Scholar] [CrossRef]
  9. Munns, R.; Tester, M. Mechanisms of salinity tolerance. Annu. Rev. Plant Biol. 2008, 59, 651–681. [Google Scholar] [CrossRef]
  10. Munns, R.; Day, D.A.; Fricke, W. Energy costs of salt tolerance in crop plants. New Phytol. 2020, 225, 1072–1090. [Google Scholar] [CrossRef]
  11. Khan, H.A.; Siddique, K.H.M.; Colmer, T.D. Vegetative and Reproductive Growth of Salt-Stressed Chickpea Are Carbon-Limited: Sucrose Infusion at the Reproductive Stage Improves Salt Tolerance. J. Exp. Bot. 2017, 68, 2001–2011. [Google Scholar] [CrossRef] [PubMed]
  12. Ma, X.; Su, Z.; Ma, H. Molecular Genetic Analyses of Abiotic Stress Responses during Plant Reproductive Development. J. Exp. Bot. 2020, 71, 2870–2885. [Google Scholar] [CrossRef] [PubMed]
  13. Sato, S.; Kamiyama, M.; Iwata, T. Moderate Increase of Mean Daily Temperature Adversely Affects Fruit Set of Lycopersicon Esculentum by Disrupting Specific Physiological Processes in Male Reproductive Development. Ann. Bot. 2006, 97, 731–738. [Google Scholar] [CrossRef]
  14. Martínez, J.-P.; Antúnez, A.; Pertuzé, R.; Acosta, M.D.P.; Palma, X.; Fuentes, L.; Ayala, A.; Araya, H.; Lutts, S. Effects of Saline Water on Water Status, Yield and Fruit Quality of Wild (Solanum chilense) and Domesticated (Solanum lycopersicum Var. cerasiforme) Tomatoes. Exp. Agric. 2012, 48, 573–586. [Google Scholar] [CrossRef]
  15. Ghanem, M.E.; Elteren, J.; Albacete, A. Impact of Salinity on Early Reproductive Physiology of Tomato (Solanum lycopersicum) in Relation to a Heterogeneous Distribution of Toxic Ions in Flower Organs. Funct. Plant Biol. 2009, 36, 125–136. [Google Scholar] [CrossRef] [PubMed]
  16. Romero-Aranda, M.R.; González-Fernández, P.; Pérez-Tienda, J. Na+ Transporter HKT1;2 Reduces Flower Na+ Content and Considerably Mitigates the Decline in Tomato Fruit Yields under Saline Conditions. Plant Physiol. Biochem. 2020, 154, 341–352. [Google Scholar] [CrossRef]
  17. Bigot, S.; Pongrac, P.; Šala, M.; van Elteren, J.T.; Martínez, J.-P.; Lutts, S.; Quinet, M. The Halophyte Species Solanum chilense Dun. Maintains Its Reproduction despite Sodium Accumulation in Its Floral Organs. Plants 2022, 11, 672. [Google Scholar] [CrossRef]
  18. Martínez, J.P.; Fuentes, R.; Farías, K. Effects of salt stress on fruit antioxidant capacity of wild (Solanum chilense) and domesticated (Solanum lycopersicum var. cerasiforme) tomatoes. Agronomy 2020, 10, 1481. [Google Scholar] [CrossRef]
  19. Tassoni, A.; Franceschetti, M.; Bagni, N. Polyamines and Salt Stress Response and Tolerance in Arabidopsis thaliana Flowers. Plant Physiol. Biochem. 2008, 46, 607–613. [Google Scholar] [CrossRef]
  20. Ma, L.; Liu, X.; Lv, W.; Yang, Y. Molecular Mechanisms of Plant Responses to Salt Stress. Front. Plant Sci. 2022, 13, 934877. [Google Scholar] [CrossRef]
  21. Sulpice, R.; Tsukaya, H.; Nonaka, H.; Mustardy, L.; Chen, T.H.H.; Murata, N. Enhanced Formation of Flowers in Salt-Stressed Arabidopsis after Genetic Engineering of the Synthesis of Glycine Betaine. Plant J. 2003, 36, 165–176. [Google Scholar] [CrossRef] [PubMed]
  22. Khatun, S.; Flowers, T.J. Effects of Salinity on Seed Set in Rice. Plant Cell Environ. 1995, 18, 61–67. [Google Scholar] [CrossRef]
  23. Albacete, A.A.; Martínez-Andújar, C.; Pérez-Alfocea, F. Hormonal and Metabolic Regulation of Source–Sink Relations under Salinity and Drought: From Plant Survival to Crop Yield Stability. Biotechnol. Adv. 2014, 32, 12–30. [Google Scholar] [CrossRef]
  24. Li, Q.; Chai, L.; Tong, N. Potential Carbohydrate Regulation Mechanism Underlying Starvation-Induced Abscission of Tomato Flower. IJMS 2022, 23, 1952. [Google Scholar] [CrossRef] [PubMed]
  25. Ko, H.-Y.; Tseng, H.-W.; Ho, L.-H. Hexose Translocation Mediated by SlSWEET5b Is Required for Pollen Maturation in Solanum lycopersicum. Plant Physiol. 2022, 189, 344–359. [Google Scholar] [CrossRef]
  26. Balibrea, M.E.; Dell’Amico, J.; Bolarín, M.C.; Pérez-Alfocea, F. Carbon Partitioning and Sucrose Metabolism in Tomato Plants Growing under Salinity. Physiol. Plant 2000, 110, 503–511. [Google Scholar] [CrossRef]
  27. Gharbi, E.; Martínez, J.-P.; Benahmed, H.; Lepoint, G.; Vanpee, B.; Quinet, M.; Lutts, S. Inhibition of Ethylene Synthesis Reduces Salt-Tolerance in Tomato Wild Relative Species Solanum chilense. J. Plant Physiol. 2017, 210, 24–37. [Google Scholar] [CrossRef]
  28. Chetelat, R.T.; Pertuzé, R.A.; Faúndez, L.; Graham, E.B.; Jones, C.M. Distribution, Ecology and Reproductive Biology of Wild Tomatoes and Related Nightshades from the Atacama Desert Region of Northern Chile. Euphytica 2009, 167, 77–93. [Google Scholar] [CrossRef]
  29. Martínez, J.P.; Antúnez, A.; Araya, H. Salt Stress Differently Affects Growth, Water Status and Antioxidant Enzyme Activities in Solanum lycopersicum and Its Wild Relative Solanum chilense. Aust. J. Bot. 2014, 62, 359–368. [Google Scholar] [CrossRef]
  30. Gharbi, E.; Martínez, J.-P.; Benahmed, H. Salicylic Acid Differently Impacts Ethylene and Polyamine Synthesis in the Glycophyte Solanum lycopersicum and the Wild-Related Halophyte Solanum chilense Exposed to Mild Salt Stress. Physiol. Plant 2016, 158, 152–167. [Google Scholar] [CrossRef]
  31. Gharbi, E.; Lutts, S.; Dailly, H.; Quinet, M. Comparison between the Impacts of Two Different Modes of Salicylic Acid Application on Tomato (Solanum lycopersicum) Responses to Salinity. Plant Signal Behav. 2018, 13, e1469361. [Google Scholar] [CrossRef]
  32. Brukhin, V.; Hernould, M.; Gonzalez, N.; Chevalier, C.; Mouras, A. Flower Development Schedule in Tomato Lycopersicon esculentum Cv. Sweet Cherry. Sex. Plant Reprod. 2003, 15, 311–320. [Google Scholar] [CrossRef]
  33. Ayenan, M.A.T.; Danquah, A.; Ampomah-Dwamena, C.; Hanson, P.; Asante, I.K.; Danquah, E.Y. Optimizing Pollencounter for High Throughput Phenotyping of Pollen Quality in Tomatoes. MethodsX 2020, 7, 100977. [Google Scholar] [CrossRef] [PubMed]
  34. Alexander, M.P. Differential Staining of Aborted and Nonaborted Pollen. Stain. Technol. 1969, 44, 117–122. [Google Scholar] [CrossRef]
  35. Dafni, A.; Maués, M.M. A Rapid and Simple Procedure to Determine Stigma Receptivity. Sex. Plant Reprod. 1998, 11, 177–180. [Google Scholar] [CrossRef]
  36. Paponov, I.A.; Engels, C. Effect of Nitrogen Supply on Leaf Traits Related to Photosynthesis during Grain Filling in Two Maize Genotypes with Different N Efficiency. Z. Pflanzenernähr Bodenk 2003, 166, 756–763. [Google Scholar] [CrossRef]
  37. Lejeune, P.; Bernier, G.; Requier, M.-C.; Kinet, J.-M. Sucrose Increase during Floral Induction in the Phloem Sap Collected at the Apical Part of the Shoot of the Long-Day Plant Sinapis alba L. Planta 1993, 190, 71–74. [Google Scholar] [CrossRef]
  38. Dielen, V.; Quinet, M.; Chao, J. UNIFLORA, a Pivotal Gene That Regulates Floral Transition and Meristem Identity in Tomato (Lycopersicon esculentum). New Phytol. 2004, 161, 393–400. [Google Scholar] [CrossRef]
  39. Descamps, C.; Quinet, M.; Jacquemart, A.-L. Climate Change–Induced Stress Reduce Quantity and Alter Composition of Nectar and Pollen From a Bee-Pollinated Species (Borago Officinalis, Boraginaceae). Front. Plant Sci. 2021, 12, 755843. [Google Scholar] [CrossRef]
  40. Jin, Y.; Ni, D.; Ruan, Y. Posttranslational Elevation of Cell Wall Invertase Activity by Silencing Its Inhibitor in Tomato Delays Leaf Senescence and Increases Seed Weight and Fruit Hexose Level. Plant Cell 2009, 21, 2072–2089. [Google Scholar] [CrossRef]
  41. Goren, S.; Huber, S.C.; Granot, D. Comparison of a Novel Tomato Sucrose Synthase, SlSUS4, with Previously Described SlSUS Isoforms Reveals Distinct Sequence Features and Differential Expression Patterns in Association with Stem Maturation. Planta 2011, 233, 1011–1023. [Google Scholar] [CrossRef]
  42. Stein, O.; Granot, D. An Overview of Sucrose Synthases in Plants. Front. Plant Sci. 2019, 10, 95. [Google Scholar] [CrossRef]
  43. Alok, A.; Singh, S.; Kumar, P.; Bhati, K.K. Potential of Engineering the Myo-Inositol Oxidation Pathway to Increase Stress Resilience in Plants. Mol. Biol. Rep. 2022, 49, 8025–8035. [Google Scholar] [CrossRef] [PubMed]
  44. Zouine, M.; Maza, E.; Djari, A. TomExpress, a Unified Tomato RNA-Seq Platform for Visualization of Expression Data, Clustering and Correlation Networks. Plant J. 2017, 92, 727–735. [Google Scholar] [CrossRef] [PubMed]
  45. Hall, T. BioEdit: A User-Friendly Biological Sequence Alignment Editor and Analysis Program for Windows 95/98/NT. Nucl. Acids 1999, 41, 95–98. [Google Scholar]
  46. Untergasser, A.; Nijveen, H.; Rao, X. Primer3Plus, an Enhanced Web Interface to Primer3. Nucleic Acids Res. 2007, 35, W71–W74. [Google Scholar] [CrossRef] [PubMed]
  47. Ye, J.; Coulouris, G.; Zaretskaya, I. Primer-BLAST: A Tool to Design Target-Specific Primers for Polymerase Chain Reaction. BMC Bioinform. 2012, 13, 134. [Google Scholar] [CrossRef]
  48. Leelatanawit, R.; Saetung, T.; Phuengwas, S. Selection of Reference Genes for Quantitative Real-Time PCR in Postharvest Tomatoes (Lycopersicon esculentum) Treated by Continuous Low-Voltage Direct Current Electricity to Increase Secondary Metabolites. Int. J. Food Sci. Technol. 2017, 52, 1942–1950. [Google Scholar] [CrossRef]
  49. Cho, Y.-G.; Kang, K.-K. Functional Analysis of Starch Metabolism in Plants. Plants 2020, 9, 1152. [Google Scholar] [CrossRef]
  50. Smith, A.M.; Stitt, M. Coordination of Carbon Supply and Plant Growth. Plant Cell Environ. 2007, 30, 1126–1149. [Google Scholar] [CrossRef]
  51. Jha, D.; Shirley, N.; Tester, M.; Roy, S.J. Variation in Salinity Tolerance and Shoot Sodium Accumulation in Arabidopsis Ecotypes Linked to Differences in the Natural Expression Levels of Transporters Involved in Sodium Transport. Plant Cell Environ. 2010, 33, 793–804. [Google Scholar] [CrossRef] [PubMed]
  52. Durand, M.; Mainson, D.; Porcheron, B.; Maurousset, L.; Lemoine, R.; Pourtau, N. Carbon Source–Sink Relationship in Arabidopsis Thaliana: The Role of Sucrose Transporters. Planta 2018, 247, 587–611. [Google Scholar] [CrossRef]
  53. Smillie, R.M.; Hetherington, S.E.; Davies, W.J. Photosynthetic Activity of the Calyx, Green Shoulder, Pericarp, and Locular Parenchyma of Tomato Fruit. J. Exp. Bot. 1999, 50, 707–718. [Google Scholar] [CrossRef]
  54. Lemoine, R.; La Camera, S.; Atanassova, R.; Dédaldéchamp, F.; Allario, T.; Pourtau, N.; Bonnemain, J.-L.; Laloi, M.; Coutos-Thévenot, P.; Maurousset, L.; et al. Source-to-Sink Transport of Sugar and Regulation by Environmental Factors. Front. Plant Sci. 2013, 4, 272. [Google Scholar] [CrossRef]
  55. Zhang, J.; Lyu, H.; Chen, J.; Cao, X.; Du, R.; Ma, L.; Wang, N.; Zhu, Z.; Rao, J.; Wang, J.; et al. Releasing a Sugar Brake Generates Sweeter Tomato without Yield Penalty. Nature 2024, 635, 647–656. [Google Scholar] [CrossRef]
  56. Sheoran, I.S.; Saini, H.S. Drought-Induced Male Sterility in Rice: Changes in Carbohydrate Levels and Enzyme Activities Associated with the Inhibition of Starch Accumulation in Pollen. Sex. Plant Reprod. 1996, 9, 161–169. [Google Scholar] [CrossRef]
  57. Fridman, E.; Zamir, D. Functional Divergence of a Synthenic Invertase Gene Family in Tomato, Potato, and Arabidopsis. Plant Physiol. 2003, 131, 603–609. [Google Scholar] [CrossRef] [PubMed]
  58. Wei, H.; Chai, S.; Ru, L.; Pan, L.; Cheng, Y.; Ruan, M.; Ye, Q.; Wang, R.; Yao, Z.; Zhou, G.; et al. New Insights into the Evolution and Expression Dynamics of Invertase Gene Family in Solanum lycopersicum. Plant Growth Regul. 2020, 92, 205–217. [Google Scholar] [CrossRef]
  59. Liu, S.; Li, Z.; Wu, S.; Wan, X. The Essential Roles of Sugar Metabolism for Pollen Development and Male Fertility in Plants. Crop J. 2021, 9, 1223–1236. [Google Scholar] [CrossRef]
  60. Zhang, Z.; Hu, M.; Xu, W.; Wang, Y.; Huang, K.; Zhang, C.; Wen, J. Understanding the Molecular Mechanism of Anther Development under Abiotic Stresses. Plant Mol. Biol. 2021, 105, 1–10. [Google Scholar] [CrossRef]
  61. Munir, S.; Mumtaz, M.; Ahiakpa, J.; Liu, G.; Chen, W.; Zhou, G.; Zheng, W.; Ye, Z.; Zhang, Y. Genome-Wide Analysis of Myo-Inositol Oxygenase Gene Family in Tomato Reveals Their Involvement in Ascorbic Acid Accumulation. BMC Genom. 2020, 21, 1–15. [Google Scholar] [CrossRef] [PubMed]
  62. Smirnoff, N.; Conklin, P.L.; Loewus, F.A. Biosynthesis of Ascorbic Acid in Plants: A Renaissance. Annu. Rev. Plant. Physiol. Plant. Mol. Biol. 2001, 52, 437–467. [Google Scholar] [CrossRef] [PubMed]
  63. Li, C.; Tien, H.; Wen, M.; Yen, H.E. Myo-inositol Transport and Metabolism Participate in Salt Tolerance of Halophyte Ice Plant Seedlings. Physiol. Plant 2021, 172, 1619–1629. [Google Scholar] [CrossRef] [PubMed]
  64. Yang, Y.; Guo, Y. Elucidating the Molecular Mechanisms Mediating Plant Salt-Stress Responses. New Phytol. 2018, 217, 523–539. [Google Scholar] [CrossRef]
Figure 1. Number of leaves (A,B), of ramifications (C,D) and of inflorescences (E,F) on the main stem of S. lycopersicum (A,C,E) and S. chilense (B,D,F) grown in perlite:vermiculite (50:50 v/v) with Hoagland solution supplied with 0, 60 and 120 mM NaCl during 91 days. Values are the mean ± standard error of two experiments. Different letters (black for S. lycopersicum, grey for S. chilense) denote significant differences (p < 0.05, Tukey’s post-hoc test) between treatments within the same species at 91 days after stress.
Horticulturae 11 00285 g001
Figure 2. Heatmap of (A) flowering parameters and (B) fruiting parameters of S. lycopersicum and S. chilense grown in perlite:vermiculite (50:50 v/v) with Hoagland solution supplied with 0, 60 and 120 mM NaCl. In each species, results are expressed in relative values compared to 0 mM NaCl. Values of S lycopersicum and Schilense grown at 0 mM NaCl are given in Table S2. Different letters (black for S. lycopersicum, grey for S. chilense) denote significant differences (p < 0.05, Tukey’s post-hoc test) between treatments within the same species. DW, dry weight, FW, fresh weight, nd, no data.
Horticulturae 11 00285 g002
Figure 3. (A) percentage of abortion of inflorescences on the main stem at 91 days after stress imposition and (B) percentage of abortion of flowers in an inflorescence of S. lycopersicum and S. chilense grown in perlite:vermiculite (50:50 v/v) with Hoagland solution supplied with 0, 60 and 120 mM NaCl. In each species, results are expressed in relative values compared to 0 mM NaCl. Values of S. lycopersicum and S. chilense grown at 0 mM NaCl are given in Table S2. Different letters (black for S. lycopersicum, grey for S. chilense) denote significant differences (p < 0.05, Tukey’s post-hoc test) between treatments within the same species.
Horticulturae 11 00285 g003
Figure 4. Physiological parameters. (A) photosynthesis nitrogen use efficiency, ratio between net photosynthesis (A, µmol.m−2.s−1) and CCI (chlorophyll content index, no unit), measured at 70 days after stress imposition (DASt). (B) foliar area of the first mature leaf at 49 DASt. Plant were grown in perlite:vermiculite (50:50 v/v) with Hoagland solution supplied with 0, 60 and 120 mM NaCl. In each species, results are expressed in relative values compared to 0 mM NaCl. Values of S. lycopersicum and S. chilense grown at 0 mM NaCl are given in Table S2. Different letters (black for S. lycopersicum, grey for S. chilense) denote significant differences (p < 0.05, Tukey’s post-hoc test) between treatments within the same species.
Horticulturae 11 00285 g004
Figure 5. Concentration of fructose (Fru) (A,B), glucose (Glc) (C,D), myo-inositol (E,F) and sucrose (G,H) in leaves (A,C,E,G) and flowers (B,D,F,H) of S. lycopersicum and S. chilense grown for 85 days in a mix of perlite:vermiculite (50:50 v/v) with Hoagland solution supplied with 0, 60 and 120 mM NaCl. Values are the mean ± standard error of two experiments. Different letters (black for S. lycopersicum, grey for S. chilense) denote significant differences (p < 0.05, Tukey’s post-hoc test) between treatments within the same species. FW, fresh weight.
Horticulturae 11 00285 g005
Figure 6. Concentration of fructose (Fru) (A,B), glucose (Glc) (C,D), myo-inositol (E,F) and sucrose (G,H) in the foliar sieve (A,C,E,G) and in the apical sieve (B,D,F,H) of S. lycopersicum and S. chilense grown for 85 days in perlite:vermiculite (50:50 v/v) with Hoagland solution supplied with 0, 60 and 120 mM. Values are the mean ± standard error of two experiments. Different letters (black for S. lycopersicum, grey for S. chilense) denote significant differences (p < 0.05, Tukey’s post-hoc test) between treatments within the same species. DW: fresh weight.
Horticulturae 11 00285 g006
Figure 7. Expression of 10 genes involved in sugar metabolism analyzed by qRT-PCR on flowers of S. lycopersicum and S. chilense grown for 85 days in perlite:vermiculite (50:50 v/v) with Hoagland solution supplied with 0 and 120 mM NaCl. (A) LIN5 (cell wall invertase 5, Solyc09g010080); (B) LIN7 (cell wall invertase 7, Solyc09g010090); (C) TIV1 (acid invertase, Solyc03g083910); (D) LIN9 (acid invertase, Solyc08g079080); (E) CIN08 (cytoplasmic invertase, alkaline/neutral, Solyc01g058010); (F) CIF1 (cell wall invertase inhibitor, Solyc12g099200); (G) SUS1 (sucrose synthase 1, Solyc12g009300); (H) SUS4 (sucrose synthase 4, Solyc09g098590); (I) MIOX4 (myoinositol oxygenase 4, Solyc12g008650); (J) MIOX5 (myoinositol oxygenase 5, Solyc12g098120). The tomato elongation factor gene (LeEF-1a, Solyc06g005060) and TIP41-like protein (TIP41, Solyc10g04985) were used as reference genes. Expressions are given based on S. lycopersicum grown at 0 mM NaCl, to which a value of 1 was assigned. Values are the mean ± standard error. Different letters (black for S. lycopersicum, grey for S. chilense) denote significant differences (p < 0.05, Tukey’s post-hoc test) between treatments within the same species.
Horticulturae 11 00285 g007
Figure 8. Correlation graphs of flower fertility parameters, concentrations of glucose (Glc), fructose (Fru), sucrose and myo-inositol in flowers, leaves, apical and foliar exudates and expression of genes involved in sugar metabolism of (A) S. lycopersicum and (B) S. chilense growing at 0, 60 and 120 mM NaCl. Only significant correlations (p < 0.05) are indicated with circles. Negative correlations are highlighted in red, and positive correlations in blue. L petal, sepal, stamen, style and ovary: length of a petal, a sepal, a stamen and of the sum of the style and the ovary; N buds, flowers/inflo: number of buds in an inflorescence and of flowers in anthesis in an inflorescence; N inflos, leaves, ramifs, number of inflorescences, leaves and ramifications on the main stem at 91 days after stress; N pollen/anther, number of pollen grains per anther. Genes: CIF1 (cell wall invertase inhibitor, Solyc12g099200); CIN08 (cytoplasmic invertase, alkaline/neutral, Solyc01g058010); LIN5 (cell wall invertase 5, Solyc09g010080); LIN7 (cell wall invertase 7, Solyc09g010090); LIN9 (acid invertase, Solyc08g079080); MIOX4 (myoinositol oxygenase 4, Solyc12g008650); MIOX5 (myoinositol oxygenase 5, Solyc12g098120); SUS1 (sucrose synthase 1, Solyc12g009300); SUS4 (sucrose synthase 4, Solyc09g098590); TIV1 (acid invertase, Solyc03g083910).
Horticulturae 11 00285 g008
Figure 9. (A) Relative values of concentrations of glucose, fructose, sucrose and myoinositol in different organs of S. lycopersicum and S. chilense grown in perlite:vermiculite (50:50 v/v) supplied with 120 mM NaCl compared to the same species at 0 mM NaCl. Values are given in percentage of modifications of the concentration at 120 mM NaCl compared to controls (0 mM NaCl, 0%). A, modifications of concentrations in the leaves, B, in the foliar exudates, C, in apical exudates, D, in the inflorescences. Black lines in spider graphs represent the baseline, where no increase or decrease of concentration is observed for a species between 0 and 120 mM NaCl. The tables represent the increase (↑), decrease (↓) or no modification of the expression of genes involved in sugars metabolism between 0 and 120 mM NaCl. On the left, the table represents the expression of genes in the leaves, and on the right, in the flowers. (B) Biosynthesis pathways of the studied sugars (green squares) and the associated enzymes (dark bold), with gene expression levels indicated as increased (↑), decreased (↓), or unchanged (=) in flowers and leaves of S. lycopersicum (blue) and S. chilense (yellow) between 0 and 120 mM NaCl. Sugars in red are direct products of metabolism, while compounds in purple are indirect products, and white arrows represent indirect synthesis pathways. CIF1 (cell wall invertase inhibitor, Solyc12g099200); CIN08 (cytoplasmic invertase, alkaline/neutral, Solyc01g058010); LIN5 (cell wall invertase 5, Solyc09g010080); LIN7 (cell wall invertase 7, Solyc09g010090); LIN9 (acid invertase, Solyc08g079080); MIOX4 (myoinositol oxygenase 4, Solyc12g008650); MIOX5 (myoinositol oxygenase 5, Solyc12g098120); SUS1 (sucrose synthase 1, Solyc12g009300); SUS4 (sucrose synthase 4, Solyc09g098590); TIV1 (acid invertase, Solyc03g083910).
Horticulturae 11 00285 g009
Disclaimer/Publisher’s Note: The statements, opinions and data contained in all publications are solely those of the individual author(s) and contributor(s) and not of MDPI and/or the editor(s). MDPI and/or the editor(s) disclaim responsibility for any injury to people or property resulting from any ideas, methods, instructions or products referred to in the content.

