Article

The Combined Effect of Lighting and Zinc on the Nutritional Quality of Lettuce (Lactuca sativa L.) Grown in Hydroponics

by
Kristina Laužikė
*,†,
Rūta Sutulienė
,
Viktorija Vaštakaitė-Kairienė
and
Aušra Brazaitytė
Lithuanian Research Centre for Agriculture and Forestry, Institute of Horticulture, Kauno Str. 30, LT-54333 Babtai, Lithuania
*
Author to whom correspondence should be addressed.
These authors contributed equally to this work.
Horticulturae 2025, 11(3), 284; https://doi.org/10.3390/horticulturae11030284
Submission received: 24 January 2025 / Revised: 1 March 2025 / Accepted: 4 March 2025 / Published: 5 March 2025
(This article belongs to the Section Protected Culture)

Abstract

:
The nutritional quality and biochemical properties of ‘Little Gem’ (Lactuca sativa L.) lettuce grown hydroponically can be enhanced by Zn and white light. This study investigated the combined effects of wide-spectrum white LED lighting parameters and Zn doses on the Zn accumulation, enzymatic and non-enzymatic antioxidants, sugars, and protein content of lettuce. Broad-spectrum 3500 K light combined with a 5 ppm Zn solution led to a 7% increase in Zn accumulation in lettuce, compared to 3000 K and 4000 K lighting conditions. The 5 ppm Zn dose combined with 3000 K and 4000 K lighting affected DPPH and ABTS scavenging activity and Fe-reducing antioxidant power. Additionally, this combination influenced chlorophyll b, maltose, superoxide dismutase, and ascorbate peroxidase levels. Furthermore, the 1 and 5 ppm Zn doses at 4000 K impacted carotenoids such as neoxanthin, lutein, zeaxanthin, and total protein content. In lettuce exposed to a 1 ppm Zn dose combined with 3000 K and 3500 K lighting, impact was found on total phenolic compounds, sucrose, chlorophyll a, raffinose, fructose, glucose, carotene, violaxanthin, and xanthophylls. The study suggests that lighting and Zn concentrations significantly impact lettuce growth, biochemical properties, and nutritional quality, particularly at the baby leaf stage.

1. Introduction

Biofortification could be a solution that would help about 17% of the world’s population (1.1 billion) who are facing zinc (Zn) deficiency. The consequences of Zn element deficiency include impaired neuropsychological functions, growth retardation, oligospermia, reproductive disorders, dermatitis, impaired wound healing, and immune disorders are particularly important for the human population [1]. According to the World Health Organization, the estimated daily absorbable amount of Zn for adults is 2.5 mg [2]. This implies that a 16–50% bioavailability of 4–14 mg per day is required from food sources [3].
Zn is necessary not only for maintaining human health but also for plant productivity. It is required for the activity of enzymes, including those involved in plant growth regulation, photosynthesis, hormone synthesis, and antioxidant defense [4]. Zn is also essential for protein synthesis, DNA transcription, and cell membrane stability [5]. Its deficiency causes growth disorders, such as chlorosis, leaf shrinkage, internode shortening, and reduced photosynthetic efficiency in plants. In addition, Zn deficiency can lead to oxidative stress and minimize plant resistance to adverse environmental conditions [6]. Therefore, understanding the role of Zn and its adequate supply are essential factors for achieving optimal plant growth and productivity. Applying Zn in plants enhances photosynthesis, boosts antioxidant functions, and improves plant growth, yield, and fruit quality.
In agronomy, biofortification aims to enhance agricultural practices and increase the content of essential nutrients in the edible parts of plants. Enriching leafy vegetables with specific nutrients is a profitable and sustainable strategy to alleviate micronutrient deficiencies in human nutrition. This study aligns with the European Union’s (EU) Green Deal strategy, “From Farm to Fork”, which aims to establish a more sustainable and healthier food system across the EU by promoting innovative and efficient farming methods [7,8]. Zn biofortification in hydroponic systems is in line with the United Nations Sustainable Development Goals, particularly Goal 2 aiming to end hunger and achieve food security and Goal 12 aiming to ensure sustainable consumption and production patterns [9]. It contributes to the EU’s ambition to develop innovative and sustainable food production systems. Hydroponic Zn biofortification can be particularly useful in urban agriculture and regions with poor soil quality or limited agricultural land [10,11]. Lettuce, being one of the most widely consumed leafy vegetables and often grown in hydroponic systems, provides an excellent opportunity to study the effectiveness of Zn biofortification under controlled conditions [12]; however, its health benefits depend significantly on the conditions under which it is grown.
The agronomic biofortification of plants within hydroponic systems has witnessed a notable increase attributed to the numerous advantages these systems provide [13,14]. It not only enhances the quality of vegetables but also allows for the precise management of essential elements in the hydroponic solution, devoid of interactions with the physical, chemical, and biological characteristics typically associated with soil [13]. For instance, the spraying of lettuce grown in the nutrient film technique type hydroponics with Zn (ZnSO4) solutions (0, 0.65, 3.27, 6.54, and 9.51 mg L−1) showed that as the concentration increased to 6.54 mg L−1, lettuce mass, antioxidant activity, and Zn accumulation also increased [15]. On the other hand, the 9.51 mg L−1 Zn dose decreased protein, K and Mg, total phenols, flavonoids, and antioxidant capacity in lettuces. Another study [16] found that increasing Zn concentrations in hydroponic nutrient solutions (0, 5, and 10 mg L−1) significantly enhanced various growth parameters in lettuce, including fresh weight, dry weight, chlorophyll index, levels of chlorophyll a and b, total chlorophyll content, carotenoid levels, total protein concentration, and leaf Zn concentration. In aeroponic-grown lettuce, Zn concentration in leaves and roots correlated with the increasing Zn concentration in the hydroponic solution [17]. Various Zn concentrations can affect plant biochemical, growth, and elemental composition parameters, ranging from toxic to beneficial effects.
Another critical factor for biofortification [18] and plant growth is the selection of appropriate lighting. For example, it is claimed that the use of different ratios of blue and red light-emitting diodes (LEDs) can increase the absorption of selenium [19,20], iron [21,22], and Zn [23] in various plant species. In the latter study, the effect of two R:B LED ratios of 2:1 and 1:2 showed a significant impact on the Zn uptake in Chinese cabbage [23]. Notably, the uptake of Zn by lettuce plants can be significantly influenced by changes in the blue and red spectral components of light [24]. The most effective result for Zn uptake, with an increase of 84%, was achieved using deep-red LEDs rather than standard red LEDs. Additionally, the uptake of Zn in lettuce was found to be 64% higher when blue LEDs were used instead of deep-blue LEDs, indicating that blue LEDs can be more effective in enhancing the Zn uptake [24].
White LED lighting is much less commonly used in horticulture compared to red or blue LED lighting [25]. The main strategy is to use white LEDs alone or combined with red and/or blue LEDs to create a broad spectrum of light for plants. Broad-spectrum white lighting, which includes blue, red and green light waves, can enhance the uptake and distribution of Zn in the plant, optimizing photosynthesis and increasing the plant’s energy resources [26,27]; can affect the expression of genes related to metal transport through the root membrane and promote a more efficient Zn uptake by the roots, and its transfer to the aboveground parts [18]. A Zn deficiency can cause oxidative stress in plants, and the appropriate light spectrum can help regulate the activity of antioxidant enzymes, such as superoxide dismutase (SOD) or catalase [28] and can affect the synthesis of the growth hormone auxin, which can have a positive effect on Zn transport and its utilization in plant tissues [29]. Sources from the literature indicate that white LED lighting had a positive impact on the sugar content in kale, lettuce, and radishes, increased carotenoids in kale, decreased the polyphenol content and total antioxidant activity in lettuce, increased the ascorbic acid content in Chinese cabbage sprouts and lettuce, increased it in radishes and had no effect on tomatoes, compared to red-blue LED lighting [30,31,32].
As can be seen, the effect of Zn doses has been extensively studied. Still, there is a notable lack of knowledge on the impact of light on element, especially Zn, biofortification in lettuce. So, the aim of this study was to investigate the combined effects of wide-spectrum white LED lighting parameters and Zn doses on the Zn accumulation, enzymatic and non-enzymatic antioxidants, sugar, and protein content of lettuce. This study hypothesized that broad-spectrum white light LED lighting combined with different doses of Zn would synergistically affect lettuce growth and biochemical parameters, thereby increasing Zn accumulation by improving lettuce nutritional quality.

2. Materials and Methods

2.1. Plant Material and Growing Conditions

The pot experiment was performed in a closed, controlled environment, walk-in growth chambers (4 m × 6 m) in the phytotron complex at the Institute of Horticulture (IH), Research center for Agriculture and Forestry, Lithuania (55°60′ N, 23°48′ E). The microclimate in the growth chamber was autonomously and independently controlled using the Phytotron Microclimate Control System developed in IH based on separate microcontrollers (AL-2-24MR-D, Mitsubishi Electric, Tokyo, Japan). The air temperature was measured with resistance temperature detectors (P-100; OMEGA Engineering Ltd., Norwalk, CT, USA), and data for these measurements were transmitted to the microcontrollers. The relative humidity and CO2 concentration were measured by capacitive sensors (CO2RT(-D); Regin, Kållered, Sweden) and controlled by additional humidifiers. Data were collected every minute, processed, and stored on the operator panel (E1000, Mitsubishi Electric, Tokyo, Japan).
Seeds of the lettuce (Lactuca sativa, ‘Little Gem’.; CN Seeds, Ely, UK) were sown in Rockwool cubes (2.5 cm × 2.5 cm× 3.0 cm) and presoaked in deionized water with an adjusted pH of 5.0 using diluted sulfuric acid, placed in a plastic tray. Seeds were germinated in a growth chamber with a day/night temperature range of 21 ± 2/17 ± 2 °C, 12 h photoperiod, light intensity—220 µmol m−2 s−1, and the relative humidity was controlled to 60 ± 5%. After eleven days, similar size lettuce seedlings were transplanted into 9 L containers (11 plants in one container) and grown to baby leaf size for 11 days with hydroponic solution with the following average concentrations of nutrients (mg L−1): N (120), Ca (88), P (20), K (128), Mg (40), S (53), B (0.16), Mo (0.2), Mn (0.08), Cu (0.08), Fe (1.6). Lettuces were grown in a hydroponic solution containing different concentrations of zinc (Zn), 1 mg L−1 (Zn1) and 5 mg L−1 (Zn5) (Table 1). Zinc disodium ethylenediaminetetraacetate (Zn EDTA, C10H12ZnN2Na2O8 · 2H2O) was used in this experiment to maintain different Zn concentrations. The pH and the electrical conductivity (EC) of the nutrient solution were measured daily using a portable meter (GroLine HI9814, Hanna Instruments, Woonsocket, RI, USA), and were adjusted to a pH of 6.0 and an EC of 1.3–1.4 mS cm−1 using sulfuric acid or sodium bicarbonate. Wide-spectrum (380–780 nm) 3000 K, 3500 K, and 4000 K lamps (Samsung LM301B LM301H, Shen Zhen Yu Xin Ou Technology Co., Ltd., Shenzhen, China) were used to evaluate the effect of white LED (Table 1). Spectra (Figure S1) were measured at the plant growth level using a portable spectroradiometer (WaveGo, Wave Illumination, Oxford, Oxfordshire, UK) (Figure S1).

2.2. Biometric Measurements

The experiment was performed in four randomized replicates and five random plants from each replicate were taken for measurements. The plant leaf area was determined using a benchtop leaf area meter (AT Delta–T Devices, Cambridge, UK). Dry leaf mass was determined after tissue dehydration at 70 °C for 48 h (Venticell-BMT, Zábrdovice, Czech Republic). The dry and fresh weight ratio was calculated.

2.3. Determination of Zinc in Lettuce

The Zn contents in lettuce were determined by the microwave digestion technique combined with inductively coupled plasma optical emission spectrometry (ICP-OES). Five fresh and randomly selected lettuce plants without roots were dried in the oven at 70 °C for 48 h. A complete digestion of dry plant material (0.2 g) was achieved with 65% HNO3 using the microwave digestion system Multiwave GO (Anton Paar GmbH, Graz, Austria). The digestion program was as follows: (1) 170 °C reached within 5 min, digested for 10 min; (2) 180 °C reached within 10 min, digested for 10 min. The mineralized samples were diluted to 50 mL with deionized water. The ICP analyzed the elemental profile using the OES spectrometer (Spectro Genesis, SPECTRO Analytical Instruments, Kleve, Germany). The operating conditions employed for ICP-OES determination were 1300 W RF power, 12 L min−1 plasma flow, 1.0 L min−1 auxiliary flow, 0.8 L min−1 nebulizer flow, and 1.0 mL min−1 sample uptake rate. The analytical wavelength (nm) chosen for Zn was 213.856 nm. The calibration standards were prepared by diluting a stock multi-elemental standard solution (1000 mg L−1) in 6.5% (v/v) nitric acid, and by diluting stock phosphorus and sulfur standard solutions (1000 mg L−1) in deionized water. The calibration curves for all the studied elements ranged from 0.01 to 400 mg L−1.

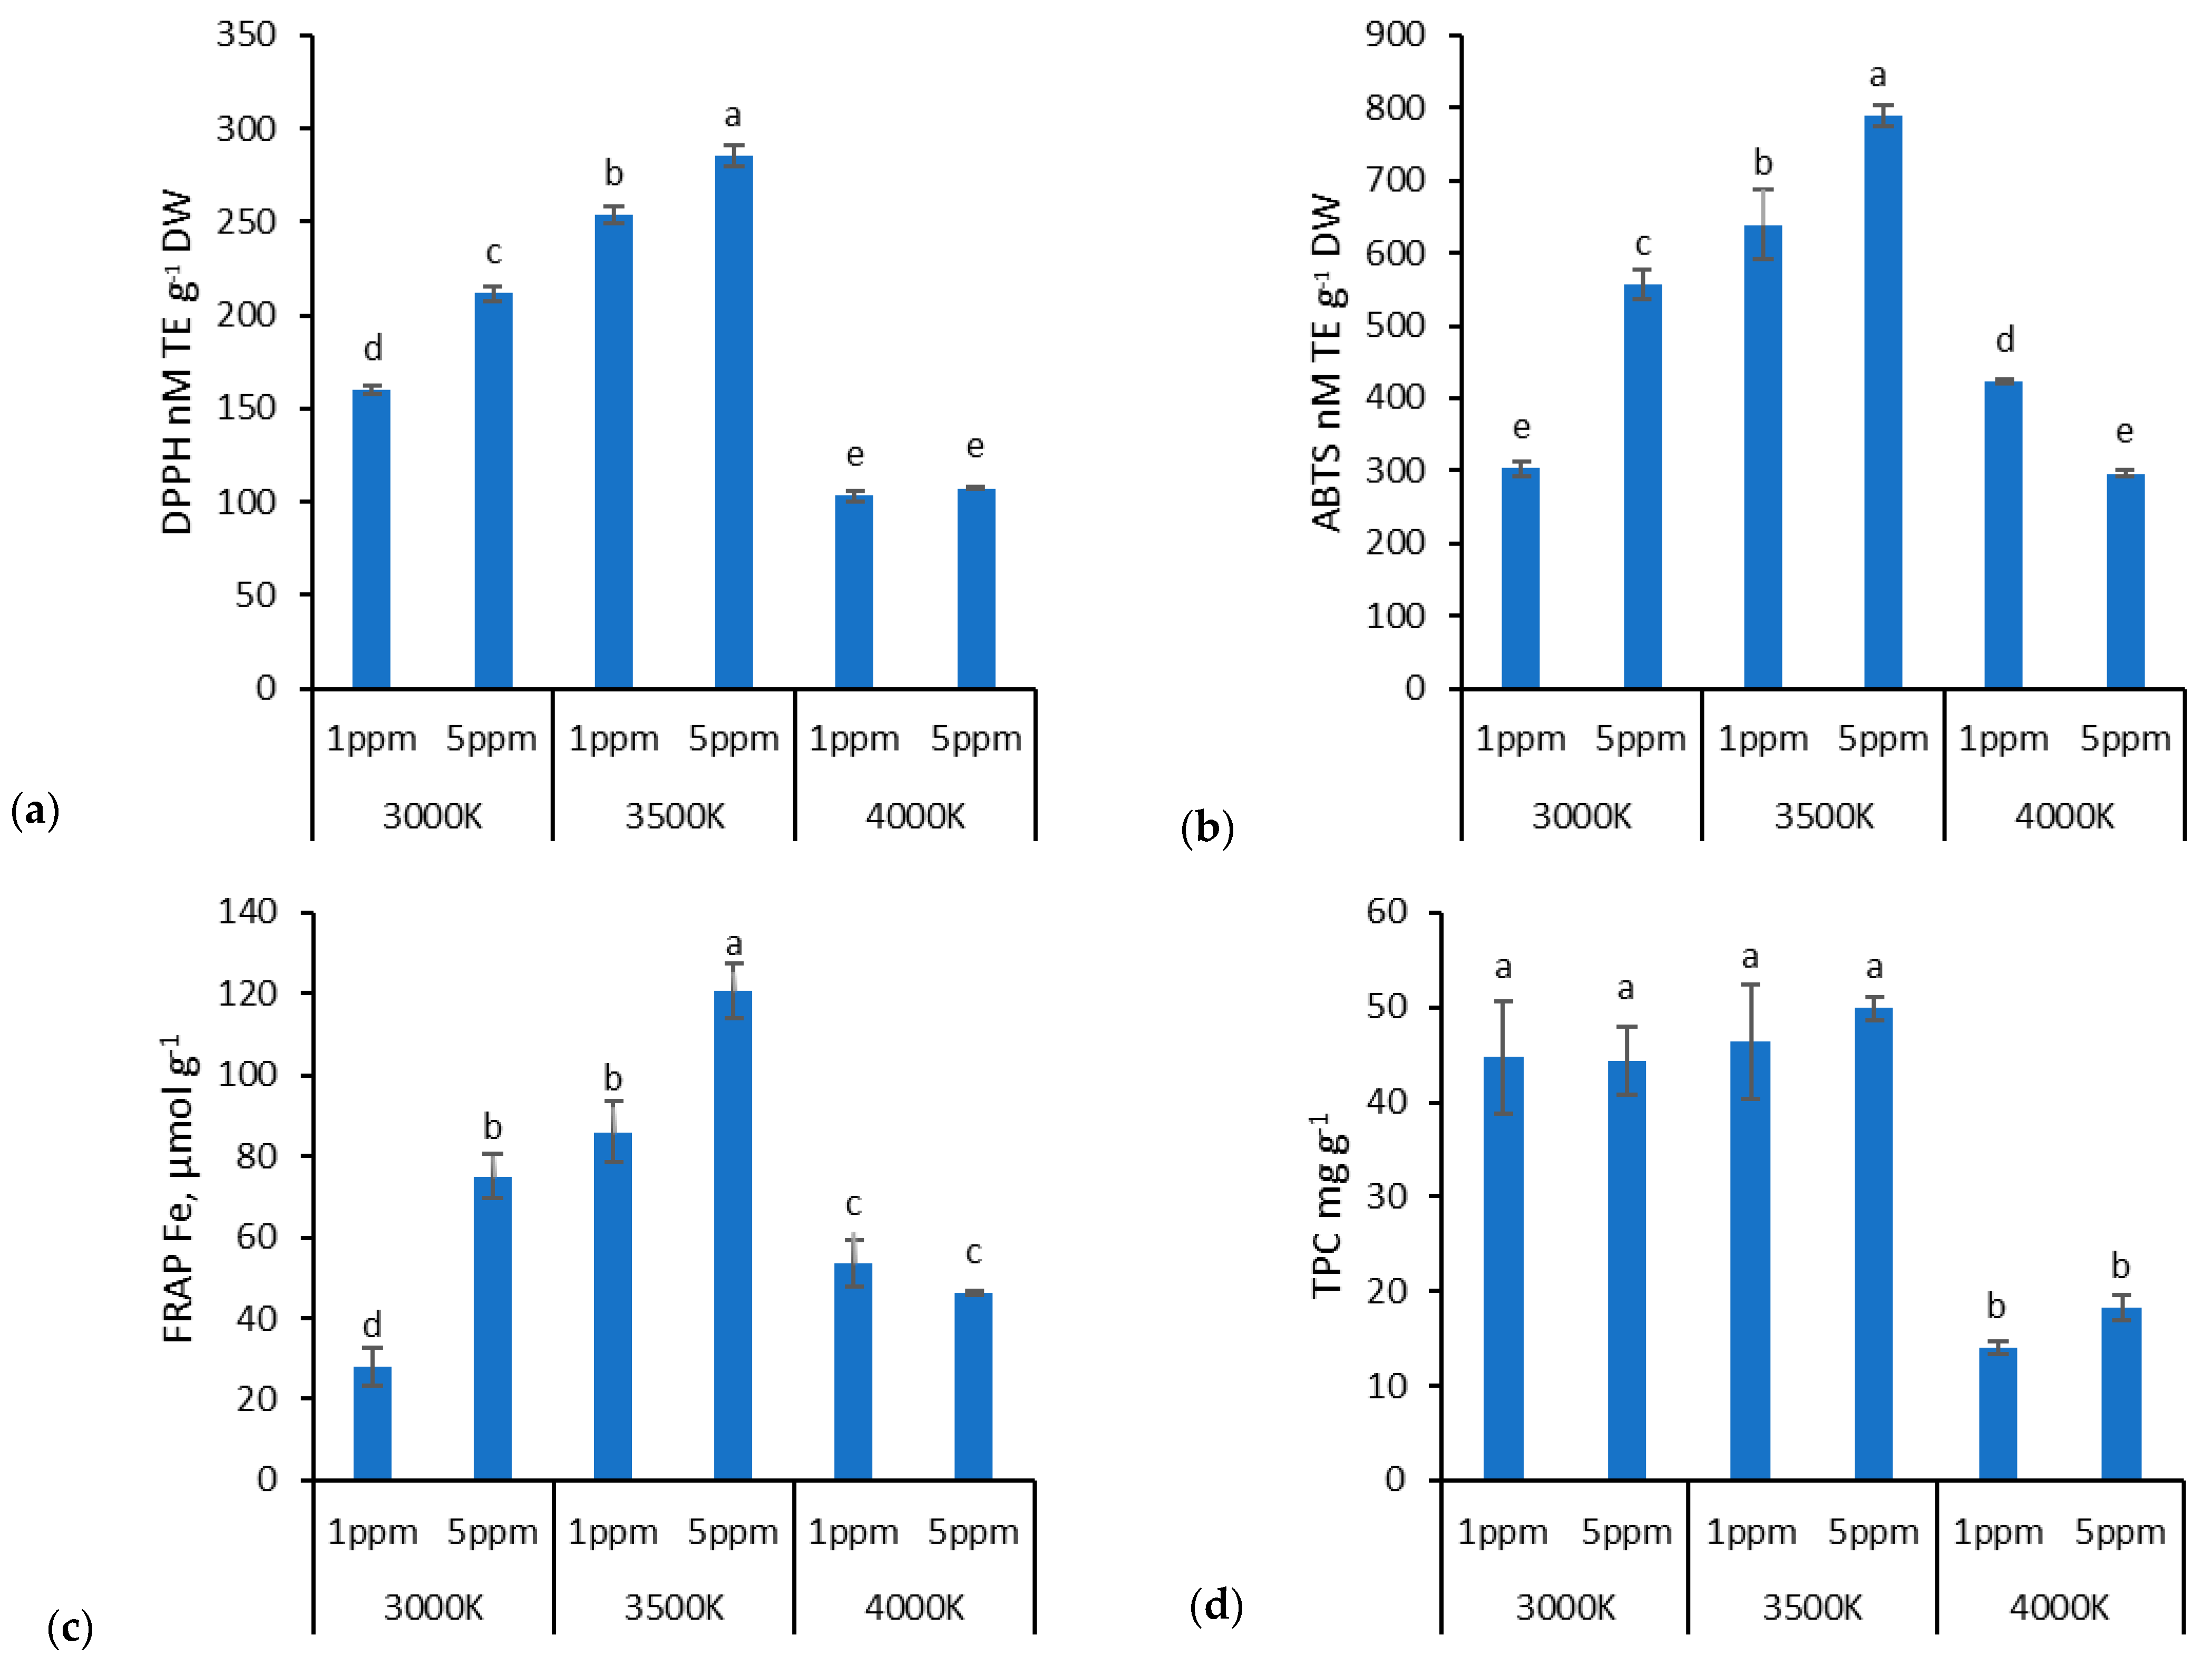
2.4. Antioxidant Activity and Total Phenolic Content

Extracts preparation: about 0.05 g of lyophilized plant leaf material diluted with 5 mL of 80% methanol. After 24 h in 4 °C incubation, samples were centrifuged at 4000× g for 15 min, supernatant separated from the plant material. Each of the three biological replicates consisted of at least three conjugated plants and was repeated in three analytical replicates. The antioxidant properties of lettuce leaves were evaluated as:
  • ABTS scavenging activity
The ABTS (2,2′-azino-bis (3-ethylbenzothiazoline-6-sulphonic acid) radical cation was obtained by incubating the 7 mM ABTS stock solution (100 mL) with 2.45 mM potassium persulfate (K2S2O8; final concentration) and allowing the mixture to stand in the dark at room temperature for 12–16 h before use [33]. After, 50 μL of the prepared sample was mixed with 2 mL of the ABTS solution (diluted in a 1:7 ratio), and the absorbance was measured after 11 min (plateau phase) at 734 nm (M501, Spectronic Camspec Ltd., Leeds, UK). The ABTS scavenging activity of lettuce leaf extracts was calculated as the difference between the initial absorbance and after reacting for 10 min. A calibration curve was determined using Trolox (6-hydroxy-2,5,7,8-tetramethychroman-2-carboxylic acid; 97% purity; Sigma-Aldrich, Burlington, MA, USA) as an external standard with a range of concentrations from 0.1 to 0.8 mM (R2 = 0.99). It was expressed as ABTS µmol scavenged per 1 g of fresh weight (µmol g−1 FW).
  • DPPH scavenging activity
For the DPPH (2-diphenyl-1-picrylhydrazyl) assay, a stable 126.8 μM DPPH (100% purity; Sigma-Aldrich, Burlington, MA, USA) solution was prepared in methanol [34]. Subsequently, 1 mL of the DPPH solution was transferred to a test tube and mixed with 100 μL of the diluted lettuce extract with 400 μL methanol. The absorbance was scanned at 515 nm (M501, Spectronic Camspec Ltd., Leeds, UK) while reacting for 16 min. The free radical scavenging capacity was expressed as the μmol of DPPH radicals scavenged per 1 g of fresh weight (µmol g−1 FW). A calibration curve was determined using Trolox (6-hydroxy-2,5,7,8-tetramethychroman-2-carboxylic acid; 97% purity; Sigma-Aldrich, Burlington, MA, USA) as an external standard with a range of concentrations from 0.1 to 0.6 mM (R2 = 0.99).
  • FRAP
The FRAP method is based on reducing ferric ions (Fe3+) to ferrous ions (Fe2+). The fresh working solution was prepared by mixing 300 mM, pH 3.6 acetate buffer, 10 mM TPTZ (2,4,6-tripyridyl-s-triazine) solution in 40 mM HCl, and 20 mM FeCl3 × 6H2O at 10:1:1 (v/v/v) [35]. 20 µL of the sample was mixed with 3 mL of the working solution and incubated in the dark for 30 min. Readings of the colored product (ferrous tripyridyl-triazine complex) were then taken at 593 nm. A calibration curve was determined using Fe2(SO4)3 (Iron (III) sulfate; 97% purity; Sigma-Aldrich, Burlington, MA, USA) as an external standard with a range of concentrations from 0.005 to 0.5 mM (R2 = 0.99). The antioxidant power is expressed as Fe2+ antioxidant capacity (Fe2+ µmol g−1 FW).
  • Total phenolic content
The total content of phenolic compounds was determined as gallic acid equivalents. A 250 µL aliquot of the sample extract was mixed with 250 µL of 10% (w/v) Folin–Ciocalteu reagent, 500 µL of 1 M Na2CO3 solution, and 2 mL of distilled water [36]. After incubation for 20 min in the dark, the absorbance was measured at 765 nm (M501, Spectronic Camspec Ltd., Leeds, UK). The total quantity of the phenolic compounds, mg g−1, was calculated from the calibration curve of gallic acid (0.01–0.1 mg mL−1, R2 = 0.99).

2.5. Determination of Soluble Sugars by UFLC

Soluble sugar (fructose, glucose, sucrose, maltose, raffinose) contents were evaluated using the UFLC method with evaporative scattering detection (ELSD). About 0.05 g of lyophilized plant tissue was ground and diluted with deionized water. The extraction was carried out for 4 h at room temperature and centrifuged at 14,000× g for 15 min. A cleanup step was performed prior to the chromatographic analysis: 1 mL of the supernatant was mixed with 1 mL 0.01% (w:v) ammonium acetate in acetonitrile and incubated for 30 min at +4 °C. After incubation, the samples were centrifuged at 14,000× g for 15 min and filtered through a 0.22 µm PTPE syringe filter (VWR International, Rochester, NY, USA). Analysis was performed on the Shimadzu Nexera (Kyoto, Japan) system. Separation was performed on a Supelcosil 250 × 4 mm NH2 column (Supelco, Bellefonte, PA, USA) using 77% acetonitrile as the mobile phase at a 1 mL min−1 flow rate. The calibration method was used for sugar quantification (mg g−1 in lyophilized material).

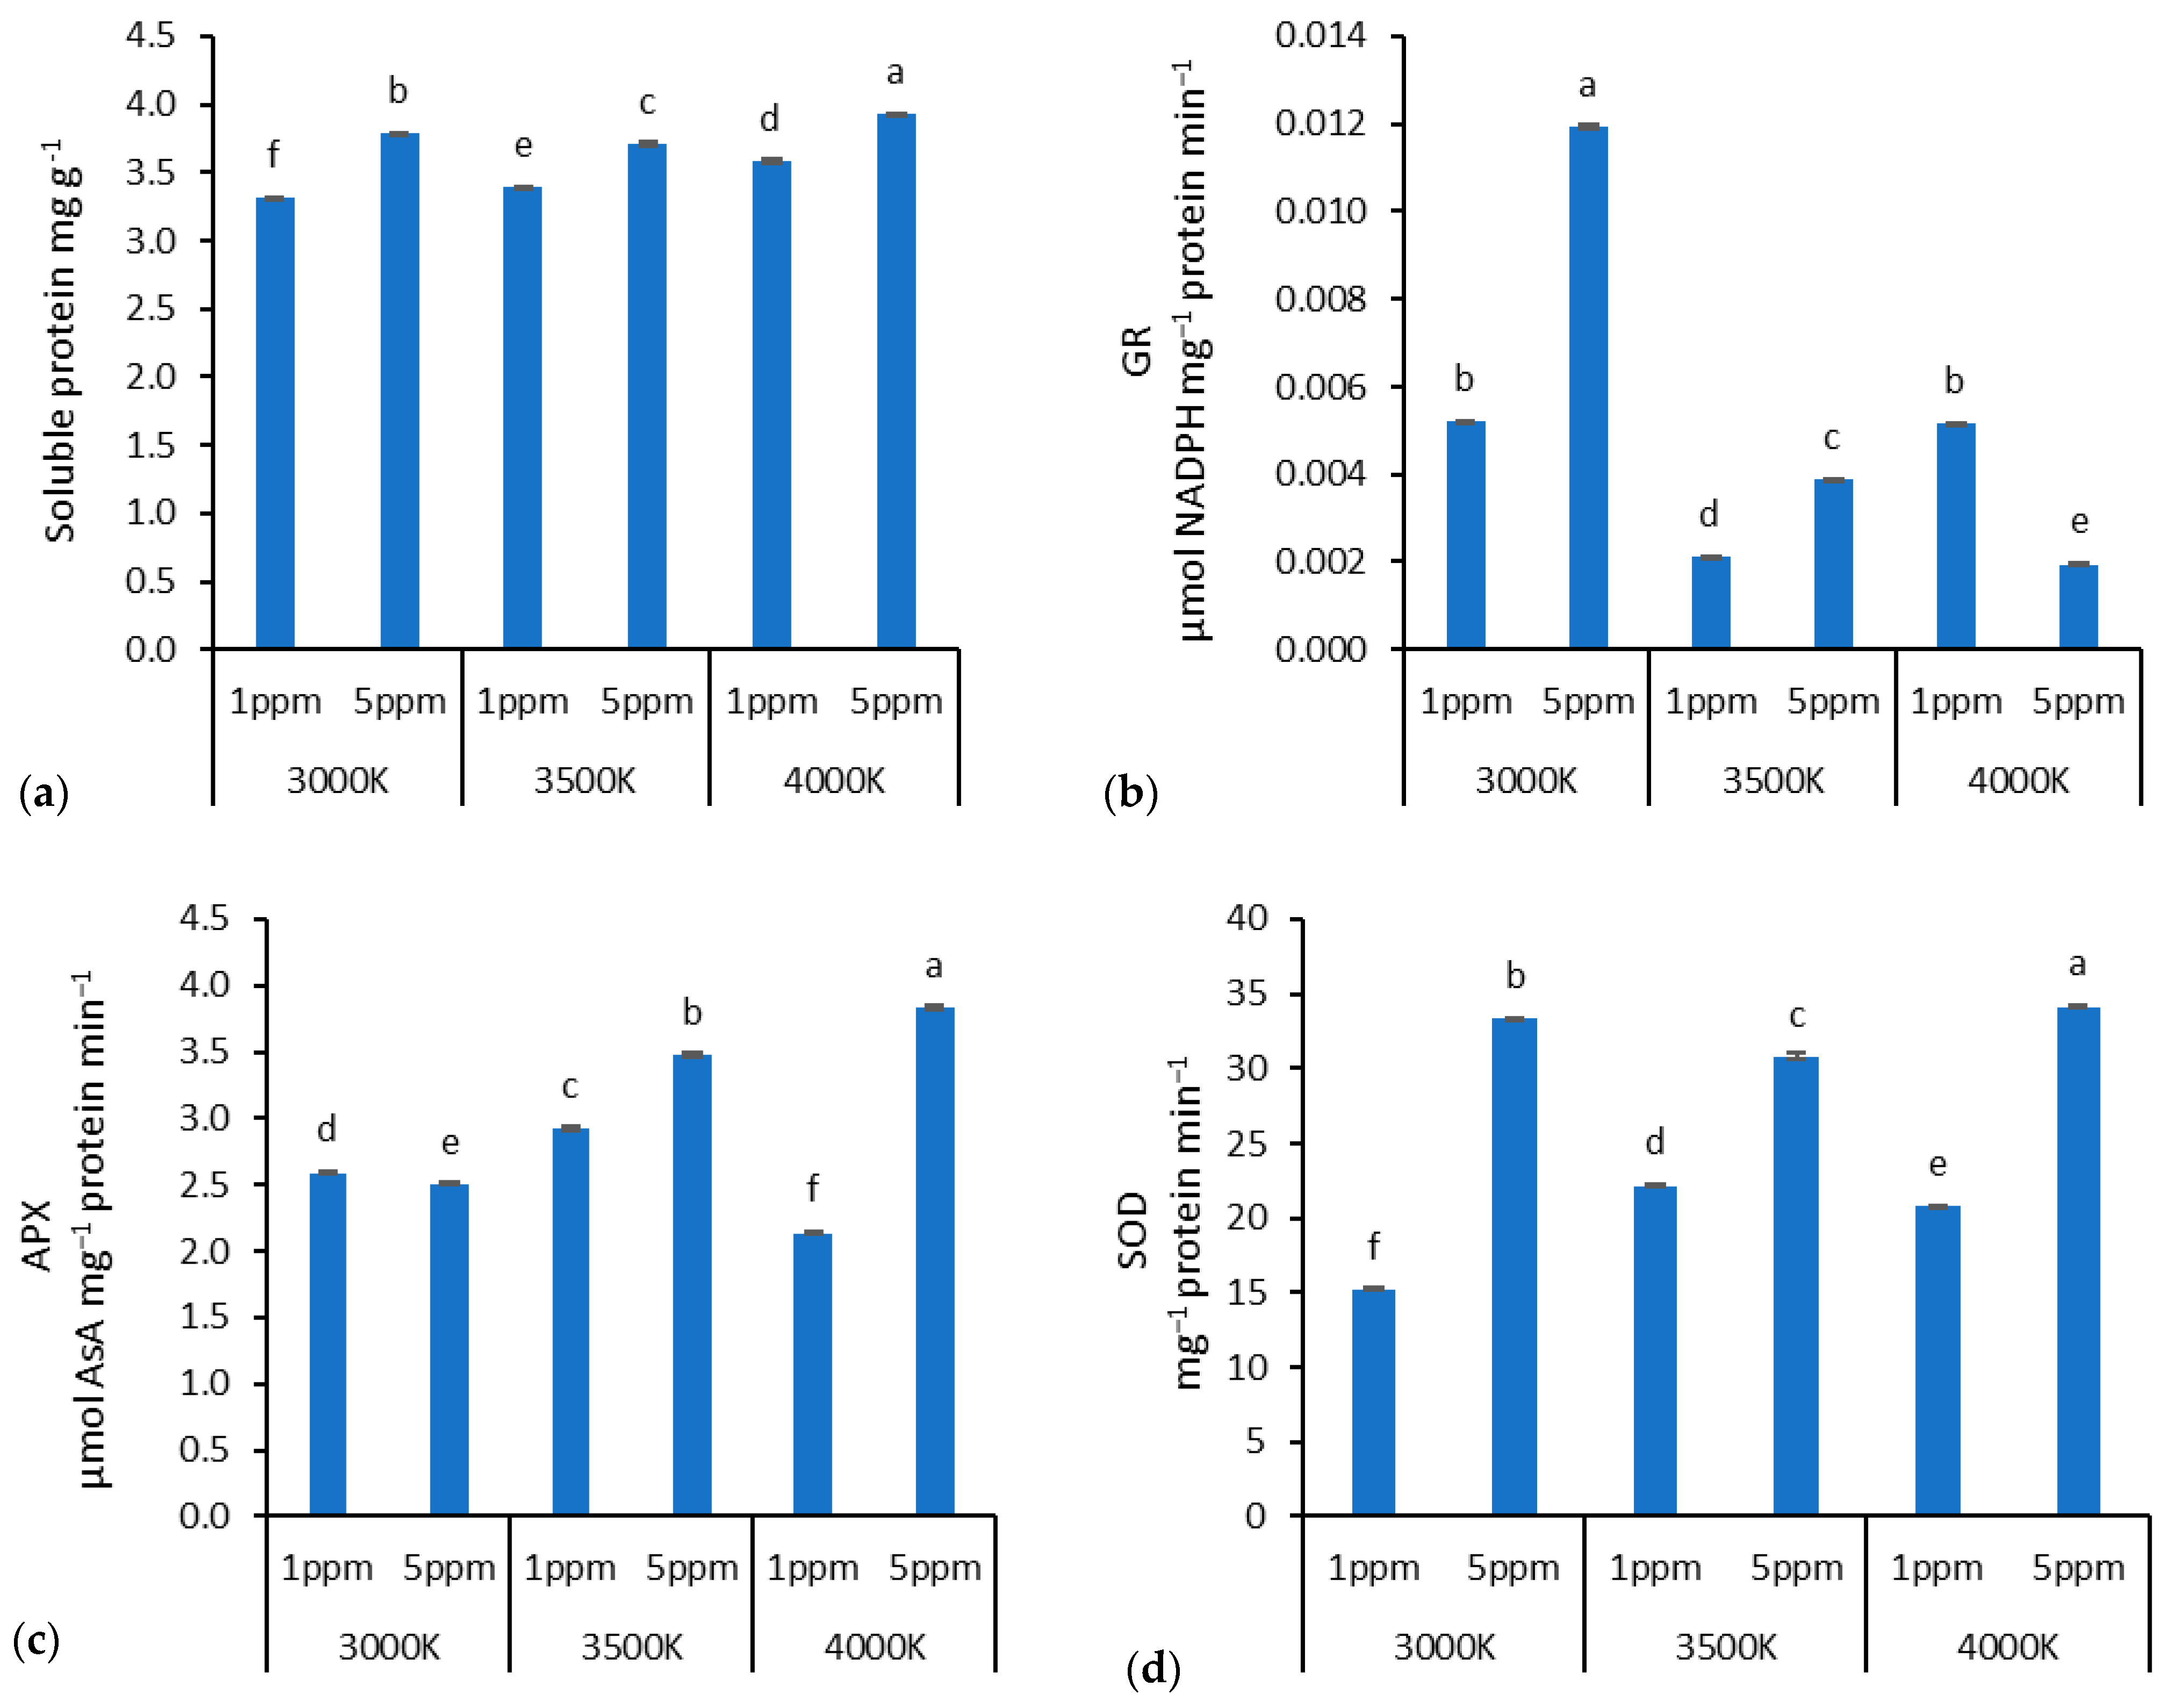
2.6. Measurement of Soluble Protein Content

The extracts used to determine the soluble protein content in the lettuce leaves were prepared by grinding 0.5 g of the fresh sample with liquid nitrogen and diluting with 5 mL of a 100 mM potassium-phosphate buffer (pH 7.8, 0.1 mM EDTA). After centrifugation for 10 min at 3000 rpm (Hermle Z300K, Baden-Württemberg, Germany), the supernatant was collected and used for the total soluble protein measurement. All steps in the preparation of the extract were carried out at 4 °C. The dye-binding method and bovine serum albumin were used as the standard for soluble protein determination. A 20 µL of an enzyme extract was mixed with 290 µL of a Bradford reagent diluted to 1:5 with DI water. Absorbance was read after 2 min using a spectrophotometer (SPECTROstar Nano, BMG Labtech microplate reader, Ortenberg, Germany) at 595 nm [37].

2.7. Antioxidant Enzymes Activities

The extracts used to determine the activity of superoxide dismutase (SOD), ascorbate peroxidase (APX), and glutathione reductase (GR) in lettuce leaves were prepared by grinding 0.5 g of fresh sample with liquid nitrogen and diluting within a 5 mL extraction buffer (100 mM potassium-phosphate buffer, pH 7.8, containing 0.1 mM EDTA). After centrifugation for 10 min at 3000 rpm (Hermle Z300K, Baden-Württemberg, Germany), the supernatant was collected and used for the assays of enzymatic activities. All steps in the preparation of the enzyme extract were carried out at 4 °C.
Superoxide dismutase (SOD, E.C.1.15.1.1) activity was estimated by the inhibition of the photochemical reduction in nitroblue tetrazolium (NBT) by the enzyme [38] as described by Giannopolitis and Ries [39] with the modifications by Dhindsa [40] and adapted to microplate reader. A total of 3 mL of the reaction mixture consisted of 13 mM methionine, 75 µM NBT, 100 mM potassium phosphate buffer (pH 7.8, containing 0.1 mM EDTA), 50 µL enzyme extract, and 13 μM riboflavin. The tubes were under 150 µmol m−2 s−1 for 1 min to initiate the reaction, and then covered. The absorbance was recorded after 30 min by a spectrophotometer (M501, Spectronic Camspec Ltd., Leeds, UK) at 560 nm, and one unit of enzyme activity was taken as that amount of enzyme, which reduced the absorbance reading to 50% in comparison to the tubes lacking the enzyme expressed as unit mg−1 protein min−1.
Ascorbate peroxidase (APX, E.C.1.1.11.1) was assayed by recording the decrease in optical density due to ascorbic acid at 290 nm, according to Nakano and Asada [38], with modifications to the microplate reader by Murshed [41]. The 1 mL assay mixture contained 0.1 M potassium phosphate buffer (pH 7.8, containing 0.1 mM EDTA), 0.5 mM ascorbic acid, and 0.1 mL enzyme extract, and 0.1 mL of 30 mM H2O2 was added to initiate the reaction. The decrease in absorbance was measured spectrophotometrically (M501, Spectronic Camspec Ltd., Leeds, UK) for 1 min, and the extinction coefficient of 2.8 mM−1 cm−1 for reduced ascorbate was used in calculating the enzyme activity that was expressed as µmol AsA mg−1 protein min−1.
Glutathione reductase (GR, E.C.1.6.4.2) activity was measured based on the rate of decrease in the absorbance of oxidized glutathione (GSSG), at 340 nm according to Smith [42], with modifications to the microplate reader by Murshed [41]. The reaction mixture contained 0.1 M potassium phosphate buffer (pH 7.8, containing 0.1 mM EDTA), 1 mM GSSG, 100 µL enzyme extract, and 75 µL 0.1 mM NADPH was added last to initiate the reaction. The decrease in the absorbance was measured by spectrophotometer (M501, Spectronic Camspec Ltd., Leeds, UK) and recorded every 5 min for 20 min. An absorption coefficient of 6.22 mM−1 cm−1 was calculated, and GR activity was defined as µmol NADPH mg−1 protein min−1.

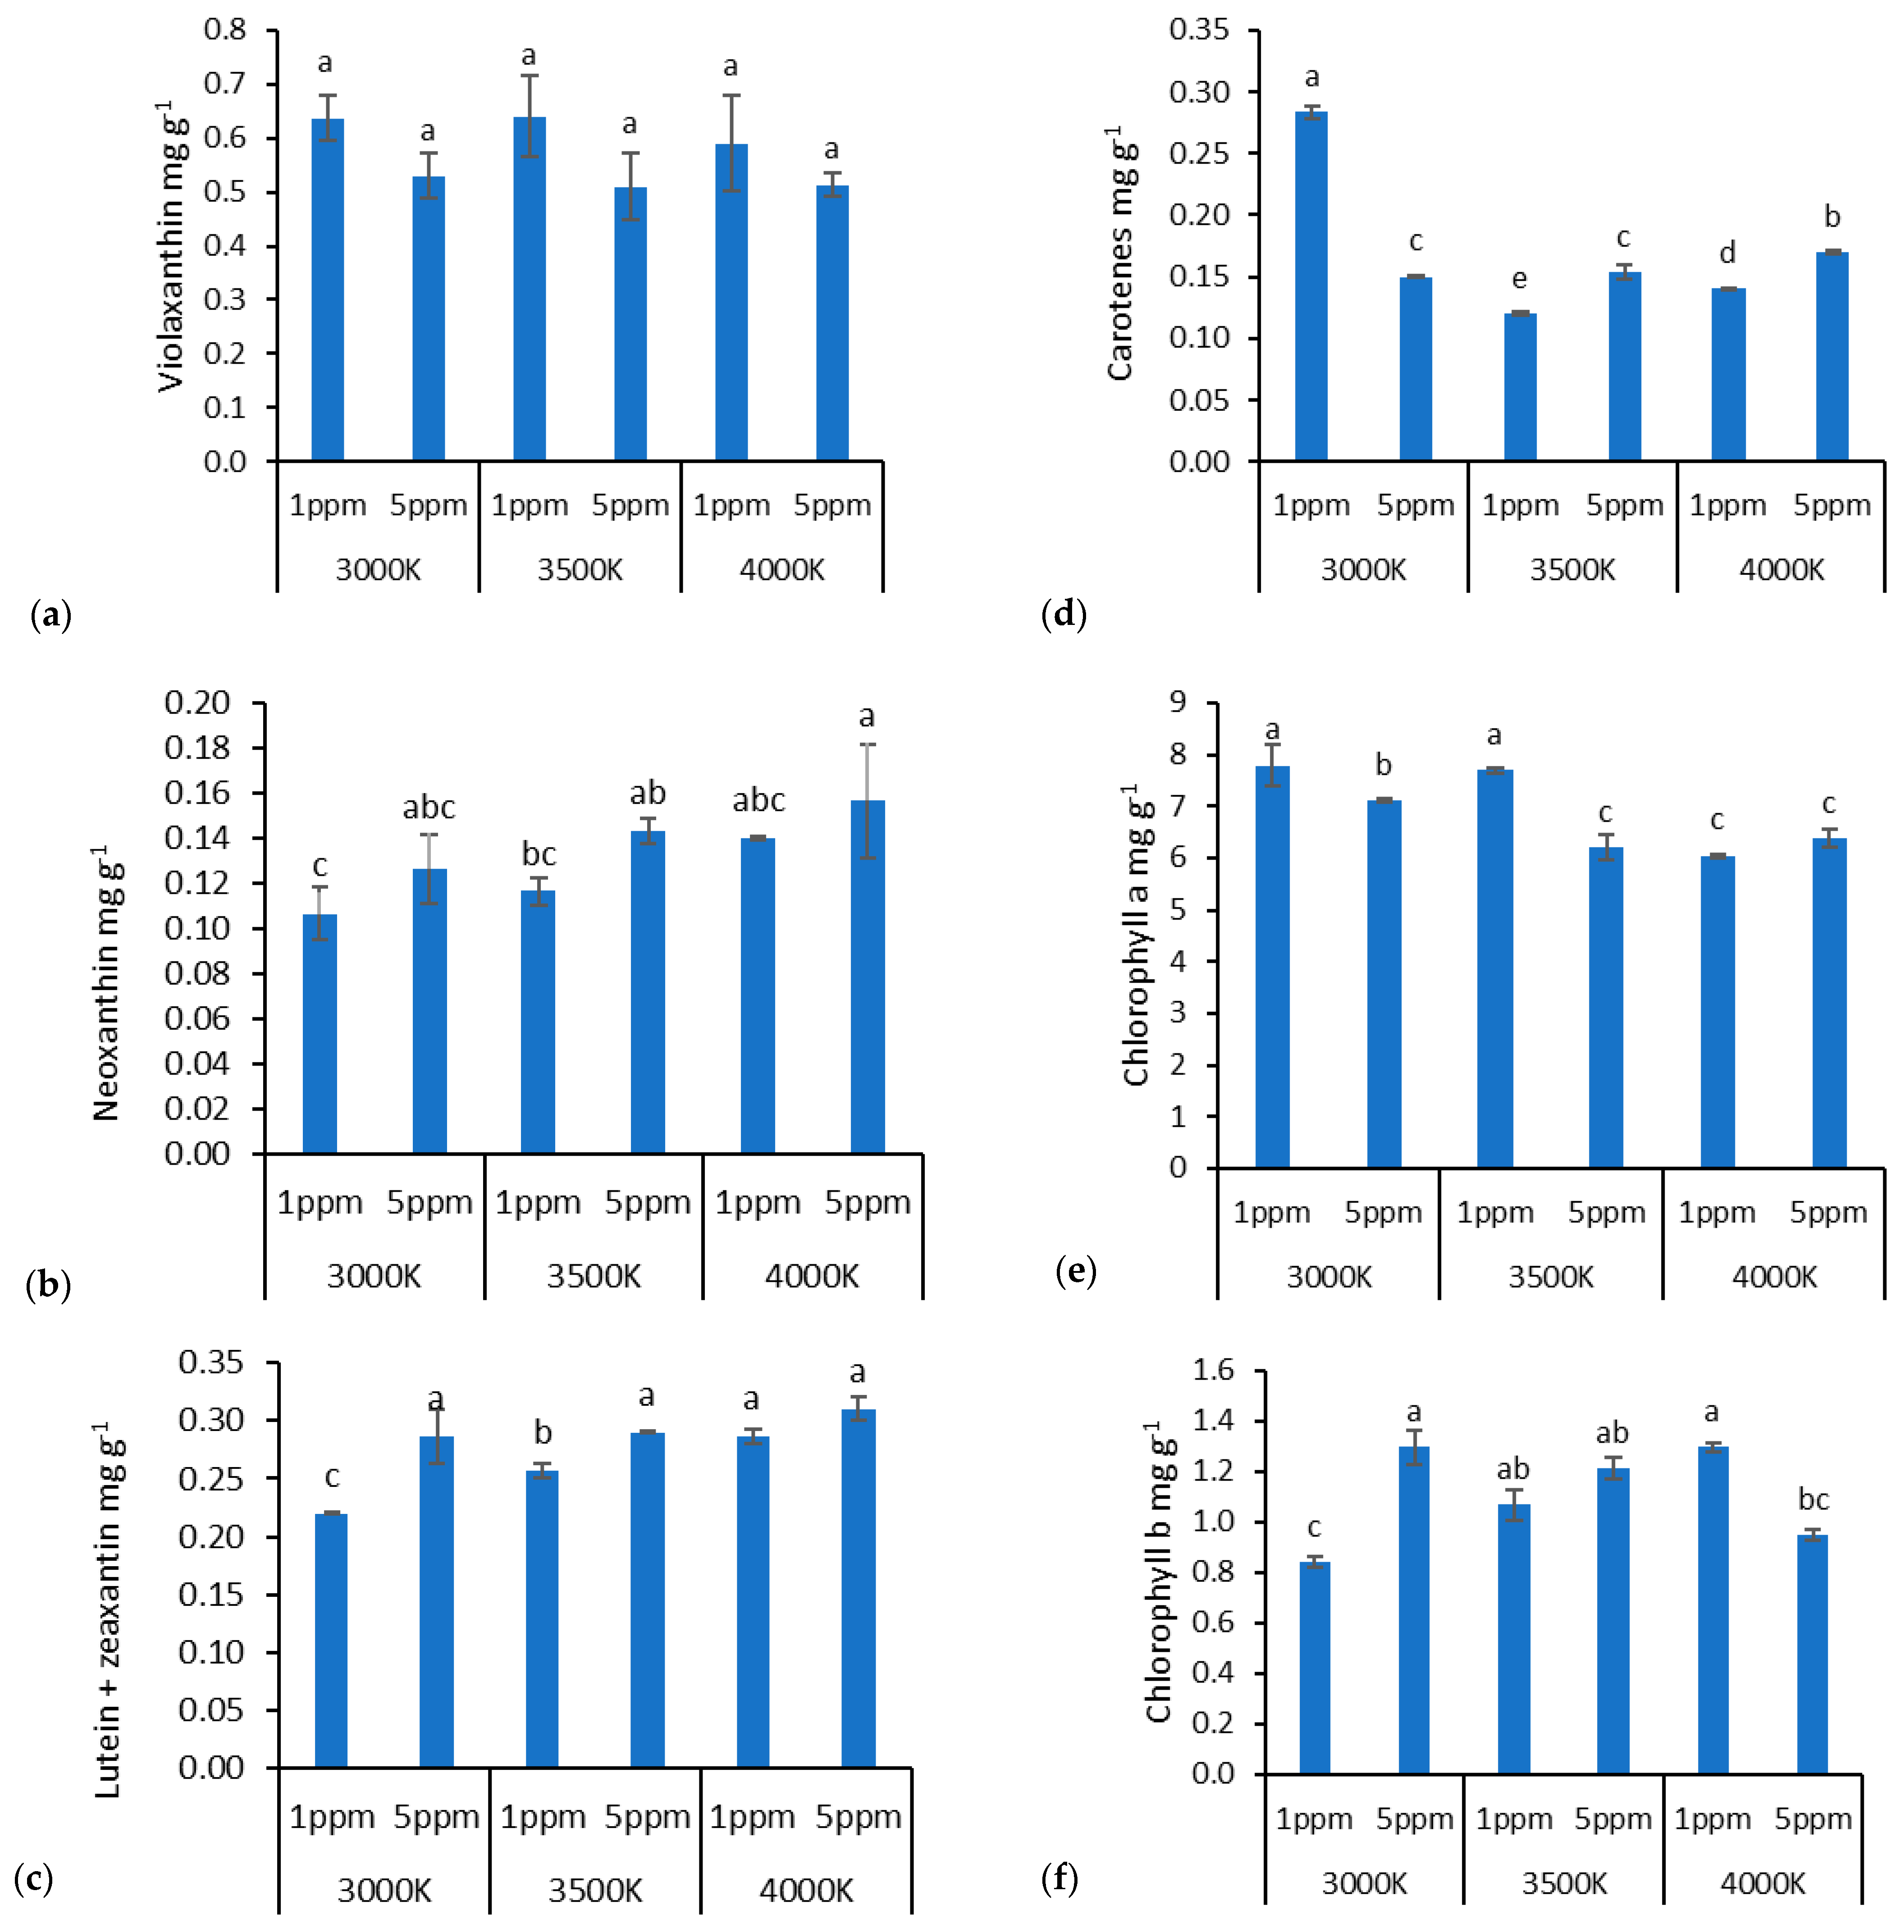
2.8. Determination of Carotenoids

Concentrations of α-carotene, β-carotene, lutein, neoxanthin, violaxanthin, and zeaxanthin were evaluated according to the methods of Edelenbos et al. [43], using HPLC on a YMC carotenoid column (3 µm particle size, 150 × 4.0 mm) (YMC, Kyoto, Japan). Carotenoids were extracted using 80% acetone (0.05 g lyophilized material diluted with 5 mL acetone, extraction carried out for 24 h at 4 °C), centrifuged (5 min, 4000× g) and filtrated through a 0.22 µm nylon membrane syringe filter (VWR International, USA). An HPLC 10A system (Shimadzu, Kyoto, Japan) equipped with a diode array (SPD-M 10A VP) detector was used for analysis. Peaks were detected at 440 nm. Each compound was identified by comparing the retention time and spectra of the peaks with those previously obtained by the injection of standards. The mobile phase consisted of A (80% methanol, 20% water) and B (100% ethyl acetate). The gradient was presented as follows: 0 min; 20% B, 2.5 min; 22.5% B, 20–22.5 min; 50% B, 24–26 min; 80% B, 31–34 min; 100% B, 42–47 min; and 20% B, flow rate 1 mL min−1.

2.9. Statistical Analysis

A statistical analysis was performed using Microsoft Excel 2016 and Addinsoft XLSTAT 2022 XLSTAT statistical and data analysis software (Long Island, NY, USA). A two-way analysis of variance (ANOVA) followed by Tukey’s honestly significant difference test (p < 0.05) for multiple comparisons was used to evaluate the differences between means (n = 3) of measurements

3. Results

Lettuce growth parameters were affected by both light and zinc (Zn), and their interaction concentration in the hydroponic solution. Both factors, individually and in their interaction, significantly impacted the total lettuce leaf area and the dry and fresh weight ratio (Table 2). Increasing the Zn concentration in the solution from 1 ppm to 5 ppm significantly reduced the plant leaf areas under 3500 K and 4000 K light, by 21% and 13%, respectively; meanwhile, no significant impact occurred under 3000 K. The 4000 K light resulted in a lower leaf area with both concentrations, and for the 3500 K light a lower leaf area occurred only at the 5 ppm Zn concentration in a hydroponic solution. Meanwhile, the lettuce grown under 3500 K light with 1 ppm Zn had a significantly higher dry and fresh weight (DW/FW) ratio compared to the other treatments (Figure 1). The Zn concentration under 3000 K and 4000 K light had no significant differences for DW/FW ratio.
The Zn content in lettuce leaves was affected by light, Zn, and their interaction concentration in the hydroponic solution (Table 3). The highest Zn concentration in lettuce was found under 3500 K lights using a solution with 5 ppm Zn. A 3500 K light increased the Zn accumulation in lettuce by leaves up to 7% compared to other lights using a 5 ppm solution (Figure 2). Meanwhile, the light had no significant effect using a 1 ppm solution.
The light and Zn concentrations in the hydroponic solution affected most of the detected sugars (Table 4). Fructose content in lettuce decreased under the 3000 K but increased under the 3500 K light, increasing the Zn concentration in the hydroponic solution (Figure 3a). Meanwhile, the Zn dose did not affect fructose under the 4000 K light. For sucrose, however, the 4000 K light significantly reduced the sucrose accumulation in lettuce leaves compared to the 3000 K and the 3500 K light, by up to 33–45% (Figure 3b). The highest amounts of glucose, fructose, and raffinose were found in lettuce grown under the 3000 K light. With the increasing Zn concentration in the hydroponic solution, the amount of sugars accumulated by the lettuce depended on the light under which it was grown. Under the 3000 K light, it accumulated less fructose and glucose but more maltose. In comparison, more fructose was accumulated under the 3500 K light with a higher Zn concentration and had no significant effect on other sugars. When grown under the 4000 K light, the Zn concentration in the hydroponic solution had no significant impact on the accumulation of sugars in lettuce leaves.
Light and Zn concentrations in the hydroponic solution affected the antioxidant properties of lettuce (Table 5). A higher Zn dose of 5 ppm in the hydroponic solution significantly enhanced the antioxidant response of lettuce when exposed to 3000 K and 3500 K light. In contrast, exposure to 4000 K light notably reduced the antioxidant response for both the 1 ppm and 5 ppm Zn doses. The most significant antioxidant response, as measured by DPPH, ABTS, and FRAP assays, occurred when the lettuce was grown under the 3500 K light with the increased Zn dose. Specifically, the antioxidant response increased by 12% for DPPH, 23% for ABTS, and 40% for FRAP with the 5 ppm Zn dose, compared to the 1 ppm dose under 3500 K light (Figure 4). Additionally, under the 3000 K light, the antioxidant response increased by 32% for DPPH, 83% for ABTS, and 1.7 times for FRAP, with a Zn dose higher than the 1 ppm dose. Meanwhile, the Zn dose had no significant effect when evaluating the total amount of phenolic compounds. However, the 4000 K light significantly reduced the total amount of phenolic compounds to 28–36% compared to lettuce grown under 3000 K and 3500 K lights.
The light and Zn concentrations in the hydroponic solution affected the antioxidant enzyme’s activities such as glutathione reductase (GR), ascorbate peroxidase (APX), and superoxide dismutase (SOD) and soluble protein content in lettuce leaves (Table 6). A higher Zn concentration in the solution led to increased protein content in lettuce leaves, with increases of 14%, 9%, and 9% for lettuce grown at 3000 K, 3500 K, and 4000 K, respectively. Similar trends were observed for SOD. Higher Zn concentration in the hydroponic solution resulted in a SOD higher by up to 2.2-fold, 39%, and 64% in lettuce grown under 3000 K, 3500 K, and 4000 K lights, respectively (Figure 5). Meanwhile, an increase of 18% and 79% in APX was observed only in lettuce grown under 3500 K and 4000 K light, respectively, compared to the solution with lower Zn concentrations. Higher Zn concentration in the hydroponic solution also led to an increase in GR of more than 2 times under 3000 K light and of 84% under 3500 K light, while under 4000 K light, with a higher Zn concentration, the decrease in GR reached 2.5 times (Figure 5).
The light and Zn concentrations in the hydroponic solution affected the chlorophylls and carotenoids in lettuce, except for violaxanthin, for which no significant differences were found (Table 7). Higher Zn concentration increased neoxanthin, lutein, and zeaxanthin levels, and chlorophyll b under 3000 K light. At the same time, the levels of carotenes and chlorophyll a in lettuce leaves decreased under the same conditions. The 3500 K and 4000 K lights increased liutein + zeaxanthin content compared to the 3000 K light (Figure 6c). Lettuce grown under 3000 K with 1 ppm Zn solution had higher carotene content compared to other treatments; it was higher from 88% to 2.3 times (Figure 6d).
An analysis of principal components (PCA) was conducted to discuss the combined effects of lighting and Zn doses on the biochemical properties of hydroponically grown lettuces (Figure 7). The first four PCA F1–F4, had eigenvalues ranging from 8.333 to 2.293 and collectively explained 37.88% to 84.72% of the variability. F1, which accounted for 37.88% of the total variability, was primarily associated with the Zn content, fructose, glucose, maltose, total protein content, superoxide dismutase, neoxanthin, lutein, zeaxanthin, carotenes, and chlorophyll A. F2 represented 20.74% of the total variability and included sucrose, DPPH, ABTS scavenging activity, FRAP, and total phenolic compounds. F3 explained 15.68% of the variability, including raffinose, violaxanthin, and xanthophylls. F4 explained 10.42% of the variability and included glutathione reductase, ascorbate peroxidase, and chlorophyll B. Figure 1 depicts the PCA of the first two components (F1 and F2), illustrating the relationships among the variables. It can be observed that the 5 ppm Zn dose combined with 3000 K and 4000 K lighting affected various biochemical factors, including DPPH and ABTS scavenging activity and the Fe-reducing antioxidant power.
Additionally, this combination influenced chlorophyll B, maltose, superoxide dismutase, and ascorbate peroxidase levels. Furthermore, the 1 and 5 ppm Zn doses at 4000 K impacted carotenoids such as neoxanthin, lutein, zeaxanthin, and total protein content. In lettuce exposed to a 1 ppm Zn dose combined with 3000 K and 3500 K lighting, the effect was found on TPC, sucrose, chlorophyll A, raffinose, fructose, glucose, carotene, violaxanthin, and xanthophylls.

4. Discussion

4.1. Zn Doses and Lighting Impact on Zn Accumulation in Lettuce Leaves

However, apart from the fact that the R:B ratio of LEDs greatly influences the absorption of trace elements [23,44,45], it is worth noting that wide-spectrum white LEDs [46,47,48,49] also have an impact. White LEDs, typically phosphor-coated blue LEDs, provide a full spectrum, including green light, while red/blue combinations aim to maximize energy efficiency [47]. Our study indicates that using a broad-spectrum 3500 K light combined with a 5 ppm Zn solution led to a 7% increase in Zn accumulation in lettuce compared to the 3000 K and 4000 K lighting conditions (Figure 2). Additionally, we found a significant difference in the Zn concentrations used; lettuce accumulated up to 46% more Zn when treated with a 5 ppm solution compared to a 1 ppm solution. It is important to note that while lighting of 3500 K combined with a Zn concentration of 5 ppm resulted in the highest levels of Zn in the plants, it also led to the lowest leaf area and dry weight/fresh weight ratios in lettuce (Figure 1).
It should be noted that the lettuce cultivar has a significant influence on Zn accumulation [14]. In our study, the Zn content increased from 57 to 83 mg kg−1 in ‘Little Gem’ lettuce leaves (Figure 2). A study that investigated two lettuce cultivars, ‘Saladela’ and ’Vanda’, found that ‘Saladela’ is more tolerant to higher doses of Zn and can accumulate up to 260 µg when a dose of 2.4 mg g−1 Zn is used. Various lettuce varieties exhibit different abilities to accumulate Zn under specific lighting conditions. For instance, Lollo Rossa can accumulate between 31.8 and 55.6 mg kg−1 of Zn when exposed to B LED (450 nm) and R3:B1 lighting and achieve a 46.4 mg kg−1 level under white lighting [46]. In contrast, Lollo Bionda shows its lowest Zn content of 32.8 mg kg−1 under R LED (656 nm), while the highest content, 51.0 mg kg−1, is recorded under R3:B1 lighting, and 45.8 mg kg−1 under white light [46]. Red leaf lettuce variety “New Red Fire” accumulates 49.48 mg kg−1 of Zn under white light. However, this amount increases to 52.35 mg kg−1 when white light is supplemented with R LED. On the other hand, the green leaf lettuce variety “Two Star” reaches a maximum Zn accumulation of 34.73 mg kg−1 under white light, but the addition of any other LEDs reduces the Zn content. The lettuce variety “Yidali” accumulates approximately 40 mg kg−1 of Zn with the R1:B1 ratio, yet significantly lower levels, about 20 mg kg−1, are observed under the R3:B1 LED ratio [50].
Additionally, lettuce grown with 0.05, 5, and 10 ppm Zn doses was found to increase the Zn content from approximately 39 to 43 mg kg−1, but this study did not specify the lettuce variety or the used lighting parameters, which could have significantly influenced the results of the experiment [16]. Furthermore, research indicates [24] that high-pressure sodium lamps are not the best choice for promoting growth and enhancing the nutritional quality of lettuce grown indoors, especially when natural daylight or other supplemental lighting options are limited. Instead, LED lighting proves to be a more effective solution for influencing the regulatory processes that govern plant nutrient uptake. For instance, replacing red LEDs with deep red LEDs significantly increases the uptake of Fe and Zn. Additionally, blue LEDs are more effective for promoting the Zn uptake than deep blue LEDs [24]. The highest amount of Zn (103 mg kg−1) was found when the lettuce was grown under R 80%, B 19%, FR 1% LEDs with 150 µmol m2 s1 PPFD [24].
For example, white LEDs, which can vary in their spectrum, can have similar effects on indoor hydroponic lettuce’s morphological and biochemical properties [49,50]. If the broad-spectrum phosphor-converted light (white) were partially replaced by blue and red light, the blue photon flux density would change first, affecting the phenotypic and biochemical responses of lettuce. Although plant growth under white LEDs partially replaced by blue and red LEDs, as well as blue, green, and red LEDs, may be phenotypically almost indistinguishable [49], the biochemical differences are often evident [46,47,48,50]. Studies [50] show that white LED light can improve plant growth and nutritional value as effectively, or better than RB LED light due to the higher transmission of G light to the leaves. Leaves absorb about 70–80% of G light, penetrating deeper into the leaf layers than red and blue light [27,51]. This deep transmission supports photosynthesis in the lower leaf layers and canopy. In our experiment, it was observed that lettuce grown under full-spectrum (white) LED lamps accumulated varying amounts of dry matter, depending on the spectral composition and total leaf area. The 3000 K spectrum, which has less blue light and more red light, resulted in a larger leaf area but lower dry matter content. In contrast, the 4000 K spectrum, which is similar to 3500 K but contains more green light, also exhibited lower dry matter content (Figure 1).

4.2. Zn Doses and Lighting Impact on Biochemical Properties in Lettuce

The content of photosynthesis pigments is crucial for assessing photosynthetic capability. According to other studies, red light promotes leaf growth but limits chlorophyll synthesis, whereas blue light enhances chlorophyll and carotenoid content, leading to an increased light absorption and stronger photosynthesis [52]. On the other hand, the combination of white LEDs with 660 nm red light can significantly enhance photosynthesis and photomorphogenesis due to its alignment with chlorophyll and phytochrome absorption peaks [53,54]. Our study found that the chlorophyll level increased in lettuce grown under 3000 K and 3500 K lighting when exposed to 1 ppm of Zn (Figure 6). Chlorophyll b levels were higher in lettuce exposed to 3000 K lighting with 5 ppm Zn and 4000 K lighting with 1 ppm Zn. Additionally, a significant increase in carotene was observed in lettuce under 3000 K lighting with 1 ppm Zn (Figure 6). As mentioned above, photosynthetic pigments are indicators of productivity. In our findings, we observed that the variant with 3000 K lighting and a 1 ppm Zn dose resulted in the largest lettuce leaf area and weight, and this variant also had the highest abundance of chlorophyll and carotenes. Furthermore, Behtash and coauthors [16] prove that increasing the Zn concentration increases chlorophylls and carotenoids accordingly.
An increase in carotenoids such as neoxanthin, lutein, zeaxanthin, and violaxanthin may indicate a disruption in homeostasis within the plant under stress conditions. For instance, our study shows that at a higher Zn concentration of 5 ppm, the levels of these non-enzymatic antioxidants increase, especially under 4000 K lighting. Additionally, we can observe stress conditions by analyzing the results of enzymatic antioxidants. When assessing antioxidant activity, it was found that GR was most significantly affected by the combination of a 5 ppm Zn dose and 3000 K illumination. APX activity showed a notable increase when the lettuce was exposed to 5 ppm Zn and 3500 K or 4000 K lighting. Furthermore, SOD activity was significantly enhanced by the higher 5 ppm Zn dose (Figure 5). The results of the lettuce leaf area and biomass reduction complement the stress conditions induced on the plants.
A dose of 1 ppm of Zn combined with 3000 K illumination significantly increased the levels of fructose and glucose in lettuce, indicating that this combination was the most effective for promoting lettuce growth (Figure 3). The 3000 K lighting has a warmer color, with a higher red component, which research suggests can stimulate the production of these sugars [55], reflecting efficient photosynthesis. However, the levels of sucrose decreased significantly under the 4000 K illumination. Red light is crucial for the efficiency of photosynthesis because it stimulates the synthesis of carbohydrates, including sucrose [56]. If the intensity of red light is insufficient, which could happen under 4000 K illumination, photosynthesis may be less efficient, and the amount of sugars produced may be reduced. In lettuce grown under 3000 K illumination, a higher dose of 5 ppm of Zn notably increased the maltose levels compared to the 1 ppm dose. Additionally, raffinose levels were significantly higher in lettuce grown under 3000 K illumination.
The results of DPPH, ABTS, FRAP, and TPC analyses showed the same trend. Their estimates increased with increasing Zn dose under 3000 K and 3500 K illumination (Figure 4). The highest DPPH and ABTS scavenging activity, TPC, and Fe-reducing antioxidant power were determined under the 3500 K illumination with a 5 ppm Zn dose, while the lowest results of all indicators were determined in lettuce grown under 4000 K illumination. For example, a study found that supplementing white light with B LEDs can increase TPC levels in lettuce [45,47,57]. On the other hand, an appropriate R:G:B ratio may lead to an increase in TPC and other non-enzymatic antioxidants in lettuce [50]. Furthermore, studies are showing that higher Zn concentrations increase the activity of DPPH and ABTS scavenging activity and Fe-reducing antioxidant power [57,58,59]. Another important factor is that most studies examined lettuce that had reached technical maturity, which may respond to illumination and Zn doses differently from the baby leaf stage lettuce we studied.

5. Conclusions

This study revealed significant interaction effects between LED lighting and zinc (Zn) concentration on lettuce growth and quality. The results indicated that broad-spectrum white LED lighting, particularly in the 3000–4000 K range, combined with optimal Zn doses (1–5 ppm), can significantly enhance lettuce growth, biochemical properties, and nutritional value. Specifically, the 3500 K lighting paired with a 5 ppm Zn solution proved to be particularly effective, maximizing the Zn accumulation in the plants. Additionally, the study showed that different combinations of light and Zn can be utilized to optimize various plant parameters, such as chlorophyll content, antioxidant activity, and sugar balance. These findings create new opportunities in controlled environment agriculture, enabling precise control over lettuce growth and nutritional quality through LED lighting technologies and micronutrient supplementation.

Supplementary Materials

The following supporting information can be downloaded at: https://www.mdpi.com/article/10.3390/horticulturae11030284/s1, Figure S1. Spectra of different lighting of light-emitting diodes (3000 K, 3500 K and 4000 K).

Author Contributions

Conceptualization, A.B.; methodology, A.B. and V.V.-K.; formal analysis, V.V.-K., R.S. and K.L.; writing—original draft preparation, K.L. and R.S.; writing—review and editing, A.B., K.L. and R.S.; supervision, A.B.; project administration, A.B. All authors have read and agreed to the published version of the manuscript.

Funding

This project has received funding from the Research Council of Lithuania (LMTLT), agreement No. S-MIP-19-2.

Data Availability Statement

The original contributions presented in the study are included in the article/Supplementary Material, further inquiries can be directed to the corresponding author.

Conflicts of Interest

The authors declare no conflicts of interest.

Abbreviations

The following abbreviations are used in this manuscript:
MDPIMultidisciplinary Digital Publishing Institute
DOAJDirectory of open access journals
PPFDPhotosynthetic Photon Flux Density
ABTS2,2′-azino-bis(3-ethylbenzothiazoline-6-sulfonic acid)
DPPH2,2-Diphenyl-1-picrylhydrazyl
FRAPFerric reducing antioxidant power
TPCTotal phenols content
LEDlight-emitting diodes
SODsuperoxide dismutase
APXascorbate peroxidase
GRglutathione reductase

References

  1. Khan, S.T.; Malik, A.; Alwarthan, A.; Shaik, M.R. The Enormity of the Zinc Deficiency Problem and Available Solutions; an Overview. Arab. J. Chem. 2022, 15, 103668. [Google Scholar] [CrossRef]
  2. Gibson, R.S. Principles of Nutritional Assessment; Oxford University Press: Oxford, UK, 2005; ISBN 978-0-19-517169-3. [Google Scholar]
  3. Maares, M.; Haase, H. A Guide to Human Zinc Absorption: General Overview and Recent Advances of In Vitro Intestinal Models. Nutrients 2020, 12, 762. [Google Scholar] [CrossRef] [PubMed]
  4. Nandal, N.; Solanki, M. The Zn as a Vital Micronutrient in Plants. J. Microbiol. Biotechnol. Food Sci. 2021, 11, 4026. [Google Scholar] [CrossRef]
  5. Clemens, S. The Cell Biology of Zinc. J. Exp. Bot. 2022, 73, 1688–1698. [Google Scholar] [CrossRef]
  6. Hamzah Saleem, M.; Usman, K.; Rizwan, M.; Al Jabri, H.; Alsafran, M. Functions and Strategies for Enhancing Zinc Availability in Plants for Sustainable Agriculture. Front. Plant Sci. 2022, 13, 1033092. [Google Scholar] [CrossRef]
  7. Borrego, A.C.; Abreu, R.; Carreira, F.A.; Caetano, F.; Vasconcelos, A.L. Environmental Taxation on the Agri-Food Sector and the Farm to Fork Strategy: The Portuguese Case. Sustainability 2023, 15, 12124. [Google Scholar] [CrossRef]
  8. Manzoni, A. The Evolution of EU Agri-Food Policymaking: A Long Path Towards a Food System Approach. In The Food Commons Approach in the EU Agri-Food Law: Reframing the Common Agricultural Policy for More Ecological Food Systems in Europe; Manzoni, A., Ed.; Springer Nature: Cham, Switzerland, 2024; pp. 61–155. ISBN 978-3-031-64565-5. [Google Scholar]
  9. Fonseca, L.M.; Domingues, J.P.; Dima, A.M. Mapping the Sustainable Development Goals Relationships. Sustainability 2020, 12, 3359. [Google Scholar] [CrossRef]
  10. Szerement, J.; Szatanik-Kloc, A.; Mokrzycki, J.; Mierzwa-Hersztek, M. Agronomic Biofortification with Se, Zn, and Fe: An Effective Strategy to Enhance Crop Nutritional Quality and Stress Defense—A Review. J. Soil Sci. Plant Nutr. 2022, 22, 1129–1159. [Google Scholar] [CrossRef]
  11. Magwaza, S.T.; Magwaza, L.S.; Odindo, A.O.; Mditshwa, A. Hydroponic Technology as Decentralised System for Domestic Wastewater Treatment and Vegetable Production in Urban Agriculture: A Review. Sci. Total Environ. 2020, 698, 134154. [Google Scholar] [CrossRef]
  12. Shi, M.; Gu, J.; Wu, H.; Rauf, A.; Emran, T.B.; Khan, Z.; Mitra, S.; Aljohani, A.S.M.; Alhumaydhi, F.A.; Al-Awthan, Y.S.; et al. Phytochemicals, Nutrition, Metabolism, Bioavailability, and Health Benefits in Lettuce—A Comprehensive Review. Antioxidants 2022, 11, 1158. [Google Scholar] [CrossRef]
  13. Giordano, M.; El-Nakhel, C.; Pannico, A.; Kyriacou, M.C.; Stazi, S.R.; De Pascale, S.; Rouphael, Y. Iron Biofortification of Red and Green Pigmented Lettuce in Closed Soilless Cultivation Impacts Crop Performance and Modulates Mineral and Bioactive Composition. Agronomy 2019, 9, 290. [Google Scholar] [CrossRef]
  14. Lima, B.M.D.; Noboa, C.S.; Lima, F.M.D.; Mello, S.D.C.; Purquerio, L.F.V.; Sala, F.C. Agronomic Biofortification with Zinc in Hydroponically Cultivated Lettuce. Aust. J. Crop Sci. 2023, 17, 195–205. [Google Scholar] [CrossRef]
  15. Preciado-Rangel, P.; Campos-Ortiz, A.; Chávez, E.S.; Reyes-Gonzalez, A.; Ruiz-Espinoza, F.; Ojeda-Barrios, D.; Hernandez-Montiel, L. Zinc Biofortification Improves Yield, Nutraceutical Quality and Antioxidant Capacity in Lettuce. Trop. Subtrop. Agroecosystems 2021, 24, 1–10. [Google Scholar] [CrossRef]
  16. Behtash, F.; Fakhrghazi, H.; Hajizadeh, H.S.; Aghaee, A.; Pourmohammad, A. Effect of Zinc and Boron on Yield, Quality Attributes and Physiological Traits of Lettuce under Hydroponic Culture. Pak. J. Bot. 2023, 55, 1267–1276. [Google Scholar] [CrossRef] [PubMed]
  17. Meneghelli, C.M.; Fontes, P.C.R.; Milagres, C.d.C.; da Silva, J.M.; Junior, E.G. Zinc-Biofortified Lettuce in Aeroponic System. J. Plant Nutr. 2021, 44, 2146–2156. [Google Scholar] [CrossRef]
  18. Xu, J.; Guo, Z.; Jiang, X.; Ahammed, G.J.; Zhou, Y. Light Regulation of Horticultural Crop Nutrient Uptake and Utilization. Hortic. Plant J. 2021, 7, 367–379. [Google Scholar] [CrossRef]
  19. Ramezani, S.; Yousefshahi, B.; Ramezan, D.; Zargar, M.; Pakina, E.; Bayat, M. Selenium, Iodine, and Supplementary Blue Light Enriched Fenugreek (Trigonella foenum-gracum L.) in Terms of Biochemical Quality, Mineral Uptake, and Trace Elements Accumulation in a Hydroponic System. Agriculture 2023, 13, 2009. [Google Scholar] [CrossRef]
  20. Brazaitytė, A.; Miliauskienė, J.; Vaštakaitė-Kairienė, V.; Sutulienė, R.; Laužikė, K.; Stašytė, K.; Duchovskis, P.; Samuolienė, G. The Response of Baby Leaf Lettuce to Selenium Biofortification under Different Lighting Conditions. Biol. Life Sci. Forum 2021, 3, 10. [Google Scholar] [CrossRef]
  21. Hammock, H.A.; Kopsell, D.A.; Sams, C.E. Application Timing and Duration of LED and HPS Supplements Differentially Influence Yield, Nutrient Bioaccumulation, and Light Use Efficiency of Greenhouse Basil across Seasons. Front. Plant Sci. 2023, 14, 1174823. [Google Scholar] [CrossRef]
  22. Vaštakaitė-Kairienė, V.; Brazaitytė, A.; Miliauskienė, J.; Runkle, E.S. Red to Blue Light Ratio and Iron Nutrition Influence Growth, Metabolic Response, and Mineral Nutrients of Spinach Grown Indoors. Sustainability 2022, 14, 12564. [Google Scholar] [CrossRef]
  23. Li, X.; Liu, K.; He, X.; Chen, Y.; Tan, J.; Jiang, H.; He, R.; Li, Y.; Liu, H. Mutual Effects of Zinc Concentration and Ratio of Red-Blue Light on Growth and Nutritional Quality of Flowering Chinese Cabbage Sprouts. Horticulturae 2023, 9, 226. [Google Scholar] [CrossRef]
  24. Pinho, P.; Jokinen, K.; Halonen, L. The Influence of the LED Light Spectrum on the Growth and Nutrient Uptake of Hydroponically Grown Lettuce. Light. Res. Technol. 2017, 49, 866–881. [Google Scholar] [CrossRef]
  25. Park, Y.; Runkle, E.S. Spectral Effects of Light-Emitting Diodes on Plant Growth, Visual Color Quality, and Photosynthetic Photon Efficacy: White versus Blue plus Red Radiation. PLoS ONE 2018, 13, e0202386. [Google Scholar] [CrossRef] [PubMed]
  26. Tarakanov, I.G.; Tovstyko, D.A.; Lomakin, M.P.; Shmakov, A.S.; Sleptsov, N.N.; Shmarev, A.N.; Litvinskiy, V.A.; Ivlev, A.A. Effects of Light Spectral Quality on Photosynthetic Activity, Biomass Production, and Carbon Isotope Fractionation in Lettuce, Lactuca Sativa L., Plants. Plants 2022, 11, 441. [Google Scholar] [CrossRef] [PubMed]
  27. Terashima, I.; Fujita, T.; Inoue, T.; Chow, W.S.; Oguchi, R. Green Light Drives Leaf Photosynthesis More Efficiently than Red Light in Strong White Light: Revisiting the Enigmatic Question of Why Leaves Are Green. Plant Cell Physiol. 2009, 50, 684–697. [Google Scholar] [CrossRef]
  28. Tewari, R.K.; Yadav, N.; Gupta, R.; Kumar, P. Oxidative Stress Under Macronutrient Deficiency in Plants. J. Soil Sci. Plant Nutr. 2021, 21, 832–859. [Google Scholar] [CrossRef]
  29. Korobova, A.; Ivanov, R.; Timergalina, L.; Vysotskaya, L.; Nuzhnaya, T.; Akhiyarova, G.; Kusnetsov, V.; Veselov, D.; Kudoyarova, G. Effect of Low Light Stress on Distribution of Auxin (Indole-3-Acetic Acid) Between Shoot and Roots and Development of Lateral Roots in Barley Plants. Biology 2023, 12, 787. [Google Scholar] [CrossRef]
  30. Metallo, R.M.; Kopsell, D.A.; Sams, C.E.; Bumgarner, N.R. Influence of Blue/Red vs. White LED Light Treatments on Biomass, Shoot Morphology, and Quality Parameters of Hydroponically Grown Kale. Sci. Hortic. 2018, 235, 189–197. [Google Scholar] [CrossRef]
  31. Tang, Y.; Mao, R.; Guo, S. Effects of LED Spectra on Growth, Gas Exchange, Antioxidant Activity and Nutritional Quality of Vegetable Species. Life Sci. Space Res. 2020, 26, 77–84. [Google Scholar] [CrossRef]
  32. Kang, C.H.; Yoon, E.K.; Muthusamy, M.; Kim, J.A.; Jeong, M.-J.; Lee, S.I. Blue LED Light Irradiation Enhances L-Ascorbic Acid Content While Reducing Reactive Oxygen Species Accumulation in Chinese Cabbage Seedlings. Sci. Hortic. 2020, 261, 108924. [Google Scholar] [CrossRef]
  33. Re, R.; Pellegrini, N.; Proteggente, A.; Pannala, A.; Yang, M.; Rice-Evans, C. Antioxidant Activity Applying an Improved ABTS Radical Cation Decolorization Assay. Free Radic. Biol. Med. 1999, 26, 1231–1237. [Google Scholar] [CrossRef]
  34. Sharma, O.P.; Bhat, T.K. DPPH Antioxidant Assay Revisited. Food Chem. 2009, 113, 1202–1205. [Google Scholar] [CrossRef]
  35. Benzie, I.F.F.; Strain, J.J. The Ferric Reducing Ability of Plasma (FRAP) as a Measure of “Antioxidant Power”: The FRAP Assay. Anal. Biochem. 1996, 239, 70–76. [Google Scholar] [CrossRef] [PubMed]
  36. Ainsworth, E.A.; Gillespie, K.M. Estimation of Total Phenolic Content and Other Oxidation Substrates in Plant Tissues Using Folin–Ciocalteu Reagent. Nat. Protoc. 2007, 2, 875–877. [Google Scholar] [CrossRef] [PubMed]
  37. Bradford, M.M. A Rapid and Sensitive Method for the Quantitation of Microgram Quantities of Protein Utilizing the Principle of Protein-Dye Binding. Anal. Biochem. 1976, 72, 248–254. [Google Scholar] [CrossRef]
  38. Nakano, Y.; Asada, K. Hydrogen Peroxide Is Scavenged by Ascorbate-Specific Peroxidase in Spinach Chloroplasts. Plant Cell Physiol. 1981, 22, 867–880. [Google Scholar] [CrossRef]
  39. Giannopolitis, C.N.; Ries, S.K. Superoxide Dismutases: I. Occurrence in Higher Plants. Plant Physiol. 1977, 59, 309–314. [Google Scholar] [CrossRef] [PubMed]
  40. Dhindsa, R.S.; Plumb-Dhindsa, P.; Thorpe, T.A. Leaf Senescence: Correlated with Increased Levels of Membrane Permeability and Lipid Peroxidation, and Decreased Levels of Superoxide Dismutase and Catalase. J. Exp. Bot. 1981, 32, 93–101. [Google Scholar] [CrossRef]
  41. Murshed, R.; Lopez-Lauri, F.; Sallanon, H. Microplate Quantification of Enzymes of the Plant Ascorbate–Glutathione Cycle. Anal. Biochem. 2008, 383, 320–322. [Google Scholar] [CrossRef]
  42. Smith, I.K.; Vierheller, T.L.; Thorne, C.A. Assay of Glutathione Reductase in Crude Tissue Homogenates Using 5,5′-Dithiobis(2-Nitrobenzoic Acid). Anal. Biochem. 1988, 175, 408–413. [Google Scholar] [CrossRef]
  43. Edelenbos, M.; Christensen, L.P.; Grevsen, K. HPLC Determination of Chlorophyll and Carotenoid Pigments in Processed Green Pea Cultivars (Pisum sativum L.). J. Agric. Food Chem. 2001, 49, 4768–4774. [Google Scholar] [CrossRef] [PubMed]
  44. Liu, W.; Zha, L.; Zhang, Y. Growth and Nutrient Element Content of Hydroponic Lettuce Are Modified by LED Continuous Lighting of Different Intensities and Spectral Qualities. Agronomy 2020, 10, 1678. [Google Scholar] [CrossRef]
  45. Lee, M.; Xu, J.; Wang, W.; Rajashekar, C.B. The Effect of Supplemental Blue, Red and Far-Red Light on the Growth and the Nutritional Quality of Red and Green Leaf Lettuce. Am. J. Plant Sci. 2019, 10, 2219–2235. [Google Scholar] [CrossRef]
  46. Soufi, H.R.; Roosta, H.R.; Fatehi, F.; Ghorbanpour, M. Spectral Composition of LED Light Differentially Affects Biomass, Photosynthesis, Nutrient Profile, and Foliar Nitrate Accumulation of Lettuce Grown under Various Replacement Methods of Nutrient Solution. Food Sci. Nutr. 2023, 11, 8143–8162. [Google Scholar] [CrossRef] [PubMed]
  47. Alrajhi, A.A.; Alsahli, A.S.; Alhelal, I.M.; Rihan, H.Z.; Fuller, M.P.; Alsadon, A.A.; Ibrahim, A.A. The Effect of LED Light Spectra on the Growth, Yield and Nutritional Value of Red and Green Lettuce (Lactuca sativa). Plants 2023, 12, 463. [Google Scholar] [CrossRef]
  48. Zhou, C.; Wang, Q.; Liu, W.; Li, B.; Shao, M.; Zhang, Y. Effects of Red/Blue versus White LED Light of Different Intensities on the Growth and Organic Carbon and Autotoxin Secretion of Hydroponic Lettuce. Hortic. Environ. Biotechnol. 2022, 63, 195–205. [Google Scholar] [CrossRef]
  49. Meng, Q.; Runkle, E.S. Blue Photons from Broad-Spectrum LEDs Control Growth, Morphology, and Coloration of Indoor Hydroponic Red-Leaf Lettuce. Plants 2023, 12, 1127. [Google Scholar] [CrossRef]
  50. Nguyen, T.K.L.; Cho, K.M.; Lee, H.Y.; Cho, D.Y.; Lee, G.O.; Jang, S.N.; Lee, Y.; Kim, D.; Son, K.-H. Effects of White LED Lighting with Specific Shorter Blue and/or Green Wavelength on the Growth and Quality of Two Lettuce Cultivars in a Vertical Farming System. Agronomy 2021, 11, 2111. [Google Scholar] [CrossRef]
  51. Smith, H.L.; McAusland, L.; Murchie, E.H. Don’t Ignore the Green Light: Exploring Diverse Roles in Plant Processes. J. Exp. Bot. 2017, 68, 2099–2110. [Google Scholar] [CrossRef]
  52. Tang, Y.K.; Guo, S.S.; Ai, W.D.; Qin, L.F. Effects of Red and Blue Light Emitting Diodes (LEDs) on the Growth and Development of Lettuce (Var. Youmaicai); SAE International: Warrendale, PA, USA, 2009. [Google Scholar]
  53. Qiao, J.; Hu, W.; Chen, S.; Cui, H.; Qi, J.; Yu, Y.; Liu, S.; Wang, J. Effect of LED Lights on Morphological Construction and Leaf Photosynthesis of Lettuce (Lactuca sativa L.). Horticulturae 2025, 11, 43. [Google Scholar] [CrossRef]
  54. Frutos-Totosa, A.; Hernández-Adasme, C.; Martínez, V.; Mestre, T.; Díaz-Mula, H.M.; Botella, M.A.; Flores, P.; Martínez-Moreno, A. Light Spectrum Effects on Rocket and Lamb’s Lettuce Cultivated in a Vertical Indoor Farming System. Sci. Hortic. 2023, 321, 112221. [Google Scholar] [CrossRef]
  55. Chen, X.; Wang, L.; Li, T.; Yang, Q.; Guo, W. Sugar Accumulation and Growth of Lettuce Exposed to Different Lighting Modes of Red and Blue LED Light. Sci. Rep. 2019, 9, 6926. [Google Scholar] [CrossRef] [PubMed]
  56. Darko, E.; Gondor, K.O.; Kovács, V.; Janda, T. Changes in the Light Environment: Short-Term Responses of Photosynthesis and Metabolism in Spinach. Physiol. Plant. 2023, 175, e13996. [Google Scholar] [CrossRef] [PubMed]
  57. Li, Y.; Wu, L.; Jiang, H.; He, R.; Song, S.; Su, W.; Liu, H. Supplementary Far-Red and Blue Lights Influence the Biomass and Phytochemical Profiles of Two Lettuce Cultivars in Plant Factory. Molecules 2021, 26, 7405. [Google Scholar] [CrossRef]
  58. Li, Y.; Hu, Z.; Chen, X.; Zhu, B.; Liu, T.; Yang, J. Nutritional Composition and Antioxidant Activity of Gonostegia Hirta: An Underexploited, Potentially Edible, Wild Plant. Plants 2023, 12, 875. [Google Scholar] [CrossRef]
  59. Ciriello, M.; Formisano, L.; Kyriacou, M.; Soteriou, G.A.; Graziani, G.; De Pascale, S.; Rouphael, Y. Zinc Biofortification of Hydroponically Grown Basil: Stress Physiological Responses and Impact on Antioxidant Secondary Metabolites of Genotypic Variants. Front. Plant Sci. 2022, 13, 1049004. [Google Scholar] [CrossRef]
Figure 1. The effect of light (3000 K, 3500 K, 4000 K) and Zn doses (1 ppm, 5 ppm) in a hydroponic solution on the total lettuce leaf area and the dry (a) and fresh (b) weight ratio. The values are means ± SE (standard error). According to Tukey’s test, different letters in columns indicate significant differences at 5%.
Horticulturae 11 00284 g001
Figure 2. The effect of light (3000 K, 3500 K, 4000 K) and Zn doses (1 ppm, 5 ppm) in hydroponic solution on Zn content in lettuce leaves. The values are means ± SE (standard error). According to Tukey’s test, different letters in columns indicate significant differences at 5%.
Horticulturae 11 00284 g002
Figure 3. The effect of light (3000 K, 3500 K, 4000 K) and Zn doses (1 ppm, 5 ppm) in hydroponic solution on sugars ((a)—fructose, (b)—glucose, (c)—sucrose, (d)—maltose, (e)—raffinose) content in lettuce leaves. According to Tukey’s test, the values are means ± SE (standard error), and different letters indicate significant differences in each sugar content at 5%.
Horticulturae 11 00284 g003
Figure 4. The effect of light (3000 K, 3500 K, 4000 K) and Zn doses (1 ppm, 5 ppm) in a hydroponic solution on antioxidant activity ((a)—DPPH, (b)—ABTS, (c)—FRAP) and total phenol content ((d)—TPC) in lettuce leaves. The values are means ± SE (standard error). According to Tukey’s test, different letters in columns indicate significant differences at 5%.
Horticulturae 11 00284 g004
Figure 5. The effect of light (3000 K, 3500 K, 4000 K) and Zn doses (1 ppm, 5 ppm) in a hydroponic solution on soluble protein content of (a) antioxidant enzymes activities ((b) Glutathione reductase (GR), (c) Ascorbate peroxidase (APX), (d) Superoxide dismutase (SOD)) in lettuce leaves. The values are means ± SE (standard error). According to Tukey’s test, different letters in the columns indicate significant differences at 5%.
Horticulturae 11 00284 g005
Figure 6. The effect of light (3000 K, 3500 K, 4000 K) and Zn doses (1 ppm, 5 ppm) in a hydroponic solution on Violaxanthin (a), Neoxanthin (b), Lutein + zeaxanthin (c), Carotenes (d), Chlorophyll a (e), Chlorophyll b (f) content in lettuce leaves. The values are means ± SE (standard error), and different letters in the columns indicate significant differences. The data were processed using analysis of variance (ANOVA), the Tukey (HSD) test at the confidence level p = 0.05.
Horticulturae 11 00284 g006
Figure 7. Principal component analysis (PCA) of the combined effect of the light and the Zn concentration in a hydroponic solution on lettuce nutritional quality.
Horticulturae 11 00284 g007
Table 1. Scheme of the experiment.
FactorTreatments
Zinc concentration in
hydroponic solution
1 ppm5 ppm1 ppm5 ppm1 ppm5 ppm
Spectrum3000 K3500 K4000 K
Table 2. Analysis of variance: light and Zn doses in hydroponic solution on total lettuce leaf area and dry and fresh weight ratio.
Total Leaf AreaDry and Fresh Weight
Factor A (Light)**
Factor B (Zn dose)**
Interaction A × B**
* shows significant differences.
Table 3. Analysis of variance of light and Zn doses in a hydroponic solution on the Zn content in lettuce leaves.
Zinc Content in Leaves
Factor A (Light)*
Factor B (Zn dose)*
Interaction A × B*
* shows significant differences.
Table 4. Analysis of variance of light and Zn doses in hydroponic solution on sugars (fructose, glucose, sucrose, maltose, raffinose) content in lettuce leaves.
FructoseGlucoseSucroseMaltoseRaffinose
Factor A (Light)***ns*
Factor B (Zn dose)****ns
Interaction A × B*****
* shows significant differences, ns—no significant differences.
Table 5. The impact and interaction of factors; the light and Zn doses in hydroponic solution on antioxidant activity (according to DPPH, ABTS, and FRAP) and total phenol content (TPC) in lettuce leaves.
DPPHABTSFRAPTPC
Factor A (Light)***ns
Factor B (Zn dose)****
Interaction A × B****
* shows significant differences, ns—no significant differences.
Table 6. The impact and interaction of the factors of light and Zn doses in the hydroponic solution on antioxidant enzymes activities such as glutathione reductase, ascorbate peroxidase, superoxide dismutase, and soluble protein content in lettuce leaves.
Soluble Protein ContentGlutathione ReductaseAscorbate PeroxidaseSuperoxide Dismutase
Factor A (Light)****
Factor B (Zn dose)****
Interaction A × B****
* shows significant differences.
Table 7. The impact and interaction of factors of light and the Zn doses in a hydroponic solution on Violaxanthin (a), Neoxanthin (b), Lutein + zeaxanthin (c), Carotenes (d), Chlorophyll a (e), Chlorophyll b (f) content in lettuce leaves.
ViolaksantinNeoxanthinLiutein + ZeaksantinCarotenesChlorophyll aChlorophyll
b
Factor A (Light)ns*****
Factor B (Zn dose)ns*****
Interaction A × Bns*****
* shows significant differences, ns—no significant differences.
Disclaimer/Publisher’s Note: The statements, opinions and data contained in all publications are solely those of the individual author(s) and contributor(s) and not of MDPI and/or the editor(s). MDPI and/or the editor(s) disclaim responsibility for any injury to people or property resulting from any ideas, methods, instructions or products referred to in the content.

