Article

Spatial Distribution Characteristics and Relationships of Salt-Based Ions and Nutrients in Old Protected Vegetable Fields

1
National Engineering Research Center for Efficient Utilization of Soil and Fertilizer Resources, College of Resources and Environment, Shandong Agricultural University, Tai’an 271018, China
2
College of Agriculture, Shandong Agricultural University, Tai’an 271018, China
*
Author to whom correspondence should be addressed.
Horticulturae 2025, 11(2), 126; https://doi.org/10.3390/horticulturae11020126
Submission received: 9 December 2024 / Revised: 11 January 2025 / Accepted: 23 January 2025 / Published: 24 January 2025
(This article belongs to the Section Plant Nutrition)

Abstract

:
To achieve a scientific and objective evaluation of soil acidification, secondary salinization, and nutrient imbalance in old protected vegetable fields (OPVs) with over 30 years of cultivation history, a soil surface breeding vigorous moss was investigated. Here, quantitative laboratory analysis and mathematical statistics were employed to explore the spatial distribution of soil salinity and nutrients, as well as their relationships. The results revealed that OPVs exhibited slightly acidified values. The measured anions and cations in the soil salt composition constituted approximately 77% of the total ions. Among which, Ca2+ was the dominant cation, while SO42− and NO3 were predominant anions. The total water-soluble salt (TDS) content of the surface soil reached 4.52 g kg−1, exceeding the Chinese Saline Soils standard (1.0 g kg−1) by 350%. In the OPVs, nitrate nitrogen was significantly higher than ammonium nitrogen, and available phosphorus and available potassium were generally abundant. Despite exhibited various soil health concerns, a field visit survey presented consistently high and stable yields in OPVs. We hypothesize that this seemingly contradictory finding may be attributable to several factors, including the abundance of divalent cations (Ca2+ and Mg2+), the soil fertility and water retention capacity of unsaturated salt-based suitable soil, as well as good soil aggregate structure. These factors had the potential to reduce the stresses on the soil. This study provided a foundational understanding of the nutrient and salinity status of soils in OPVs, offering valuable data and theoretical groundwork for future research endeavors.

1. Introduction

Protected agriculture is an agricultural production method that utilizes modern agricultural technology to manipulate water, fertilizer, gas, heat, light, and other environmental factors inside facilities. This approach mitigates limitations imposed by unfavorable environments, with the goal of achieving optimal plant growth conditions and enabling continuous production [1]. Protected agriculture facilities primarily encompass greenhouses and other simple horticultural engineering structures that function similarly to greenhouses, even those employing only plastic film for protection. Statistics indicated that China’s protected agriculture for vegetables covers an area of 2.567 million hectares, yielding an annual output of 260 million tons of vegetables, which represents 1/3 of the total national vegetable production [2]. Facility types predominantly include winter-warm heliogreenhouses (WHGs), plastic tunnels (PTs), and small tunnels, with WHGs and PTs constituting over 80% of similar structures worldwide [3]. In some old vegetable cultivation regions, WHGs have become the primary mode for overwintering production due to their lower costs and superior insulation properties. PTs, characterized by a relatively simple structure and lower input costs compared to WHGs, offer a less effective heat preservation capability. However, PTs’ cultivation enables multi-vegetable rotation, and remains cost-effective, making it the preferred method for early-spring and late-autumn leafy vegetable production [1].
Compared to open-field conditions, long-term cultivation inside a confined or semi-confined environment, due to the absence of natural rainfall leaching and significantly higher fertilizer application frequencies, resulted in variously complicated soil problems like soil acidification, secondary salinization, and soil-borne disease prevalence [4,5,6]. Soil acidification is a naturally occurring phenomenon, while anthropogenic factors like fertilizer application and irrigation might accelerate this process. This is particularly evident in OPVs characterized by high water and fertilizer inputs and intensive cultivation practices [7]. A single study reported a decline in soil pH of 0.52 units following a decade of planting in OPVs [8]. This observation is consistent with findings of a progressive soil pH decrease within OPVs over extended cultivation periods. The rate of acidification in OPVs surpasses that typically observed in natural soils [9]. Secondary salinization is defined as soil salinization resulting from human activities. Statistical data from Shandong Province, a major producer of protected vegetables in China, indicated that approximately 39.7% of OPVs exhibit varying degrees of secondary salinization [10]. Excessive fertilizer application was identified as a primary contributing factor to this observed increase in soil salinity [10]. The excessive nutrient accumulation in the soil of OPVs stems from the indiscriminate overuse of chemical fertilizers and the lack of natural rainwater leaching [11]. Nutrients and salinity tend to concentrate above the tillage layer, with the most severe accumulation occurring at the surface [5]. This, coupled with the poor ventilation, plant shading, and insufficient light penetration within the facility environment, creates conditions highly conducive to moss growth on the surface soil. Moss, mainly of Pottiaceae [12], a typical indicator of secondary salinization, not only competes with shallow vegetable roots for nutrients but also contributes to soil compaction and the deterioration of soil physical and chemical properties.
Fangcun and Liangzhuang are two towns famous for vegetable production. Fangcun, known as the “Tomato Town”, primarily employs a tomato–kidney bean rotation system cultivated in WHGs. Liangzhuang, conversely, is the “Leafy-vegetable Town”, featuring a diverse crop rotation of spinach, celery, lettuce, and other leafy vegetables in PTs. Notably, over 80% of the vegetables in the two towns have a production history exceeding 25 years. While the planting system exhibited relative homogeneity, and the surface soil was overgrown with moss, most WHGs and PTs maintained remarkably higher yields and stable production. This study endeavors to elucidate the relationship between soil acidification, secondary salinization, and nutrient imbalance in OPVs. Additionally, the potential mechanisms maintaining high-salt tolerance and stable production in OPVs will be explored, aiming to provide a theoretical foundation for soil remediation strategies and the sustainable development of OPVs.

2. Materials and Methods

2.1. Study Area

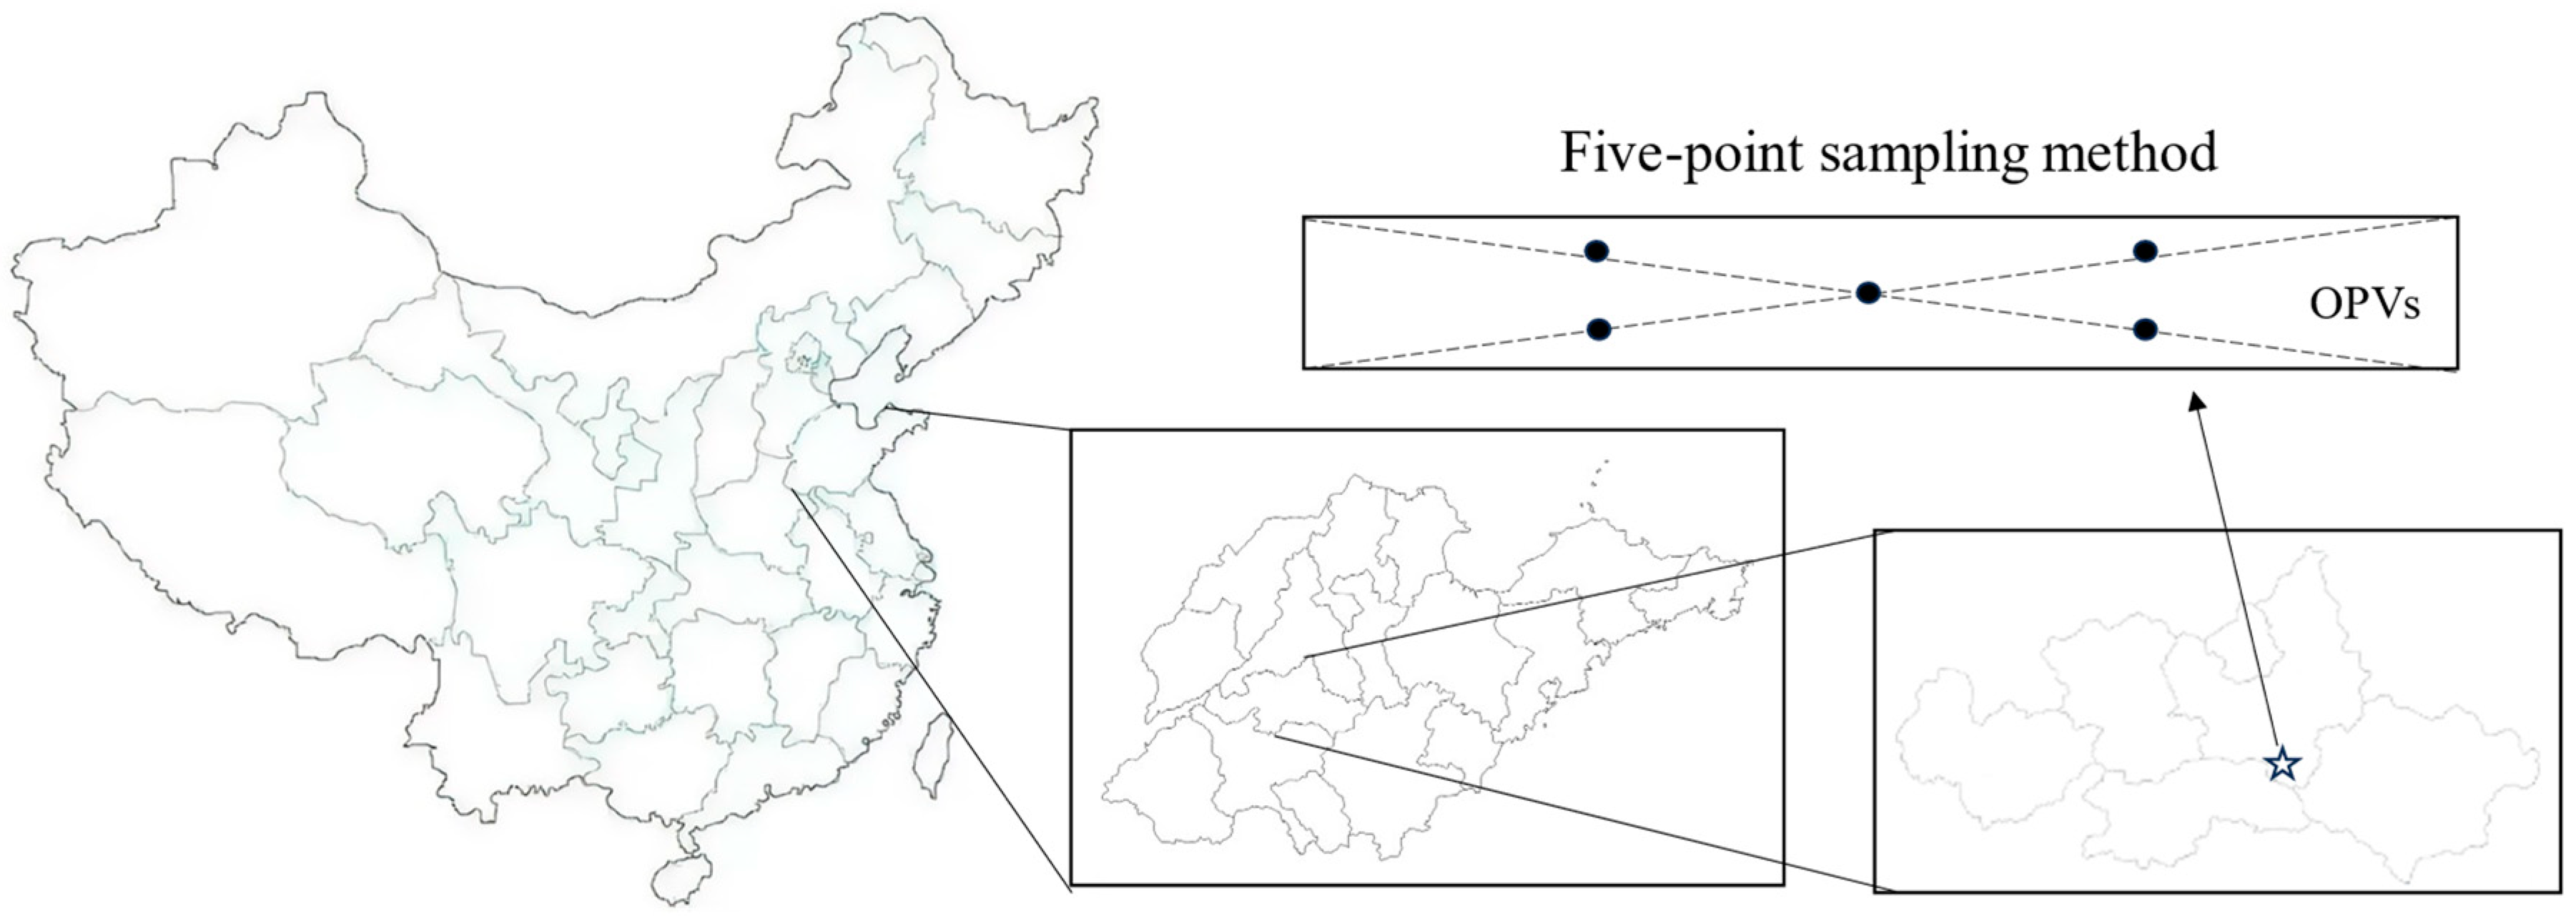
The study area, shown in Figure 1, was located in the Fangcun and Liangzhuang Townships, suburban districts of Tai’an City, Shandong Province, China (117°11′ E, 35°54′ N). The tested terrain is characterized as an alluvial plain situated in front of mountains. The region experiences a warm temperate monsoon climate with an average annual temperature of 15.0 °C, an average annual precipitation of 680 mm, and an average annual sunshine time of 2759 h. The soil type is Aquic Brown Earths, systematic classification name “Mottlic Hapli-Udic Argosols”. Soil background values are shown in Table 1, sourced from Soils in China (2nd Edition) [13], page 79.

2.2. Design of the Experiment

Soil samples were collected in November–December 2022, following the harvest of fruits and vegetables and prior to sowing the next crop. A total of 107 OPVs were included in this research, encompassing 81 WGHs and 26 PTs. All OPVs exhibited visible moss on the soil surface and a cultivation history exceeding 25 years. Followed the five-point sampling method (Figure 1), which involves designating the midpoint of a diagonal line as the central sampling point and selecting four equidistant points along the diagonal from the central point, soil samples were collected from the surface (defined as the upper 0.5 cm of soil including adhering moss), as well as at depths of 0–20 cm and 20–40 cm among the small inter-row spaces. Then, samples were stratified, thoroughly mixed, and transferred to clean plastic bags. Collected soil samples were cleaned, inactivated as quickly as possible, then dried, smashed, sieved, and finally placed in a valve bag and kept in a dry place. Subsequently, the sieved samples (16 mesh) were used to determine pH, electrical conductivity (EC), total water-soluble salt (TDS), water-soluble anions and cations (CO32−, HCO3, Cl, SO42−, Ca2+, Mg2+, K+ and Na+), cation exchange capacity (CEC), soil salt base saturation (BS), and available nutrients. A separate 100-mesh sieve fraction was employed for the analysis of total nitrogen (TN) and total phosphorus (TP).
Figure 1. The location of the study area and sampling methods.
Horticulturae 11 00126 g001

2.3. Measurement Indicators

Soil pH was determined using a PHS-3E model instrument (Shanghai INASE Scientific Instruments Corporation, Shanghai, China) with a 1:1 soil-to-water ratio. EC was measured using an AR8011 instrument (Wan Chuang Electronics MFG. Co., Ltd., Dongguan, China) with a 5:1 soil-to-water ratio. TDS was determined gravimetrically by the drying residue weight method. A total of 100 mL of deionized water was added to 20 g of air-dried soil samples. After shaking for 3 min, the mixture was filtered. Subsequently, 50 mL of the filtrate was transferred to an evaporating dish within a water bath. H2O2 was then added to remove organic matter. The solution was then oven-dried to constant weight, and TDS was determined by the difference in weight before and after evaporation. Water-soluble CO32−, HCO3, Cl, SO42−, Ca2+, and Mg2+ were determined titrimetrically [14], while water-soluble K+ and Na+ were analyzed using a flame photometer (Spectrophotometer 6400A, Cany Precision instruments Co., Ltd., Shanghai, China). Three replications were made for each soil sample within each of the above indicators.
CEC was determined using the BaCl2-MgSO4 forced exchange method with three replicates for each soil sample [14]. Briefly, 2 g of air-dried soil was weighed and extracted with 20 mL of 0.1 M BaCl2 solution for 2 h with shaking. The suspension was then centrifuged, and the supernatant was discarded. The residue was washed three times with 20 mL aliquots of 0.002 M BaCl2 equilibrium solution using the same centrifugation and supernatant discard procedure. Subsequently, 10 mL of 0.005 M MgSO4 solution was added to the residue for forced exchange. The mixture was stirred for 1 h and the electrical conductivity of the supernatant (ECsusp) was measured. The solution was then titrated with 0.005 M MgSO4 solution until the ECsusp matched the electrical conductivity of the reference solution (ECref) containing 0.0015 M MgSO4 solution. The volume of the titrant used was recorded.
The soil exchangeable salts base (SEB) was determined using the NH4OAc exchange neutralization titration method with three replicates for each soil sample. Subsequently, the BS was calculated. Briefly, 50 mL of 1.0 M NH4OAc-extracted soil leachate was transferred to an evaporating dish and evaporated to dryness in a water bath. The residue was then ashed in an induction furnace at 500 °C for 15 min. After cooling, the residue was re-dissolved in 10 mL of 0.1 M HCl standard solution, followed by the addition of methyl red indicator (1 drop). The solution was then titrated with 0.05 M NaOH solution until the endpoint (color change) was reached. Other basic nutrient indexes were determined as described in Table 2 [14].

2.4. Studies Analysis

Soil salt base saturation B S , % = Cation exchange capacity C E C Soil exchangeable salts base S E B × 100
Comprehensive nutrient evaluation score Y = W 1 × Y 1 + W 2 × Y 2 + W 3 × Y 3
Y i = U i 1 × Z T N + U i 2 × Z H N + U i 3 × Z N O 3 N + U i 4 × Z N H 4 + N + U i 5 × Z T P + U i 6 × Z A P + U i 7 × Z A K , i = 1,2 , 3
U i j   = A i j λ i i = 1,2 , 3 .   j = 1,2 , 3,4 , 5,6 , 7
where λi is “Total” (eigenvalue of the matrix), Aij is the component matrix output by IBM SPSS Statistics 26 (26.0.0.0.0), Uij is the principal component loading matrix, the symbol Z denotes the value after standardization of an indicator, and W1, W2, and W3 are the “Percentage of variance”.
Data were statistically analyzed using Microsoft Excel 2013. Duncan’s multiple comparison method on SPSS for significance using at a level of significance of 0.05. Pearson’s correlation coefficient calculations were conducted on SPSS and Pearson’s correlation heatmaps were made on Origin 2024b (10.1). On SPSS, principal component analysis was calculated the scores of nutrient composite evaluation [15], and fitted graphs were made on Origin 2024b. The soil nutrient grading evaluation referred to the second soil census of China and related standards [13].

3. Results

3.1. Soil pH at Different Depths in OPVs

As shown in Table 3, soil pH in OPVs exhibited an acidic tendency, with some sampling points exceeding recommended levels. The percentage of soil samples with pH below 5.5 were 11.1% and 21.8% in WHG and PT, respectively, indicating a more severe acidification problem in PTs. The average soil pH of WHGs in the surface, 0–20 cm, and 20–40 cm layers were 6.13, 6.24, and 6.29, respectively, and there was no significant difference between different layers in vertical direction. The average soil pH of PTs in the surface, 0–20 cm, and 20–40 cm layers were 6.35, 6.08, and 5.78, respectively, a gradual decreasing trend with increasing depth. Among the sample points of investigated OPVs, those with pH < 5.5 in the surface, 0–20 cm, and 20–40 cm soil layers accounted for 13.1%, 9.34%, and 18.7%, respectively.

3.2. Soil Salinity Conditions at Different Depths in OPVs

As shown in Figure 2, OPVs exhibited generally high total water-soluble salt (TDS) concentrations, with surface soil reaching values as high as 5.0 g kg−1. Both the soil electrical conductivity (EC) and TDS of WHGs were significantly higher than PTs (p < 0.05). The average soil TDS of WHGs exceeded 1.0 g kg−1 at all sample points in the investigated OVFs, while 50% of PTs exceeded the standard (Table 4). Both soil EC and TDS exhibited a significant (p < 0.05) fall with increasing depth, highlighting a characteristic pattern of surface accumulation.
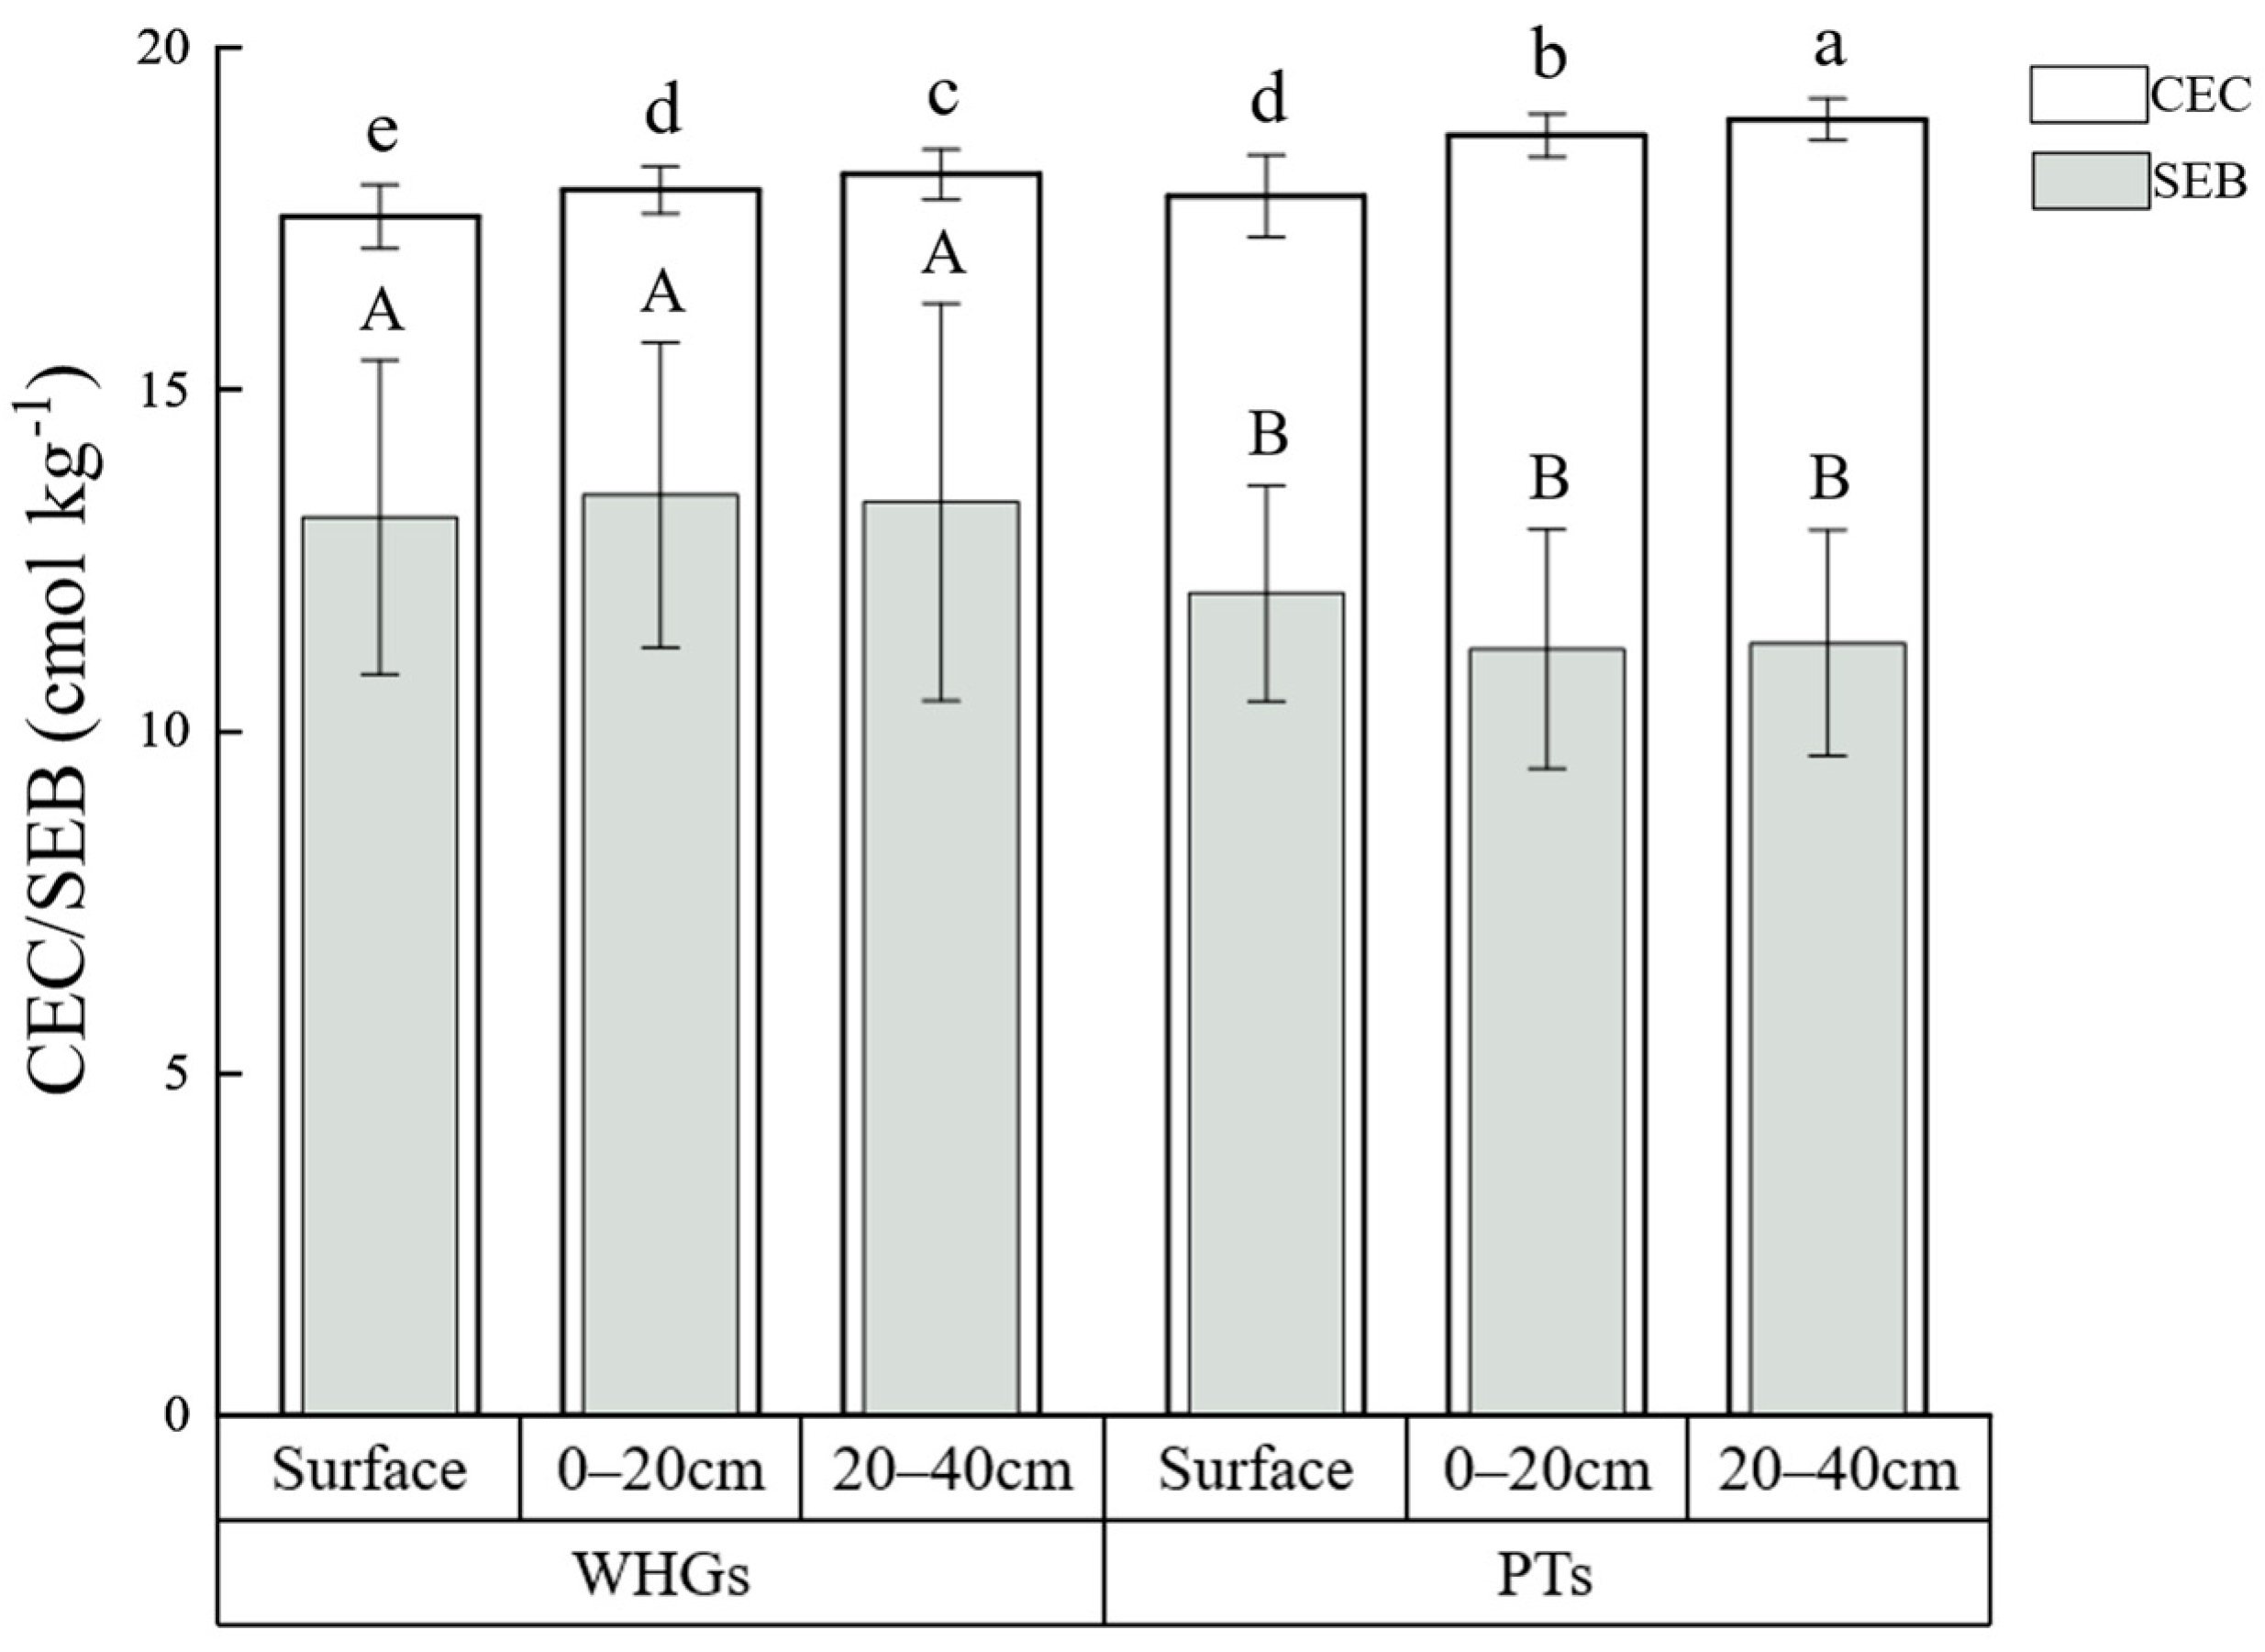
As illustrated in Figure 3, the soil cation exchange capacity (CEC) in OPVs ranged from 17.0 to 19.0 cmol kg−1, indicating a moderately high capacity for fertilizer retention. Notably, the CEC of PTs was significantly higher than WHGs. Vertically, CEC exhibited a significant increase with increasing soil depth in both WHGs and PTs. Soil exchangeable salts base (SEB) levels ranged from 10.0 to 15.0 cmol kg−1, reflecting moderate levels. While WHGs exhibited significantly higher SEB compared to PTs, the SEB difference between these facilities was not statistically significant among each vertical layer. The average soil salt base saturation (BS) in the surface, 0–20 cm, and 20–40 cm layers of WHGs (75.2%, 75.3%, and 73.6%, respectively) was generally higher than PTs (67.5%, 59.9%, and 59.6%, respectively) in the investigated OPVs, and all of them were at the unsaturated level.
As shown in Figure 4, the combined proportion of anions and cations in OPVs constituted approximately 77% of total water-soluble ions across all investigated layers, suggesting a significant presence of other ion species. Sulfate (SO42−) and nitrate (NO3) were the dominant anions, while Ca2+ was the primary cation, and CO32− was not detected. In the soil surface, 0–20 cm, and 20–40 cm layers, SO42− accounted for 23.4%, 21.3%, 19.8%, NO3 accounted for 19.2%, 17.3%, 16.3%, and Ca2+ accounted for 15.7%, 13.8%, 13.7% of total ions, respectively. The percentage of SO42−, NO3, and Ca2+ on the surface was higher than in deeper soil, showing a decreasing trend from top to bottom. There was a typical characteristic of upward movement with water and accumulation on the surface. Conversely, Na+ and Cl exhibited an opposite distributional tendency, with a rising trend from top to bottom, showing a distinct leaching process. The higher proportion of NO3 coincided with the elevated nitrate-nitrogen content of OPVs depicted in Figure 5. In addition, the sum of anions was about 50%, while the sum of cations was only about 27%, implying the potential presence of unmeasured water-soluble cations in OPV soil.

3.3. Soils Base Nutrient Conditions at Different Depths in OPVs

Soil total nitrogen (TN) content in WHGs ranged from 0.50 to 3.0 g kg−1, whereas PTs exhibited content from 0.25 to 1.25 g kg−1. The soil alkaline hydrolyzable nitrogen (HN) in WHGs (average 270 mg kg−1) was classified as abundant, while PTs displayed a moderately abundant level (142 mg kg−1). TN, HN, and nitrate nitrogen (NO3-N) of WHGs were significantly (p < 0.05) higher than PTs (Figure 5A,B,D), while the ammonium nitrogen (NH4+-N) of soil indicated no significant difference between the two facilities (Figure 5C).
Vertically, both WHGs and PTs displayed significant (p < 0.05) decreases in soil TN, HN, and NO3-N with increasing depth. Soil NH4+-N in WHGs exhibited a significant (p < 0.05) decrease with increasing depth. In PTs, surface soil NH4+-N was significantly higher (p < 0.05) compared to the deeper layer, while no significant difference was observed between the 0–20 cm and 20–40 cm depths. Importantly, soil NO3-N in OPVs was significantly higher than NH4+-N at all layers.
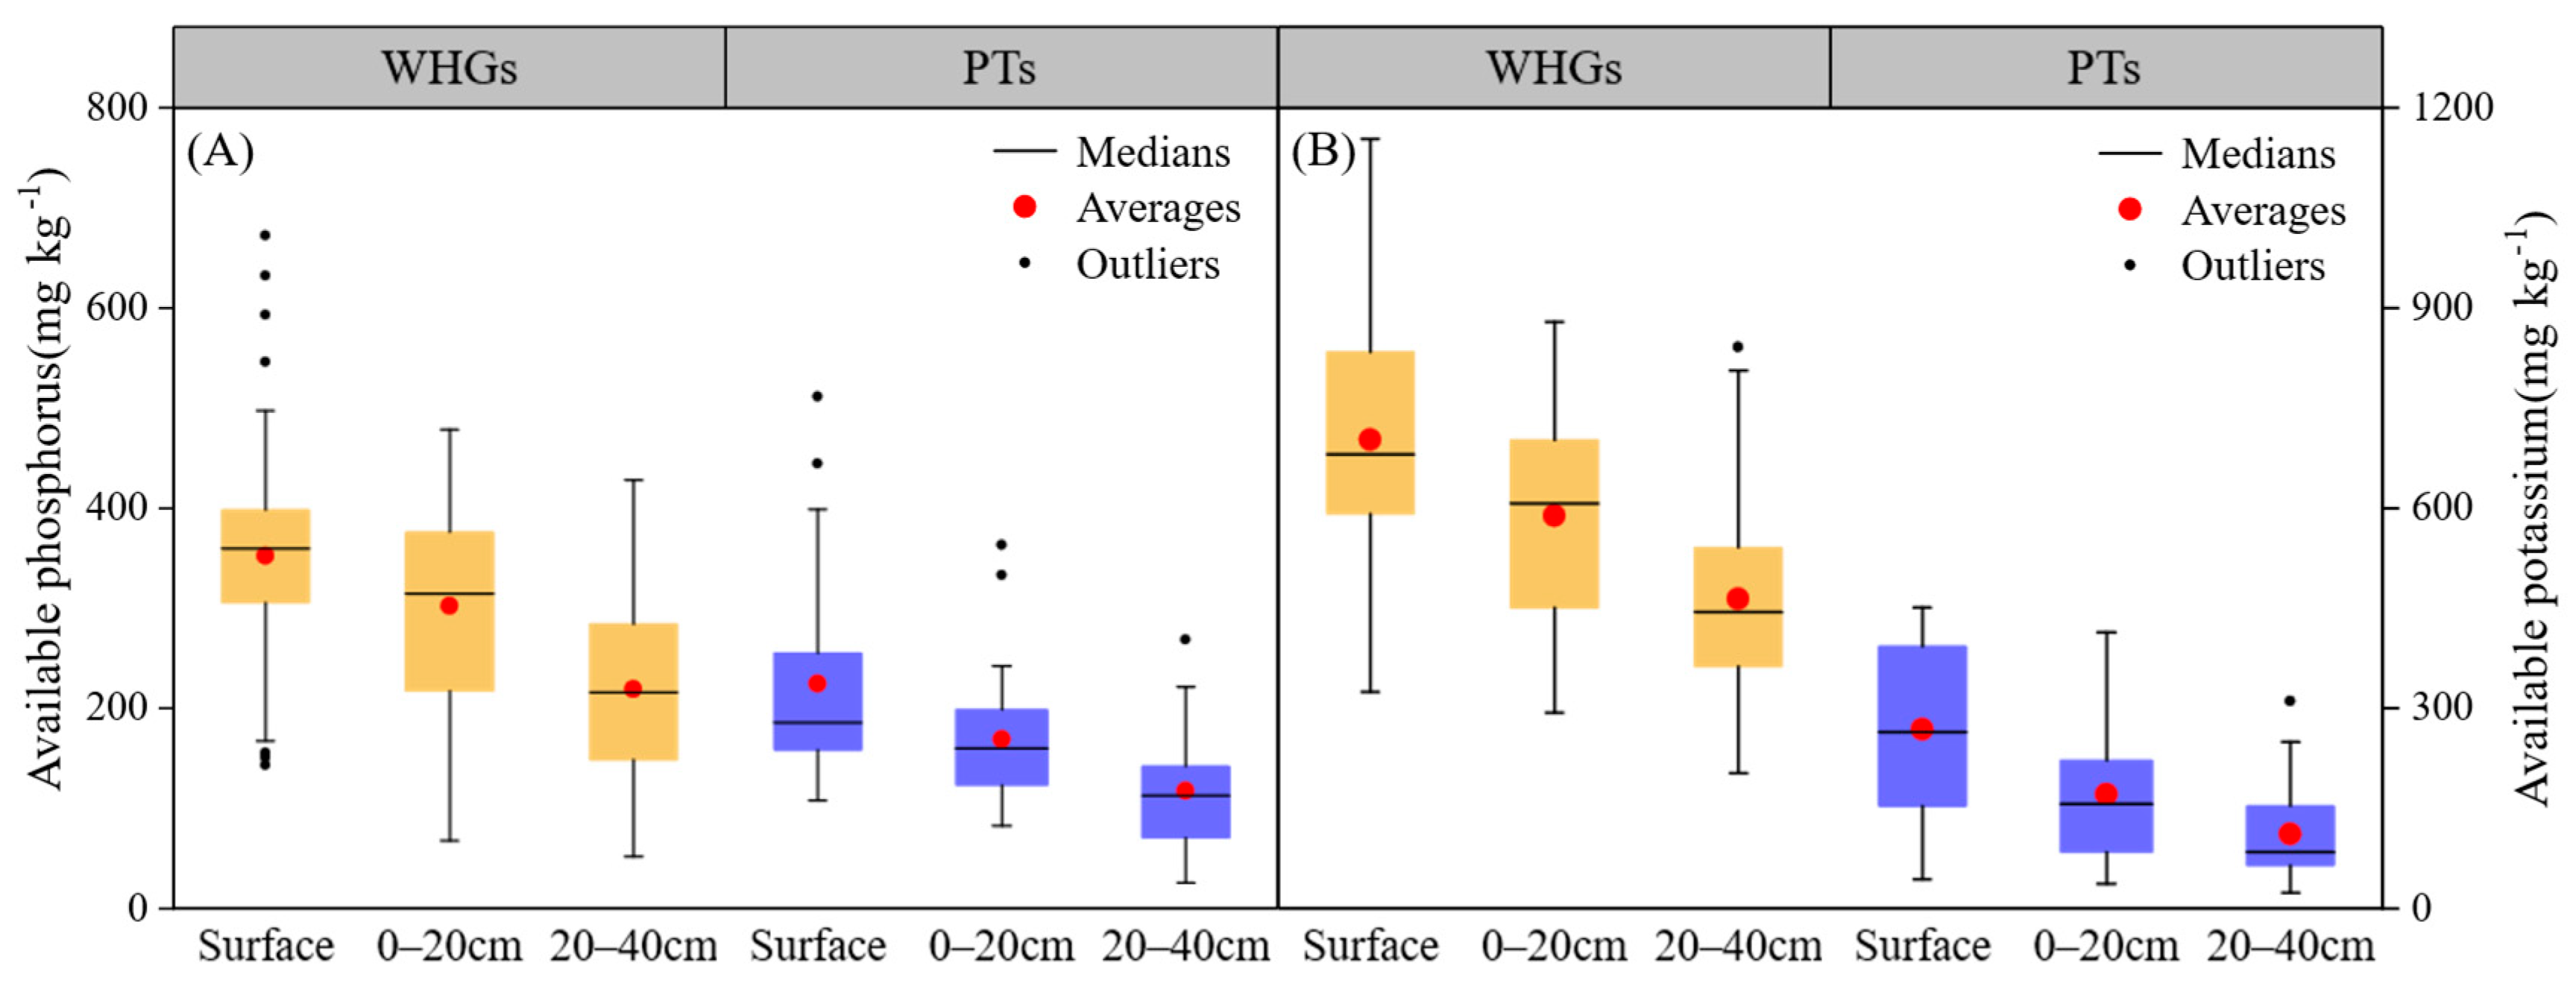
In contrast to nitrogen availability, soil phosphorus and potassium nutrients in OPVs were highly abundant, with some sites exhibiting exceptionally high levels (Figure 6). Soil available phosphorus (AP) and available potassium (AK) displayed average concentrations of 263 mg kg−1 and 487 mg kg−1, respectively, exceeding the highest nutrient levels by 558% and 144%, respectively. Notably, soil AP and AK in WHGs were significantly higher than in PTs (p < 0.05). Vertically, both soil AP and AK in WHGs and PTs decreased significantly (p < 0.05) with increasing depth.

3.4. Correlation Analysis of Soil pH, Nutrients, and Salinity in OPVs

As shown in Figure 7, among salinity indicators, soil water-soluble HCO3 was significantly positively correlated with other salinity and nutrient indicators, but the correlation degree was the lowest, followed by Na+. Among nutrient indicators, soil TP was significantly positively correlated with other salinity and nutrient indicators (except Na+), but the correlation degree was the lowest, followed by soil AP. Conversely, salinity indicators like soil EC, TDS, and water-soluble salt-base ions were significantly positively correlated with HN, TN, NO3-N, NH4+-N, and AK, and the correlation degree was higher. They were also significantly positively correlated with TP and AP, but the correlation coefficient was lower. In addition, soil pH was significantly negatively correlated with salinity and nutrient indicators (except HCO3, Na+, and TP), but the degrees of correlation were all low. Collectively, these findings suggest a positive correlation between nutrients and salinity within the soil of OPVs. Rising nutrient levels coincided with an increase in salinity. The negative correlation between soil pH and most salinity and nutrient indicators implies that, within a specific pH range, increasing acidity might be accompanied by higher nutrient levels. This observation aligns with the co-occurrence of mild soil acidification and high fertility observed in OPVs.

3.5. Principal Component Analysis of Soil Nutrients in OPVs

In principal component analysis (PCA), the selection of principal components typically relies on an eigenvalue (λ) greater than 1.0 or a high cumulative contribution rate of variance (often the cumulative exceeding 85%). While the eigenvalue of the third component in Table 5 is 0.916, and the cumulative of the first three components reaches 84.2%, it falls short of the conventional thresholds. However, given its close proximity to the standard criteria, three principal components were retained for further analysis.
A scatter plot was generated to visualize the relationship between the nutrient comprehensive evaluation score (horizontal axis) and total water-soluble salt (vertical axis). The data for the three soil depths (surface, 0–20 cm, and 20–40 cm) were clearly distinguished. As shown in Figure 8, nutrient scores exhibited a gradual increase from deeper to surface layers, mirroring a similar trend for salinity. This observation further reinforces the positive correlation between soil salinity and nutrients within OPVs. The fitted regression line yielded a determination coefficient (R2) of 0.412. Notably, 95% of sample points fell inside the confidence ellipse, and those that fell outside the ellipse mostly were surface samples, which showed that there was a certain degree of specificity in surface soil. Both nutrient and salinity in surface soil were higher, the data points were the most dispersive, and the data fluctuated most.

4. Discussion

4.1. Soil Acidification in OPVs

The analysis of soil samples revealed significant disparities in NH4+ and NO3-N concentrations, suggesting an elevated rate of nitrification within soil of OPVs. Nitrification, however, generates H+ as a byproduct, contributing to soil acidification [16]. Moreover, most crop species exhibit a preferential uptake of ammonium (NH4+) and potassium (K+) over anions. To maintain charge balance within plant tissues, H+ are subsequently released, further exacerbating soil acidification [17]. The higher prevalence of acidic conditions in deeper soil layers of OPVs might be attributed to the higher salinity at the surface, which potentially limits the rate of acidification in upper layers [8]. Unlike natural saline soils, the soil of OPVs did not take on a high percentage of salinogenic ions, and the eight ions only accounted for about 60%. Consequently, these soils exhibit high salinity but acidity, as evidenced by the negative correlation observed between pH and salinity. Previous studies have reported that soil colloids in soils with high BS tend to preferentially adsorb H+ (active acid), converting them into potential acids [18]. In this present study, the BS ranged from 60% to 75%, indicating an unsaturated state. This unsaturated condition allows for more reactive H+, contributing to the observed soil acidity.
Soil acidification was not defined an exact threshold value. It was a process, namely a decrease in pH relative to the original level. Most acidified soil had a pH below 5.5, and severely acidified soil fell to 4.5. It is generally assumed that when soil pH is less than 5.5, it will constrain the productivity of agroecosystems [19]. In this study, aquic brown earths exhibited a slightly acidic response [13]. The combined results indicated that a portion of the soil in OPVs exit potential acidification, with 13.7% and 2.80% of sampling sites displaying pH ≤ 5.5 and pH ≤ 5.0, respectively. These results suggest that as long as soil acidity fluctuation remains within a moderate range, there may not be a substantial impact on plant growth. This phenomenon could be a key factor underlying the absence of significant yield reductions observed in acidified soil of OPVs.

4.2. Secondary Soil Salinization in OPVs

The study revealed a high prevalence of secondary salinization within the investigated OPVs. Notably, WHGs exhibited significantly higher levels of secondary salinization compared to PTs, a pattern observed across all soil layers. This phenomenon can be attributed to the study area’s location within the Huanghuaihai Plain, characterized by heavy reliance on irrigation, with approximately 40% of water resources sourced from groundwater [20]. In this study area, the groundwater reveals a mineralization level of about 2.0 g L−1, dominated by Ca2+ cations, and HCO3 and SO42− anions [21]. Decades of continuous irrigation have inevitably led to the accumulation of corresponding salt ions in soil. However, the acidic soil promotes the conversion of HCO3 to CO2, resulting in a lower HCO3 content compared to natural saline soils, which typically exhibit a synchronous high in HCO3 and pH [18]. Beyond the influx of salt ions via irrigation, the extensive use of compound fertilizers containing calcium superphosphate and ammonium sulfate also contributes to soil salinization. Furthermore, the relative abundance of divalent cations (Ca2+ and Mg2+) over monovalent cations (Na+ and K+) promotes soil coagulation, leading to increased soil viscosity and reduced particle dispersion [22]. A portion of soil Ca2+ was adsorbed by soil colloids, with the remaining fraction existed in the soil solution [23]. This soluble Ca2+ played a critical role in the formation and maintenance of soil aggregate structure, as well as the structural integrity of root cells.

4.3. Nutrient Imbalance in OPVs

The results of the study revealed that soil nitrogen levels were moderate, which contradicts with the typical nitrogen accumulation data observed in vegetable field soils reported in previous studies [24]. Two potential explanations for this phenomenon are considered: firstly, the sampling coincided with the late harvest period for vegetables. During this stage, most of the soil nitrogen has been absorbed by the plants to support yield formation, resulting in a depletion of residual soil nitrogen. Secondly, soil available nitrogen actives chemically. The ammonium (NH4+-N) forms readily volatilize, while the nitrate (NO3-N) form is prone to leaching. These properties make it challenging to retain sufficient bioavailable nitrogen around the root zone [25].
The available phosphorus (AP) content within the soil of OPVs was found to be high, constituting 9.42% of the total phosphorus pool. This elevated AP poses a significant risk of water pollution. Furthermore, excessive phosphorus availability can antagonize the uptake of other essential micronutrients, such as Zn and Ca, potentially leading to physiological disorders in plants [26]. Notably, all sampling sites in the surface and 0–20 cm soil layers, and 93.4% of the sampling sites in the 20–40 cm soil layer, exceeded the established available phosphorus of the fluvo-aquic soil threshold (58.4 mg kg−1) for OPVs [27], indicating a serious phosphorus accumulation within OPVs. This elevated AP can primarily be attributed to the frequent application of phosphorus fertilizers coupled with the low mobility and subsequent chemical fixation of phosphorus within the soil environment [28].
In this study, the dominant crops cultivated within WHGs were tomato and kidney beans, while PTs primarily consisted of spinach, celery, lettuce, and leek. These crops all have high potassium requirements [29]. Consequently, due to the high level of concern regarding potash fertilizer application, coupled with the inherently low mobility of potassium in soil, available potassium exhibits high level accumulation in OPVs.
This study revealed significant differences in soil fertility between WHGs and PTs. WHGs generally exhibited higher fertility levels compared to PTs, and a similar trend was observed for salinity. Two potential explanations are proposed: firstly, WHGs are predominantly cultivated with fruits or vegetables like tomato or cucumber, and plants need more fertilizer supply compared to those typically grown in PTs. Secondly, PTs often employ a high frequency of rotational intercropping, planting 3–4 types of leaf vegetables per year. The cultivation of diverse plant species promotes a more complete and balanced utilization of inherent soil nutrients [29].

4.4. Soil Multi-Factor Barrier and Outlook for OPVs

Unlike natural saline soils, secondary salinization in OPVs exhibited acidic pH values, some even reaching a strong degree of acidity (pH ≤ 4.5). This finding suggests that maintaining a relative balance in soil salinity may play a significant role in mitigating acidification in OPVs [4]. While the vast majority of the soil samples exceeded established saline soil thresholds several times, and soil secondary salinization theoretically would be severe, a considerable proportion of OPVs maintained good and stable yields. This seemingly paradoxical observation might be attributable to several key soil characteristics: an unsaturated salt base, high CEC, and exceptional soil fertility retention [18]. The presence of adequate divalent cations and a relatively rich humus (4.0% organic matter content) in the soil of OPVs likely contributes to the formation of a favorable granular structure. This structure may partially compensate for the negative impacts of high salinity ions on soil properties. Furthermore, the mildly acidic soil environment may help maintain most nutrients within a relatively bioavailable range [30], potentially serving as a critical factor in ensuring sustained vegetable yields.
This study revealed a positive correlation between nutrients and salinity in the soil of OPVs, while soil pH exhibited a negative correlation with both salinity and nutrients. A strong interrelationship existed between nutrients and salinity. For instance, excess soil phosphorus could combine with Ca2+ or Mg2+ to form precipitates, thereby reducing their bioavailability [31]. Furthermore, an increase in water-soluble cations such as K+, NH4+, Na+, and other monovalent cations could disrupt the soil aggregate structure, potentially promoting the formation of compacted soil [32]. The Na+ content in this study approached 5.0%, and both soil salinity and nutrients were generally high. While secondary salinization significantly exceeded established thresholds for saline soils, the plants did not exhibit typical symptoms of salt stress. Additionally, the soil did not display invisible compaction or harden. The underlying physicochemical mechanisms required further investigation.
In addition, relative to the saline soil criteria for field soil, the evaluation criteria for secondary salinization in OPVs need to be revised and improved urgently to adapt to the current situation [33]. As illustrated in Figure 8, the majority of data points from soil samples fell within a specific range, with only a few surface sample points exhibiting deviations that did not significantly alter the overall trend. These observations suggested that, in the soil of OPVs, as long as the interactive relationship between nutrients and salinity was within a moderate range, there would be no substantial yield reductions occurring. However, if a particular soil exhibited both high overall salinity and concurrently low nutrients, the corresponding data points would be positioned within the upper portion of the confidence ellipse. This scenario could potentially lead to plant wilting and yield limitations, as exemplified by continuous brackish water irrigation. Such irrigation practices elevate soil EC, a proxy for salinity, and have been documented to cause a relative maize yield reduction of 16.1% [34]. Conversely, if a soil exhibited high nutrients accompanied by low salinity, the data points would be located on the right side of the confidence ellipse, potentially resulting in excess nutrients and reduced economic benefits [35].

5. Conclusions

Old protected vegetable fields exhibited a generally high level of soil fertility, characterized by abundant phosphorus and potassium. However, this nutrient enrichment was concentrated in the surface layer, potentially contributing to the observed prevalence of moss. The soil BS was unsaturated, and soil salinity exhibited a significant decrease with depth, with the highest levels measured at the surface. Furthermore, WHGs displayed a greater degree of secondary salinization compared to PTs. Interestingly, soil acidification was confined to the deeper layers (20–40 cm) in OPVs around the suburban area of Tai’an. In contrast to the high alkalinity typically observed in saline–alkaline soils, OPVs presented a unique characteristic of exhibiting both high salinity and acidic soil conditions simultaneously. Our observations suggest that crops cultivated in old protected environments could tolerate a certain level of soil quality issues without experiencing significant yield reductions. This tolerance may be attributed to the abundance of divalent cations (Ca2+ and Mg2+), unsaturated BS, good soil fertility and water retention capacity, and favorable granular structure. These combined factors likely mitigated the negative effects of soil acidification, secondary salinization, and other potential stressors on plant growth. Therefore, a key strategy for improving soil quality would be to implement a reduction in fertilizer application, particularly focusing on phosphorus-based fertilizers. This approach could deduce economic input costs while maintaining crop yield, thereby indirectly promoting soil fertility in a comprehensive manner.

Author Contributions

Methodology, X.C.; Software, N.Z.; Validation, H.Y.; Formal analysis, N.Z.; Investigation, N.Z., J.L., X.S., B.Y., Y.S. and G.G.; Writing—original draft, N.Z.; Writing—review & editing, X.C.; Project administration, X.C.; Funding acquisition, X.C. All authors have read and agreed to the published version of the manuscript.

Funding

This research was funded by the Key Research and Development Program of Shandong Province [2021CXGC010801] and the Natural Science Foundation of Shandong Province [ZR2021MC145]. And The APC was funded by [ZR2021MC145].

Data Availability Statement

The raw data supporting the conclusions of this article will be made available by the authors on request.

Conflicts of Interest

The authors declare no conflict of interest.

References

  1. Wang, L.; Yang, J. Introduction to Facility Agriculture; Chemical Industry Press: Beijing, China, 2017. [Google Scholar] [CrossRef]
  2. Li, T.L. Development status of China’s facility vegetable industry and outlook. China Veg. 2023, 1, 1–6. [Google Scholar]
  3. Zhang, Z.; Sun, D.; Tang, Y.; Zhu, R.; Li, X.; Gruda, N.; Dong, J.; Duan, Z. Plastic shed soil salinity in China: Current status and next steps. J. Clean. Prod. 2021, 296, 126453. [Google Scholar] [CrossRef]
  4. Li, J.; Wan, X.; Liu, X.; Chen, Y.; Slaughter, L.C.; Weindorf, D.C.; Dong, Y. Changes in soil physical and chemical characteristics in intensively cultivated greenhouse vegetable fields in North China. Soil Tillage Res. 2019, 195, 104366. [Google Scholar] [CrossRef]
  5. Wu, R.; Sun, H.; Xue, J.; Yan, D.; Liu, Y.; Gui, D.; Wang, X.; Yang, J. Acceleration of soil salinity accumulation and soil degradation due to greenhouse cultivation: A survey of farmers’ practices in China. Environ. Monit. Assess. 2020, 192, 399. [Google Scholar] [CrossRef]
  6. Han, J.; Luo, Y.; Yang, L.; Liu, X.; Wu, L.; Xu, J. Acidification and salinization of soils with different initial pH under green-house vegetable cultivation. J. Soils Sediments. 2014, 14, 1683–1692. [Google Scholar] [CrossRef]
  7. Pavlů, L.; Borůvka, L.; Drábek, O.; Nikodem, A. Effect of natural and anthropogenic acidification on aluminium distribution in forest soils of two regions in the Czech Republic. J. For. Res. 2021, 32, 363–370. [Google Scholar] [CrossRef]
  8. Lv, H.; Zhao, Y.; Wang, Y.; Wan, L.; Wang, J.; Butterbach-Bahl, K.; Lin, S. Conventional flooding irrigation and over fertilization drives soil pH decrease not only in the top- but also in subsoil layers in solar greenhouse vegetable production systems. Geoderma 2020, 363, 114156. [Google Scholar] [CrossRef]
  9. Kianpoor Kalkhajeh, Y.; Huang, B.; Hu, W.; Ma, C.; Gao, H.; Thompson, M.L.; Bruun Hansen, H.C. Environmental soil quality and vegetable safety under current greenhouse vegetable production management in China. Agric. Ecosyst. Environ. 2021, 307, 107230. [Google Scholar] [CrossRef]
  10. Li, T.; Yu, L.; Wu, Y.; Wan, G.; Li, J. Secondary Salinization of Greenhouse Vegetable Soils and Its Affecting Factors in Shandong Province of China. Acta Pedol. Sin. 2018, 55, 100–110. [Google Scholar]
  11. Cai, Z. Scientific and Technological Issues of Nutrient Management under Greenhouse Cultivation in China. Acta Pedol. Sin. 2019, 56, 36–43. [Google Scholar]
  12. Li, D.L.; Ren, Z.J.; Yan, L.M.; Bian, X.Y.; Zhao, Z.T. Pottiaceae in Shandong Province, China. J. Shandong Univ. (Sci. Ed.) 2016, 51, 11–15. [Google Scholar] [CrossRef]
  13. Xiong, Y.; Li, Q. Soils in China, 2nd ed.; Science Press: Beijing, China, 1987. [Google Scholar]
  14. Bao, S. Soil Agrochemical Analysis, 3rd ed.; China Agriculture Press: Beijing, China, 2000. [Google Scholar]
  15. Lever, J.; Krzywinski, M.; Altman, N. Principal component analysis. Nat. Methods 2017, 14, 641–642. [Google Scholar] [CrossRef]
  16. Guo, Y.; Geng, J.; Cheng, S.; Fang, H.; Li, X.; Yang, Y.; Li, Y.; Zhou, Y. Soil acidification and ammonia-oxidizing archaeal abundance dominate the contrasting responses of soil N2O emissions to NH4+ and NO3 enrichment in a subtropical plantation. Eur. J. Soil Biol. 2023, 116, 103491. [Google Scholar] [CrossRef]
  17. Ren, M.; Li, C.; Gao, X.; Niu, H.; Cai, Y.; Wen, H.; Yang, M.; Siddique, K.H.M.; Zhao, X. High nutrients surplus led to deep soil nitrate accumulation and acidification after cropland conversion to apple orchards on the Loess Plateau, China. Agric. Ecosyst. Environ. 2023, 351, 108482. [Google Scholar] [CrossRef]
  18. Huang, C.; Xu, J. Soil Science, 3rd ed.; China Agriculture Press: Beijing, China, 2010. [Google Scholar]
  19. Hong, J. Soil Pollution and Prevention, 4th ed.; China Agriculture Press: Beijing, China, 2019. [Google Scholar]
  20. Chen, L.; Hao, J.M.; Chen, A.Q.; Li, M.; Gao, Y.; Guan, Q.C.; Wang, H.L. Study on the water conservation function of cultivated land based on dualistic water cycle in Huang-Huai-Hai Plain. Acta Ecol. Sin. 2017, 37, 5871–5881. [Google Scholar] [CrossRef]
  21. Zhang, G.; Yang, Z.; Li, G.; Zheng, X.; Mao, C. Hydrogeochemical characterization of Tai’an Pumped Storage Power Station reservoir and the implications for Reservoir Water Leakage. IOP Conf. Ser. Earth Environ. Sci. 2021, 826, 012018. [Google Scholar] [CrossRef]
  22. Litalien, A.; Zeeb, B. Curing the earth: A review of anthropogenic soil salinization and plant-based strategies for sustainable mitigation. Sci. Total Environ. 2020, 698, 134235. [Google Scholar] [CrossRef] [PubMed]
  23. Audette, Y.; Smith, D.S.; Parsons, C.T.; Chen, W.; Rezanezhad, F.; Van Cappellen, P. Phosphorus binding to soil organic matter via ternary complexes with calcium. Chemosphere 2020, 260, 127624. [Google Scholar] [CrossRef]
  24. Wan, L.; Lv, H.; Qasim, W.; Xia, L.; Yao, Z.; Hu, J.; Zhao, Y.; Ding, X.; Zheng, X.; Li, G.; et al. Heavy metal and nutrient concentrations in top- and sub-soils of greenhouses and arable fields in East China—Effects of cultivation years, management, and shelter. Environ. Pollut. 2022, 307, 119494. [Google Scholar] [CrossRef]
  25. Ma, Q.; Qian, Y.; Yu, Q.; Cao, Y.; Tao, R.; Zhu, M.; Ding, J.; Li, C.; Guo, W.; Zhu, X. Controlled-release nitrogen fertilizer application mitigated N losses and modified microbial community while improving wheat yield and N use efficiency. Agric. Ecosyst. Environ. 2023, 349, 108445. [Google Scholar] [CrossRef]
  26. Yuan, M.; Gu, Z.; Xia, S.; Zhao, J.; Wang, X. In-situ remediation of zinc contaminated soil using phosphorus recovery product: Hydroxyapatite/calcium silicate hydrate (HAP/C–S–H). Chemosphere 2022, 286, 131664. [Google Scholar] [CrossRef]
  27. Wang, R.; Zhong, Y.; Li, H.; Shi, W.; Li, Y. Research Progresses on Environmental and Agriculture Thresholds of Soil Phosphorus in High-input Vegetable Fields. Soils 2022, 54, 1–8. [Google Scholar] [CrossRef]
  28. Ma, J.; Ma, Y.; Wei, R.; Chen, Y.; Weng, L.; Ouyang, X.; Li, Y. Phosphorus transport in different soil types and the contribution of control factors to phosphorus retardation. Chemosphere 2021, 276, 130012. [Google Scholar] [CrossRef] [PubMed]
  29. Wakeel, A.; Ishfaq, M. Potash Use and Dynamics in Agriculture; Springer: Singapore, 2022. [Google Scholar] [CrossRef]
  30. Neina, D. The Role of Soil pH in Plant Nutrition and Soil Remediation. Appl. Environ. Soil Sci. 2019, 5794869. [Google Scholar] [CrossRef]
  31. Fan, Y.N.; Zhang, Y.; Chen, Z.; Wang, X.; Huang, B. Comprehensive assessments of soil fertility and environmental quality in plastic greenhouse production systems. Geoderma 2021, 385, 114899. [Google Scholar] [CrossRef]
  32. Chen, Y.; Huang, L.; Zhang, R.; Ma, J.; Guo, Z.; Zhao, J.; Weng, L.; Li, Y. Retardation factors in controlling the transport of inorganic, organic, and particulate phosphorus in fluvo-aquic soil. Ecotoxicol. Environ. Saf. 2023, 249, 114402. [Google Scholar] [CrossRef]
  33. Sun, X.; Li, Q.; Kong, X.; Cai, W.; Zhang, B.; Lei, M. Spatial Characteristics and Obstacle Factors of Cultivated Land Quality in an Intensive Agricultural Region of the North China Plain. Land 2023, 12, 1552. [Google Scholar] [CrossRef]
  34. Zhang, Y.; Li, X.; Wang, J.; Shi, H.; Chen, N.; Hu, Q. Improved yield-salinity relationship considering salt and root distribution dynamics. Eur. J. Agron. 2023, 151, 127003. [Google Scholar] [CrossRef]
  35. Fan, Y.N.; Zhang, Y.; Hess, F.; Huang, B.; Chen, Z. Nutrient balance and soil changes in plastic greenhouse vegetable production. Nutr. Cycl. Agroecosyst. 2020, 117, 77–92. [Google Scholar] [CrossRef]
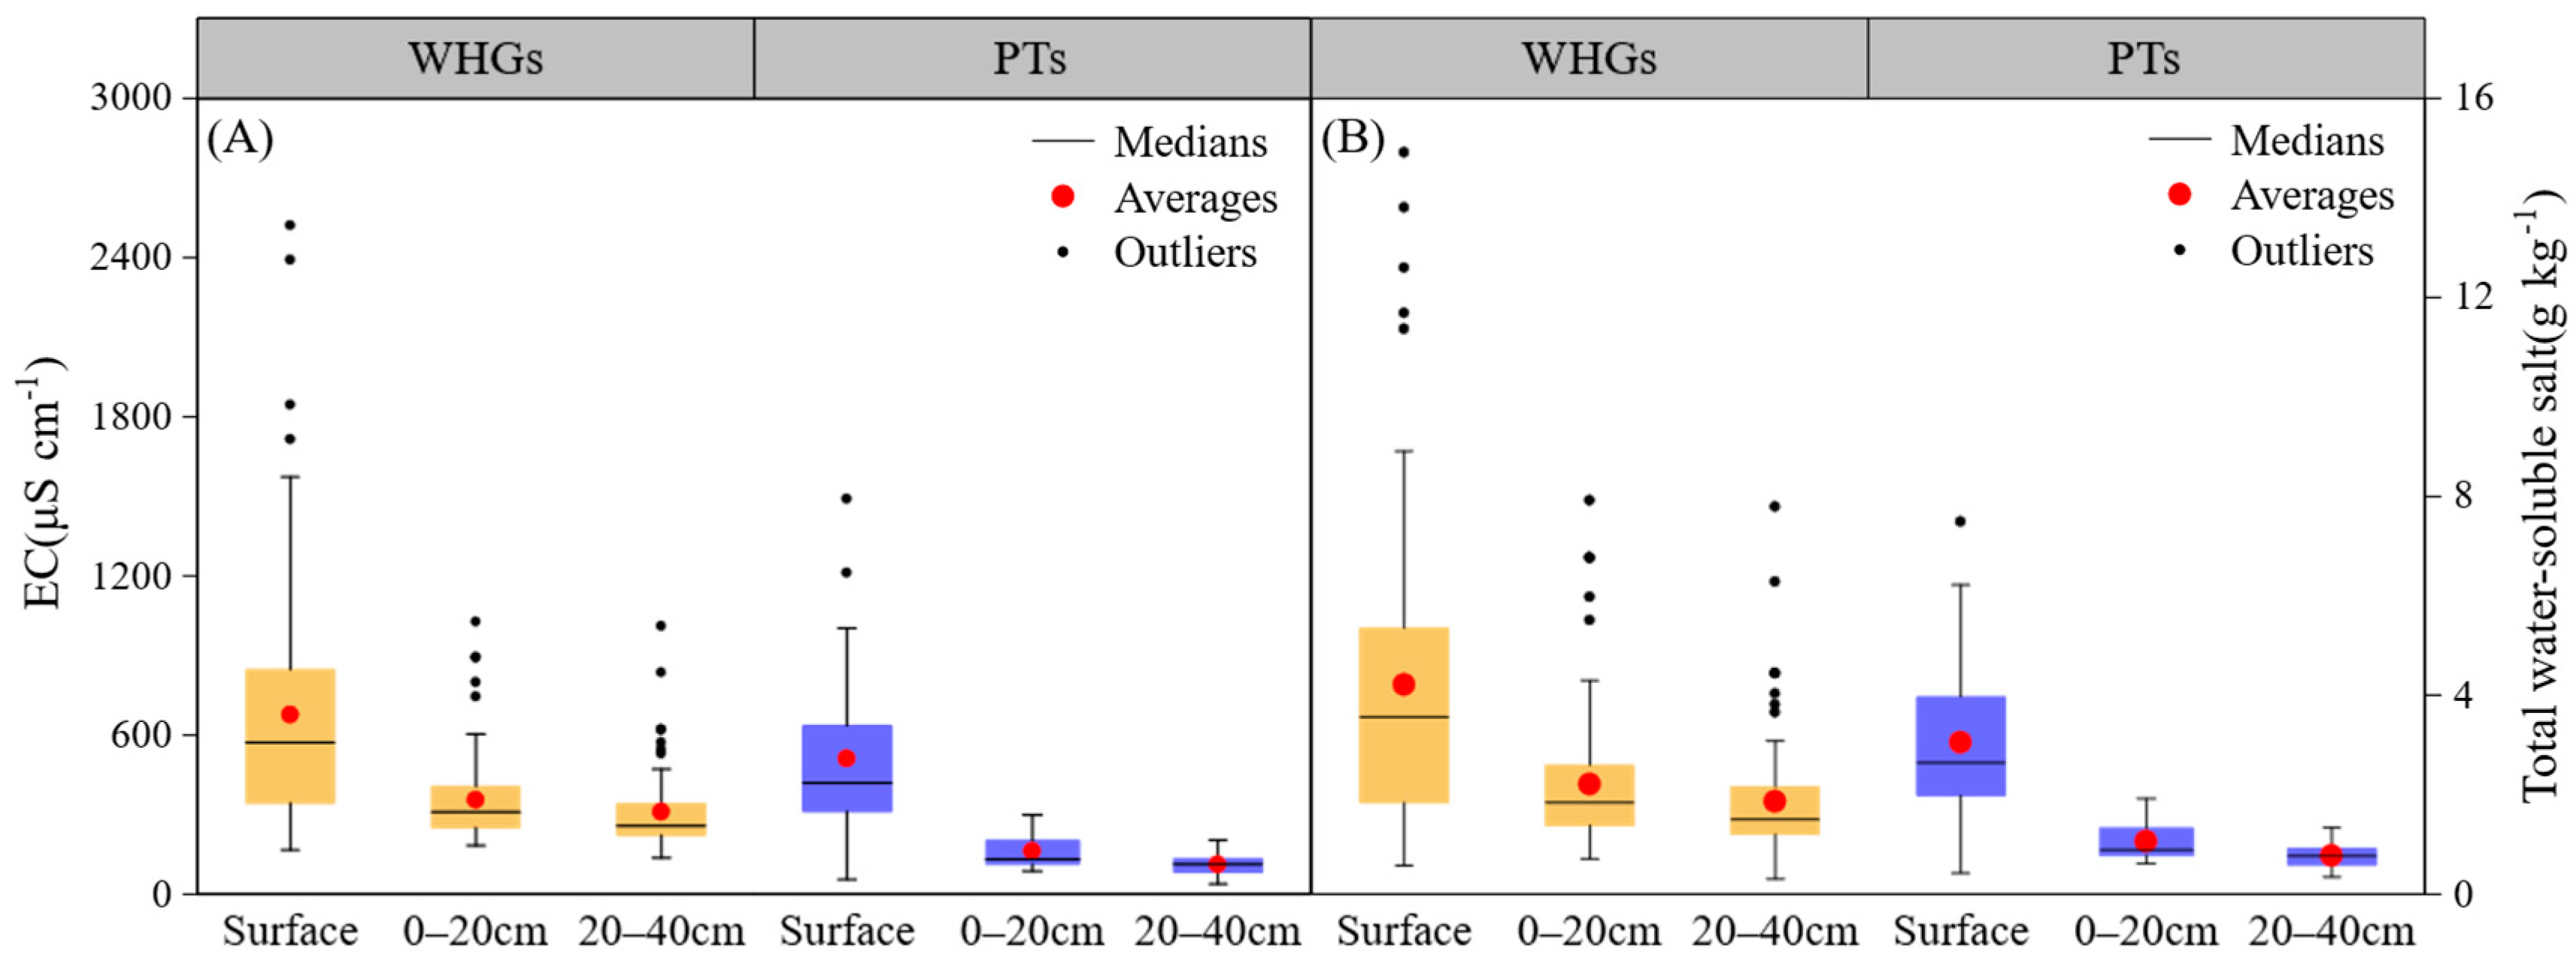
Figure 2. Soil EC (A) and total water-soluble salt (B) at different depths in WHGs and PTs.
Horticulturae 11 00126 g002
Figure 3. The soil cation exchange capacity (CEC) and soil exchangeable salts base (SEB) at different depths in WHGs and PTs. The different lowercase letters (capital letters) indicate significant differences among treatments (p < 0.05).
Horticulturae 11 00126 g003
Figure 4. Composition of basic water-soluble saline-based ions in soil surface, 0–20 cm, and 20–40 cm.
Horticulturae 11 00126 g004
Figure 5. Soil total nitrogen (A), alkaline hydrolyzable nitrogen (B), ammonium nitrogen (C) and nitrate nitrogen (D) at different depths in WHGs and PTs.
Horticulturae 11 00126 g005
Figure 6. Soil available phosphorus (A) and available potassium (B) at different depths in WHGs and PTs.
Horticulturae 11 00126 g006
Figure 7. Heatmap of Pearson correlation coefficients between some soil salinity indicators and nutrient indicators. Salinity indicators include pH, electrical conductivity (EC), total water-soluble salt (TDS), and water-soluble HCO3, Cl, SO42−, K+, Na+, Ca2+, and Mg2+. Nutrient indicators include alkaline hydrolyzable nitrogen (HN), total nitrogen (TN), available phosphorus (AP), total phosphorus (TP), available potassium (AK), nitrate nitrogen (NO3-N), ammonium nitrogen (NH4+-N). Significant differences: * p < 0.05, ** p < 0.01.
Horticulturae 11 00126 g007
Figure 8. The relationship between the comprehensive evaluation of nutrients and salinity in facility soil. The significance level of the R2 of the fitted curve was 0.01.
Horticulturae 11 00126 g008
Table 1. Soil background values for the study area.
IndicatorsContent
pH
Organic matter
6.4
0.75%
Alkaline hydrolyzable nitrogen45.3 mg kg−1
Total nitrogen0.50 g kg−1
Available phosphorus4.50 mg kg−1
Total phosphorus0.80 g kg−1
Available potassium72.0 mg kg−1
Cation exchange capacity (CEC)16.9 cmol kg−1
Soil salt base saturation (BS)98.4%
Table 2. Experimental measuring items and methods.
Measuring ItemsMeasuring Methods
Alkaline hydrolyzable nitrogenNaOH hydrolysis—boric acid absorption—acid titration
NO3-N, NH4+-NKCl extraction–spectrophotometric method
Available phosphorusNaHCO3 extraction, Mo-Sb Anti-spectrophotometric
Available potassiumNH4Ac extraction–flame photometry
Total nitrogenH2SO4 digestion–Kjeldahl method
Total phosphorusH2SO4-HClO4 digestion, Mo-Sb Anti-spectrophotometric
Table 3. Soil pH and percentage of pH range in winter-warm heliogreenhouses and plastic tunnels.
ItemsWinter-Warm HeliogreenhousesPlastic Tunnels
Surface0–20 cm20–40 cmSurface0–20 cm20–40 cm
Mean (SD)6.13 ± 0.566.24 ± 0.536.29 ± 0.586.35 ± 0.446.08 ± 0.615.78 ± 0.70
pH < 5.516.0%7.41%9.88%7.69%19.2%50.0%
5.5 ≤ pH < 7.077.8%84.0%80.2%88.5%77.0%42.3%
pH ≥ 7.06.17%8.64%9.88%3.85%3.85%7.69%
Table 4. Conductivity of soil saturated leachate in relation to salinity and crop growth.
Saturated Leachate
EC25 (dS m−1)
Salinity
(g kg−1)
Degree of SalinityPlant Response
0–2<1.0Non-Saline SoilsNo salt damage to crops
2–41–3Saline SoilsCrop yields for species highly susceptible to salinity stress are likely to be negatively impacted
4–83–5Moderately Saline SoilsYields of salt-sensitive crops are affected, but salt-tolerant crops (e.g., alfalfa, cotton, sugar beets, sorghum, cereals) are not significantly affected
8–165–10Heavy Saline SoilsWhile only salt-tolerant crops were successfully harvested, seed germination was negatively impacted, resulting in seedling deficits and substantial yield reductions
>16>10Extremely Saline SoilsPlant growth is restricted to highly salt-tolerant species, such as salt-tolerant pasture grasses, shrubs, and trees
(Source: Bao Shidan. Soil agrochemical analysis [M]. China Agricultural Press, 2000, page 187) [14].
Table 5. Total variance explanations for principal component analysis.
ComponentsInitial EigenvaluesExtract Sums of Squared Loadings
TotalPercentage of Variance (%)Cumulative
(%)
TotalPercentage of Variance (%)Cumulative
(%)
13.84954.9954.993.84954.9954.99
21.12916.1371.131.12916.1371.13
30.91613.0984.210.91613.0984.21
40.6008.56892.78
50.3464.94797.73
60.1522.17099.90
70.0070.101100.0
Note: significance of Bartlett’s test of sphericity is less than 0.001, suitable for principal component analysis.
Disclaimer/Publisher’s Note: The statements, opinions and data contained in all publications are solely those of the individual author(s) and contributor(s) and not of MDPI and/or the editor(s). MDPI and/or the editor(s) disclaim responsibility for any injury to people or property resulting from any ideas, methods, instructions or products referred to in the content.