Article

Transcriptome–Metabolome Integration Reveals Mechanisms of Leaf Color Variation in Leafy Vegetable Sweet Potato

1
Jiangxi Institute of Red Soil and Genetic Resource/Key Laboratory of Arable Land Improvement and Quality Improvement of Jiangxi Province, Nanchang 330046, China
2
Jiangxi Province Key Laboratory of Vegetable Cultivation and Utilization, Jiangxi Agricultural University, Nanchang 330045, China
3
Key Laboratory of Crop Physiology, Ecology and Genetic Breeding, Ministry of Education, Jiangxi Agricultural University, Nanchang 330045, China
*
Authors to whom correspondence should be addressed.
Horticulturae 2025, 11(11), 1317; https://doi.org/10.3390/horticulturae11111317
Submission received: 19 September 2025 / Revised: 26 October 2025 / Accepted: 31 October 2025 / Published: 3 November 2025

Abstract

Leaf color, as a key ornamental and quality trait in leafy vegetable sweet potato, is controlled by the coordinated regulation of multiple pigment metabolic pathways. To dissect the mechanisms underlying leaf color variation, the integrated transcriptomic and metabolomic analyses were performed on three contrasting phenotypes: green (G), yellow (Y), and purple-red (R). The results showed that purplish-red leaves accumulated the highest levels of anthocyanins (16.36 mg·g−1) and total chlorophyll (2.54 mg·g−1), indicating that the synergistic accumulation of anthocyanins and chlorophyll contributes to their dark pigmentation. In contrast, yellow leaves contained the lowest carotenoid content yet displayed the highest carotenoid-to-chlorophyll ratio (6.44), suggesting that reduced chlorophyll levels coupled with a relatively higher carotenoid proportion underlie the yellow phenotype. Green leaves exhibited a more balanced pigment profile, with a total chlorophyll content of 1.94 mg·g−1. Transcriptomic profiling revealed elevated expression of anthocyanin biosynthetic genes CHS, CHI, F3H, and chlorophyll metabolism-related genes CHLG and CAO in purplish-red leaves, whereas carotenoid biosynthesis genes LCY and CYP97A3 showed specific regulation in yellow leaves. Collectively, these findings demonstrate that leaf color formation in leafy vegetable sweet potato is determined by the relative accumulation of chlorophylls, carotenoids, and anthocyanins, together with differential regulation of their biosynthetic pathways. This work provides novel insights into the molecular basis of leaf color variation and offers a theoretical foundation for genetic improvement of leafy vegetable sweet potato.

1. Introduction

Leafy vegetable sweet potato (Ipomoea batatas L. var.), also known as vegetable-type sweet potato, is a type of sweet potato cultivated for harvesting tender leaves and shoots as vegetables. It is widely grown in south China [1]. Unlike the root-type sweet potato primarily valued for its storage roots, the economic importance of leafy vegetable sweet potato lies mainly in the utilization of its leaves in the vegetable and functional food industries [2]. The leaves are rich in high-quality proteins, vitamins (especially vitamins A, C, and E), minerals, and bioactive compounds such as polyphenols, flavonoids, and anthocyanins. These compounds have demonstrated antioxidant, hypoglycemic, hypolipidemic, and immune-enhancing properties [3], making leafy vegetable sweet potato an important resource for health-promoting vegetables and functional food development.
Leaf color represents an important morphological and commercial attribute of leafy vegetable, serving not only as a determinant of consumer preference and market value but also as an indicator of nutritional characteristics [4]. Within natural germplasm, leaf color variants-predominantly green, yellow, and purple-red, are often associated with distinct nutritional compositions, antioxidant capacities, and levels of stress tolerance [5,6,7]. Green leaves, characterized by abundant chlorophylls, generally exhibit higher photosynthetic efficiency, attributable to their greater chlorophyll content [5]. As the principal pigments in light capture, chlorophylls confer green coloration and play a pivotal role in photosynthetic energy conversion. Yellow leaves typically possess reduced chlorophyll content but are enriched in carotenoids, pigments responsible for yellow to orange hues. Beyond contributing to coloration, carotenoids participate in light harvesting and photoprotection and serve as precursors for provitamin A, thereby enhancing the nutritional value of yellow-leaf genotypes [8]. Purple-red leaves accumulate high levels of anthocyanins and other phenolic compounds, which impart red to purple pigmentation. These secondary metabolites are strongly linked to free radical scavenging capacity and are integral to plant stress response mechanisms and signaling pathways [9]. The molecular basis of leaf color variation encompasses the biosynthesis, degradation, and regulatory control of chlorophylls, carotenoids, and anthocyanins, whose metabolic pathways are highly interconnected [8,10]. Ultimately, leaf pigmentation patterns are determined by competition for shared metabolic precursors, modulation by transcription factors, and environmental cues that influence pigment biosynthetic networks [11,12].
In model plants such as Arabidopsis thaliana, many key genes and metabolic pathways regulating leaf color have been identified, such as, CHLH (Chlorophyll H subunit of magnesium chelatase), CHLI (Chlorophyll I subunit of magnesium chelatase), and POR (Protochlorophyllide oxidoreductase) are involved in chlorophyll biosynthesis [13]; PSY (Phytoene synthase), LCYB (Lycopene beta-cyclase), and ZEP (Zeaxanthin epoxidase) function in carotenoid biosynthesis [14]; and CHS (Chalcone synthase), DFR (Dihydroflavonol 4-reductase), and ANS (Anthocyanidin synthase) are essential for anthocyanin biosynthesis and accumulation [15]. These findings highlight the complexity of pigment regulation and provide valuable references for studies in other species. However, compared with these well-studied crops, research on leafy vegetable sweet potato remains limited, most existing studies have focused on pigment content measurement or single-omics analyses [16]. While informative, these approaches fail to capture the integrative molecular landscape linking gene expression, metabolite accumulation, and phenotypic traits.
To overcome these limitations, multi-omics approaches, particularly the integration of transcriptomics and metabolomics, offer powerful tools for dissecting complex regulatory networks. Transcriptomics enables global profiling of gene expression changes associated with leaf color variation, revealing differences in pigment biosynthesis, photosynthesis, energy metabolism, and signaling pathways [17,18]. Metabolomics, in parallel, provides precise quantification of pigment compounds, their biosynthetic intermediates, precursors, and other bioactive metabolites [16,19,20]. Importantly, integrative transcriptome-metabolome analysis allows systematic dissection of multi-level regulatory mechanisms connecting genes, metabolites, and phenotypes. To date, only limited studies have reported anthocyanin-related gene and metabolite associations in purple-leaf sweet potato [21], and no systematic comparative analysis has been conducted across green, yellow, and purple-red leafy vegetable sweet potato cultivars. Therefore, integrating transcriptomic and metabolomic analyses can elucidate differences in chlorophyll, carotenoid, and anthocyanin biosynthesis, and identify key genes and metabolites that regulate leaf color in leafy vegetable sweet potato.
Here, the metabolome and transcriptome analyses were used to identify key metabolic pathways and genes underlying the phenotypic variation in leafy vegetable sweet potato leaves across three cultivars. This research will enhance the understanding of the metabolic networks and molecular mechanisms of leaf color variations in leafy vegetable sweet potato plants.

2. Materials and Methods

2.1. Plant Materials

Three leafy vegetable sweet potato cultivars were used in this study. Cultivar G (Fushu 7-6) was obtained from the Crop Research Institute, Fujian Academy of Agricultural Sciences (Fuzhou, China); cultivar Y (GuangShuJinYe) was provided by the Crop Research Institute, Guangdong Academy of Agricultural Sciences (Guangzhou, China); and cultivar R (Hongsushu) was supplied by the Jiangxi Province Key Laboratory of Vegetable Cultivation and Utilization (Nanchang, China). The leaf color phenotypes of the three cultivars (G, Y, and R) are genetically stable traits determined by inherent differences in pigment biosynthesis, rather than transient physiological responses. Although environmental factors may slightly affect pigment levels, the overall coloration remains stable under normal field conditions.
Plants were cultivated under uniform field conditions at Jiangxi Agricultural University (115.8° E, 28.7° N) during the growing season. To minimize environmental variation, all cultivars were grown side by side in the same experimental field, following standard agronomic practices. Mature, fully expanded functional leaves were harvested at the vigorous growth stage (45 days after planting). For each cultivar, three independent biological replicates were collected, with each replicate consisting of pooled leaves from several individual plants to ensure representativeness. Immediately after harvesting, samples were frozen in liquid nitrogen and subsequently stored at −80 °C until further analysis.

2.2. Determination of Chlorophyll a, Chlorophyll b, Carotenoids and Anthocyanins Content

Chlorophyll a and b contents were determined as previous [22]. Briefly, 0.1 g of fresh leaf was ground in liquid nitrogen and extracted with 80% (v/v) acetone at 4 °C in darkness until the tissues were completely decolorized. The extracts were then centrifuged at 10,000× g for 5 min, and the resulting supernatants were collected. Absorbance was measured at 663 nm and 645 nm using a UV–visible spectrophotometer (A663 and A645, respectively). The concentrations of chlorophyll a and chlorophyll b were calculated using the formulas: Chl a = 12.7 × A663 − 2.69 × A645 and Chl b = 22.9 × A645 − 4.68 × A663, respectively. The results were expressed as mg·g−1 fresh weight (FW).
Total carotenoid content was determined according to the method of Lichtenthaler [23], using the same extraction procedure as described for chlorophyll. The absorbance of the supernatant was measured at 470 nm (A470), and the concentration was calculated as Car = (1000 × A470 − 1.90 × Chl a − 63.14 × Chl b)/214, the results were expressed as mg·g−1 fresh weight (FW).
Anthocyanin content was quantified using the pH differential method as described by Jia [24]. Briefly, samples were extracted in methanol containing 1% (v/v) HCl under dark conditions and then diluted separately with buffer solutions at pH 1.0 and pH 4.5. The mixtures were allowed to equilibrate for 20 min before measurement. Absorbance was recorded at 520 nm and 700 nm for both pH conditions, and the absorbance value (A) was calculated as: A = (A520 − A700)pH 1.0 − (A520 − A700)pH 4.5. Anthocyanin concentration was expressed as cyanidin-3-glucoside equivalents (mg·L−1) using the equation C = (A × MW × DF × 1000)/(ε × l), where MW = 449.2 g·mol−1, ε = 26 900 L·mol−1·cm−1, l = 1 cm, and DF is the dilution factor.

2.3. Metabolome Data Analysis

Non-targeted metabolomic analysis was conducted on mature leaves of G, Y, and R cultivars, with three biological replicates for each cultivar. The experiment was performed by Wuhan Maivis Metabolomics Biotechnology Co., Ltd. (Wuhan, China). Freeze-dried leaf samples were ground using a mixer mill, and 50 mg of powder was extracted with 1.2 mL 70% (v/v) methanol for 30 min and repeated 5 times. After centrifugation at 12,000 rpm for 3 min, the supernatant was filtered through 0.22 μm filters and analyzed by LC–MS/MS. Separation was performed on a Waters ACQUITY UPLCHSS T3 Column (1.8 μm, 2.1 mm × 100 mm; Waters Corporation, Milford, MA, USA), with a mobile phase consisting of pure water (A) and acetonitrile (B), both containing 0.1% (v/v) formic acid. The gradient was as follows: 5% B at 0 min, increasing to 65% B at 5 min, then, increasing to 99% B at 6 min, held for 1.5 min, and then returning to 5% B from 7.6 to 10 min. The flow rate was 0.4 mL/min, column temperature 40 °C, and injection volume 4 μL. A pooled quality control (QC) sample was prepared by mixing equal aliquots from all nine samples and was injected at regular intervals during the LC–MS/MS run to monitor instrument stability and ensure data reliability.
Unsupervised PCA (principal component analysis) was performed by statistics function prcomp within R (www.r-project.org, accessed on 2 August 2025) software (version 4.1.2), the differentially accumulated metabolites (DAMs) were defined by VIP ≥ 1 and absolute Log2FC (|Log2FC| ≥ 1.0).

2.4. Transcriptome Sequencing

A total of nine samples were prepared for RNA extraction based on the instructions of the Quick RNA extraction kit (Tiangen, Beijing, China), and RNA purity and concentration were determined with a NanoDrop 2000 spectrophotometer (Thermo Fisher Scientific, Waltham, MA, USA). RNA integrity was assessed using an Agilent 2100 Bioanalyzer (Agilent Technologies, Santa Clara, CA, USA).
Qualified RNA samples were sent to Genedenovo Biotechnology Co., Ltd. (Guangzhou, China) for cDNA library construction and paired-end sequencing (PE150) on the Illumina NovaSeq 6000 platform. Raw sequencing data were processed with fastp software (version 0.19.3) for quality control, including adapter trimming, removal of low-quality bases, and filtering of short reads, yielding high-quality clean reads. The clean reads were then aligned to the sweet potato reference genome using HISAT2 (version 2.2.0) [25]. Transcript quantification was performed using FeatureCounts software (v1.6.2) to calculate normalized gene expression levels [26], expressed as fragments per kilobase of transcript per million mapped reads (FPKM). The identification of Differentially expressed genes (DEGs) was achieved through application of DESeq2 (version 1.22.1) [27], employing an absolute Log2FC (|Log2FC| ≥ 1), false discovery rate (FDR) < 0.05). DEGs were annotated by BLAST searches against the NR and Swiss-Prot databases, and functional annotation and enrichment analysis were conducted using the KEGG [28] and Gene Ontology (GO) [29] databases in Genedenovo Cloud Platform (https://www.omicshare.com/, accessed on 15 August 2025).

2.5. Transcriptome–Metabolome Joint Enrichment Analysis and O2PLS Analysis

DEGs from the transcriptome and DAMs from the metabolome were analyzed for KEGG pathway enrichment on the Metware Cloud platform (https://cloud.metware.cn, accessed on 22 August 2025) using the KEGG Enrichment module with over-representation analysis. Pathways with p < 0.05 were considered significantly enriched, and bubble plots were generated within the platform. For joint enrichment analysis, pathways significantly enriched in both datasets were integrated using the Joint Pathway Analysis module on Metware Cloud, which jointly mapped genes and metabolites to KEGG pathways. Enrichment statistics used the hypergeometric test (default settings), and results were summarized at the pathway level to highlight concordant changes across the two omics layers.
To further investigate the coordinated variation patterns between the transcriptome and metabolome, orthogonal partial least squares (O2PLS) analysis was performed [30]. Data preprocessing was conducted in R using the ropls package, including mean-centering and Pareto scaling. Gene–metabolite pairs were filtered based on a correlation coefficient |r| ≥ 0.8 and p < 0.05, and those meeting the criteria were considered to exhibit strong co-variation. The O2PLS analysis was conducted using the cloud-based platform provided by Metware cloud (https://cloud.metware.cn/#/tools/tool-list, accessed on 26 August 2025).

2.6. Quantitative Real-Time PCR (qRT-PCR) Validation

Total RNA was extracted from mature leaves of the G, Y, and R cultivars using the Quick RNA extraction kit (Tiangen, Beijing, China) according to the manufacturer’s instructions. The concentration and purity of RNA were determined using a BioDrop spectrophotometer (Biochrom, Cambridge, UK) by measuring the absorbance at 260 and 280 nm. RNA integrity was verified by 1.0% agarose gel electrophoresis. The cDNA was synthesized from 1 μg of total RNA using the PrimeScript™ RT reagent Kit with gDNA Eraser (Takara, Dalian, China) according to the manufacturer’s instructions. qRT-PCR primers were designed using Primer5 software (version 5.0; Premier Biosoft International, Palo Alto, CA, USA). qRT-PCR was performed on an ABI PRISM 7900HT sequence detection system (Applied Biosystems, Waltham, MA, USA) using the SYBR Premix Ex Taq Kit (TaKaRa, Tokyo, Japan) under the following thermal cycling conditions: 95 °C for 3 min, followed by 40 cycles of 95 °C for 15 s, 58 °C for 30 s, and 72 °C for 30 s. IbActin was used as the internal reference gene, and the G cultivar was set as the control sample. Relative expression levels were calculated using the 2−ΔΔCt method, the primers listed in Supplemental Table S1.

3. Results

3.1. Pigment Composition and Leaf Color Variation in Leafy Vegetable Sweet Potato

To investigate the variation in pigment composition among leafy vegetable sweet potato cultivars with distinct leaf colors, the G, Y, and R cultivars were selected for analysis (Figure 1A). The contents of chlorophyll a, chlorophyll b, carotenoids, and anthocyanins were quantified, and statistically significant differences in the concentrations of these pigments were observed among the three cultivars (Table 1). The R cultivar exhibited the highest chlorophyll a content (1.51 ± 0.13 mg·g−1 FW) and chlorophyll b content (1.03 ± 0.07 mg·g−1 FW), both of which were significantly greater than those in the G and Y cultivars. By contrast, the Y cultivar showed the lowest carotenoid content (0.19 ± 0.03 mg·g−1 FW), whereas the G and R cultivars contained significantly higher levels. Anthocyanin content was highest in the R cultivar (16.36 ± 0.67 mg·g−1 FW), markedly exceeding that of the G cultivar (10.02 ± 0.19 mg·g−1 FW) and Y cultivar (0.89 ± 0.64 mg·g−1 FW).
Leaf color variation in plants is largely determined by the accumulation and relative proportions of photosynthetic and accessory pigments, including chlorophylls, carotenoids, and anthocyanins. To further characterize these differences, the ratios of carotenoid to chlorophyll and anthocyanin to chlorophyll were calculated. The Car/Chl ratio was highest in the Y cultivar, followed by the G cultivar (Figure 1B). In contrast, the Ant/Chl ratio was greatest in the R cultivar, with the G cultivar ranking second (Figure 1C). Notably, the total chlorophyll content was highest in R cultivar, followed by G cultivar, whereas Y cultivar exhibited the lowest chlorophyll content (Figure 1D). These results suggest that elevated carotenoid levels relative to chlorophyll contribute to yellow leaf coloration, whereas increased anthocyanin accumulation is responsible for the development of red or purplish hues in leaves.

3.2. Overview of the Metabolic Data in Leafy Vegetable Sweet Potato

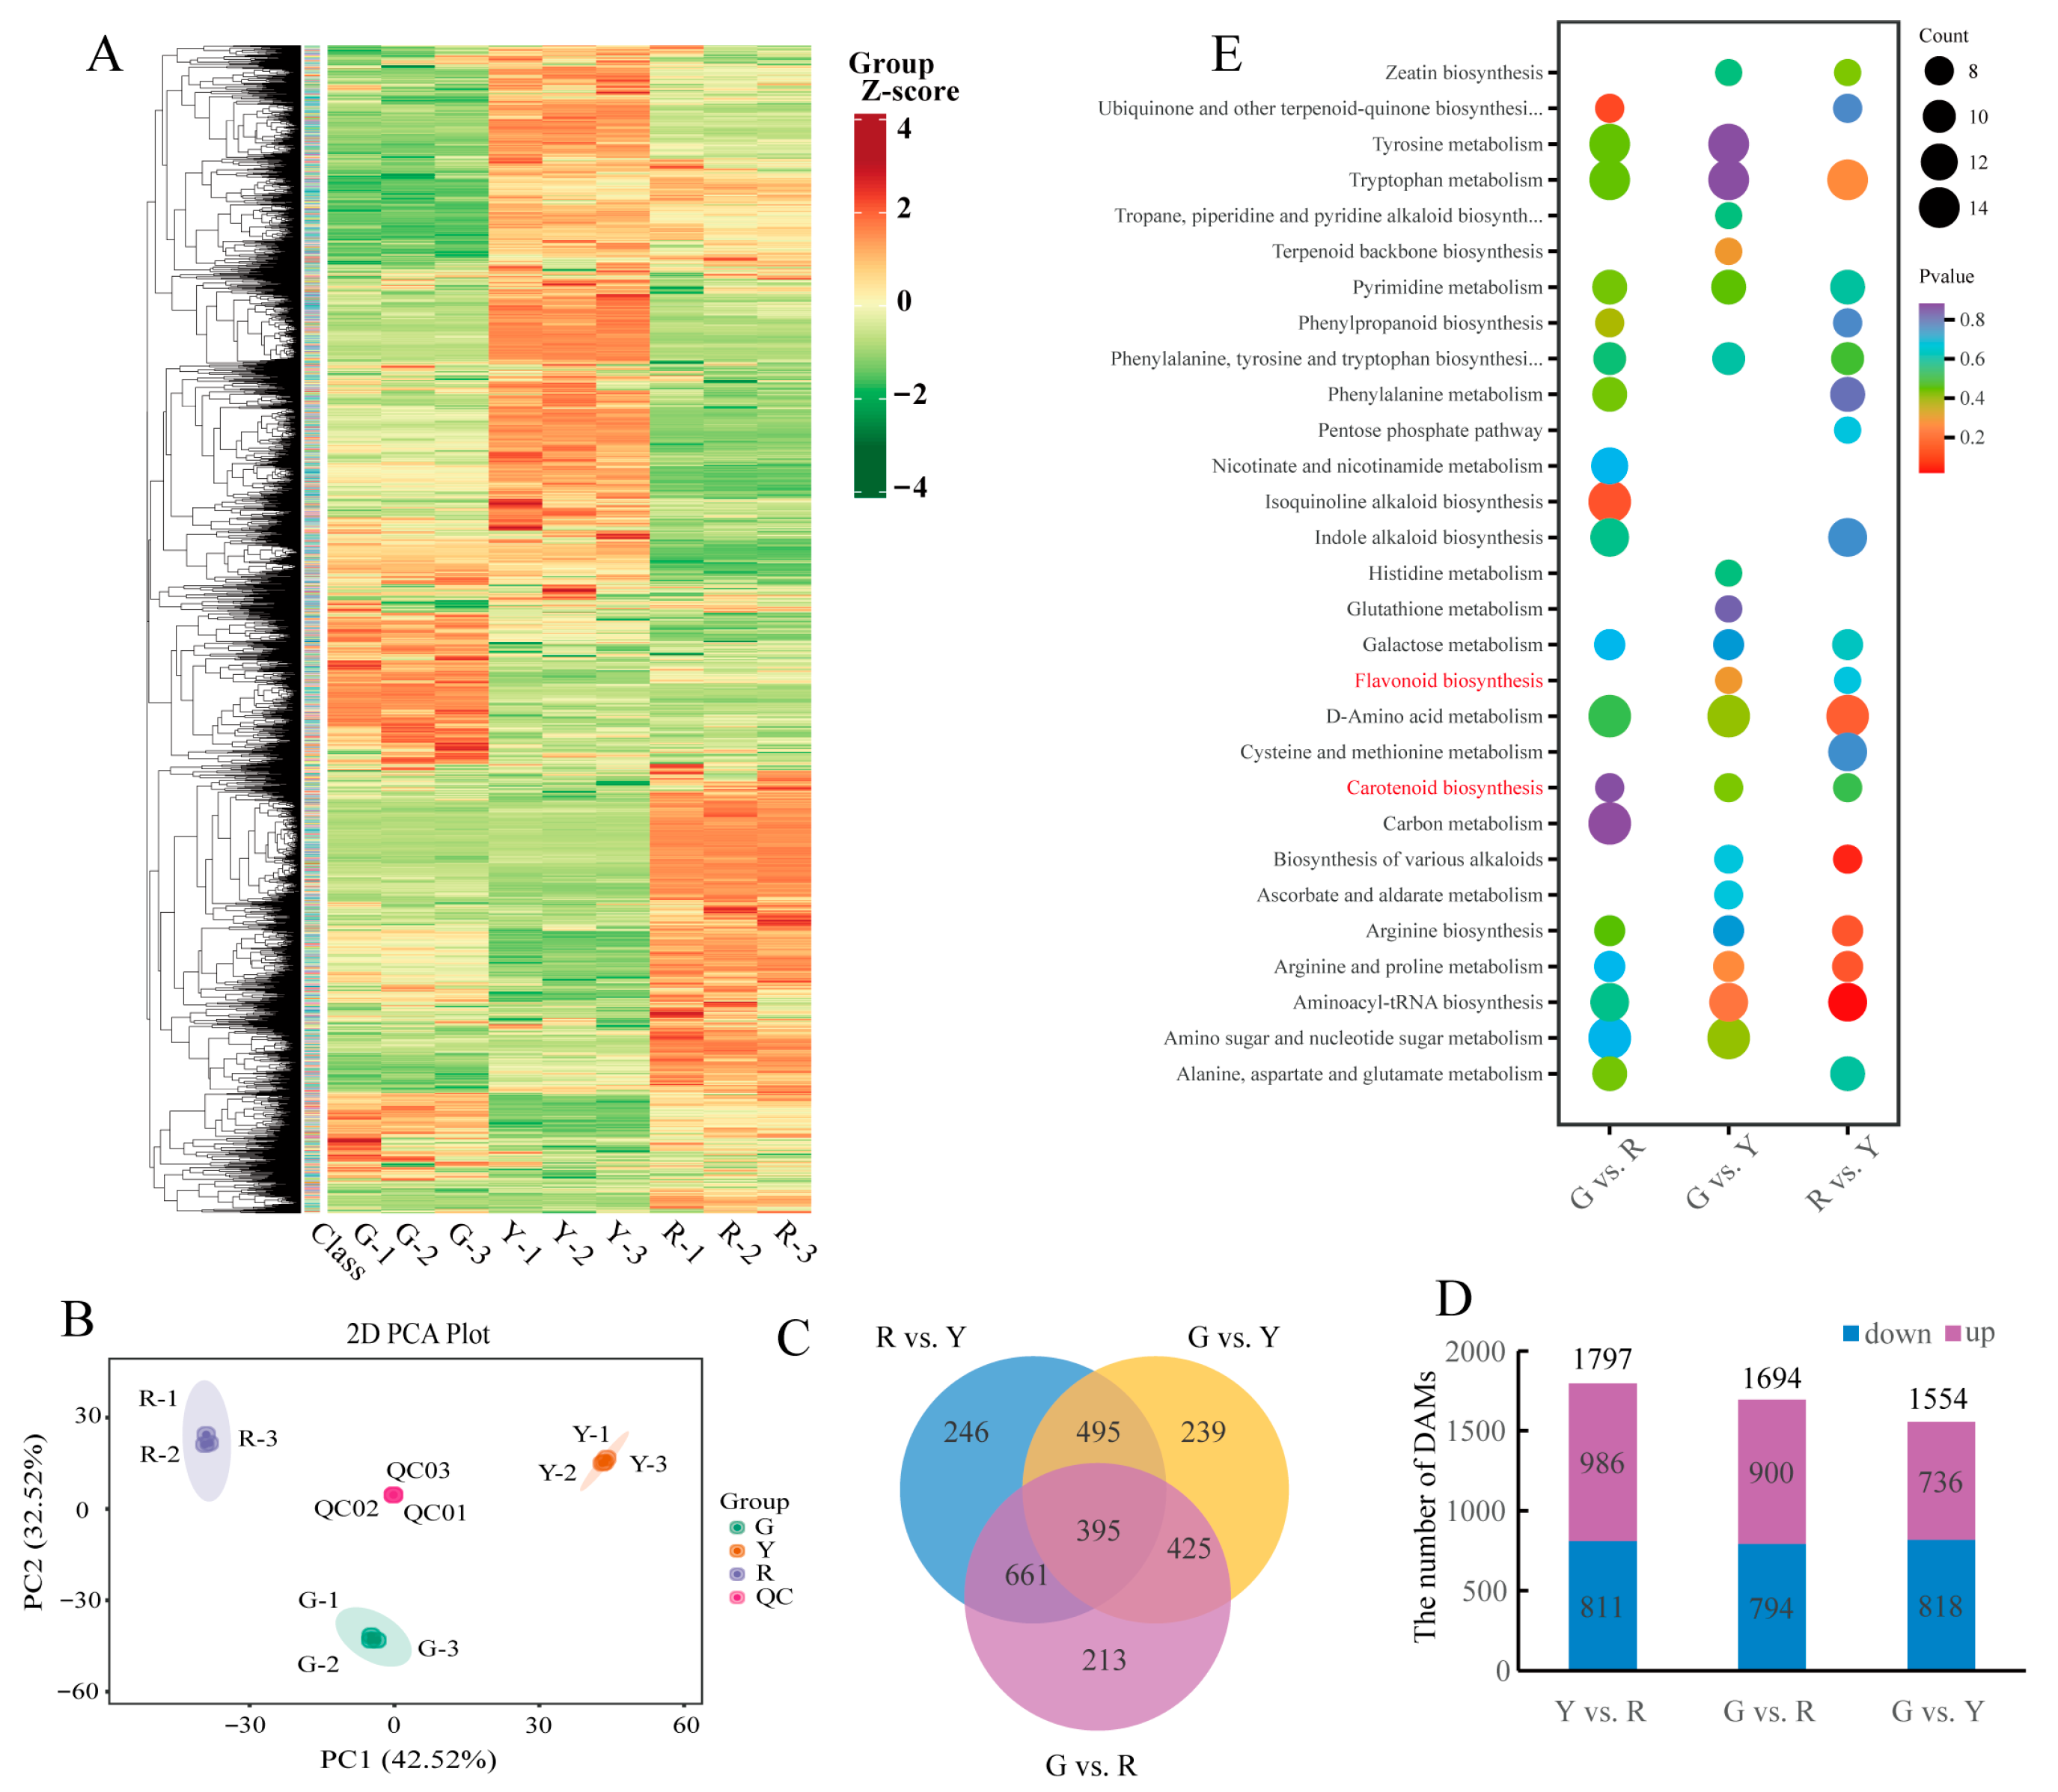
To investigate the biochemical basis underlying leaf color differences in leafy vegetable sweet potato cultivars, a non-targeted metabolomic analysis of leaves was conducted using UPLC–MS/MS. A total of 3943 metabolites were detected across the tested samples (Figure 2A), encompassing diverse classes including alcohols and amines (130), alkaloids (183), amino acids and derivatives (1085), benzene and substituted derivatives (466), cholines (2), fatty acids (31), flavonoids (132), glycosides (49), glycerophospholipids (129), heterocyclic compounds (128), lignans and coumarins (70), lipids (104), nucleotides and derivatives (98), organic acids (530), phenolic acids (116), quinones (9), saccharolipids (5), steroids (44), tannins (6), terpenoids (115), and others (511). Cluster analysis and principal component analysis (PCA) clearly separated the nine samples into three distinct groups, with PC1 and PC2 explaining 42.52% and 32.52% of the total variance, respectively (Figure 2B), highlighting metabolite differences among the three cultivars. A Venn diagram further revealed that 395 DAMs were shared across all three pairwise comparisons (Figure 2C).
Differential accumulation was assessed using the criteria VIP ≥ 1.0 and fold change ≥ 2 or ≤ 0.5. As a result (Figure 2D), 1797 DAMs were identified between Y and R cultivars, including 986 upregulated and 811 downregulated in Y cultivar. In the G vs. R comparison, 1694 DAMs were detected, comprising 900 upregulated and 794 downregulated in R cultivar. Between G and Y cultivars, 1554 DAMs were identified, with 736 upregulated and 818 downregulated in R cultivar (Table S2). KEGG pathway enrichment analysis revealed that DAMs were associated with tryptophan metabolism, pyrimidine metabolism, D-amino acid metabolism, and carotenoid biosynthesis across the three cultivars. In the R vs. G comparison, DAMs were primarily enriched in carbon metabolism, isoquinoline alkaloid biosynthesis, and nicotinate and nicotinamide metabolism. In G vs. Y, most DAMs were enriched in tyrosine metabolism, amino sugar and nucleotide sugar metabolism, and carotenoid biosynthesis. In R vs. Y, DAMs were mainly enriched in flavonoid biosynthesis and carotenoid biosynthesis (Figure 2E). These findings indicate that differential metabolite accumulation, particularly in flavonoid and carotenoid biosynthetic pathways, is associated with the observed variation in leaf coloration among the sweet potato cultivars. These metabolites likely represent downstream products whose accumulation patterns are influenced by upstream regulatory genes or pathways controlling pigment biosynthesis.

3.3. Transcriptome Sequencing and Gene Expression Profiles

The cDNA libraries of G, Y, and R cultivars were constructed using three biological replicates. A total of 370.32 million clean reads were generated and subsequently aligned to the reference genome for gene expression quantification. Approximately 94% of the reads were successfully mapped to the reference genome (Table S3). In total, 76,510 expressed genes were identified across the three cultivars (FPKM ≥ 1). The overall distributions of gene expression levels were similar among G, Y, and R cultivars, with lowly expressed genes (0 < FPKM ≤ 1 and 1 < FPKM ≤ 10) accounting for the largest proportion, whereas highly expressed genes (FPKM ≥ 100) accounted for the smallest proportion (Figure 3A).
A Venn diagram revealed that 37,282 genes were commonly expressed in all three cultivars, while 7073 genes were specifically expressed in G cultivar, 6630 in R cultivar, and 5773 in Y cultivar (Figure 3B). The DEGs among cultivars were defined by the criteria |log2 (fold change)| ≥ 1 and FPKM ≥ 10. Based on pairwise comparisons, a total of 2820 co-expression genes were identified (Figure S1), of which 4185 were upregulated and 5344 were downregulated in G vs. R, 4119 were upregulated and 4340 were downregulated in G vs. Y, and 5370 were upregulated and 4399 were downregulated in R vs. Y (Figure 3C).

3.4. DAMs and DEGs Were Enriched in Consistent Metabolic Pathways

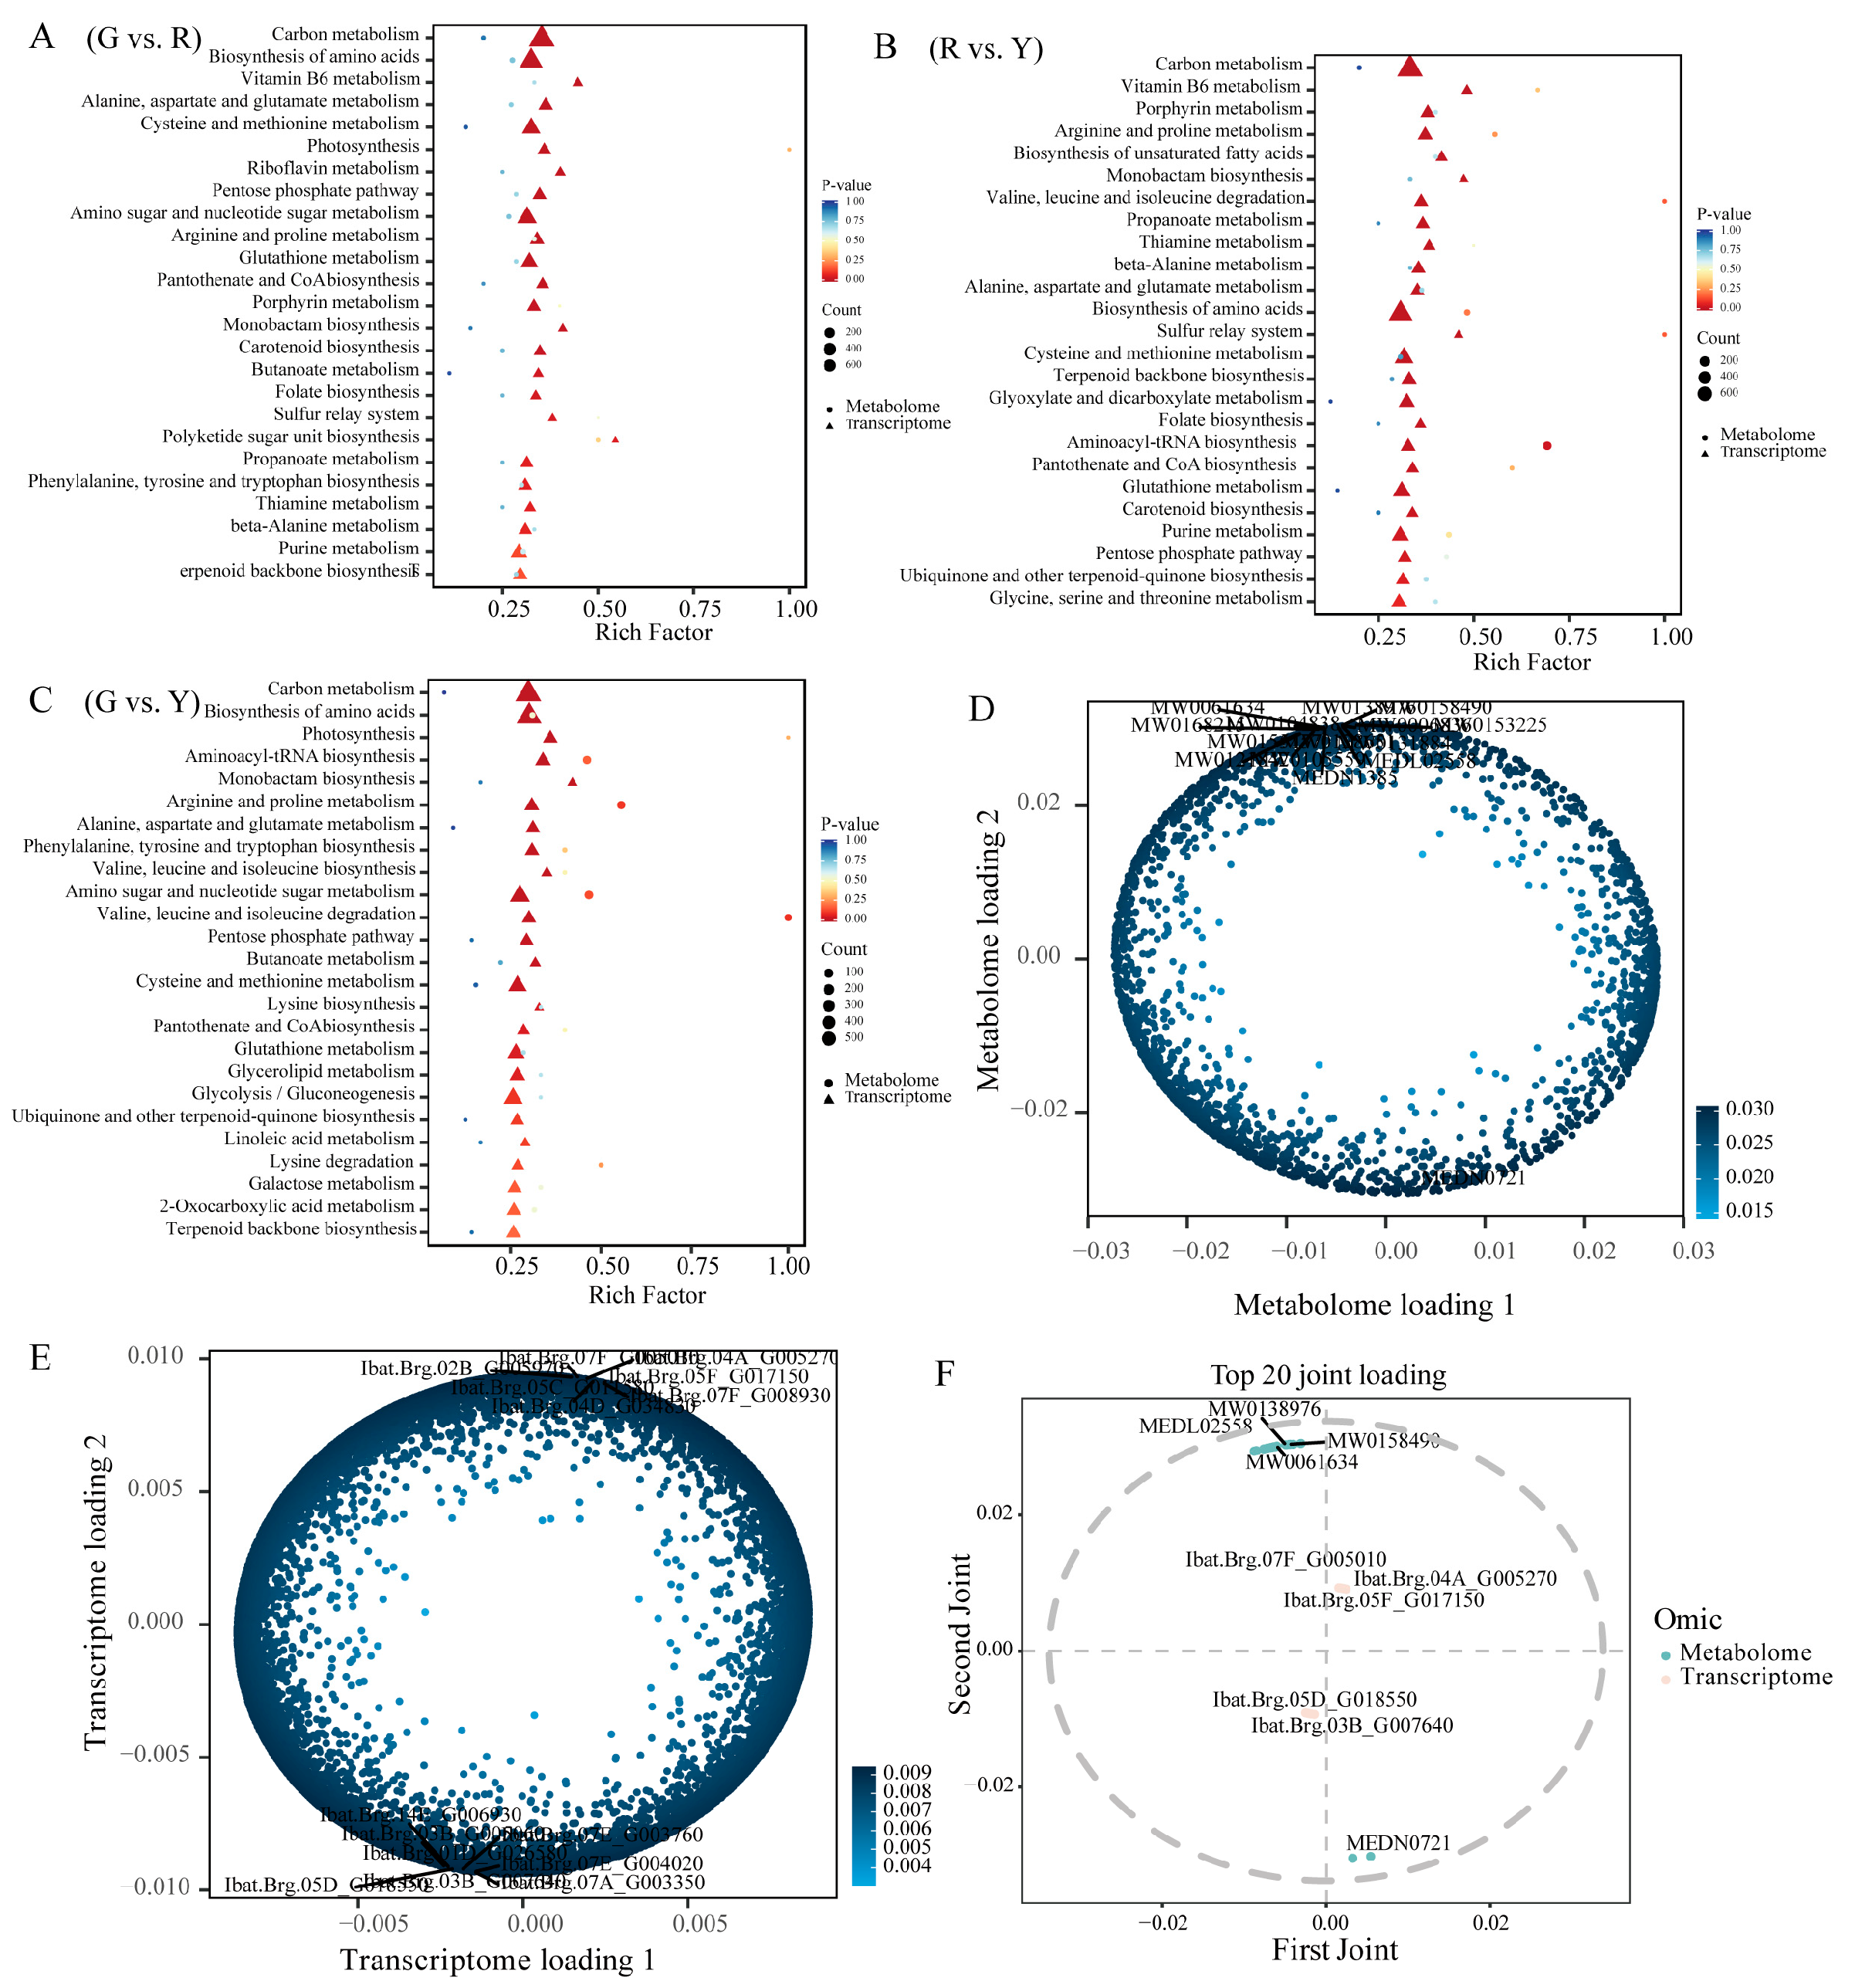
Based on the results of DAMs and DEGs, a conjoint analysis of the metabolome and transcriptome was performed to explore their relationships and regulatory mechanisms. The top 25 co-enriched KEGG pathways of DAMs and DEGs were identified. Carbon metabolism, biosynthesis of amino acids, and vitamin B6 metabolism were significantly enriched in multiple comparisons. In addition, carotenoid biosynthesis and porphyrin metabolism were co-enriched in the G vs. R and R vs. Y comparisons (Figure 4A,B). Furthermore, cysteine and methionine metabolism as well as amino sugar and nucleotide sugar metabolism were enriched in the G vs. Y comparison (Figure 4C). These results indicate that metabolic flux was coordinately altered along with leaf color variation, and that DAMs and DEGs involved in carotenoid biosynthesis and porphyrin metabolism play potentially important roles in sweet potato leaf color formation.
To further investigate associations between the transcriptome and metabolome, O2PLS models were constructed using all differential genes and metabolites. The analysis revealed several variables with significant correlations in the joint components of both omics datasets. The loadings of metabolome variables demonstrated that metabolites such as MW0138976 and MW0061634 were positioned at the outer edge of the plot, indicating strong contributions to the first two joint components and suggesting their potential importance in cross-omics regulation (Figure 4D). Similarly, the loadings of transcriptome variables showed that genes including Ibat.Brg.07F_G005010 and Ibat.Brg.04A_G005270 contributed substantially to the joint components, reflecting synergistic interactions with metabolome variables (Figure 4E). The top 20 joint component loading variables were further highlighted, revealing key contributors from both the metabolome and transcriptome. Notably, metabolites such as MW0138976 and MEDN02558 contributed significantly to both omics datasets, suggesting crucial roles in cross-omics regulation. In contrast, variables such as MEDN0721 exhibited negative contributions, implying potential inverse regulatory relationships between the metabolome and transcriptome (Figure 4F).

3.5. Expression Profiles of Chlorophyll, Flavonoid, and Carotenoid Pathway-Related Genes in Leafy Vegetable Sweet Potato

Based on the distinct leaf colors of the G, Y, and R cultivars, genes involved in the flavonoid, carotenoid, and chlorophyll biosynthetic pathways were identified and compared.
In the flavonoid biosynthesis pathway, 63 key genes were detected, including 11 CYP73A, 18 CHS, 10 CHI, 9 CYP75B, 6 F3H, 5 DFR, and 4 ANS genes. Structural genes such as CHS, CHI, CYP75B, F3H, DFR, and ANS were generally up-regulated in the R cultivar, while their expression levels were relatively low in G and Y cultivars (Figure 5A). This pattern corresponds with the higher anthocyanin accumulation in R cultivar, confirming the transcriptional control of flavonoid-based pigmentation.
In the carotenoid biosynthetic pathway, 57 DEGs were identified, including 8 PSY, 4 PDS, 4 Z-ISO, 4 ZDS, 4 CRTISO, 3 CRTL, 2 LCY, 5 CYP97A3, 4 CYP97C1, 5 CA2, 6 ZEP, 5 VDE, and 3 NSY genes. Although LCY and CYP97A3 were highly expressed in all three cultivars, their expression was slightly elevated in Y cultivar, consistent with the higher lutein content reported as a major carotenoid in sweet potato leaves [3]. Thus, while these genes are not unique predictors of Y cultivar, their higher activity may contribute to the enhanced carotenoid flux in the yellow cultivar (Figure 5B).
In the chlorophyll biosynthetic pathway, 73 key genes were identified, including 12 OVA3, 4 GSA, 7 CPX, 13 PPX, 15 CHL, 5 CHLM, 5 CRD, 4 DVR, 4 CHLG, and 4 CAO. Genes such as OVA3, PPX, CHLM, CRO, CHLG, and CAO were generally up-regulated in the R cultivar (Figure 5C). Although the expression differences in CHLG and CAO were not sufficient to fully distinguish between G and R cultivars, their higher activity in R cultivar is consistent with the greater total chlorophyll content, possibly reflecting post-transcriptional regulation or differences in chlorophyll degradation genes. Both CHLG and CAO play key roles in maintaining the chlorophyll a/b ratio, which influences leaf greenness intensity.
Collectively, these results indicate that flavonoid, carotenoid, and chlorophyll related genes exhibit coordinated but cultivar-specific expression patterns. While certain genes show broad expression across cultivars, the overall transcriptional trends are consistent with the metabolite profiles and observed leaf coloration.

3.6. Validation of the Transcriptome Data by qRT-PCR Analysis

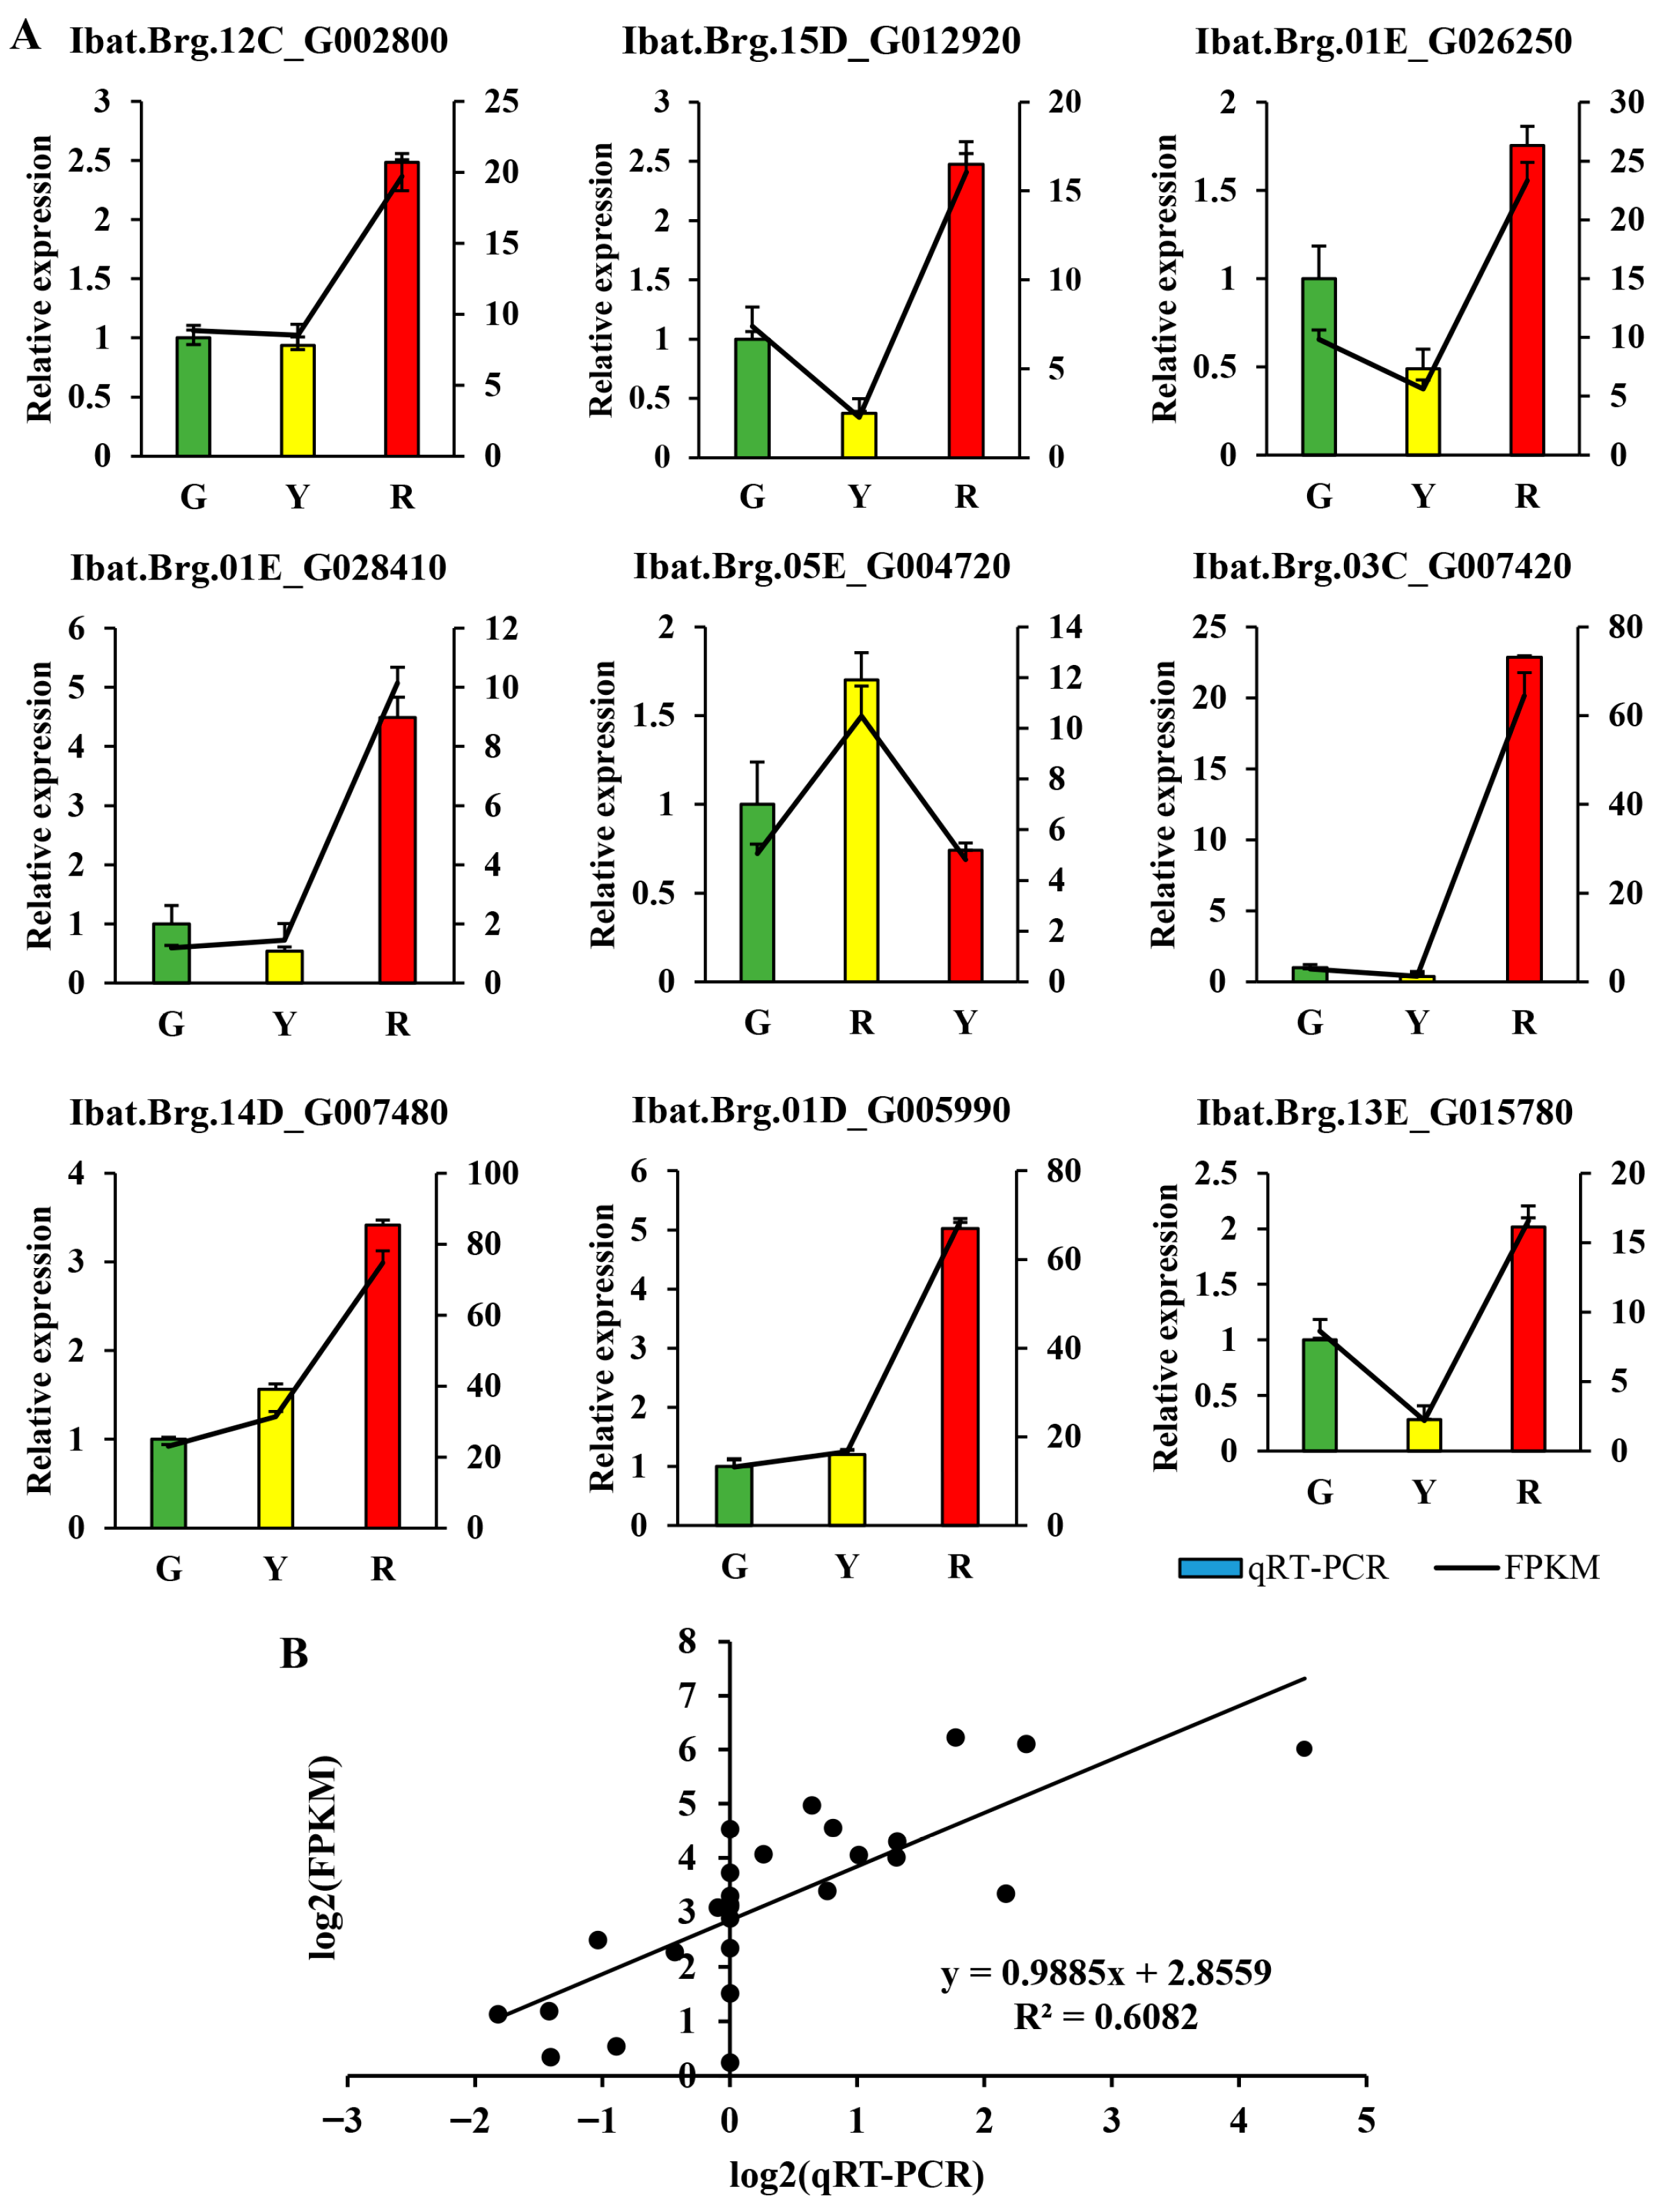
To validate the gene expression patterns obtained from RNA-Seq, three differentially expressed genes from each of the anthocyanin, carotenoid, and chlorophyll biosynthetic pathways were selected across the G, Y, and R cultivars for qRT-PCR analysis. The expression profiles determined by qRT-PCR were highly consistent with those obtained from RNA-Seq (Figure 6A). Some genes showed different trends, likely arising from methodological differences between qRT-PCR and RNA-seq. Nevertheless, the two datasets were overall in agreement, and correlation analysis yielded R2 = 0.6082 (Figure 6B), thereby supporting the accuracy and reliability of the transcriptome measurements and their suitability for downstream analyses.

4. Discussion

4.1. The Physiological Basis of Leaf Color Variation in Leafy Vegetable Sweet Potato

Leaf color variation is controlled by a complex network of physiological, biochemical, and molecular regulatory mechanisms. The physiological basis of leaf coloration is primarily attributed to changes in the content and relative proportions of leaf pigments, whereas alterations in leaf anatomical structure may also contribute to color expression [31,32]. In higher plants, three major classes of pigments are responsible for determining leaf color: chlorophylls (chlorophyll a and b), carotenoids (including carotenes and lutein), and anthocyanins [31,33]. Chlorophylls are the principal pigments conferring green coloration, carotenoids contribute yellow to orange hues, and anthocyanins account for red to purplish tones. The diversity of leaf coloration results from the dynamic balance among these pigments and their differential absorption and reflection of light at specific wavelengths [34].
In this study, by comparing G, Y, and R cultivars, it was demonstrated that leaf pigmentation is determined by differential accumulation and regulation of chlorophylls, carotenoids, and anthocyanins. The highest concentrations of both anthocyanins and chlorophylls were observed in the R cultivar (Table 1), whereas reduced chlorophyll together with a relatively higher carotenoid-to-chlorophyll ratio was observed in the Y cultivar (Figure 1). Exposure to continuous LED lighting led to increased chlorophyll a/b and carotenoid-to-chlorophyll ratios in both broccoli and radish, which consequently exhibited distinct leaf color phenotypes under these lighting conditions [35]. These findings indicate that color polymorphism is driven by complex metabolic trade-offs among multiple pigment pathways rather than by the dominance of a single pigment class.

4.2. Differential Pigment Regulatory Mechanisms in Y and R Cultivars

Distinct pigment balance features were observed in the Y cultivar. Although the absolute carotenoid content was found to be the lowest, the carotenoid-to-chlorophyll ratio was the highest (Table 1; Figure 1). It is therefore suggested that yellow coloration is caused by the proportional dominance of carotenoids resulting from chlorophyll degradation rather than from carotenoid overproduction. At the transcriptional level, LCY and CYP97A3 were found to be significantly upregulated (Figure 5B), indicating that lutein biosynthesis was enhanced. Meanwhile, the expression of the Ibat.Brg.08A_G010470 (SGR, stay-green) gene, which delays chlorophyll breakdown, is downregulated, whereas key chlorophyll catabolic genes such as Ibat.Brg.07F_G021070 (PAO, pheophorbide a oxygenase) are significantly upregulated, suggesting that chlorophyll breakdown was accelerated. These findings were further supported by KEGG pathway analysis (Figure 4C), in which carotenoid and porphyrin metabolism were identified as significantly enriched. Collectively, these observations indicate that the yellow phenotype is characterized by a dynamic metabolic equilibrium between pigment biosynthesis and degradation. Such a pattern has also been reported in cucumber and lettuce [36,37], in which chlorophyll catabolism and carotenoid accumulation were shown to be tightly coordinated to optimize light utilization and stress adaptation.
In the R cultivar, a synergistic interaction between chlorophyll and anthocyanins was evident, contributing to deep pigmentation. The simultaneous increase in both pigments is suggested to function as an optical filter effect of anthocyanins, by which excessive light stress and photooxidative damage are reduced, thereby allowing chlorophyll to be stabilized and photosynthetic efficiency to be maintained [38,39]. Transcriptomic data confirmed that CHS, CHI, F3H, and DFR, key genes in the anthocyanin biosynthetic pathway-were significantly upregulated, indicating that flavonoid metabolism was transcriptionally activated (Figure 5A). Moreover, KEGG enrichment analysis showed that anthocyanin and chlorophyll metabolism were co-enriched (Figure 4A), suggesting cross-pathway regulation. Unlike many purple-leaf species such as Brassica oleracea and Acer griseum, in which anthocyanin accumulation is often coupled with chlorophyll loss [12,40], co-accumulation of both pigments appears to be supported in leafy vegetable sweet potato, possibly as an adaptive mechanism by which photoprotection and stress tolerance are enhanced.

4.3. Integrated Transcriptome-Metabolome Regulation of Leafy Vegetable Sweet Potato Leaf Pigmentation

The integration of transcriptomic and metabolomic datasets provided a systems-level perspective of pigment regulation. O2PLS modeling (Figure 4) identified strong correlations between DEGs and DAMs, especially within flavonoid, chlorophyll, and carotenoid pathways. Metabolomic clustering (Figure 2) distinctly separated the three cultivars, while transcriptomic analysis (Figure 3) identified a large number of differentially expressed genes involved in pigment-related metabolic pathways. The combined data suggest a hierarchical regulatory model in which CHS, DFR, ANS activation enhances anthocyanin biosynthesis in the R cultivar, CHLG and CAO promote chlorophyll accumulation, and LCY/CYP97A3 drive carotenoid enrichment in the Y cultivar. This multi-omics integration emphasizes that leaf color formation arises from transcriptional coordination and metabolic cross-talk among pigment pathways. Similarly, comparable transcriptome-metabolome studies in brassica [40], grapevine [41], and sweet potato [42] have similarly revealed the interconnected regulation of pigment pathways under developmental or stress cues. Such cross-omic patterns are consistent with the shared transcriptional networks and feedback loops controlling pigment flux.
Although the integrative omics approach has effectively revealed potential associations between pigment content and gene expression, further functional validation is required to confirm the specific regulatory roles of key candidate genes such as CHS, CAO, and CYP97A3. Future studies should employ gene overexpression, gene silencing, or CRISPR/Cas9-based genome editing to elucidate the causal relationships between these genes and pigment accumulation. Moreover, since environmental factors such as light intensity [43,44], temperature [45], and nutrient availability have pronounced effects on pigment metabolism, comprehensive consideration of these variables in future experiments will be essential.

5. Conclusions

In this study, physiological, transcriptomic, and metabolomic analyses were conducted on the G, Y, and R sweet potato cultivars to elucidate the molecular basis of leaf color variation. The R cultivar exhibited the highest levels of both chlorophyll and anthocyanins, while the Y cultivar displayed the lowest carotenoid content but the highest carotenoid-to-chlorophyll ratio. A total of 3943 metabolites were identified, including 132 flavonoids, 115 terpenoids, and 10 pyridine alkaloids.
Integrative analysis of the transcriptome and metabolome revealed that the flavonoid, carotenoid, and chlorophyll biosynthetic pathways were the dominant pathways contributing to the distinct pigmentation patterns. The expression of anthocyanin and chlorophyll related genes (CHS, CHI, F3H, CHLG, and CAO) in the R cultivar was positively correlated with the accumulation of corresponding metabolites. In contrast, carotenoid biosynthetic genes (LCY, CYP97A3) were highly expressed in the Y cultivar, consistent with its carotenoid profile.
Collectively, these findings demonstrate a strong correspondence between gene expression and metabolite accumulation in pigment biosynthesis. The integrative multi-omics approach provides new insights into the regulatory networks governing leaf coloration and offers valuable targets for genetic improvement in leafy vegetable sweet potato.

Supplementary Materials

The following supporting information can be downloaded at https://www.mdpi.com/article/10.3390/horticulturae11111317/s1, Figure S1: Venn analysis of different expression genes; Table S1: The primers of qRT-PCR; Table S2: Differential metabolites between G, Y, and R cultivars; Table S3: Statistical analyses of sequencing and mapping results of libraries of G, Y and R cultivars.

Author Contributions

Writing—original draft, S.W., M.C. and Q.Z.; Writing—review and editing, S.W., Y.H. and W.Z.; Conceptualization, S.W. and M.C.; Data curation, S.W., Q.Z. and W.Z.; Methodology, Q.Z. and W.Z.; Formal analysis, M.C., Y.H. and M.C.; Funding acquisition, Y.H. and W.Z.; Project administration, Y.H. and W.Z.; Resources, W.Z. All authors have read and agreed to the published version of the manuscript.

Funding

This research was funded by the earmarked fund for Jiangxi Agriculture Research System-upland food (No. JXARS-02).

Data Availability Statement

Data supporting the findings of this work were available within the paper and its Supplementary Information Files. All raw sequence reads data were uploaded in the national genomics data center (https://ngdc.cncb.ac.cn/, accessed on 15 September 2025), with the accession number subPRO067986.

Conflicts of Interest

The authors declare no conflicts of interest.

References

  1. Tang, C.; Ameen, A.; Fang, B.; Liao, M.; Chen, J.; Huang, L.; Zou, H.; Wang, Z. Nutritional composition and health benefits of leaf-vegetable sweet potato in south china. J. Food Compos. Anal. 2021, 96, 103714. [Google Scholar] [CrossRef]
  2. Sun, H.; Mu, T.; Xi, L.; Zhang, M.; Chen, J. Sweet potato (Ipomoea batatas L.) Leaves as nutritional and functional foods. Food Chem. 2014, 156, 380–389. [Google Scholar] [CrossRef]
  3. Li, M.; Jang, G.Y.; Lee, S.H.; Kim, M.Y.; Hwang, S.G.; Sin, H.M.; Kim, H.S.; Lee, J.; Jeong, H.S. Comparison of functional components in various sweet potato leaves and stalks. Food Sci. Biotechnol. 2017, 26, 97–103. [Google Scholar] [CrossRef]
  4. Chen, S.P.; Wang, S.Y.; Huang, M.Y.; Lin, K.H.; Hua, S.M.; Lu, H.H.; Lai, Y.C.; Yang, C.M. Physiological and molecular analyses of chlorophyllase in sweet potatoes with different-colored leaves. S. Afr. J. Bot. 2018, 114, 272–279. [Google Scholar] [CrossRef]
  5. Shen, J.; Zou, Z.; Zhang, X.; Zhou, L.; Wang, Y.; Fang, W.; Zhu, X. Metabolic analyses reveal different mechanisms of leaf color change in two purple-leaf tea plant (Camellia sinensis L.) Cultivars. Hortic. Res. 2018, 5, 7. [Google Scholar] [CrossRef]
  6. Mattioli, R.; Francioso, A.; Mosca, L.; Silva, P. Anthocyanins: A comprehensive review of their chemical properties and health effects on cardiovascular and neurodegenerative diseases. Molecules 2020, 25, 3809. [Google Scholar] [CrossRef]
  7. Gude, K.; Talavera, M.; Sasse, A.M.; Rivard, C.L.; Pliakoni, E. Effect of light characteristics on the sensory properties of red lettuce (Lactuca sativa). Foods 2021, 10, 2660. [Google Scholar] [CrossRef]
  8. Sun, T.; Rao, S.; Zhou, X.; Li, L. Plant carotenoids: Recent advances and future perspectives. Mol. Hortic. 2022, 2, 3. [Google Scholar] [CrossRef] [PubMed]
  9. Liu, Y.; Qi, Y.; Chen, X.; He, H.; Liu, Z.; Zhang, Z.; Ren, Y.; Ren, X. Phenolic compounds and antioxidant activity in red-and in green-fleshed kiwifruits. Food Res. Int. 2019, 116, 291–301. [Google Scholar] [CrossRef] [PubMed]
  10. Jiao, B.; Meng, Q.; Lv, W. Roles of stay-green (SGR) homologs during chlorophyll degradation in green plants. Bot. Stud. 2020, 61, 25. [Google Scholar] [CrossRef] [PubMed]
  11. Zou, S.; Zhuo, M.; Abbas, F.; Hu, G.; Wang, H.; Huang, X. Transcription factor lcnac002 coregulates chlorophyll degradation and anthocyanin biosynthesis in litchi. Plant Physiol. 2023, 192, 1913–1927. [Google Scholar] [CrossRef] [PubMed]
  12. Fan, H.; Liao, H.; Shen, Y.; Sani, M.N.H.; Yong, J.W.H.; Song, J. Unravelling the physiological and molecular mechanisms of leaf color change in acer griseum through multi-omics analysis. Plant Physiol. Biochem. 2024, 216, 109198. [Google Scholar] [CrossRef]
  13. Li, Y.; Cao, T.; Guo, Y.; Grimm, B.; Li, X.; Duanmu, D.; Lin, R. Regulatory and retrograde signaling networks in the chlorophyll biosynthetic pathway. J. Integr. Plant Biol. 2025, 67, 887–911. [Google Scholar] [CrossRef] [PubMed]
  14. Nisar, N.; Li, L.; Lu, S.; Khin, N.C.; Pogson, B.J. Carotenoid metabolism in plants. Mol. Plant. 2015, 8, 68–82. [Google Scholar] [CrossRef]
  15. Sharma, H.; Sharma, P.; Kumar, A.; Chawla, N.; Dhatt, A.S. Multifaceted regulation of anthocyanin biosynthesis in plants: A comprehensive review. J. Plant Growth Regul. 2024, 43, 3048–3062. [Google Scholar] [CrossRef]
  16. Tan, W.; Guo, X.; Wang, Z.; Zhang, R.; Tang, C.; Jiang, B.; Jia, R.; Deng, Y.; Yang, S.; Chen, J. Metabolic profiles and morphological characteristics of leaf tips among different sweet potato (Ipomoea batatas Lam.) Varieties. J. Integr. Agric. 2024, 23, 494–510. [Google Scholar] [CrossRef]
  17. Deng, J.; Wu, D.; Shi, J.; Balfour, K.; Wang, H.; Zhu, G.; Liu, Y.; Wang, J.; Zhu, Z. Multiple myb activators and repressors collaboratively regulate the juvenile red fading in leaves of sweetpotato. Front. Plant Sci. 2020, 11, 941. [Google Scholar] [CrossRef]
  18. Jing, X.; Chen, P.; Jin, X.; Lei, J.; Wang, L.; Chai, S.; Yang, X. Physiological, photosynthetic, and transcriptomics insights into the influence of shading on leafy sweet potato. Genes 2023, 14, 2112. [Google Scholar] [CrossRef] [PubMed]
  19. Drapal, M.; Rossel, G.; Heider, B.; Fraser, P.D. Metabolic diversity in sweet potato (Ipomoea batatas, Lam.) Leaves and storage roots. Hortic. Res. 2019, 6, 2. [Google Scholar] [CrossRef]
  20. Shi, J.; Wu, Q.; Deng, J.; Balfour, K.; Chen, Z.; Liu, Y.; Kumar, S.; Chen, Y.; Zhu, Z.; Zhu, G. Metabolic profiling and antioxidant analysis for the juvenile red fading leaves of sweetpotato. Plants 2022, 11, 3014. [Google Scholar] [CrossRef]
  21. Zhang, R.; Li, M.; Tang, C.; Jiang, B.; Yao, Z.; Mo, X.; Wang, Z. Combining metabolomics and transcriptomics to reveal the mechanism of coloration in purple and cream mutant of sweet potato (Ipomoea batatas L.). Front. Plant Sci. 2022, 13, 877695. [Google Scholar] [CrossRef]
  22. Porra, R.J. The chequered history of the development and use of simultaneous equations for the accurate determination of chlorophylls a and b. Photosynth. Res. 2002, 73, 149–156. [Google Scholar] [CrossRef]
  23. Lichtenthaler, H.; Babani, F. Contents of photosynthetic pigments and ratios of chlorophyll a/b and chlorophylls to carotenoids (a+b)/(x+c) in c4 plants as compared to c3 plants. Photosynthetica 2022, 60, 3–9. [Google Scholar] [CrossRef]
  24. Jia, R.; Tang, C.; Chen, J.; Zhang, X.; Wang, Z. Total phenolics and anthocyanins contents and antioxidant activity in four different aerial parts of leafy sweet potato (Ipomoea batatas L.). Molecules 2022, 27, 3117. [Google Scholar] [CrossRef]
  25. Kim, D.; Paggi, J.M.; Park, C.; Bennett, C.; Salzberg, S.L. Graph-based genome alignment and genotyping with hisat2 and hisat-genotype. Nat. Biotechnol. 2019, 37, 907–915. [Google Scholar] [CrossRef]
  26. Liao, Y.; Smyth, G.K.; Shi, W. Featurecounts: An efficient general purpose program for assigning sequence reads to genomic features. Bioinformatics 2014, 30, 923–930. [Google Scholar] [CrossRef]
  27. Love, M.I.; Huber, W.; Anders, S. Moderated estimation of fold change and dispersion for rna-seq data with deseq2. Genome Biol. 2014, 15, 550. [Google Scholar] [CrossRef] [PubMed]
  28. Kanehisa, M. Kegg: Kyoto encyclopedia of genes and genomes. Nucleic. Acids. Res. 2000, 28, 27–30. [Google Scholar] [CrossRef] [PubMed]
  29. Ashburner, M.; Ball, C.A.; Blake, J.A.; Botstein, D.; Butler, H.; Cherry, J.M.; Davis, A.P.; Dolinski, K.; Dwight, S.S.; Eppig, J.T.; et al. Gene ontology: Tool for the unification of biology. Nat. Genet. 2000, 25, 25–29. [Google Scholar] [CrossRef] [PubMed]
  30. Trygg, J.; Wold, S. O2-PLS, a two-block (x − y) latent variable regression (LVR) method with an integral osc filter. J. Chemom. 2003, 17, 53–64. [Google Scholar] [CrossRef]
  31. Zhao, M.; Li, X.; Zhang, X.; Zhang, H.; Zhao, X. Mutation mechanism of leaf color in plants: A review. Forests 2020, 11, 851. [Google Scholar] [CrossRef]
  32. Gan, Y.; Kou, Y.; Yan, F.; Wang, X.; Wang, H.; Song, X.; Zhang, M.; Zhao, X.; Jia, R.; Ge, H.; et al. Comparative transcriptome profiling analysis reveals the adaptive molecular mechanism of yellow-green leaf in rosa beggeriana ‘aurea’. Front. Plant Sci. 2022, 13, 845662. [Google Scholar] [CrossRef]
  33. Tanaka, Y.; Sasaki, N.; Ohmiya, A. Biosynthesis of plant pigments: Anthocyanins, betalains and carotenoids. Plant J. 2008, 54, 733–749. [Google Scholar] [CrossRef] [PubMed]
  34. Huo, J.; Zhang, N.; Gong, Y.; Bao, Y.; Li, Y.; Zhang, L.; Nie, S. Effects of different light intensity on leaf color changes in a chinese cabbage yellow cotyledon mutant. Front. Plant Sci. 2024, 15, 1371451. [Google Scholar] [CrossRef]
  35. Shibaeva, T.G.; Sherudilo, E.G.; Rubaeva, A.A.; Titov, A.F. Continuous led lighting enhances yield and nutritional value of four genotypes of brassicaceae microgreens. Plants 2022, 11, 176. [Google Scholar] [CrossRef] [PubMed]
  36. Barickman, T.C.; Simpson, C.R.; Sams, C.E. Waterlogging causes early modification in the physiological performance, carotenoids, chlorophylls, proline, and soluble sugars of cucumber plants. Plants 2019, 8, 160. [Google Scholar] [CrossRef]
  37. Brychkova, G.; de Oliveira, C.L.; Gomes, L.A.A.; de Souza Gomes, M.; Fort, A.; Esteves-Ferreira, A.A.; Sulpice, R.; Mckeown, P.C.; Spillane, C. Regulation of carotenoid biosynthesis and degradation in lettuce (Lactuca sativa L.) From seedlings to harvest. Int. J. Mol. Sci. 2023, 24, 10310. [Google Scholar] [CrossRef]
  38. Xu, Z.; Rothstein, S.J. Ros-induced anthocyanin production provides feedback protection by scavenging ros and maintaining photosynthetic capacity in arabidopsis. Plant Signal. Behav. 2018, 13, e1451708. [Google Scholar] [CrossRef]
  39. Agati, G.; Guidi, L.; Landi, M.; Tattini, M. Anthocyanins in photoprotection: Knowing the actors in play to solve this complex ecophysiological issue. New Phytol. 2021, 232, 2228–2235. [Google Scholar] [CrossRef]
  40. Liu, X.; Zhang, B.; Wu, J.; Li, Z.; Han, F.; Fang, Z.; Yang, L.; Zhuang, M.; Lv, H.; Liu, Y.; et al. Pigment variation and transcriptional response of the pigment synthesis pathway in the s2309 triple-color ornamental kale (Brassica oleracea L. Var. Acephala) line. Genomics 2020, 112, 2658–2665. [Google Scholar] [CrossRef]
  41. Tavernier, F.; Savoi, S.; Torregrosa, L.; Hugueney, P.; Baltenweck, R.; Segura, V.; Romieu, C. The single-berry metabolomic clock paradigm reveals new stages and metabolic switches during grapevine berry development. J. Exp. Bot. 2025, 76, 3125–3140. [Google Scholar] [CrossRef]
  42. Ahmed, S.; Khan, M.S.S.; Xue, S.; Islam, F.; Ikram, A.U.; Abdullah, M.; Liu, S.; Tappiban, P.; Chen, J. A comprehensive overview of omics-based approaches to enhance biotic and abiotic stress tolerance in sweet potato. Hortic. Res. 2024, 11, uhae14. [Google Scholar] [CrossRef] [PubMed]
  43. Tian, Y.; Wang, H.; Zhang, Z.; Zhao, X.; Wang, Y.; Zhang, L. An rna-seq analysis reveals differential transcriptional responses to different light qualities in leaf color of Camellia sinensis cv. Huangjinya. J. Plant Growth Regul. 2022, 41, 612–627. [Google Scholar] [CrossRef]
  44. Wada, K.C.; Inagaki, N.; Sakai, H.; Yamashita, H.; Nakai, Y.; Fujimoto, Z.; Yonemaru, J.I.; Itoh, H. Genetic effects of red lettuce leaf genes on red coloration in leaf lettuce under artificial lighting conditions. Plant-Environ. Interact. 2022, 3, 179–192. [Google Scholar] [CrossRef] [PubMed]
  45. Renner, S.S.; Zohner, C.M. The occurrence of red and yellow autumn leaves explained by regional differences in insolation and temperature. New Phytol. 2019, 224, 1464–1471. [Google Scholar] [CrossRef]
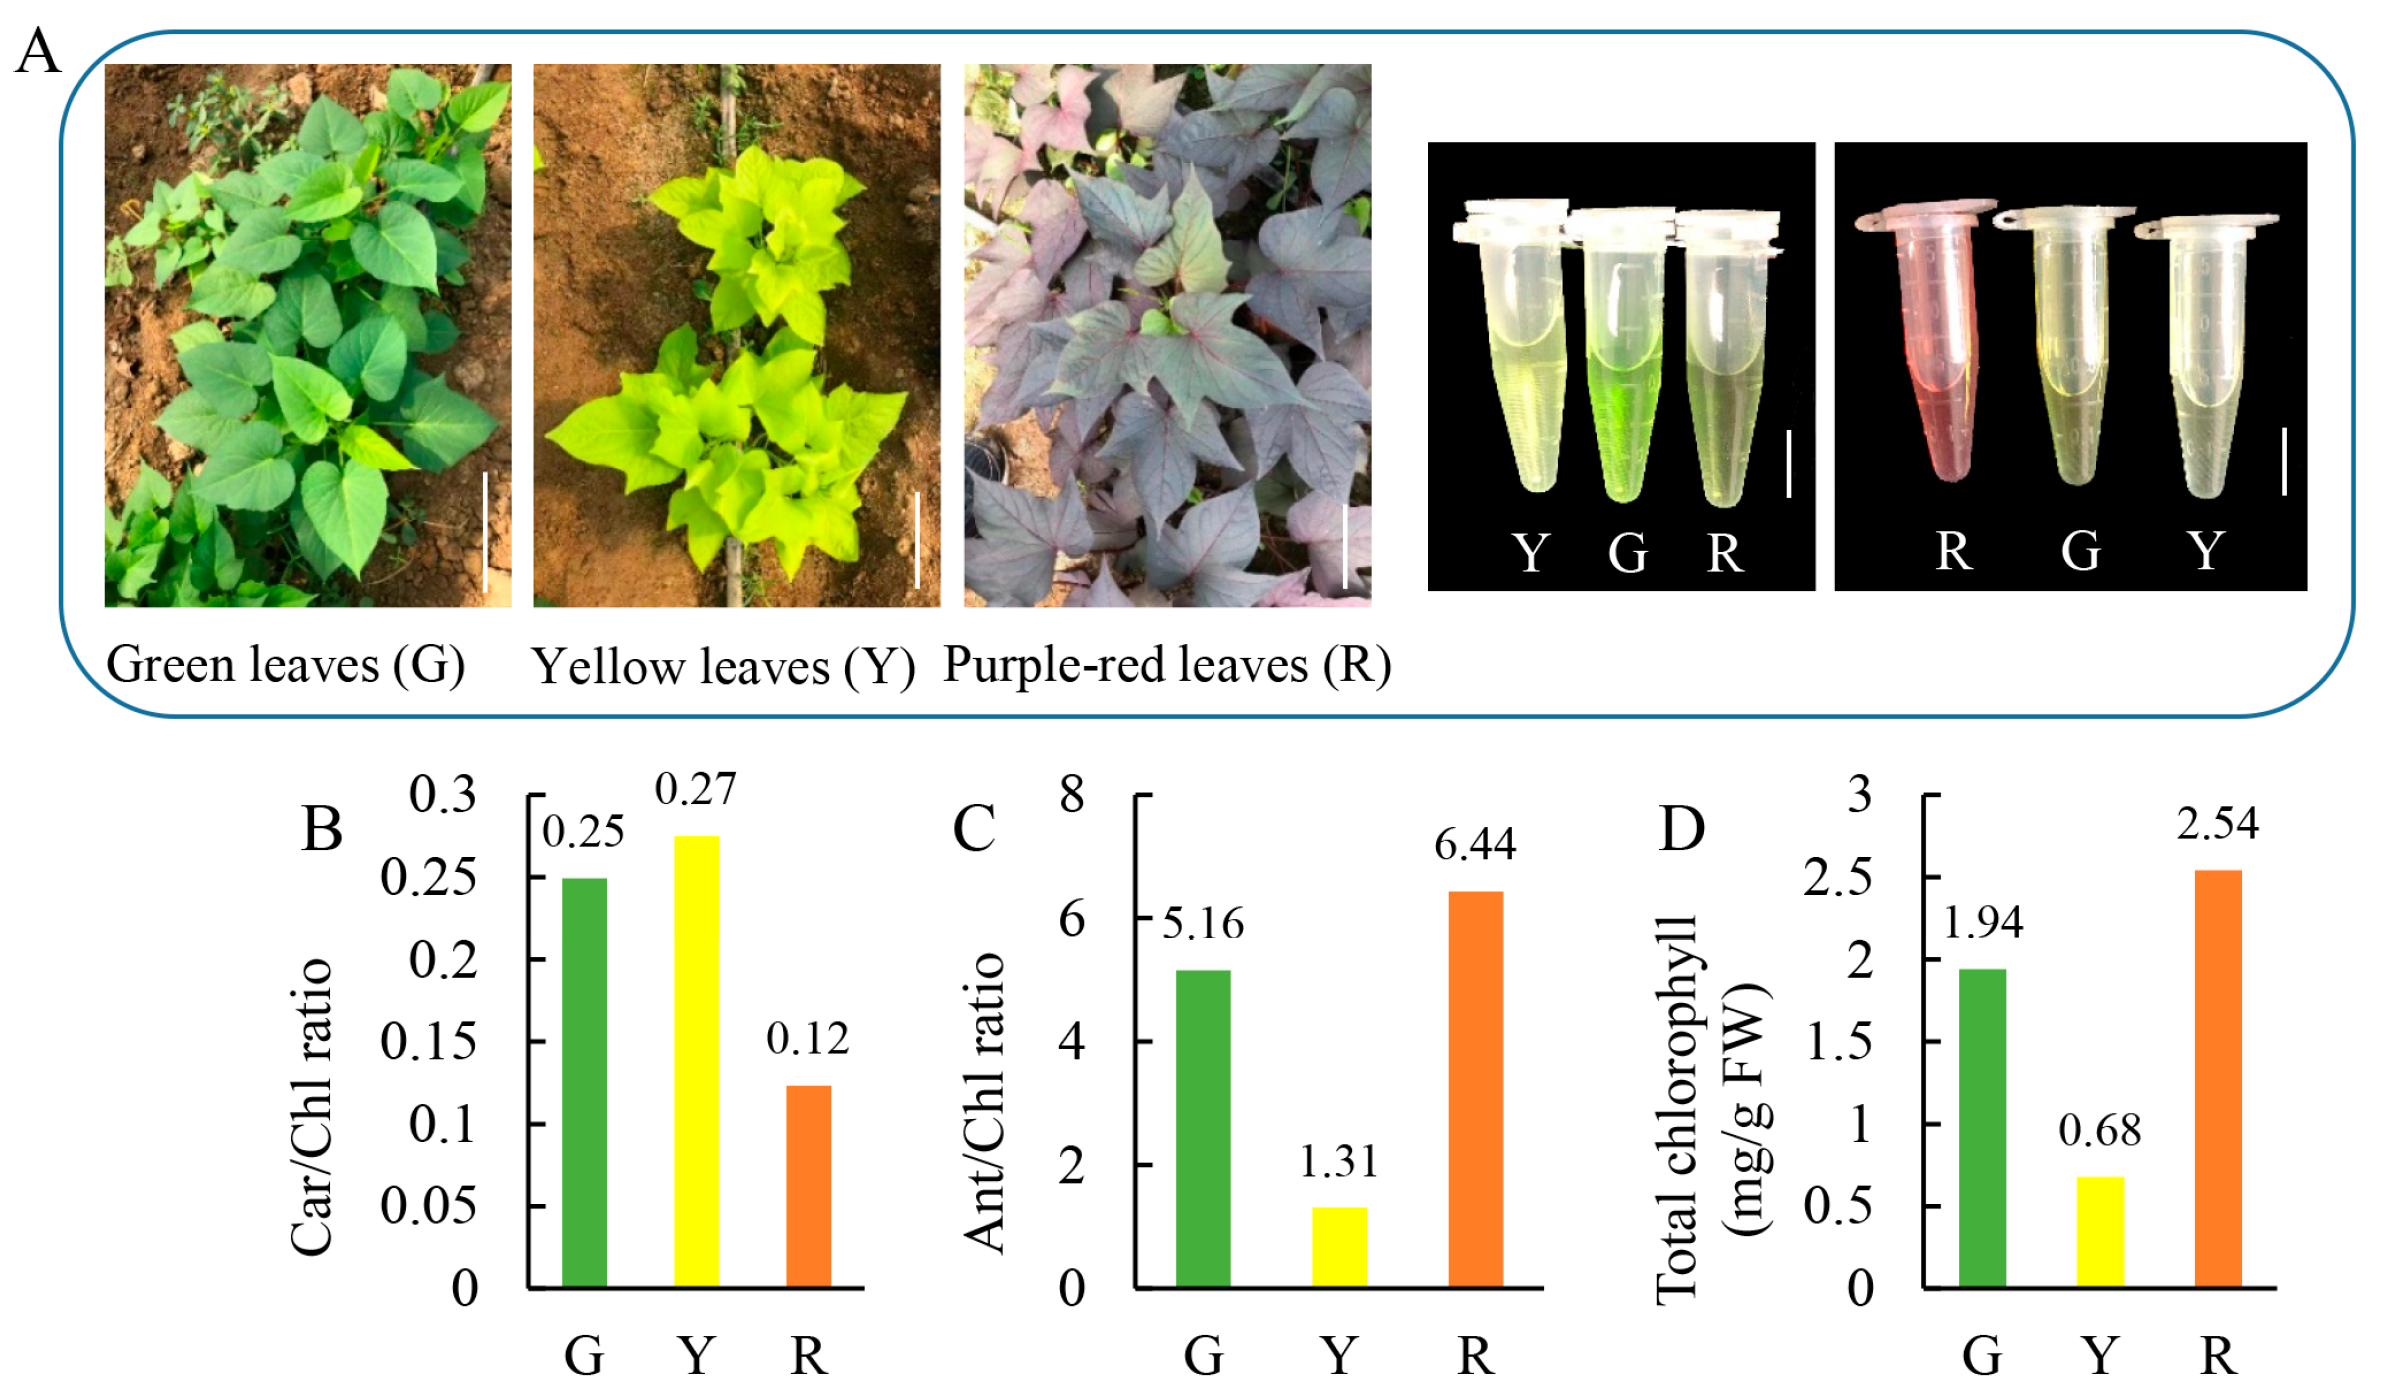
Figure 1. Leaf phenotypes and pigment composition in G, Y and R cultivars. (A) The leaf phenotypes of three cultivars, bar = 8 cm. The right-hand centrifuge tubes illustrate pigment composition in three cultivars, extracts of chlorophylls and carotenoids from leaves (Left), extracts of anthocyanin from leaves (Right), bars = 1 cm. (B) Ratio of carotenoids to chlorophyll (Car/Chl) in the leaves of three cultivars. (C) Ratio of anthocyanins to chlorophyll (Ant/Chl) in the leaves of three cultivars. (D) Total chlorophyll content (mg·g−1 FW) in the leaves of three cultivars.
Horticulturae 11 01317 g001
Figure 2. Metabolomic profiling and differential pathway analysis among G, Y and R cultivars. (A) Heatmap of DAMs across the three cultivars, the color scale represents Z-scores normalized for each metabolite. (B) PCA score plot showing the separation of metabolite profiles among three cultivars, with quality control (QC) samples tightly clustered. (C) Venn diagram illustrating the number of unique and shared DAMs in pairwise comparisons (G vs. R, G vs. Y, and R vs. Y). (D) Numbers of upregulated and downregulated DAMs identified in each comparison group. (E) KEGG pathway enrichment bubble plot of DAMs, the size of each bubble represents the Count, the number of DAMs enriched in the corresponding pathway, while the color gradient indicates the p-value, reflecting the statistical significance of the enrichment, highlighting significantly enriched metabolic pathways, including flavonoid and carotenoid biosynthesis.
Horticulturae 11 01317 g002
Figure 3. Transcriptomic analysis and DEGs among G, Y and R cultivars. (A) Expression level distribution of genes in different cultivars, shown as the percentage of transcripts with FPKM in four categories (0 ≤ FPKM < 1, 1 ≤ FPKM < 10, 10 ≤ FPKM < 100, and FPKM ≥ 100). (B) Venn diagram displaying the overlap of expressed genes among the three cultivars, with the central region representing co-expression genes. (C) Volcano plots showing the numbers of upregulated and downregulated DEGs in pairwise comparisons (G vs. R, G vs. Y, and R vs. Y).
Horticulturae 11 01317 g003
Figure 4. Integrated transcriptomic and metabolomic analysis of G, Y and R cultivars. (AC) KEGG pathway enrichment bubble plots of DEGs and DAMs in pairwise comparisons: (A) G vs. R, (B) R vs. Y, (C) G vs. Y. The x-axis represents rich factor; bubble size and color indicate the number of features and significance (p-value). Circles denote metabolome and triangles denote transcriptome. (D) Metabolome loading plot, where each point represents a metabolite; the x- and y-axes denote the first and second metabolomic loading components, respectively. (E) Transcriptome loading plot, where each point represents a transcript; the axes indicate the first and second transcriptomic loading components. (F) Joint O2PLS loading plot integrating both datasets. Circles represent metabolites and triangles represent transcripts. The top 20 features with the highest joint loadings are labeled, highlighting the major metabolites and genes contributing to cultivar differentiation. The genes and metabolites highlighted in panels (DF) were selected based on their biological relevance to pigment biosynthetic pathways and significant correlation coefficients identified from the integrative analysis.
Horticulturae 11 01317 g004
Figure 5. Expression profiles of key genes involved in pigment biosynthesis pathways in G, Y and R cultivars. (A) Flavonoid biosynthesis pathway and heatmap of related gene expression levels. (B) Carotenoid biosynthesis pathway and heatmap of related gene expression levels. (C) Chlorophyll biosynthesis pathway and heatmap of related gene expression levels. Gene expression levels are shown as FPKM values, with the color scale indicating relative expression.
Horticulturae 11 01317 g005
Figure 6. Validation of transcriptome data by qRT-PCR analysis. (A) Relative expression levels of nine representative genes (Ibat.Brg.12C_G002800, Ibat.Brg.15D_G012920, Ibat.Brg.01E_G026250, Ibat.Brg.01E_G028410, Ibat.Brg.05E_G004720, Ibat.Brg.03C_G007420, Ibat.Brg.14D_G007480, Ibat.Brg.01D_G005990, and Ibat.Brg.13E_G015780) were compared among G, Y and R cultivars. qRT-PCR results were consistent with FPKM values, confirming the reliability of transcriptomic data. The blue boxed bar chart in the lower-right panel represents the qRT-PCR assay, and the black line indicates FPKM. (B) Correlation analysis of the gene expression ratios between qRT-PCR and FPKM.
Horticulturae 11 01317 g006
Table 1. Comparative analysis of pigment contents in G, Y and R cultivars.
Chlorophyll a
(mg·g−1 FW)
Chlorophyll b
(mg·g−1 FW)
Carotenoid
(mg·g−1 FW)
Anthocyanin
(mg·g−1 FW)
G1.50 ± 0.13a0.44 ± 0.04b0.48 ± 0.03a10.02 ± 0.19b
Y0.57 ± 0.07b0.11 ± 0.01c0.19 ± 0.03c0.89 ± 0.64c
R1.51 ± 0.13b1.03 ± 0.07a0.31 ± 0.02b16.36 ± 0.67a
Data are expressed as mean ± standard deviation (SD), and different letters indicate significant differences among groups (p < 0.05) according to one-way ANOVA followed by Duncan’s multiple range test.
Disclaimer/Publisher’s Note: The statements, opinions and data contained in all publications are solely those of the individual author(s) and contributor(s) and not of MDPI and/or the editor(s). MDPI and/or the editor(s) disclaim responsibility for any injury to people or property resulting from any ideas, methods, instructions or products referred to in the content.