Article

Suspension Culture Optimization and Transcriptome-Guided Identification of Candidate Regulators for Militarine Biosynthesis in Bletilla striata

1
Department of Medical Instrumental Analysis, School of Preclinical Medicine, Zunyi Medical University, Zunyi 563099, China
2
Basic Medical Sciences Center for Integrated Research and Practical Innovation, School of Preclinical Medicine, Zunyi Medical University, Zunyi 563099, China
3
Department of Cell Biology, School of Preclinical Medicine, Zunyi Medical University, Zunyi 563099, China
*
Author to whom correspondence should be addressed.
These authors contributed equally to this work.
Horticulturae 2025, 11(11), 1315; https://doi.org/10.3390/horticulturae11111315
Submission received: 1 October 2025 / Revised: 23 October 2025 / Accepted: 28 October 2025 / Published: 2 November 2025

Abstract

Background: Bletilla striata is a medicinal orchid, whose bioactive constituent militarine has therapeutic interest but limited natural availability. Suspension culture coupled with transcriptomics offers a scalable production route and a means to uncover biosynthetic regulators. Methods: Four B. striata landraces were evaluated. Single-factor experiments and response surface methodology optimized sucrose, NH4NO3, and agitation to maximize biomass and militarine yield. Militarine and four related metabolites were quantified by HPLC-UV. For transcriptomics, RNA from high- and low-producing landraces was sequenced on Illumina HiSeq, assembled de novo, and analyzed with RSEM (FPKM) and DESeq2 to identify DEGs. Results: The landrace SMPF-NL achieved the highest militarine yield (33.06 mg/g) under optimized conditions (sucrose, 35 g/L; NH4NO3, 625 mg/L; agitation, 135 rpm; and half-strength MS medium with 1.0 mg/L of 6-BA, 3.0 mg/L of 2,4-D, and 0.5 mg/L of NAA). Transcriptomic profiling highlighted candidate biosynthetic and regulatory genes, including SuSy2, SUS, ALDO, AOC3, Comt, GOT2, MAOB, BGLU20, and BGLU22. Conclusions: We present an optimized suspension culture system and transcriptomic leads that lay the groundwork for the functional validation and scale-up of controlled militarine production.

1. Introduction

Bletilla striata (Thunb.) Reichb.f is a perennial terrestrial orchid widely used in traditional Asian medicine for its hemostatic, wound-healing, and neuroprotective properties [1,2,3]. Militarine, an ester glycoside derived from phenylpropanoid and amino acid metabolism, has been identified as a major bioactive constituent with potential neuroprotective activities and other pharmacological effects [2,4]. Wild B. striata resources are constrained by habitat loss and germplasm heterogeneity, leading to supply shortages and variable quality of militarine-containing products. To exploit the natural genetic diversity of B. striata for trait improvement, we screened multiple landraces to identify high-yielding genotypes for our culture system. In vitro culture approaches (notably, cell suspension cultures) can provide controlled, year-round production and are amenable to scale-up and metabolic engineering [5].
To overcome the scarcity of high-quality raw material and the inherent variability in wild or field-grown stocks, plant cell suspension cultures have emerged as a promising alternative for the controlled, scalable production of secondary metabolites [6,7,8]. Compared to traditional extraction from whole plants, a suspension culture can markedly enhance both the production rate and yield of these compounds [8]. For example, previous studies have successfully employed suspension cell culture systems to substantially enhance the production of various secondary metabolites in species such as Catharanthus roseus [9], Buddleja cordata [10], and Sageretia thea [11]. By optimizing the medium composition (using sucrose as the carbon source and NH4NO3 as the nitrogen source) and dissolved oxygen levels, it is possible to regulate glycolysis, the pentose phosphate pathway, and nitrogen metabolism to achieve high-density cell proliferation and efficient biosynthesis of militarine and other secondary metabolites [12]. Given that no chemical synthesis route for militarine has been established, extraction from B. striata cells remains the main production method [4]. Thus, developing appropriate suspension culture conditions for scalable production and refining culture parameters are essential to improving the yield and quality of secondary metabolites to meet market demand.
Militarine and other secondary metabolites of B. striata are primarily derived from precursors such as phenylpropanoids and glycosides through a series of enzyme-catalyzed modifications (e.g., hydroxylation, methylation, and acylation) [7,13]. Elucidating this complex biosynthetic network not only deepens our understanding of the pharmacological mechanisms underlying these bioactive compounds but also enables further enhancement of their yield and quality through metabolic engineering and synthetic biology approaches. Despite current advances, the detailed pathways and transcriptional regulators governing militarine production remain poorly defined, representing a bottleneck to further improvement [14]. Therefore, a systematic dissection of this network holds considerable theoretical significance and economic potential. Transcriptome sequencing has unique and irreplaceable value in elucidating the biosynthetic network of secondary metabolites. By obtaining a comprehensive gene expression profile, screening for differentially expressed genes (DEGs), and conducting functional enrichment and pathway analyses, it is possible to systematically reveal the biosynthetic networks of metabolites and their regulatory mechanisms [15,16,17]. Consequently, to further dissect the key enzymatic genes and regulatory networks involved in militarine biosynthesis, this study employs transcriptomic sequencing to investigate the genetic mechanisms of militarine production in suspension cells from different B. striata landraces, identifying differentially expressed genes associated with phenylalanine and tyrosine metabolism and phenylpropanoid biosynthesis. The findings will advance our understanding of militarine accumulation and metabolic regulation in plants and provide a theoretical basis for enhancing its comprehensive utilization.
In this study, we aimed to establish a genetically stable, high-yielding suspension culture system for the large-scale production of militarine and other metabolites from B. striata. We combined screening trials with response surface methodology (RSM) to optimize carbon and nitrogen sources and agitation speeds across suspension cell lines derived from four representative genotypes [18]. Parallel transcriptomic sequencing identified differentially expressed genes involved in militarine biosynthesis. Our integrated findings provide both a practical culture protocol for industrial production and a molecular framework to guide future metabolic engineering of B. striata and other medicinal plants. These advances not only address current supply limitations and quality variability of B. striata but also lay the groundwork for sustainable biomanufacturing of high-value militarine and offer a scalable blueprint applicable to other medicinal species.

2. Materials and Methods

2.1. Plant Material and Capsule Collection of B. striata

Seeds of B. striata were obtained from the Xinpu Campus of Zunyi Medical University. Based on agronomic traits (flower color and blade width) and the cultivation environment (soil type), thirteen distinct landraces were selected. Fruit capsules from each landrace were used for a liquid suspension culture following the pre-culture conditions summarized in Table 1. The main experimental reagents involved in the cell suspension culture of B. striata are listed in Table S1. One landrace was additionally pre-cultured for 45 days (first culture phase), as described in Table 1 [19]. During the subculture phase, from 0 to 21 days post-inoculation (dpi), cultures were subjected to varying sucrose and ammonium nitrogen concentrations and different shaker speeds. Mature capsules harvested in September to October served as the starting material for these experiments.
To obtain uniformly mature seeds for the cell suspension culture, we monitored flowering phenology and performed controlled pollinations. On the day of anthesis, we measured five agronomic traits, blade length (BL, cm), blade width (BW, cm), length–width ratio of blade (LWRB), plant length (PL, cm), and flower number (FN, pcs), chosen based on standard plant descriptors and our prior surveys. For pollination trials, at least 30 flowering individuals per landrace received manual intra-landrace cross-pollination, and the remaining plants were left for natural pollination. Immediately after pollination, flowers were bagged, and fruit-set rates were recorded one month later.

2.2. Cell Suspension Culture

2.2.1. Induction Conditions and Subculture Cultivation

Fully mature, uncracked capsules were surface-sterilized with 75% ethanol and aseptically bisected, and the seeds were released into sterile tubes. Seeds were disinfected with 75% ethanol and 0.1% HgCl2 containing 1 mg/L of Tween-80, rinsed, and maintained under aseptic conditions until inoculation. The induction medium was prepared according to standard formulations (see Table 1) and dispensed into glass vessels prior to sterilization. Sterilized seeds were transferred into the medium under aseptic conditions. The induction phase extended for 30 days, with subcultures performed every 15 days. By 45 days post-inoculation, cell aggregates reached a sufficient biomass for quantification, and the cultures proceeded to the second suspension culture phase.

2.2.2. Measuring Growth Indicators

During the second culture phase (up to 60 dpi), flasks containing 1.0 g of fresh-weight suspension cells were maintained under standardized culture conditions. At 3-day intervals, three flasks were randomly sampled as replicates. For each sample, the growth was photographed, and the fresh weight (FW) and dry weight (DW) were measured. The proliferation rate was calculated as [(Wt − W0)/W0] × 100% (Wt, cell weight at time t; W0, initial weight at 0 dpi). Growth curves were fitted with a logistic nonlinear model to characterize growth kinetics and to identify the onset of militarine accumulation [20]. Statistical analyses were performed in SPSS v29.0, and figures were prepared in GraphPad Prism 9.

2.2.3. Selection of Landraces and Cultivation Conditions

After establishing the suspension cultures, landraces demonstrating vigorous growth and observable traits were selected for further investigation, with 30 replicates per landrace. During the 0–21 dpi subculture, single-factor experiments were carried out to assess the effects of sucrose concentration (20, 30, 40, and 50 g/L), ammonium nitrate concentration (250, 500, 750, and 1000 mg/L), and shaker speed (90, 120, and 150 rpm) on suspension-cell growth. At 21 dpi, cultures were sampled for metabolite accumulation analysis to define suitable variable ranges for a subsequent RSM study. A Box–Behnken design was employed with three factors at three levels: sucrose concentration (30, 35, and 40 g/L), NH4NO3 concentration (500, 625, and 750 mg/L), and shaker speed (120, 135, and 150 rpm). And the suspension cultures were carried out under the conditions listed in Table 1. Samples at 21 dpi were harvested for component extraction and metabolite analysis.

2.3. Metabolite Extraction and Quantitative Analysis

Dried suspension-cultured B. striata cells were pulverized and extracted by reflux with 70% methanol. The resulting extracts were filtered and evaporated to dryness. The residue re-dissolved in 70% methanol, adjusted to a final volume, and filtered (0.22 μm) prior to HPLC analysis. Both standards (coelonin, dactylorhin A, gastrodin, p-hydroxybenzyl alcohol, and militarine) and samples were separated on a C18 column using an acetonitrile−0.1–0.1% phosphoric acid gradient (see Table S2) at 0.8 mL/min and 25 °C and detected at 223 nm [21]. Quantification was performed by the peak area (external standards), and the content was calculated as follows:
Content = (C × V × DF)/m
C, sample concentration; V, final volume; DF, dilution factor; m, sample weight.
Correlation analysis of the experimental data was performed using SPSS v29.0.

2.4. Sample Collection and RNA Extraction

Based on metabolite profiles, four landraces with distinct agronomic traits (LD-DPF, LD-LPF, SMPF-WL, and SMPF-NL) were selected (Figure S1). Seeds from each landrace were used for suspension cultures, and cells were sampled at 21 dpi, which corresponds to the time of peak militarine accumulation. For each landrace, three biological replicates were prepared; equal amounts of the total RNA were submitted for Illumina HiSeq 2000 (Illumina, Inc., SanDiego, CA, USA) sequencing. We extracted the RNA from suspension cells through the Trizol method, and the total RNA quality was assessed using an Agilent 2100 Bioanalyzer (Agilent Technologies, SantaClara, CA, USA) prior to library construction. The main experimental reagents involved in transcriptome sequencing are shown in Table S3.

2.5. Transcriptome Sequencing and Data Quality Control

Transcriptome sequencing was performed by Beijing Novogene using an Illumina HiSeq 2000. The mRNA was enriched by oligo (dT) selection, fragmented, and reverse transcribed to generate cDNA libraries with Illumina adapters. Libraries were quantified and QC-checked (Qubit, Agilent Bioanalyzer, qPCR) before paired-end sequencing. Raw reads were filtered (fastp) to obtain clean reads (Q20/Q30 and GC content reported), and de novo assembly was performed using Trinity, which employs an overlap–layout–consensus (OLC) algorithm. Although more computationally intensive, OLC offers higher accuracy and mapping rates for Illumina-generated short, paired-end reads (Figure S2) [22]. Assembled transcripts were merged with a third-generation, full-length transcript dataset to construct a reference unigene set; redundant contigs were clustered with Corset, and assembly completeness was assessed with BUSCO. Further analyses, along with a comprehensive list of the software, instruments, and parameters used, are provided in Table S4.

2.6. Gene Function Annotation and Expression Level Analysis

Assembled transcripts were functionally annotated against seven public databases (NR, NT, SwissProt, Pfam, GO, KOG, and KEGG) [23,24,25]. Clean reads were mapped to the Trinity-assembled reference, and gene abundances were quantified with RSEM [26]. Expression levels were normalized and reported as FPKM [27]. Functional classifications (GO and KOG) and KEGG pathway mappings were used for downstream interpretation and enrichment analyses [28,29]. Sample consistency was assessed by correlation analysis of FPKM values, with results visualized using density plots, boxplots, and heatmaps. Group- and sample-specific expressions were summarized using Venn diagrams. The software, key parameters, and full annotation/mapping statistics used are provided in Table S4.

2.7. Differential Expression Analysis and Functional Enrichment

Differential expression analyses were performed using DESeq2 for comparisons with biological replicates and edgeR for comparisons lacking replicates [30,31]. Resulting DEGs were filtered by adjusted p-values and fold changes (thresholds reported in Table S4) and summarized graphically (bar charts and volcano plots). Overlaps among DEG sets were visualized with Venn diagrams to identify shared and unique responses across landraces.
Functional enrichment of DEGs was performed using GO and KEGG annotations, with all annotated genes from the assembly serving as the background [28,29]. Enriched GO terms and KEGG pathways were identified to elucidate biological processes and pathways associated with differential gene expression. A protein–protein interaction (PPI) network for DEGs was constructed using STRING [32]. As the species was not present in STRING, orthologs were identified by sequence similarity and used to infer interactions. Enrichment results, thresholds, and software references are listed in Table S4.

2.8. SSR Analysis

Simple sequence repeats (SSRs) located in annotated genes were detected using MISA [33]. Because SSRs are unevenly distributed but their adjacent sequences are often conserved and unique, PCR primers were designed against the flanking regions of each SSR using Primer3 to enable amplification of the SSR-containing fragments. Specifically, EST-SSR primers were designed from our de novo assembled unigene sequences using Primer3 (v2.3.5). For each SSR locus, we generated three primer pairs (primer length, 18–25 bp; GC content, 40–60%; Tm, 55–60 °C) to amplify 100–300 bp fragments.

3. Results

3.1. Diversity of B. striata Landraces

Leaf tissues of 13 B. striata landraces were harvested from the germplasm repository of Zunyi Medical University (Guizhou Province) and were used for genomic DNA extraction. Polymorphism was assessed by EST-SSR molecular markers. Based on transcriptome data, two highly conserved genes harboring SSR loci, BsWRKY20 and BsBGLU25, were selected for polymorphism assessment (Figure S3). Both loci were consistently amplified across all 13 landraces: BsBGLU25 produced a single amplicon of approximately 200 bp, while BsWRKY20 produced fragments ranging from 100 to 200 bp, demonstrating polymorphism among the landraces (Figure S3).
To evaluate the diversity among B. striata landraces, five agronomic traits—BL, BW, LWRB, PL, and FN—were measured and statistically analyzed. The coefficient of variation for each trait was non-zero, and the range between their minimum and maximum values revealed considerable variation among the 13 landraces (Table 2). Notably, BW exhibited the highest variability in both years (CV = 0.42 in 2023 and 0.62 in 2024), whereas FN was comparatively more stable (CV = 0.33 in 2023 and 0.43 in 2024). The higher CVs observed in 2024 were for traits such as BL, BW, and PL. These patterns identify BW as a key discriminator of genetic diversity. Correlation analysis showed that BL and BW were significantly positively correlated with PL and FN (Figure S4).

3.2. Suspension Cell Proliferation and Metabolite Accumulation Analysis

Suspension cultures were established from B. striata seed-derived cells. At the second subculture, when the cell mass reached a quantifiable level, this time point was designated as 0 dpi. The proliferation rate and relative increase in fresh and dry biomass of suspension-cultured cells over 0 to 60 dpi were fitted using nonlinear models. The logistic regression equation for the proliferation rate was y = 3.00 + (−2.82)/[1 + (x/14.15)^4.20]. Proliferation rates during the growth period exhibited a clear bimodal distribution (Figure 1A). The fitted relative growth curve shows that the proliferation rate initially rose and then declined, reaching its maximum at 33 dpi, while biomass accumulation peaks at 45 dpi (Figure 1B). Between 0 and 33 dpi, the continuously rising proliferation rate corresponds to the exponential phase; from 33 to 60 dpi, the rate declines, although cells remain proliferative, indicating a stationary phase. The proliferation rate and biomass exhibit an increase followed by a decrease consistent with the working hypothesis, peaking at 33 dpi and 45 dpi, respectively.
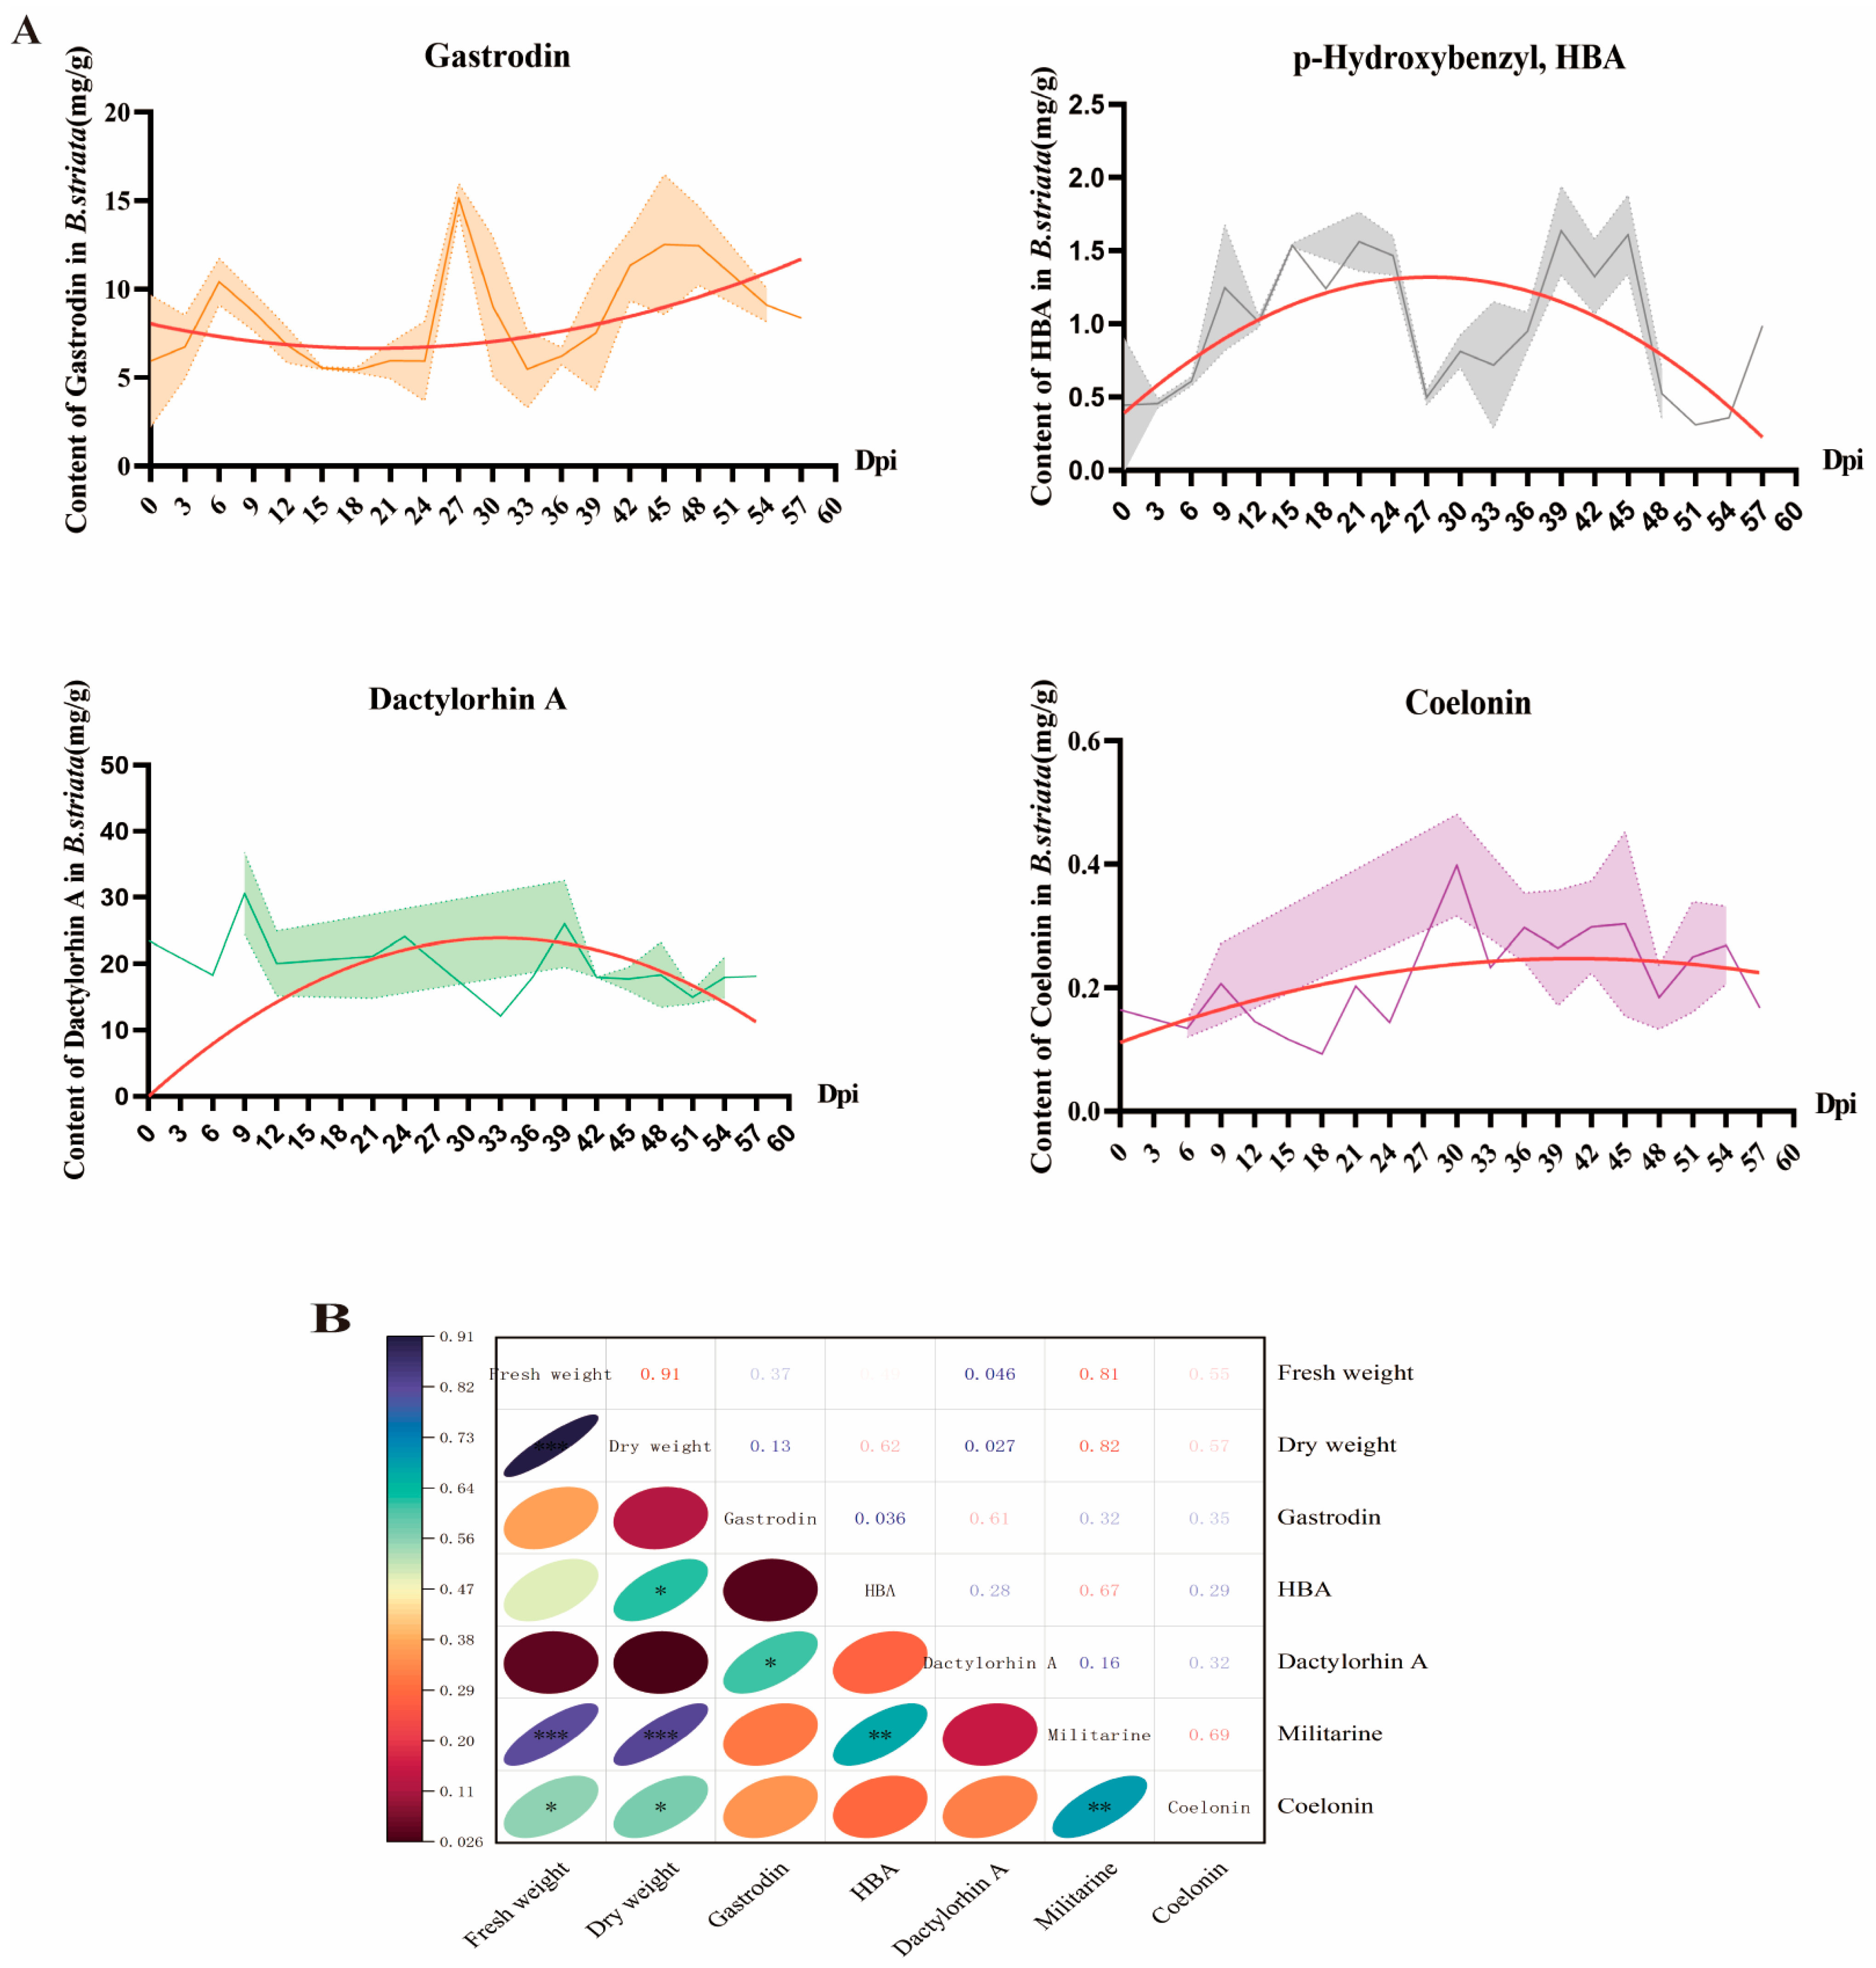
To identify the optimal sampling time for militarine quantification in the suspension culture system, the militarine content in the B. striata cells was measured from 0 to 60 dpi. The curve of the relative growth rate closely paralleled that of militarine accumulation, with correlation coefficients of 0.81 for both DW and FW (p < 0.001), each showing an initial rise followed by a decline (Figure 1D). According to the 2020 Chinese Pharmacopoeia, medicinal B. striata must contain militarine at ≥2% (20 mg/g). Based on the 0–60 dpi accumulation profile, 21 dpi was determined to be the peak period—militarine reached 32.81 mg/g—and was therefore selected as the standard sampling point for subsequent assays, while gastrodin, HBA, dactylorhin A, and coelonin are key intermediates in the militarine biosynthetic pathway [5,14] (Figure S5). Fitted concentration profiles for these metabolites over 0–60 dpi revealed that during certain phases, HBA and dactylorhin A accumulation trends paralleled that of militarine (Figure 2A). Furthermore, correlation analysis showed that militarine content correlated significantly with HBA (r = 0.67, p < 0.001) and with coelonin (r = 0.69, p < 0.001) (Figure 2B).

3.3. Analysis of Metabolite Accumulation in Different Landraces

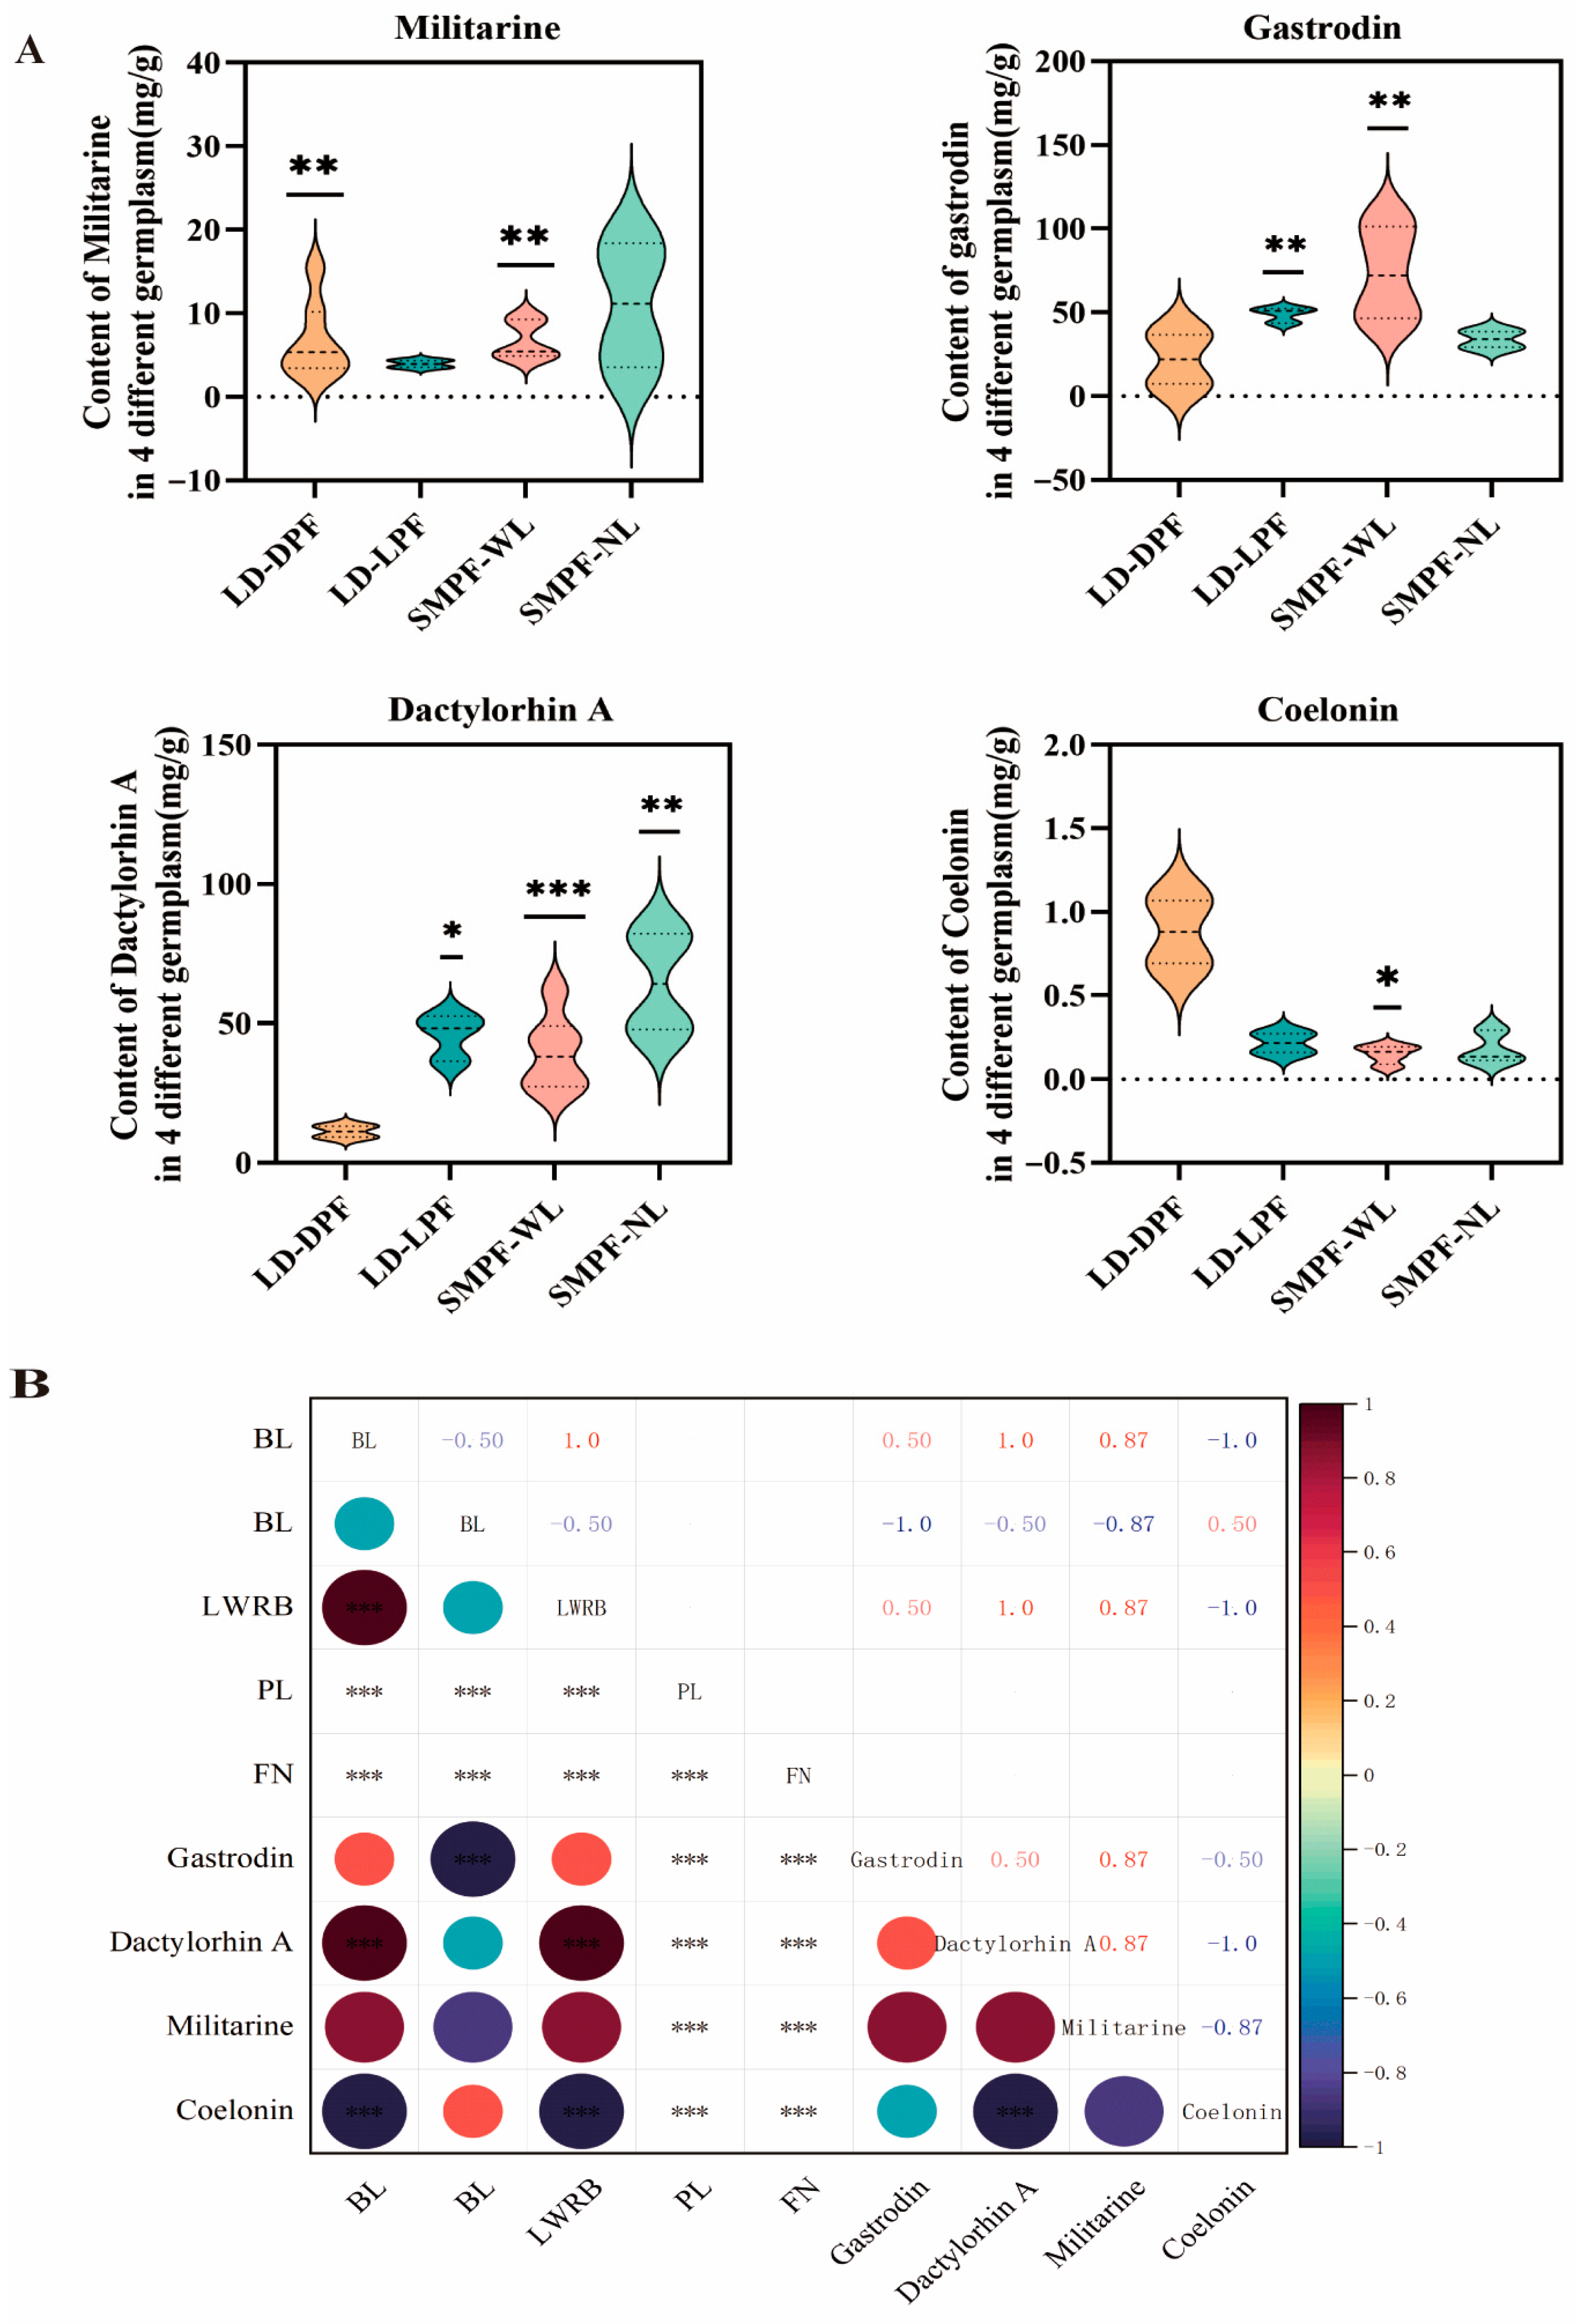
To identify a stable cell model for militarine biosynthesis, four B. striata landraces were cultivated in a suspension culture, and their metabolite concentrations were measured at 21 dpi (Figure S1 and Figure 3A). In the LD-LPF landrace, accumulation of gastrodin, militarine, dactylorhin A, and coelonin remained stable; in SMPF-NL, gastrodin and coelonin were likewise stable; SMPF-WL exhibited the highest gastrodin content among the four landraces; SMPF-NL showed the highest levels of dactylorhin A and militarine while maintaining stable gastrodin and coelonin; and LD-DPF had the highest coelonin content. Notably, HBA was detected exclusively in SMPF-WL.
To explore the relationship between agronomic traits and metabolite production across landraces, correlation analyses were performed between BL, BW, PL, FN, and metabolite contents (Figure 3B). BL correlated significantly and positively with dactylorhin A and militarine (r > 0.87, p < 0.001) and significantly and negatively with coelonin (r = −1.00, p < 0.001). BW was significantly and negatively correlated with gastrodin and militarine (r < −0.87, p < 0.001).

3.4. Optimal Culture Condition Screening and Model Construction

To optimize B. striata suspension-cell growth and increase metabolite production, conditions such as sucrose concentration, ammonium nitrate concentration, and shaker speed were selected as variables for optimization, with 21 dpi set as the sampling point for militarine quantification. Single-factor experiments were initially conducted to determine suitable ranges for each factor. Under varying sucrose concentrations, both cell growth and militarine accumulation peaked at 30 g/L and 40 g/L (Figure S6A); therefore, 30–40 g/L was chosen as the sucrose range for the response surface experiments. Similarly, with varying NH4NO3 levels, the militarine content was highest at 500 mg/L and 750 mg/L (Figure S6B), leading to a selected range of 500–750 mg/L for ammonium nitrate. Finally, agitation speeds of 120 rpm and 150 rpm yielded the greatest militarine accumulation (Figure S6C), so 120–150 rpm was established as the working range for shaker speed in the subsequent RSM.
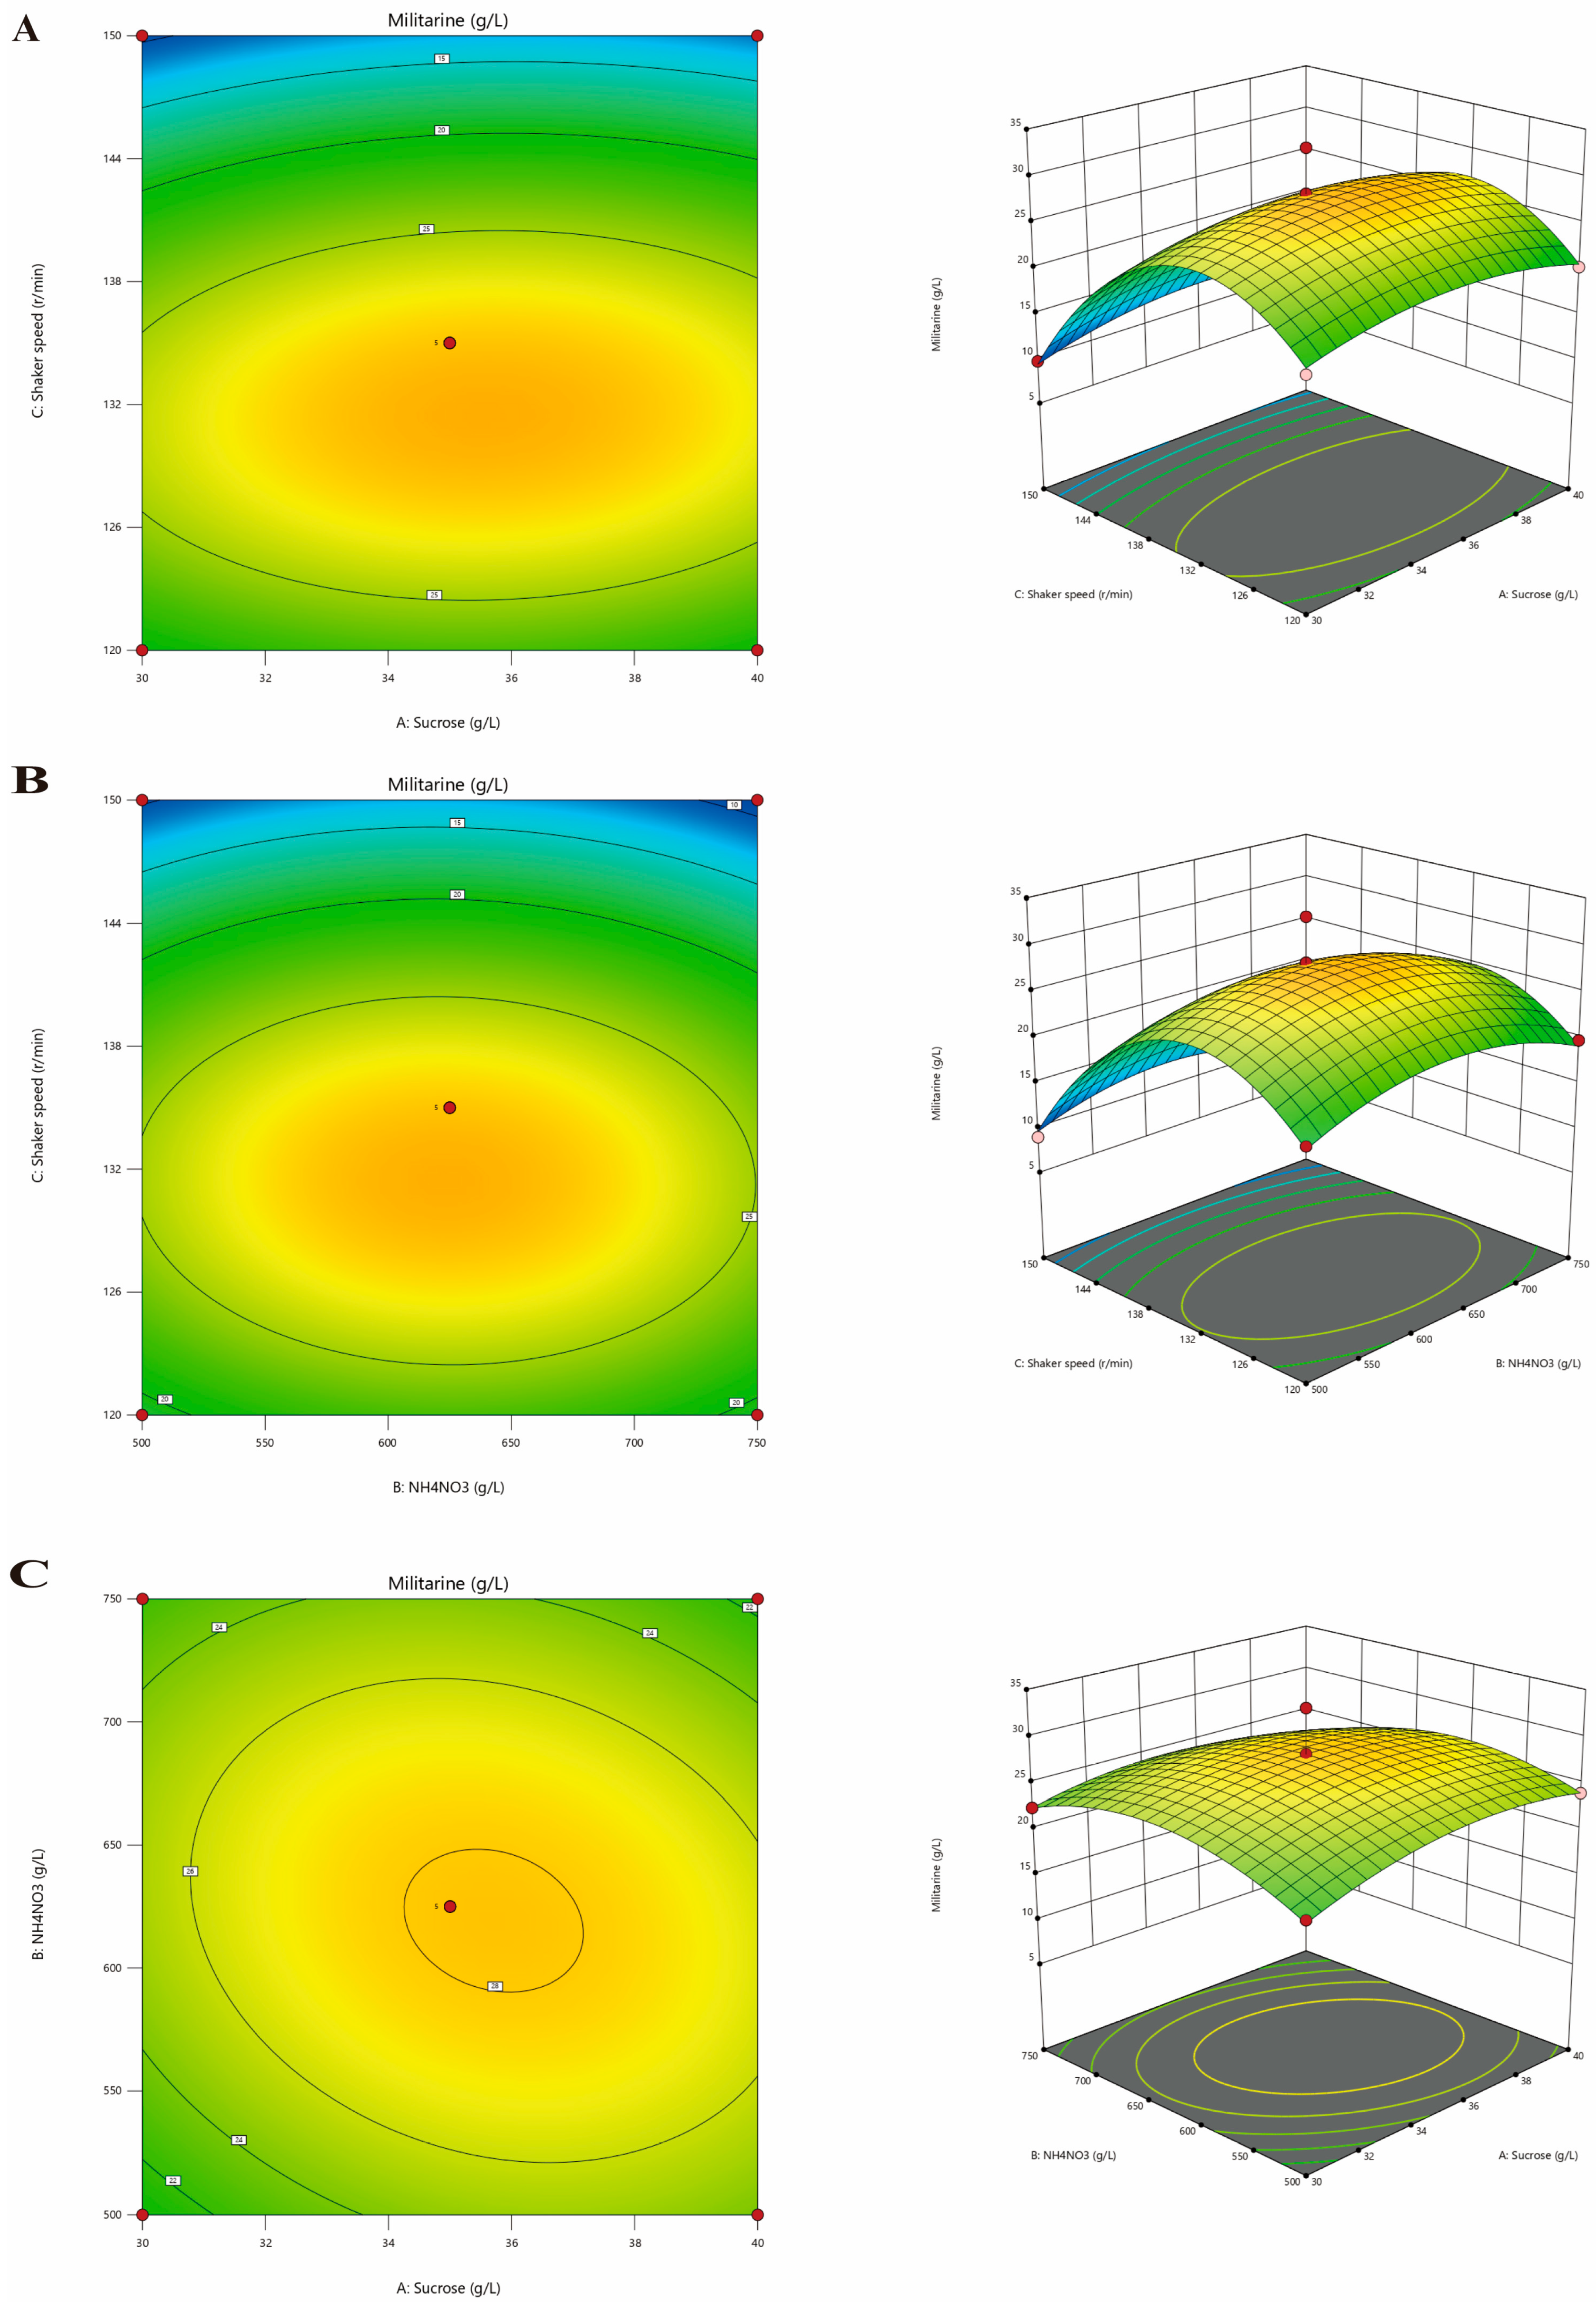
Based on the single-factor results, sucrose concentration (30–40 g/L), ammonium nitrate concentration (500–750 mg/L), and shaker speed (120–150 rpm) were selected for an RSM study (Figure S7A). Using Design-Expert 13, a 17-run experimental design with three replicates per condition was generated. Curve fitting yielded the following second-order polynomial for militarine content (Y, mg/g) (Figure 4):
Y = 28.14 + 0.6136 A − 0.1822 B − 4.95 C − 1.06 AB + 0.4034 AC − 0.3036 BC − 2.33 A2 − 3.66 B2 − 10.4 C2
where A is sucrose (g/L), B is NH4NO3 (mg/L), and C is agitation speed (rpm).
The model’s predicted R2 was 0.8844 and its adjusted R2 was 0.8900 (Δ < 0.2), indicating a good fit. An Adequate Precision (signal-to-noise ratio) of 10.7389 (>4) confirmed the model’s adequate signal strength. Surface analysis of the RSM plots (Figure 4) reveals a single, smooth convex “peak” region centered at moderate levels of sucrose (35 g/L) and NH4NO3 (625 mg/L) with an optimal agitation speed of around 135 rpm. In the A–C plane (sucrose vs. shaker speed), the relatively steep gradient along the sucrose axis shows that small changes in sugar concentration have a pronounced effect on militarine synthesis, whereas the gentler slope along the agitation axis suggests a wider tolerance to shaking speeds. Conversely, in the B–C plane (NH4NO3 vs. shaker speed), the elongated ridge parallel to the nitrogen axis indicates that militarine production is more robust across a broader range of ammonium concentrations, with only moderate sensitivity to agitation. The dense packing of contour lines around the optimum further confirms a narrow “window” for peak yield, underscoring the precision required in medium formulation and agitation control to maximize metabolite accumulation. Validation experiments were conducted under the optimized conditions—35 g/L of sucrose, 625 mg/L of NH4NO3, and 135 rpm (Figure S7B). Consistently, the yielded militarine contents were above the Pharmacopeial standard of 20 mg/g, demonstrating the stability and reliability of these culture conditions.

3.5. Transcriptome Sequencing Data Overview and Annotation Statistics

cDNA libraries were constructed from 12 samples representing four B. striata landraces and subjected to transcriptome sequencing. On average, each sample yielded 6.87 Gb of clean reads, and per-library Q20 and Q30 values exceeded 97.48% and 92.89%, respectively (Table 3). By incorporating previously obtained third-generation full-length transcripts from different growth stages and performing sequence alignment and filtering, 53,196 unigenes were retained, indicating a rich collection of high-quality gene sequences. The assembly N50 was 1677 bp, meaning that over half of the unigenes were at least 1677 bp long, which reflects high assembly integrity and good coverage of full-length transcripts.
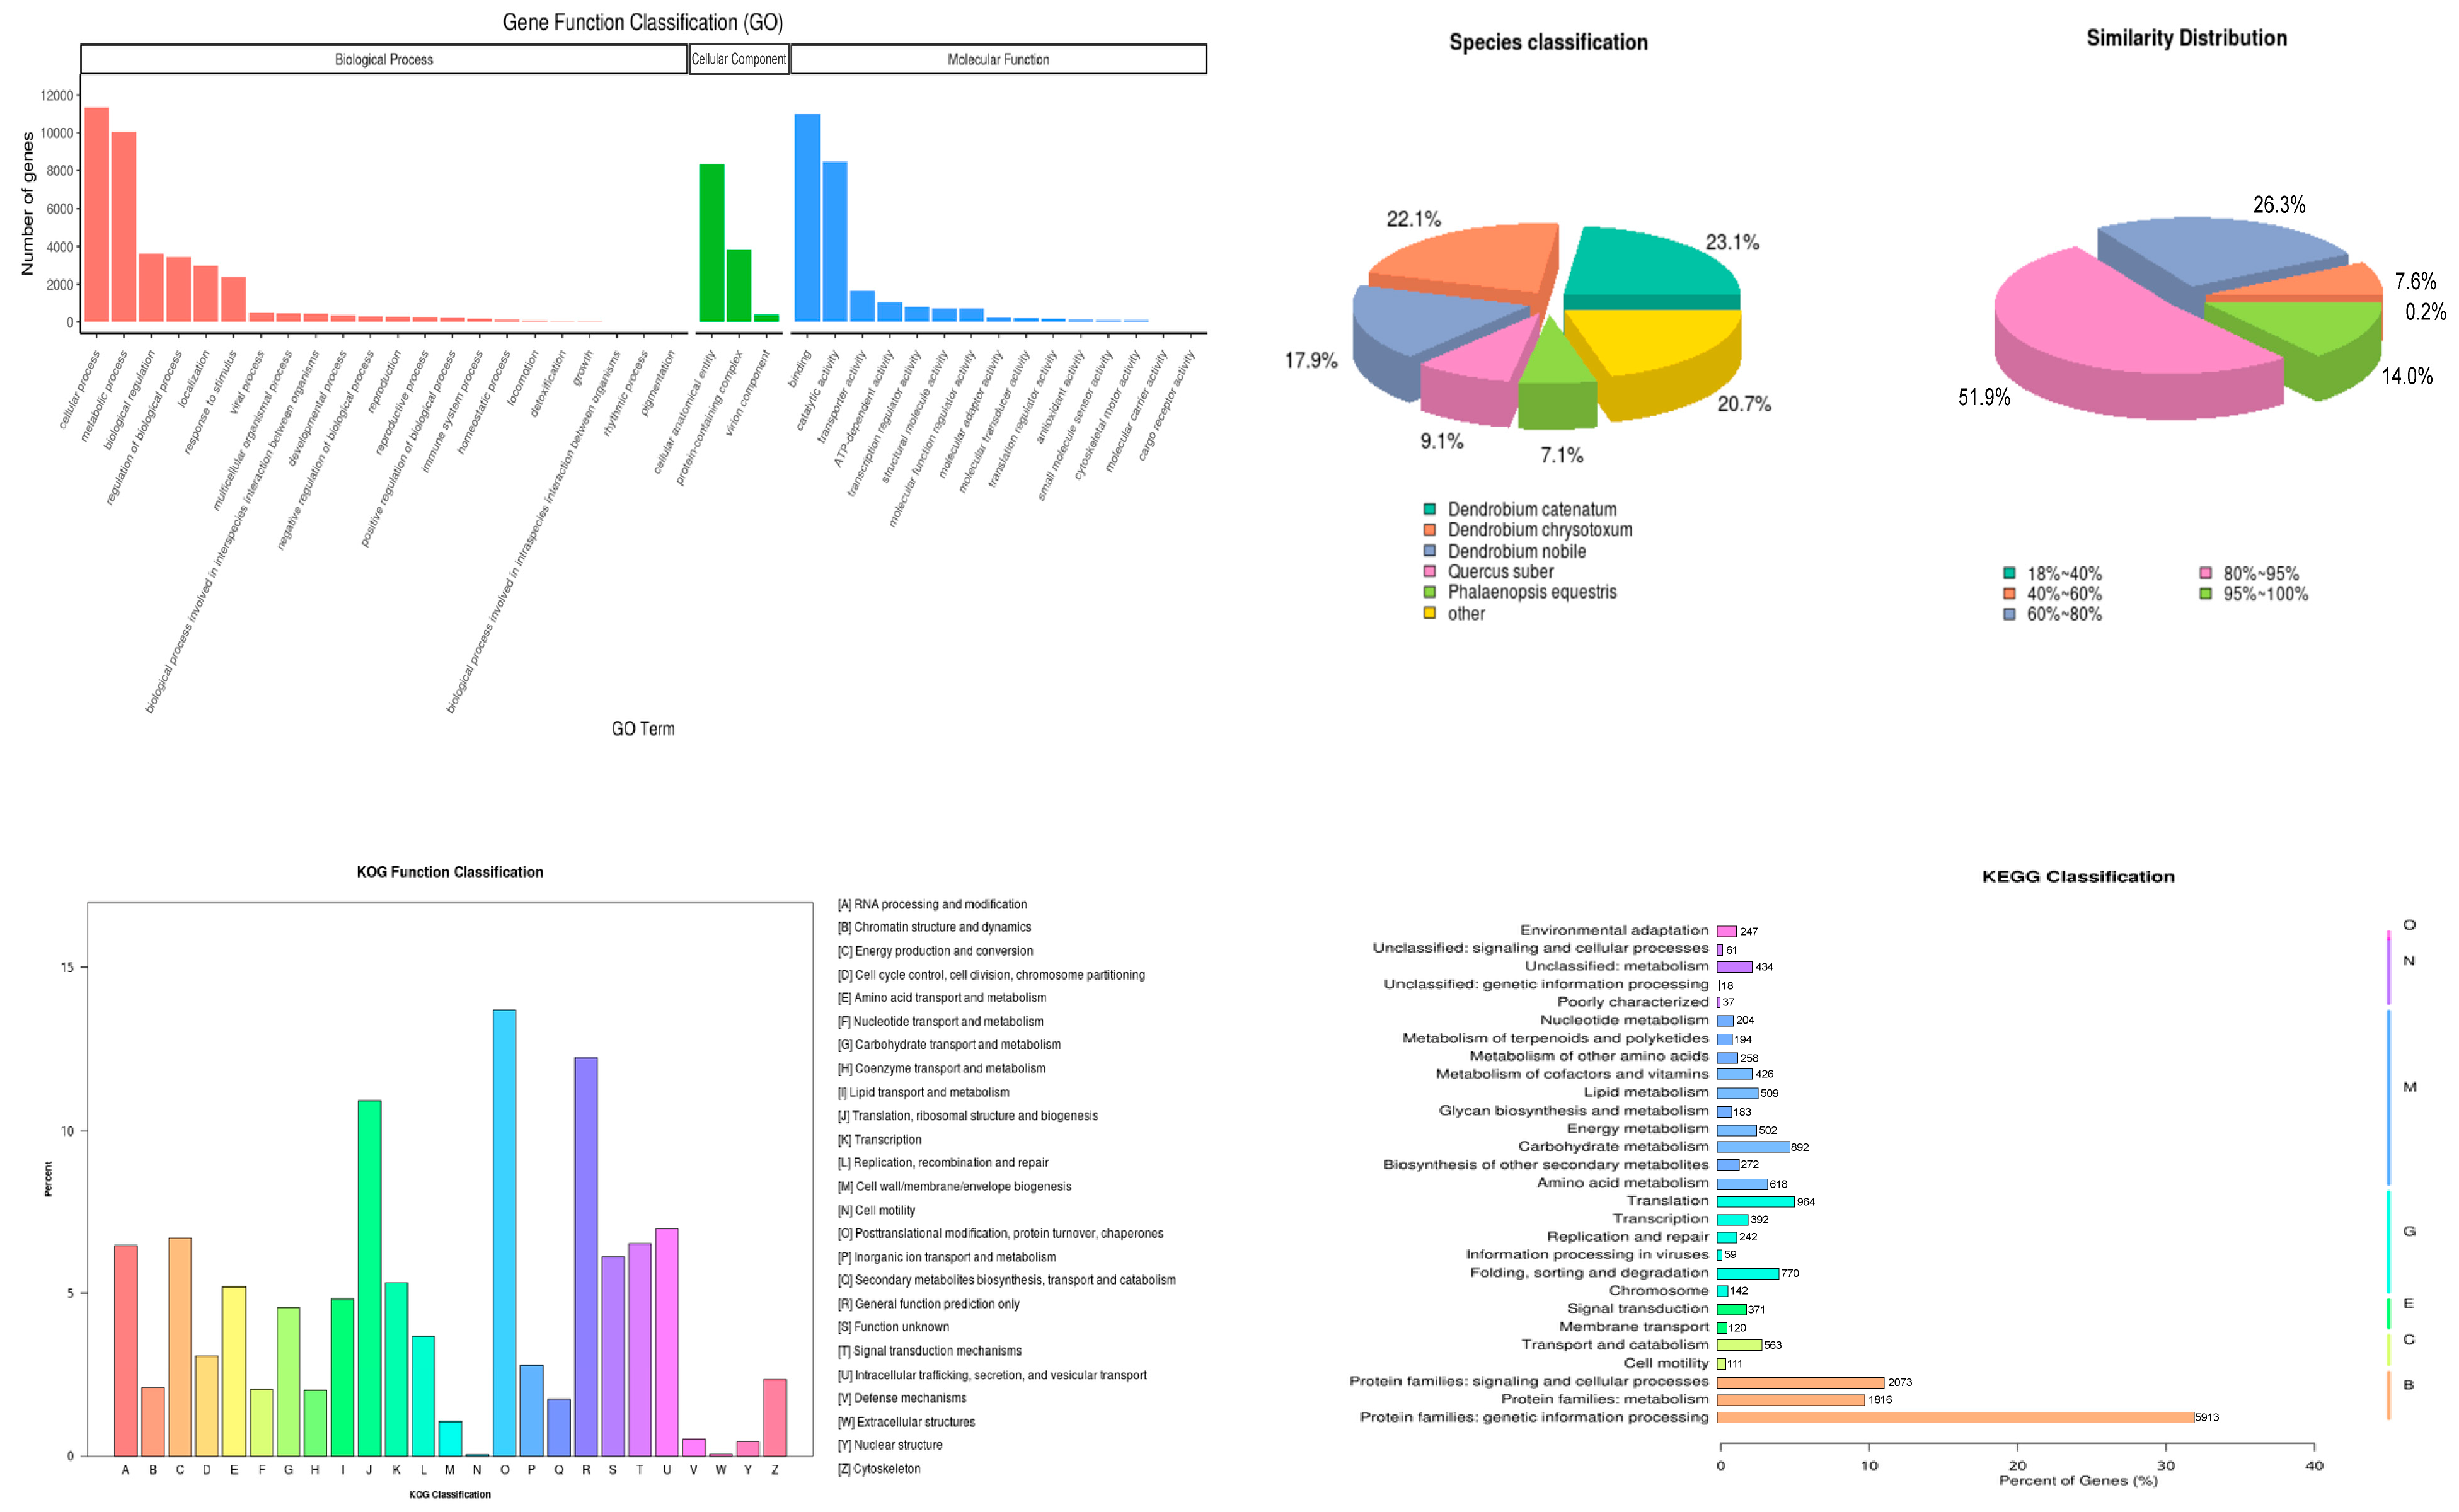
Functional annotation by BLASTX against eight major databases (NR, NT, KO, SwissProt, Pfam, GO, KOG, and KEGG) assigned 33,227 unigenes (62.46%) to at least one database (Figure 5). SwissProt provided high-confidence protein function annotations for 21,765 unigenes (40.91%). Both Pfam and GO annotated 20,157 unigenes each (37.89%), supplying protein domain and gene ontology classifications, respectively. KO (KEGG Orthology) annotated 11,498 unigenes (21.61%), aiding in metabolic pathway mapping, while KOG assigned functional categories to 8294 unigenes (15.59%). Among all resources, the NR database yielded the highest number of matches (29,448 unigenes, 55.35%). The NT database aligned 21,798 unigenes (40.97%) at the nucleotide level. Notably, 37.54% of unigenes remained unannotated, likely representing species-specific or functionally uncharacterized transcripts. Only 4029 unigenes (7.57%) were annotated by all databases, indicating some overlap but largely complementary annotation coverage. These detailed annotations directly inform our subsequent screening: by focusing on unigenes annotated in metabolic pathways, we can prioritize candidate genes for functional validation in militarine synthesis.

3.6. Gene Expression Levels Between Different Landraces

3.6.1. FPKM Density Distribution and Sample Correlation

To investigate expression trends of DEGs among the landraces, gene expression was quantified using FPKM values. The density distributions of FPKM values for the four landraces showed both overlapping and distinct regions (Figure 6A). Pairwise correlation analysis of FPKM profiles revealed that LDDPF1, LDDPF30, LDLPF133, SMPFWL2, SMPFWL3, SMPFWL5, and SMPFNL93 all exhibited R2 > 0.8 (Figure 6B). In contrast, LDLPF63 displayed R2 < 0.65 with every other sample.

3.6.2. Shared and Unique Expression Profiles

A Venn diagram of unigene expression across the four landraces identified 22,811 genes common to all lines (Figure 6C). These core unigenes are likely responsible for fundamental metabolic and cellular processes conserved across all environments. Pairwise overlaps reveal that LDDPF and LDLPF share 1464 unigenes, and SMPFWL and SMPFNL share 1853 unigenes. Among landrace-specific genes, LDLPF harbored 7951 uniquely expressed unigenes—far more than any other line.

3.6.3. Pairwise Differential Expression Analysis

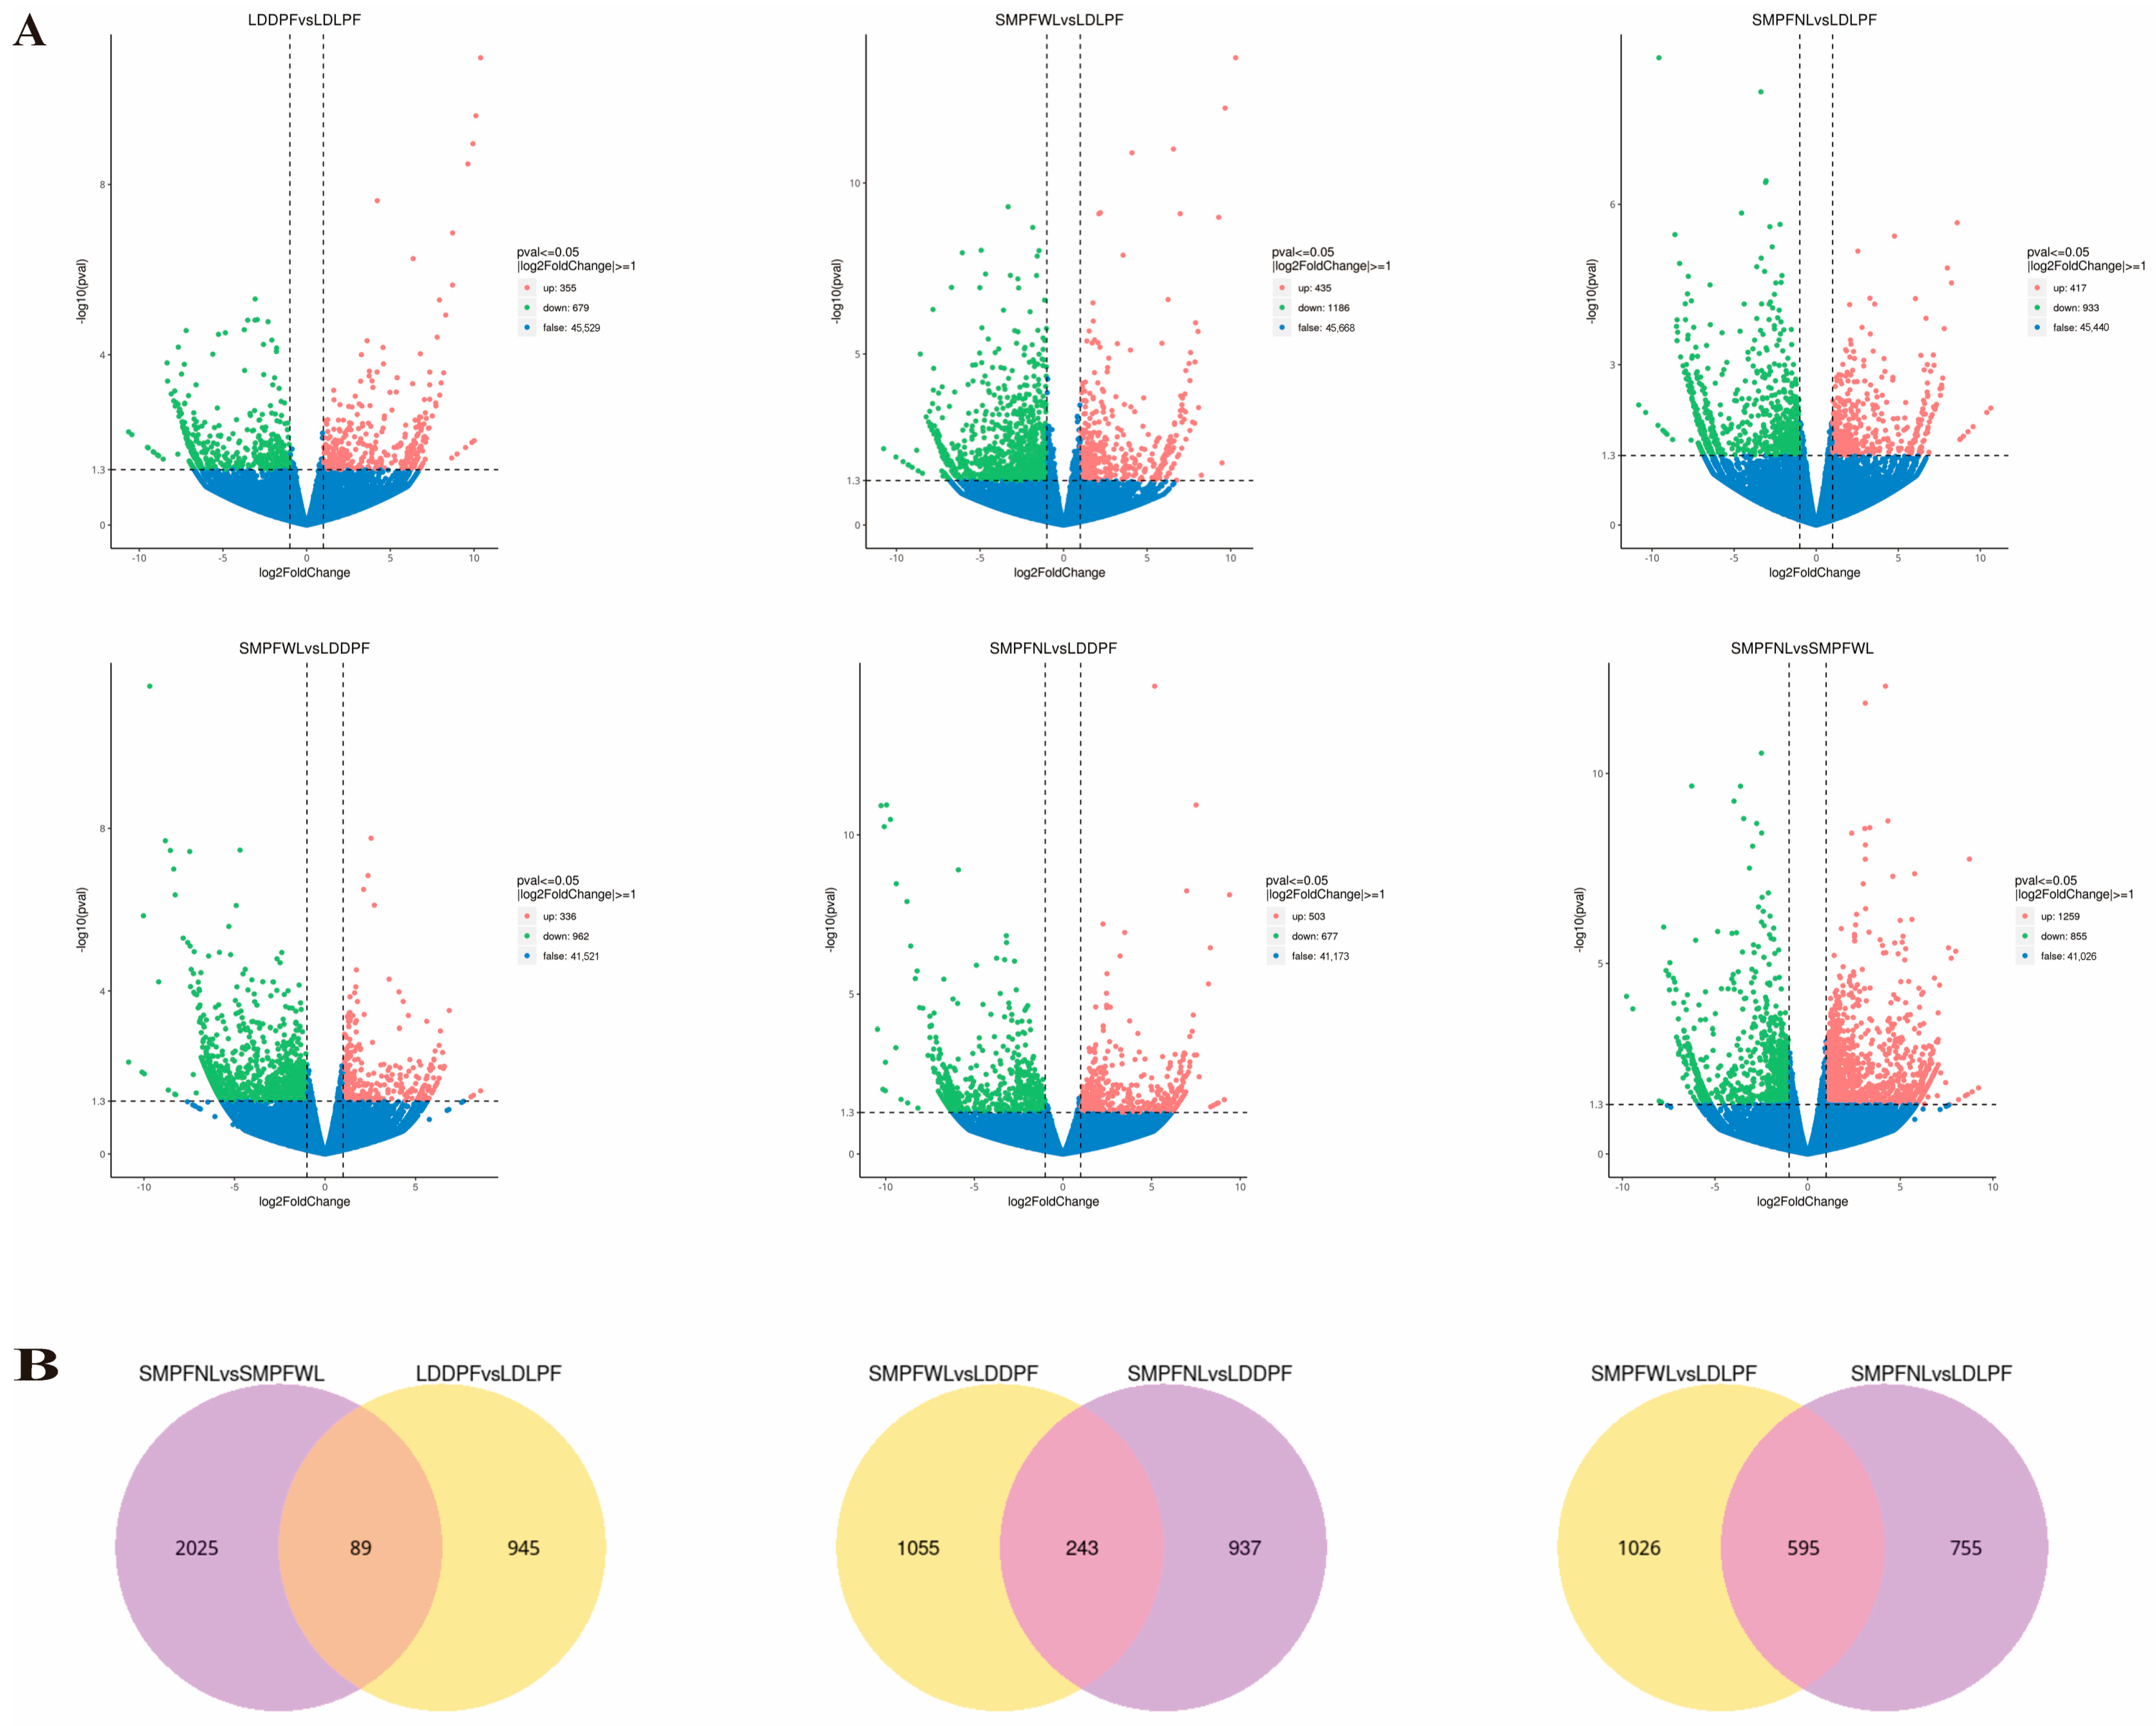
We performed all six pairwise comparisons among LDDPF, LDLPF, SMPFWL, and SMPFNL using DESeq2. The comparisons contrasting different growth environments (LDDPF vs. LDLPF and SMPFWL vs. SMPFNL) yielded substantially higher numbers of DEGs than those comparing landraces within the same environment. Notably, SMPFWL vs. SMPFNL produced 2114 DEGs—the highest count observed (Figure 6D). In this pair, downregulated genes outnumbered upregulated ones. By contrast, the other five comparisons exhibited a preponderance of upregulated genes.

3.7. Differential Gene Analysis of Suspension Cells in Different Landraces

Using |log2FoldChange| > 1 and an adjusted p-value (padj) of <0.05 as thresholds for DEG selection [34], a total of 8597 DEGs were identified across six pairwise comparisons. Volcano plots for LDDPF vs. LDLPF, SMPFWL vs. SMPFNL, SMPFWL vs. LDLPF, SMPFNL vs. LDLPF, SMPFWL vs. LDDPF, and SMPFNL vs. LDDPF are shown in Figure 7. The BW comparison (SMPFWL vs. SMPFNL) yielded the highest DEG count (2114, with 1259 upregulated and 855 downregulated), indicating that variation in BW drives the strongest transcriptomic divergence. In contrast, the flower-color intensity comparison (LDDPF vs. LDLPF) produced the fewest DEGs (1034, with 355 upregulated and 679 downregulated), reflecting its relatively modest impact on gene expression. Other comparisons gave intermediate DEG numbers: SMPFWL vs. LDLPF (1621 DEGs: 435 up, 1186 down), SMPFNL vs. LDLPF (1350 DEGs: 417 up, 933 down), SMPFWL vs. LDDPF (1298 DEGs: 336 up, 962 down), and SMPFNL vs. LDDPF (1180 DEGs: 503 up, 677 down).

3.8. Functional Enrichment Analysis of DEGs

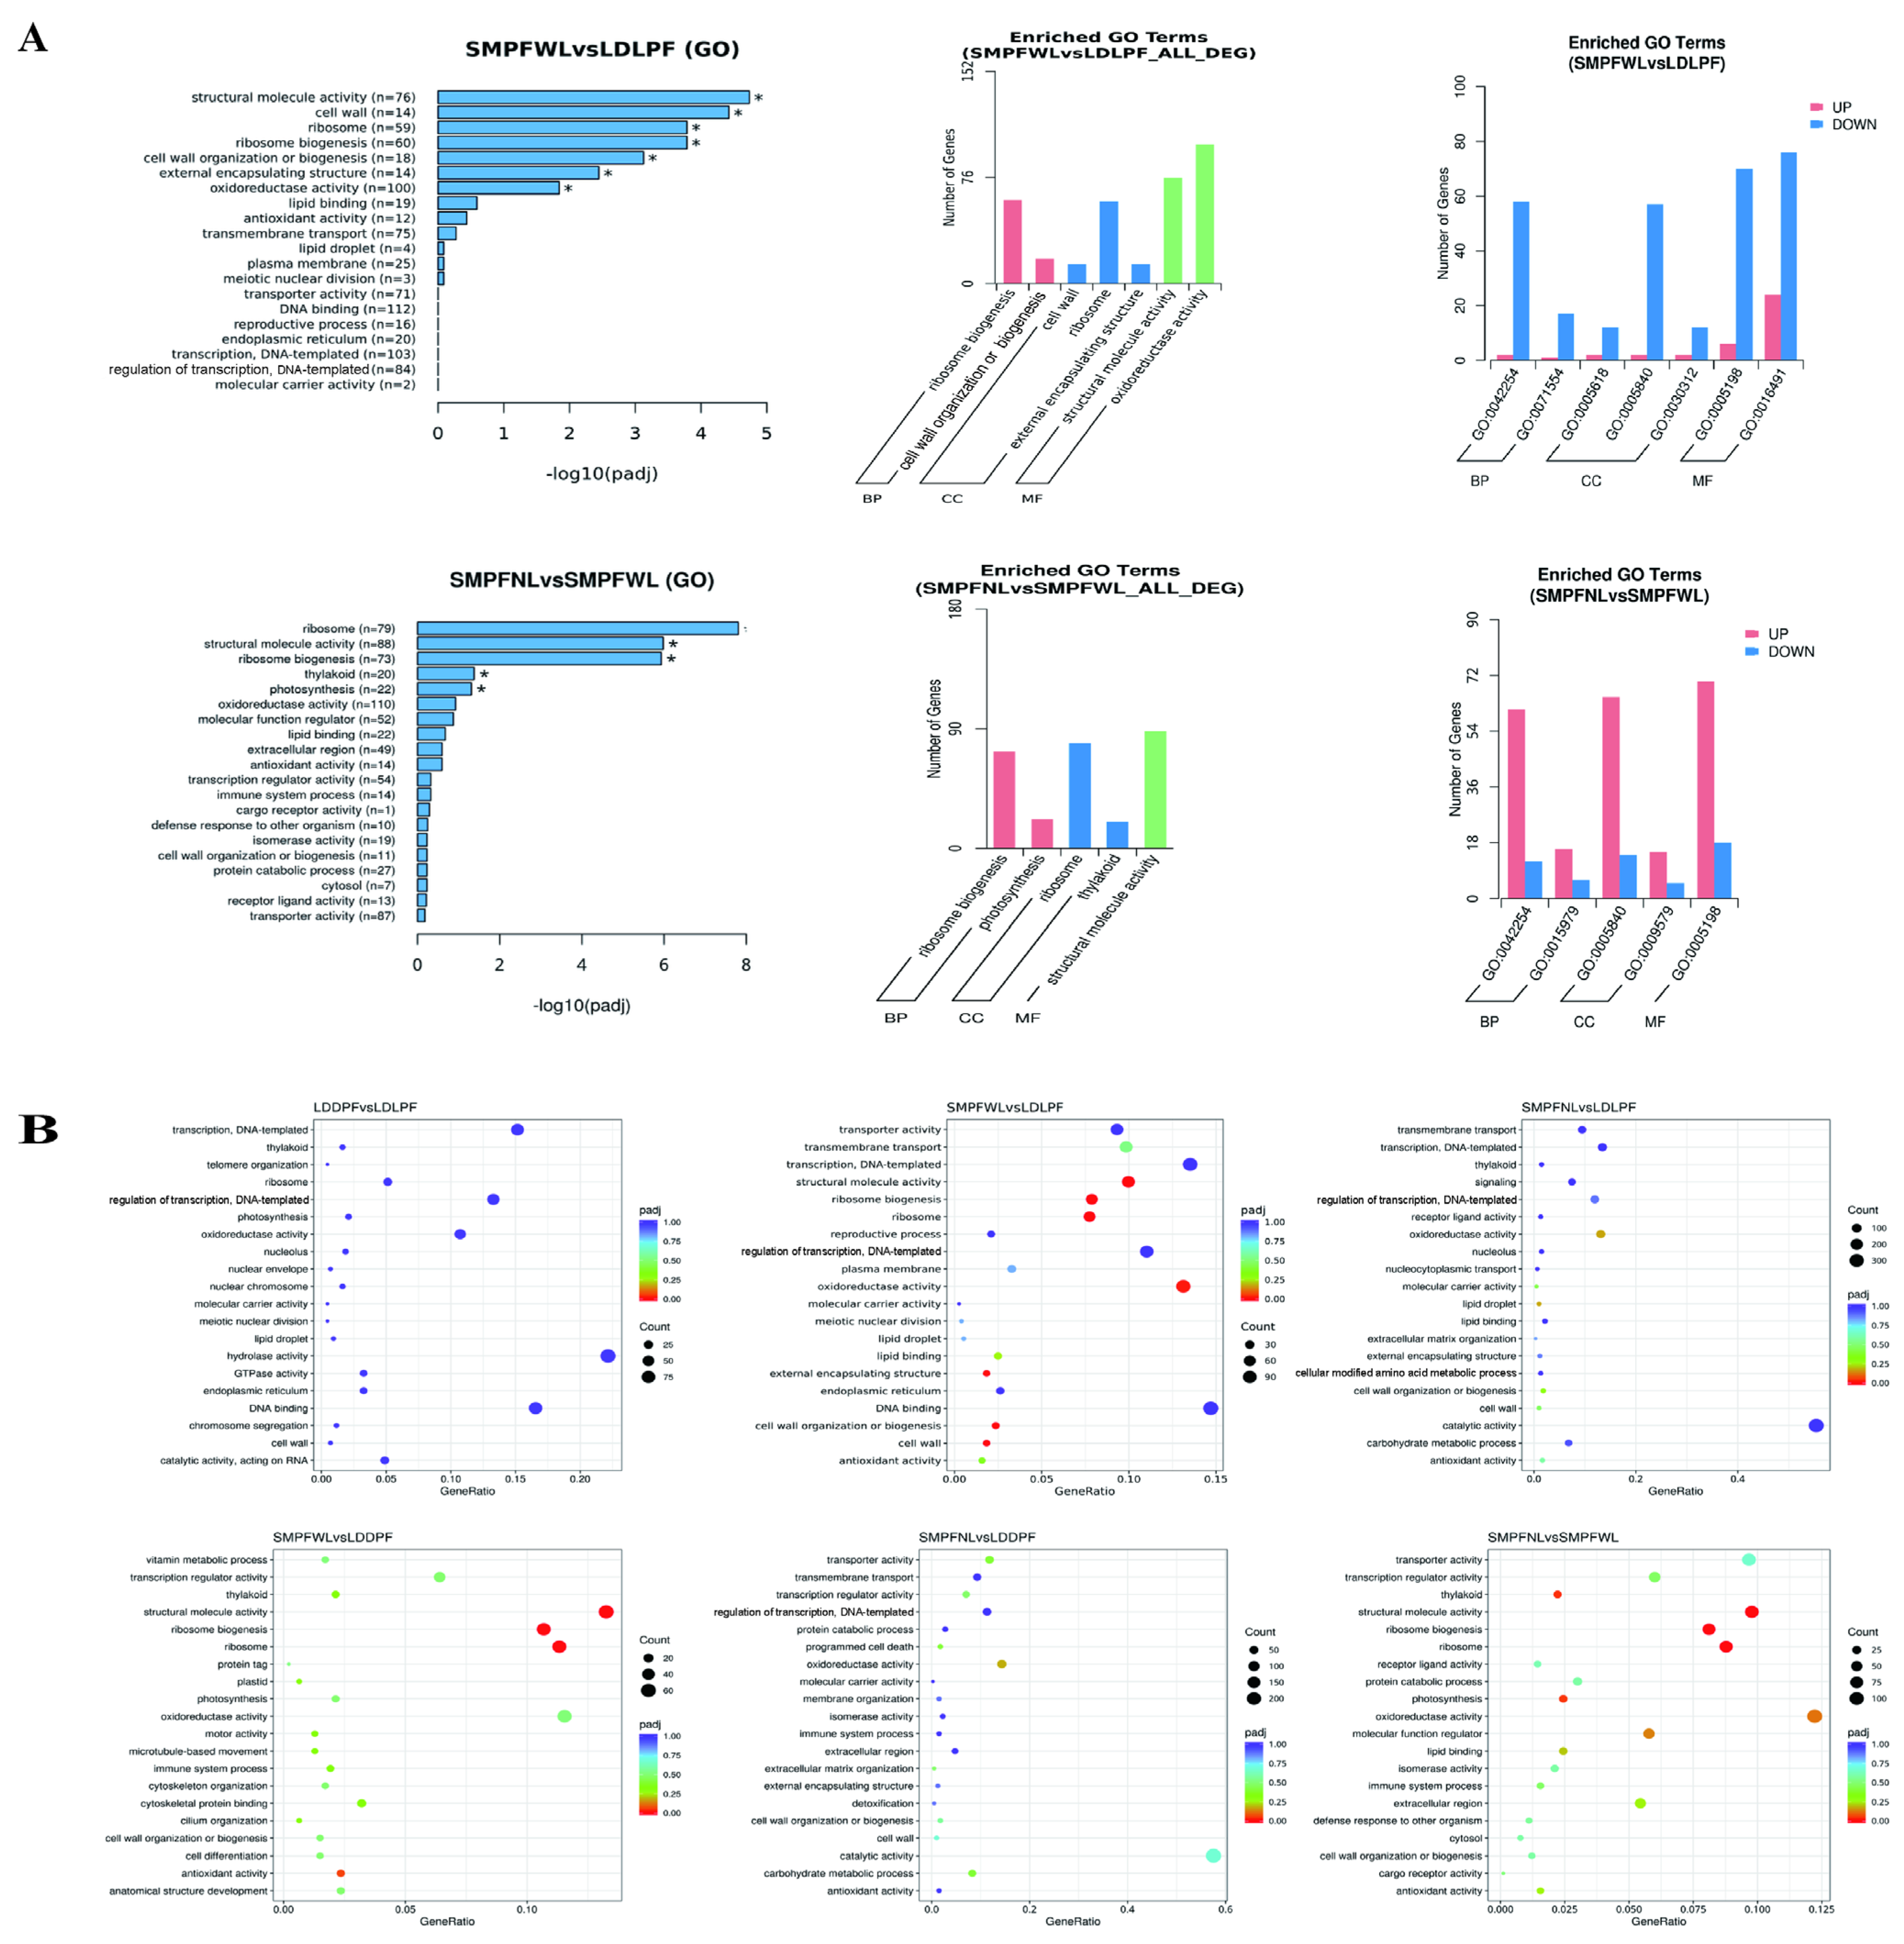
GO functional enrichment analysis was performed to identify GO terms significantly overrepresented among DEGs relative to the genomic background, using padj ≤ 0.05 as the significance cutoff. Mapping DEGs from each pairwise comparison to the three GO categories (CC, MF, and BP) revealed that in SMPFWL vs. LDLPF, DEGs were significantly associated with ribosome biogenesis (GO:0042254), cell wall assembly or organization (GO:0071554), structural molecule activity (GO:0005198), and oxidoreductase activity (GO:0016491), all of which were downregulated (Figure 8A). In the SMPFWL vs. SMPFNL comparison, DEGs were significantly enriched for ribosome biogenesis and photosynthesis (GO:0015979) and for thylakoid components and structural molecule activity, all upregulated in SMPFWL relative to SMPFNL (Figure 8A). Moreover, DEGs involved in transporter activity and structural molecule activity were abundant, whereas those annotated to defense response to other organisms were scarce. As is shown in Figure 8B, in the LDDPF vs. LDLPF comparison, significant expression differences were observed for genes related to transcriptional regulation and thylakoid structures involved in photosynthesis, with few DEGs linked to RNA catalytic activity. In both the SMPFNL vs. LDLPF and SMPFNL vs. LDDPF comparisons, relatively few DEGs were annotated to the carbohydrate metabolic process.
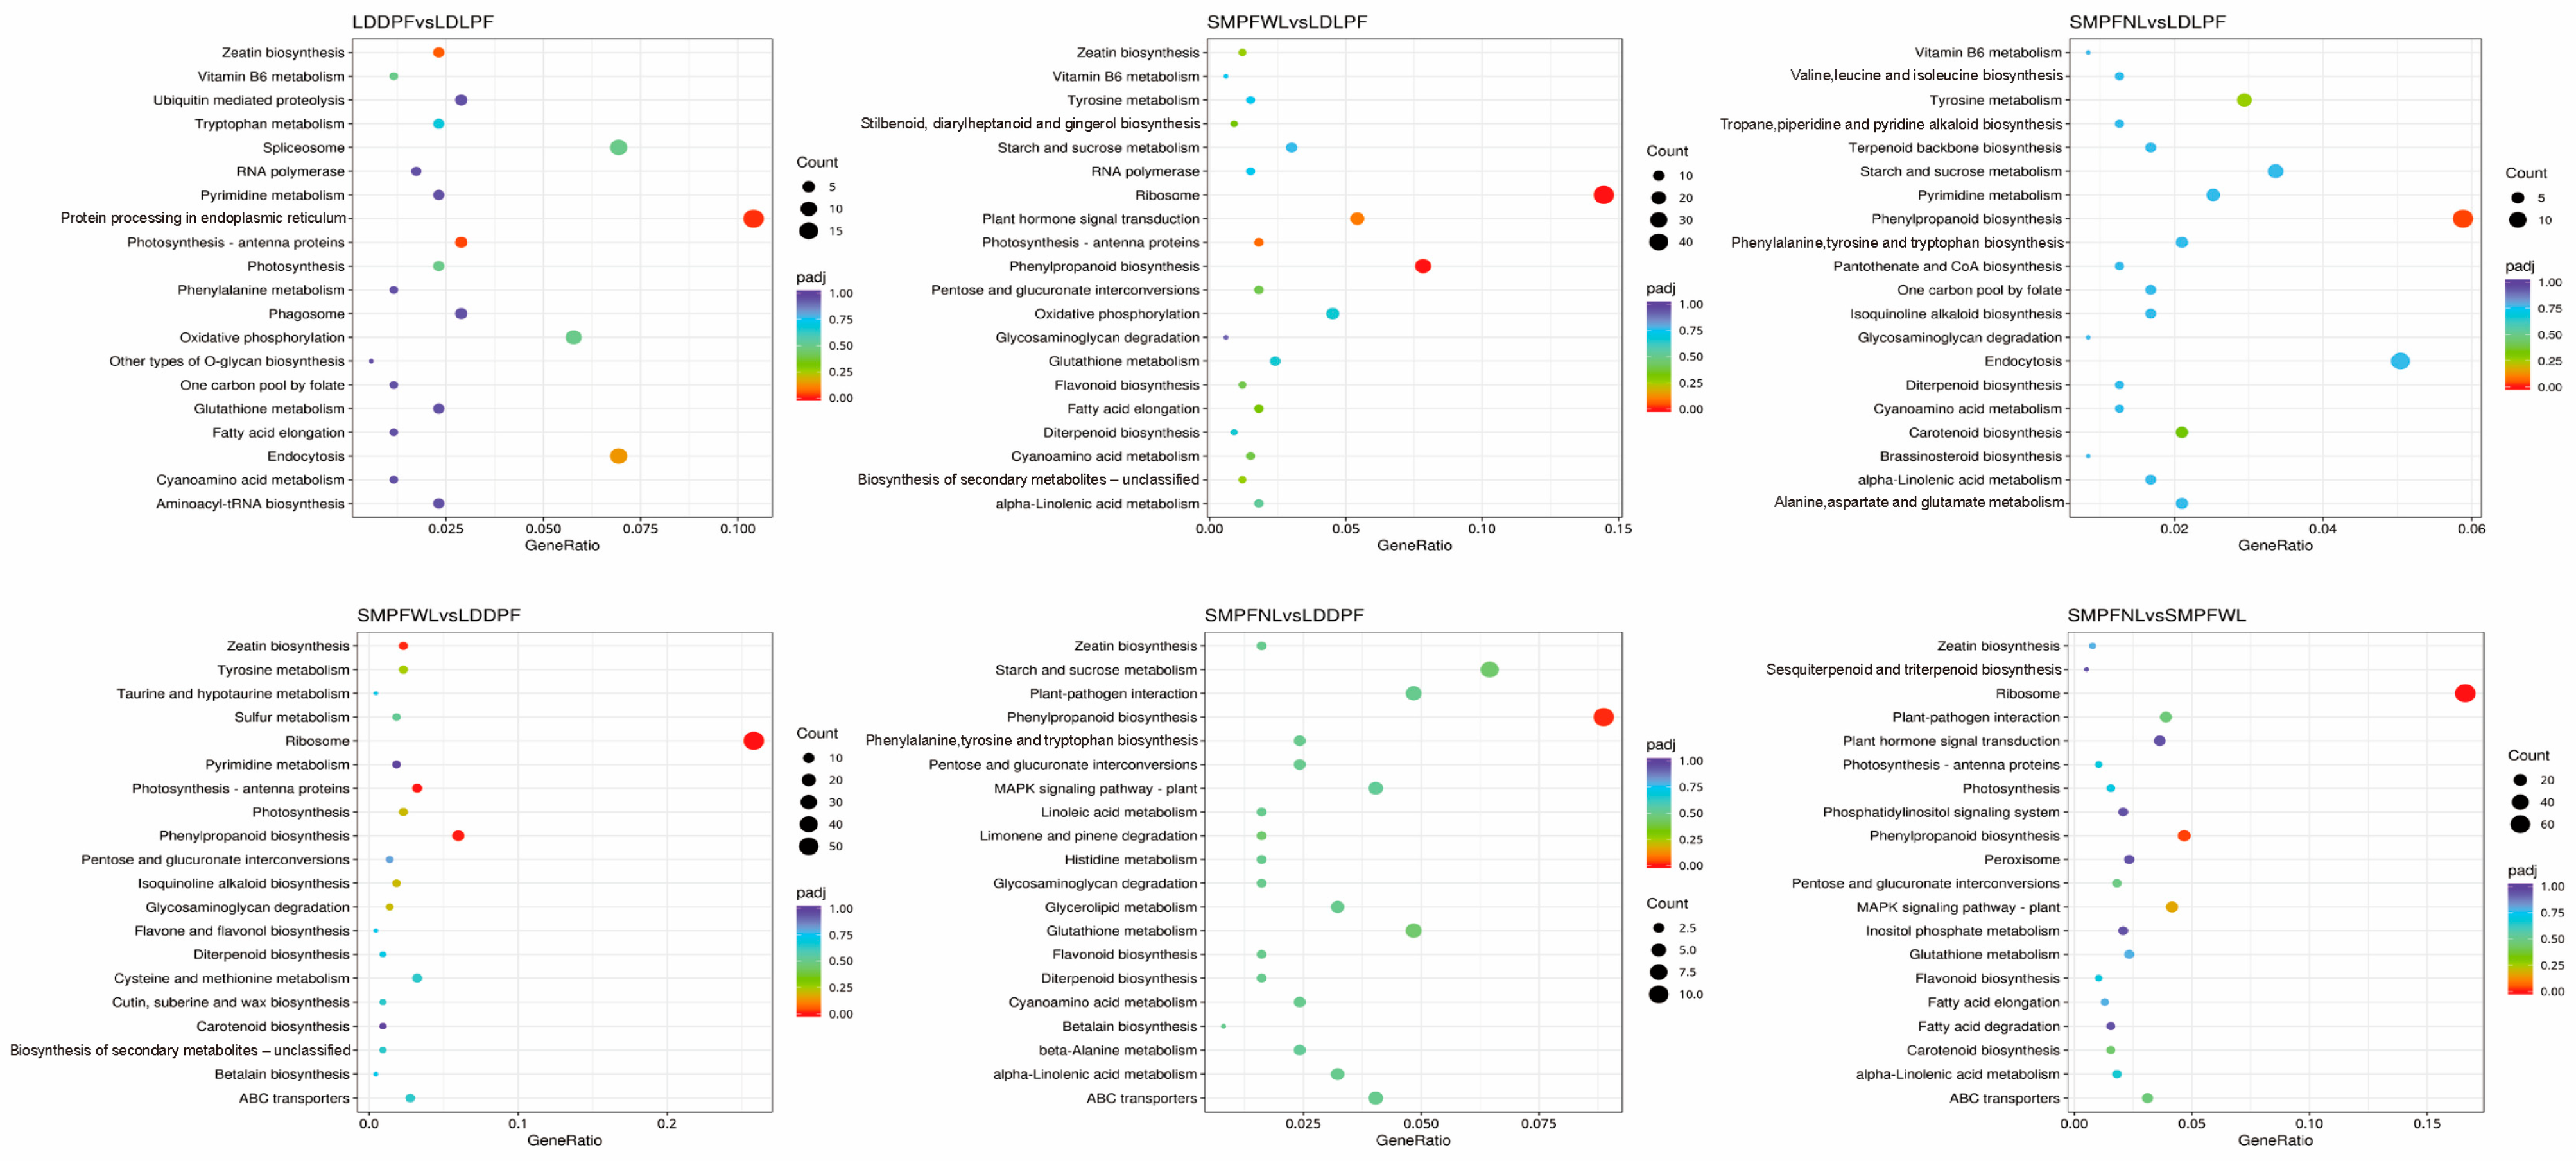
To further delineate metabolic regulatory pathway differences among different B. striata landraces, KEGG enrichment analysis was conducted (Figure 9). In the LDDPP vs. LDLPF comparison, Zein biosynthesis (M00941, M00942, and M00966) and Vitamin B6 metabolism (map00750) pathways exhibited significant gene expression differences. In both the SMPFWL vs. LDLPF and SMPFNL vs. LDDPF comparisons, Vitamin B6 metabolism, phenylpropanoid biosynthesis (map00940 and map01061), and starch and sucrose metabolism (map00500) pathways contained numerous DEGs. In SMPFWL vs. LDDPP, DEGs were abundant in Zein biosynthesis and Taurine and hypotaurine metabolism (map00430), whereas Betalain biosynthesis (map00965) showed no significant differences. In the SMPFNL vs. SMPFWL comparison, sesquiterpenoid and triterpenoid biosynthesis (map00909) and plant–pathogen interaction (map04626) pathways were enriched in DEGs, while genes in fatty acid degradation, histidine metabolism, and cyanamide acid metabolism showed minimal expression changes.

3.9. Analysis of DEGs Related to Militarine Synthesis

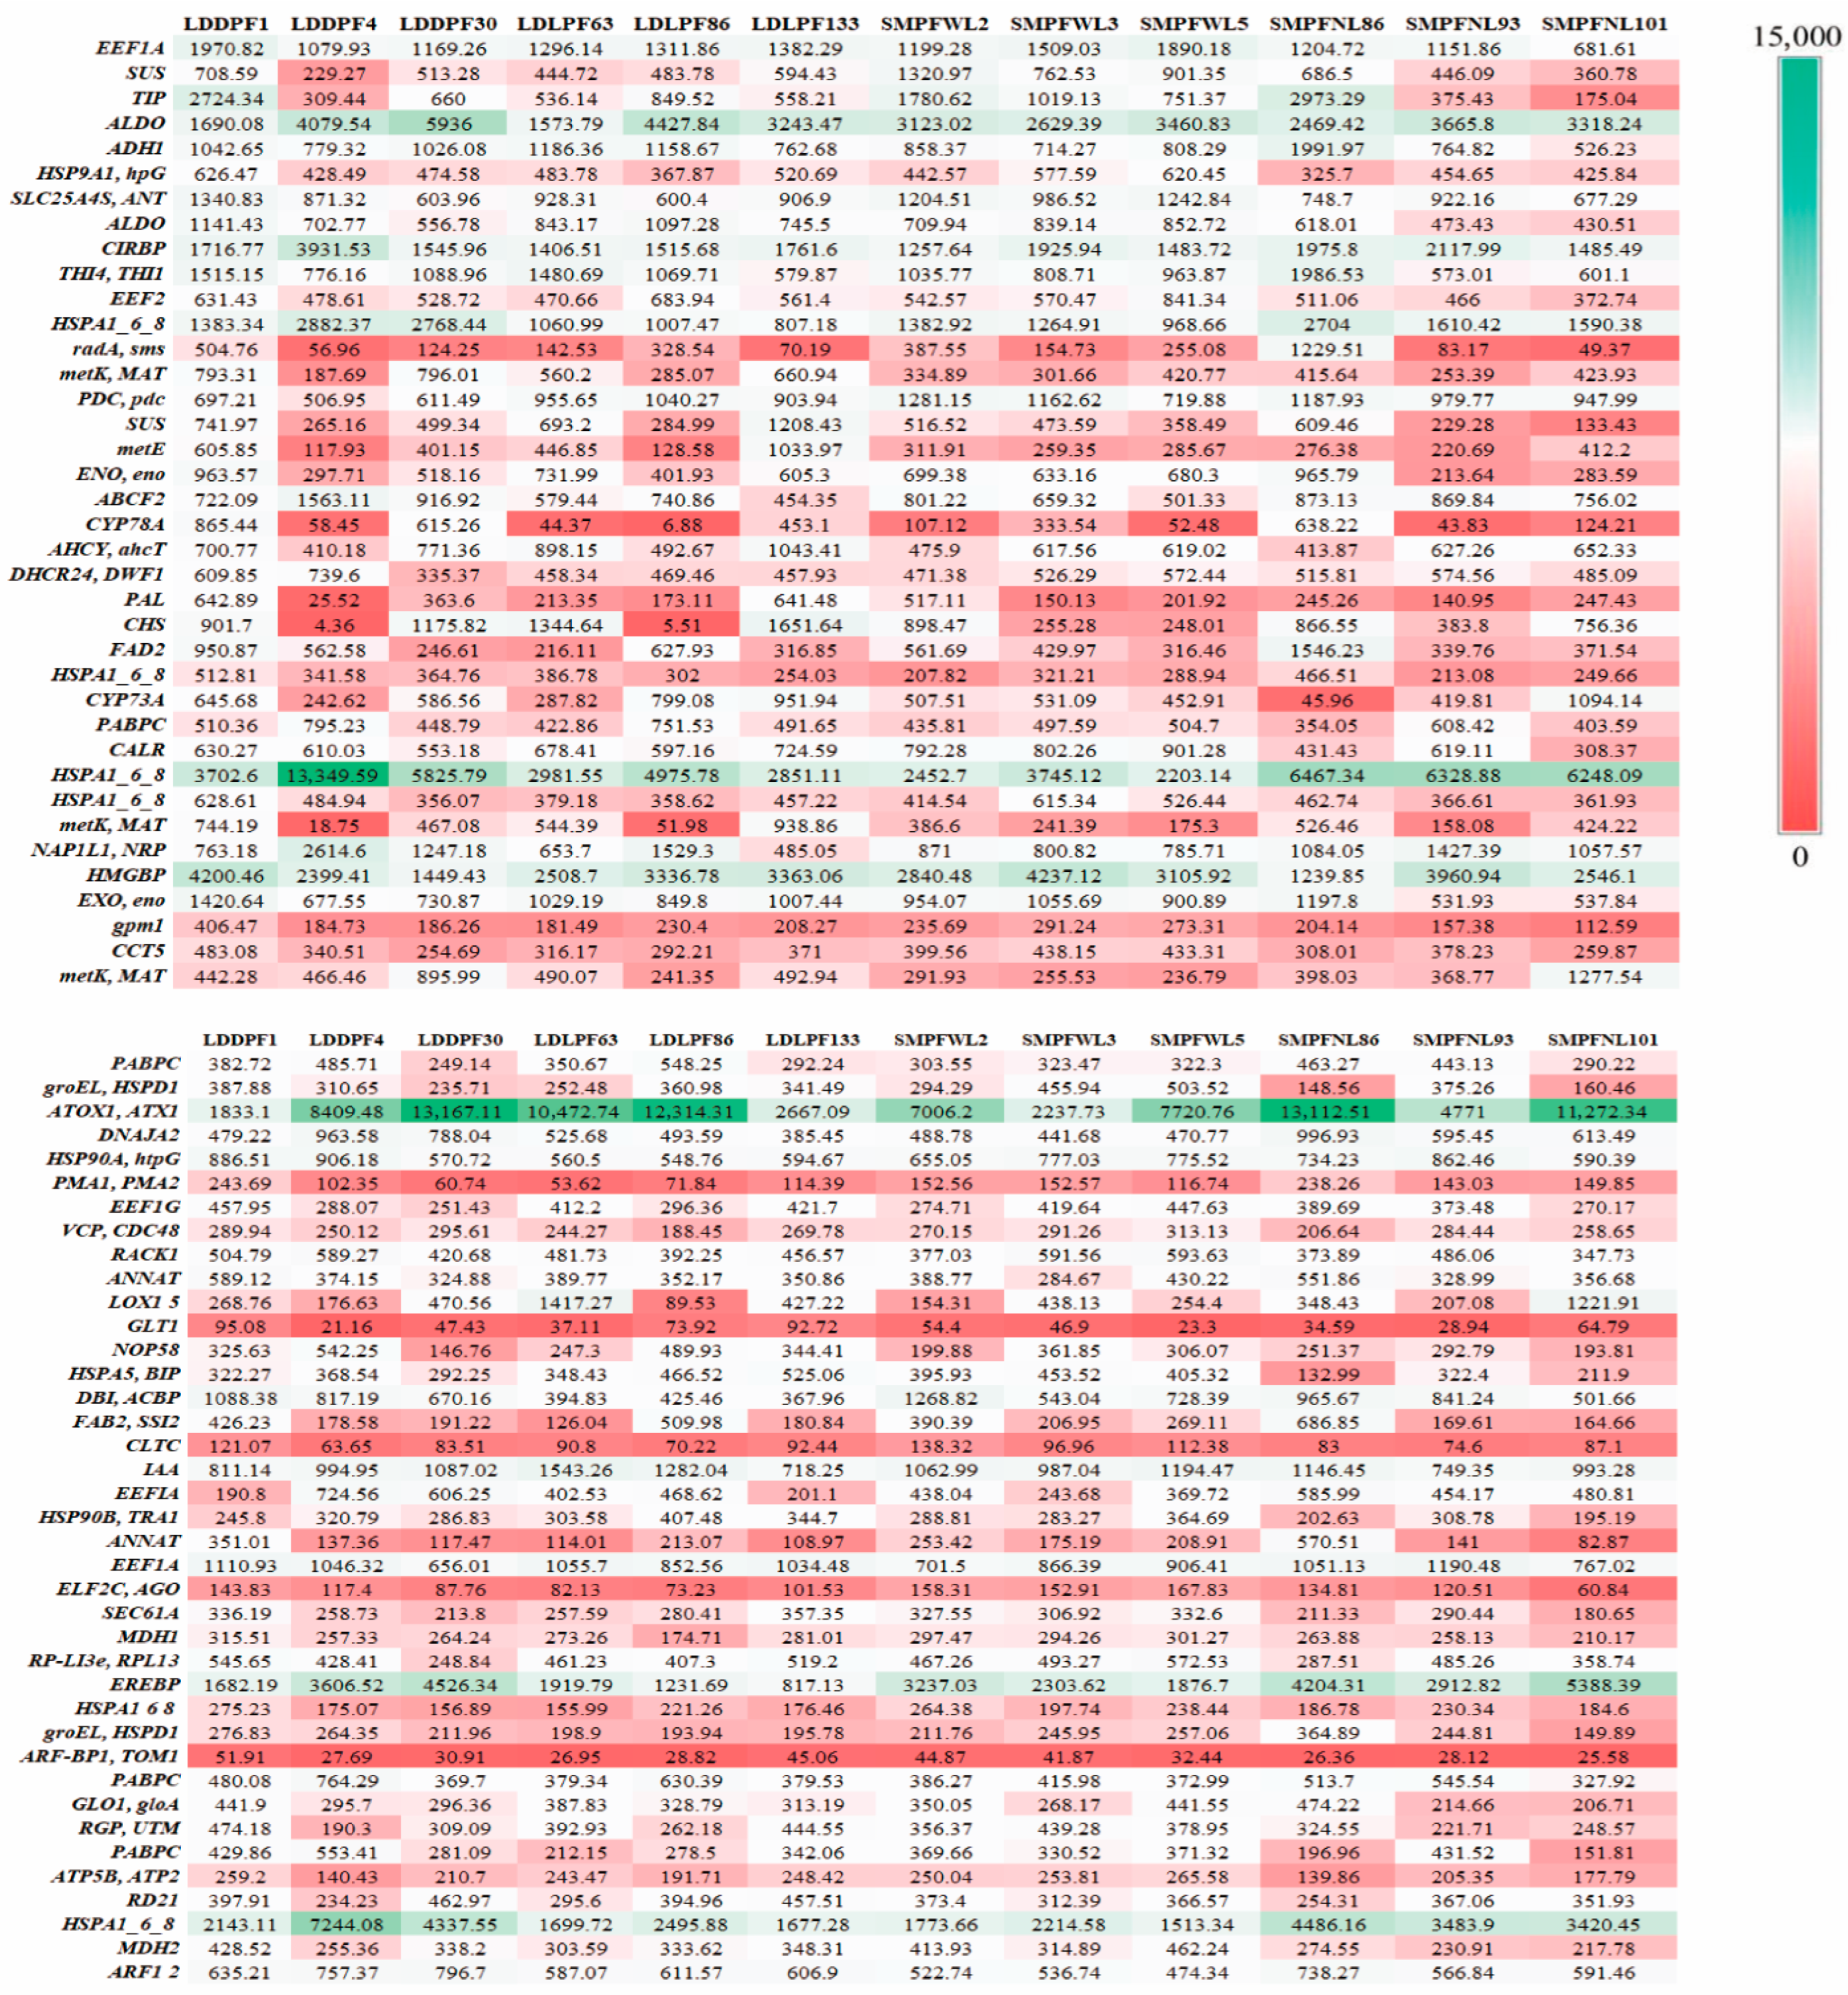
Differential gene expression profoundly influences the growth, development, and metabolism of B. striata suspension cells and is involved in the regulation of numerous metabolic pathways. In particular, the biosynthesis of militarine is closely associated with the phenylalanine metabolism pathway (map00360), the tyrosine metabolism pathway (map00350), and the phenylpropanoid biosynthesis pathway [5,7,14,35]. Precursors and intermediates involved in militarine biosynthesis include 4-coumaric acid, cinnamic acid, p-hydroxybenzoic acid, acetyl-CoA, L-phenylalanine, and L-tyrosine, while key enzymes include tyrosine ammonia-lyase (TAL), phenylalanine ammonia-lyase (PAL), and 4-coumarate-CoA ligase (4CL) [5,7,14,35]. Based on these crucial pathways, this study focused on tyrosine metabolism, phenylalanine metabolism, and phenylpropanoid biosynthesis. Figure 10 shows the expression levels (FPKM) of genes detected across all four B. striata landraces in the tyrosine metabolism, phenylalanine metabolism, and phenylpropanoid biosynthesis pathways. Genes present in every sample were SuSy2, SUS (sucrose synthase, K00695), ALDO (fructose-bisphosphate aldolase, K01623), ADH1 (alcohol dehydrogenase, K18857), HSP90A (heat shock protein, K04079), ANT (adenine nucleotide translocator, K05863), CIRBP (cold-inducible RNA-binding protein), THI4 (thiamine biosynthesis protein Thi4), EEF21A (lysine methyltransferase, K22857), EEF2 (elongation factor, K03231, K03232), MAT, and PDC (pyruvate decarboxylase, K01568). Additional genes with detectable expression included CYP78A, CYP73A (cytochrome P450 family, K20619, K15639), PAL (K10775), 4CL (K01904), AHCY (adenosine homocysteinase), ABCF2 (ATP-binding cassette subfamily F), metE (5-methyltetrahydropteroyltriglutamate-homocysteine methyltransferase, K00549), ENO (enolase), PABPC (polyadenylate-binding protein, K13126), and CKX (cytokinin dehydrogenase, K00279). Among these, SUS, ALDO, HSPA1, HMG8P, ATX1, and EREBP (ethylene-responsive transcription factor, K09286) exhibited significant differential expression across samples. Notably, LDDPF1, LDDPF4, and LDDPF30 exhibited similar expression patterns for most genes, whereas SMPFWL2 and SMPFWL3 displayed divergent patterns.

4. Discussion

4.1. Optimization Strategies for Efficient Suspension Culture Systems

To address the decline of wild B. striata and facilitate sustainable militarine production, we established an integrated suspension culture platform combining growth-kinetic modeling, landrace screening, and medium optimization. We first applied a mathematical growth-kinetics model to four landraces over 0–60 dpi and identified 21 dpi as the exponent phase of militarine accumulation. Among these, SMPF-NL accumulated the highest militarine and precursor levels, designating it as the prime candidate for scale-up and biosynthetic studies. Suspension culture systems operate under controlled environmental conditions, reducing external variability in plant growth and secondary metabolism to ensure stable production [36]. Single-factor trials then defined the optimal nutrient and physical parameters: sucrose at 30–40 g/L, NH4NO3 at 500–750 mg/L, and shaker speeds of 120–150 rpm. Building on these results, a RAM-designed regimen was established for the optimal culture conditions: 1/2 MS medium with 1 mg/L of 6-BA, 3 mg/L of 2,4-D, 0.5 mg/L of NAA, 35 g/L of sucrose, 150 µmol/L of sodium acetate, and 625 mg/L of NH4NO3, cultivated at 135 rpm in darkness. And the resulting predictive model, linking sucrose, NH4NO3, and dissolved-oxygen levels relative to militarine accumulation, demonstrates reliable forecasting performance—but only within the limited, single-factor parameter space we tested—and will require further validation under broader or more complex conditions. In conclusion, this scalable system not only elevates militarine production under our defined experimental settings but also provides a foundational platform for dissecting the molecular regulation of B. striata secondary metabolism.

4.2. Synergistic Regulation Promoting the Synthesis of Secondary Metabolites

The accumulation of secondary metabolites in plants is a complex process influenced by climatic environment, growth, and genetic background [37,38]. Among these, genetic background critically shapes secondary metabolite accumulation by modulating metabolic-pathway efficiency, gene-regulatory networks, and organelle function [39]. Its specific adaptations to culture conditions (temperature, pH, and nutrients) and environmental stresses (osmotic and oxidative) further govern cell growth and survival and secondary-metabolite profiles [40]. Moreover, the functional state of organelles (e.g., chloroplasts and mitochondria) varies among genotypes, which in turn affects energy metabolism and biosynthesis, leading to the production of different secondary metabolites [41,42]. Thus, genetic background ultimately determines the growth and metabolic characteristics of plant cells in suspension cultures through multiple effects. Our work has demonstrated that B. striata landraces impose great control on suspension-cell metabolism. By integrating transcriptomic data, we identified unique gene-expression signatures and energy-metabolism states in SMPF-NL vs. other landraces, suggesting candidate mechanisms underlying its superior militarine yield. This landrace-specific insight lays the groundwork for targeted breeding and genetic engineering of high-value B. striata landraces.
Sucrose, ammonium nitrate concentration, and dissolved oxygen during cell culture can modulate enzyme activities and pathways, further affecting plant growth and secondary metabolite accumulation [43,44]. This has been documented in Ginkgo biloba [45], Solanum lycopersicum [46], Taxus spp. [47], and Salvia miltiorrhiza [48]. In B. striata suspension cultures, sucrose and NH4NO3 synergize to fuel cell growth and the biosynthesis of militarine, dactylorhin A, and HBA. Sucrose supplies energy, carbon skeletons, and osmotic balance, while at high levels, it can induce hyperosmotic stress [49]. NH4NO3 provides nitrogen for amino acids, proteins, and nucleic acids and affects medium pH; in excess, it can cause acid accumulation [50]. Adequate dissolved oxygen ensures efficient respiration and a stable cell cycle; hypoxia triggers anaerobic metabolism and inhibits growth [51]. By optimizing these three parameters, we shorten culture times and precisely regulate secondary metabolite accumulation, laying a solid foundation for genetic elucidation and scalable militarine production.

4.3. Co-Regulation of Agronomic Traits on Gene Expression and Metabolic Pathways

Genotype-specific differences in gene expression regulation were observed among different B. striata landraces, resulting in altered downstream gene expression patterns and affecting various physiological functions. This comparative transcriptomic analysis across different B. striata landraces revealed that the BW correlates strongly with global gene-expression divergence in suspension cultures. While this association suggests BW may reflect underlying transcriptomic variation, we acknowledge that causality has not been established and that an unmeasured variable could influence both traits. Moreover, variation in leaf architecture showed a higher correlation with cell growth and metabolic potential than flower-color intensity, but its true predictive power will require further experimental validation. GO enrichment analysis revealed significant enrichment of the protein tag pathway, implying landrace-specific differences in protein processing, sorting, and turnover that affect cellular proteostasis [52]. Enrichment of the immune system process indicates potential variations among landraces in responses to pathogen infection and immune regulation, while antioxidant activity enrichment points to differences in oxidative stress response, influencing cell and tissue longevity and function [53]. We hypothesize that a higher antioxidant capacity in certain landraces limits ROS accumulation during rapid proliferation, thereby sustaining cell viability under suspension-culture conditions. Carbohydrate metabolic process enrichment affects energy-demanding activities, such as growth and motility, whereas enrichment of isomerase activity may alter the direction and rate of metabolic pathways, impacting metabolite production [49,54]. Differences in lipid binding suggest variability in membrane composition and energy storage, affecting cell function and viability [55]. Altered sterol-binding proteins may fine-tune membrane fluidity, which in turn influences the vesicle-mediated transport of secreted metabolites. Across these six pairwise comparisons, numerous genes associated with diverse biological processes exhibited significant differential expression, highlighting the high diversity of gene expression even among related samples or similar biological types, which may reflect distinct environmental adaptation, growth, and metabolic strategies among B. striata landraces.
The militarine biosynthesis is closely linked to the phenylalanine metabolism, tyrosine metabolism, and phenylpropanoid biosynthesis pathways [5,13,14]. This KEGG-based interrogation goes beyond confirming the central roles of phenylpropanoid pathways in militarine accumulation and also uncovers a coordinated regulatory network involving post-translational, transcriptional, energetic, and stress-response modules that together drive secondary-metabolite output. Specifically, the enrichment of DEGs in ER protein processing (map04141) highlights the importance of enzyme folding and maturation in optimizing flux through biosynthetic machinery [56]. Concurrent upregulation of pyrimidine metabolism (map00240) and plant-hormone signaling (map04075) points to tight integration of gene-expression controls and developmental cues, while the enhanced expression of photosynthesis (map00195) and sucrose metabolism (map00500) genes underscores the necessity of robust carbon and energy supply for precursor provisioning. However, the enrichment of photosynthesis-related genes and thylakoid component annotations in non-photosynthetic suspension cells is unexpected. We propose that these transcripts may originate from residual or partially differentiated plastids (e.g., leucoplasts or proplastids) that retain expression of thylakoid-associated machinery for non-photosynthetic roles—such as lipid assembly, redox buffering, or metabolic signaling. Moreover, significant enrichment of vitamin B6 metabolism (map00750) likely boosts pyridoxal-5′-phosphate–dependent aminotransferase activity, directly feeding phenylalanine and tyrosine pools toward militarine biosynthesis. Finally, the co-activation of MAPK signaling (map04016), flavonoid biosynthesis (map00941), and plant–pathogen interaction (map04626) pathways reveals a cross-talk between stress adaptation and secondary metabolism that may fine-tune militarine accumulation [5,57,58]. Enrichment of sesquiterpenoid and triterpenoid biosynthesis (map00909) in some comparisons further suggests that upstream terpenoid intermediates might compete with or complement phenylpropanoid fluxes, offering additional leverage points for engineering. Together, these insights not only illuminate the multifaceted regulation behind SMPF-NL’s superior yield but also provide precise targets for metabolic engineering and breeding of high-value B. striata landraces.

4.4. The Role of Key Regulatory Genes in Militarine Synthesis Pathways

Militarine biosynthesis is closely associated with the regulation of numerous genes [5,59]. By screening for genes that are highly co-expressed across different B. striata landraces, a series of genes closely related to militarine biosynthesis have been identified that exhibit common functional roles and expression characteristics in plants and share certain features within Orchidaceae. The biosynthetic pathways for phenylpropanoids, flavonoids, and polyphenols are highly conserved in orchids, and members of the PAL, 4CL, and CYP450 gene families perform similar functions in secondary metabolite synthesis in other orchid genera, such as Phalaenopsis and Dendrobium [60,61]. Glycosidases in plants catalyze the hydrolysis of glycosidic bonds, promoting the synthesis and conversion of secondary metabolites [62]. Phenylalanine and tyrosine produced via the phenylpropanoid pathway serve as precursors for various secondary metabolites, some of which exist in glycosylated forms [63]; thus, glycosidase activity may directly influence their biosynthesis and transformation. The MAPK signaling pathway and plant hormone signal transduction likely regulate glycosidase expression and activity. Additionally, alterations in gene expression within the plant–pathogen interaction pathway may be linked to glycosidase activity and affect disease resistance.
Orchid species typically confront complex growth environments, and glycoside hydrolysis products may participate in environmental adaptability and defense signal transduction [64]. Genes such as HSP90A, CIRBP, and ADH1 are commonly stress-induced and contribute to stress responses in other orchids, aiding adaptation to adverse conditions [65]. Genes including CKX, EEF2, and THI4 play critical roles in cell division, protein synthesis, and vitamin metabolism among various plants, such as potato and soybean [66,67]. These genes not only regulate growth and development but also impact morphology and metabolic activity. Among these candidates, the BGLU gene family (including BGLU20 and BGLU22) rank as top priorities for future validation based on their high co-expression correlation with militarine accumulation and strong conservation across Orchidaceae. β-Glucosidases catalyze the hydrolysis of glycosidic bonds, thereby activating or releasing glycosylated defense compounds and signaling molecules and may significantly influence the accumulation of militarine and related metabolites. In summary, these genes perform universal functions and display conserved expression patterns in plants and especially within Orchidaceae. They share roles in secondary metabolism, stress response, and growth-development regulation. However, although these key genes have been identified, their precise expression patterns merit further study by using gene editing or overexpression/silencing experiments to validate the specific roles of individual genes in secondary metabolite biosynthesis and adaptability. Overall, these genes may operate via similar regulatory mechanisms or functions in other orchids, providing an important molecular foundation for militarine biosynthesis and other secondary metabolites.

5. Conclusions

A comparative analysis of four B. striata landraces revealed that SMPF-NL accumulated the highest levels of militarine, and optimized suspension culture conditions (half-strength MS with 1 mg/L of 6-BA, 3 mg/L of 2,4-D, 0.5 mg/L of NAA, 35 g/L of sucrose, 150 µM of sodium acetate, and 625 mg/L of NH4NO3, cultivated at 135 rpm in the dark) enabled high-yield callus proliferation and shortened subculture cycles. Metabolic pathway analysis indicated that phenylpropanoid, tyrosine, starch, and sucrose metabolism, along with glycolysis and the pentose phosphate pathway, synergistically contribute to militarine biosynthesis. Transcriptomic analysis revealed genes supporting stable growth (SuSy2, SUS, ALDO, ADH1, HSP90A, ANT, CIRBP, THI4, EEF1A, EEF2, MAT, and PDC) and key regulators of militarine accumulation (AOC3, COMT, GOT2, ADH1, MAOB, BGLU20, and BGLU22). This study synthesizes these findings into the first scalable, controllable platform for militarine production from suspension cultures and defines a coordinated metabolic regulatory network driving secondary metabolite biosynthesis. By coupling media and environmental optimization with transcriptomic insights, we deliver a prioritized set of high-confidence candidate genes (the BGLU gene family) poised for targeted metabolic engineering across Orchidaceae. Future work will focus on functional validation of the BGLU gene family and core phenylpropanoid enzymes via CRISPR/Cas9 knockouts and overexpression studies. These efforts will deepen our mechanistic understanding of militarine biosynthesis and accelerate the development of sustainable, high-efficiency production systems for militarine.

Supplementary Materials

The following supporting information can be downloaded at: https://www.mdpi.com/article/10.3390/horticulturae11111315/s1, Figure S1. Four different landraces of B. striata forms; Figure S2. Three common assembly and sequencing methods for omics data: Greedy incremental clustering method, De Bruijn graph and Overlap–Layout–Consensus algorithm process; Figure S3. The results of agarose gel electrophoresis and SSR electrophoresis amplification in 13 B. striata landraces. 1× TBE buffer, room temperature, stacking gel (80 V, 20 min), and resolving gel (120 V, 45 min); Figure S4. Correlation analysis between agronomic traits of B. striata; Figure S5. Militarine metabolic pathway and its key precursors; Figure S6. Single-factor B. striata cell suspension culture experiment of three culture conditions; Figure S7. The growth status of B. striata suspension culture cells in response to surface experiments; Table S1. Main experimental reagents in cell suspension culture; Table S2. HPLC gradient elution program; Table S3. Main experimental reagents in transcriptome sequencing; Table S4. Software and methods used for sequencing analysis.

Author Contributions

Y.L., M.X., N.Y., and D.X. designed the experiments. M.X., H.L., W.W., L.L., L.Y., S.V., and V.S. performed the experiments. Y.L., M.X., H.L., and D.X. carried out the analysis. Y.L., M.X., and D.X. originally wrote and reviewed the manuscript. D.X. conceived, supervised, founded, and administrated the project. All authors have read and agreed to the published version of the manuscript.

Funding

This research received financial support from various sources, including the National Natural Science Foundation of China (32260089), the Science and Technology Department Foundation of Guizhou Province (QKHJC-MS [2025]371), the Project of the Ministry of Education of China (2025030310008), the 12345 Future Talent Cultivation Plan of Zunyi Medical University (XJ2023-JX-01-06), the first batch of Class Advisor Studios at Zunyi Medical University (2024BZR-01), and the Undergraduate Education and Teaching Reform Project of Zunyi Medical University (XJKCSZ2023-9 and XJJG2024-09).

Data Availability Statement

The original contributions presented in this study are included in the article and Supplementary Material. Further inquiries can be directed to the corresponding authors.

Acknowledgments

We acknowledge the assistance of figure drawing by Adobe Illustrator 2024.

Conflicts of Interest

All authors approve of the final version of the manuscript and declare that there is no conflict of interest that could be perceived as prejudicial to the impartiality of the reported research.

Abbreviations

The following abbreviations are used in this manuscript:
B. striataBletilla striata
RSMResponse surface methodology
DpiDays post-inoculation
BLBlade length
BWBlade width
LWRBLength–width ratio of blade
PLPlant length
FNFlower number
FWFresh weight
DWDry weight
RpmRevolutions per minute
HPLCHigh-performance liquid chromatography
OLCOverlap–layout–consensus
PPIProtein–protein interaction
SSRsSimple sequence repeats
HBAp-Hydroxybenzyl
SDStandard deviation
CVCoefficient of variation
DEGDifferentially expressed gene
LDDPFLD, germplasm nursery identifier; DPF, deep purple flower
LDLPFLD, germplasm nursery identifier; LPF, light purple flower
SMPFWLSM, germplasm nursery identifier; PF, purple flower; WL, wide leaf
SMPFNLSM, germplasm nursery identifier; PF, purple flower; NL, narrow leaf
TALTyrosine ammonia-lyase
PALPhenylalanine ammonia-lyase
4CL4-coumarate-CoA ligase

References

  1. Li, L.; Liu, H.; Wen, W.; Huang, C.; Li, X.; Xiao, S.; Wu, M.; Shi, J.; Xu, D. Full Transcriptome Analysis of Callus Suspension Culture System of Bletilla striata. Front. Genet. 2020, 11, 995. [Google Scholar] [CrossRef]
  2. Xu, D.; Pan, Y.; Chen, J. Chemical Constituents, Pharmacologic Properties, and Clinical Applications of Bletilla striata. Front. Pharmacol. 2019, 10, 1168. [Google Scholar] [CrossRef]
  3. He, X.; Wang, X.; Fang, J.; Zhao, Z.; Huang, L.; Guo, H.; Zheng, X. Bletilla striata: Medicinal uses, phytochemistry and pharmacological activities. J. Ethnopharmacol. 2017, 195, 20–38. [Google Scholar] [CrossRef] [PubMed]
  4. Xu, D.-L.; Pan, Y.-C.; Li, L.; ShangGuan, Y.-N.; Zhang, S.-B.; Liu, G.-Y.; Cheng, L.; Xiao, S.-J. Chemical constituents of Bletilla striata. J. Asian Nat. Prod. Res. 2019, 21, 1184–1189. [Google Scholar] [CrossRef] [PubMed]
  5. Jia, X.; Li, Y.; Chen, L.; Xiao, Y.; Yang, N.; Luo, H.; Guan, J.; Xu, D. Identification and comparative genomic analysis of endophytic fungi in Bletilla striata and its potential for promoting militarine bioaccumulation. Fitoterapia 2025, 181, 106356. [Google Scholar] [CrossRef]
  6. Wu, T.; Kerbler, S.M.; Fernie, A.R.; Zhang, Y. Plant cell cultures as heterologous bio-factories for secondary metabolite production. Plant Commun. 2021, 2, 100235. [Google Scholar] [CrossRef]
  7. Pan, Y.; Li, L.; Xiao, S.; Chen, Z.; Sarsaiya, S.; Zhang, S.; ShangGuan, Y.; Liu, H.; Xu, D. Callus growth kinetics and accumulation of secondary metabolites of Bletilla striata Rchb.f. using a callus suspension culture. PLoS ONE 2020, 15, e0220084. [Google Scholar] [CrossRef]
  8. Murthy, H.N.; Paek, K.Y. Panax ginseng Adventitious Root Suspension Culture: Protocol for Biomass Production and Analysis of Ginsenosides by High Pressure Liquid Chromatography. Methods Mol. Biol. 2016, 1391, 125–139. [Google Scholar] [CrossRef]
  9. Linh, T.M.; Mai, N.C.; Hoe, P.T.; Ngoc, N.T.; Thao, P.T.H.; Ban, N.K.; Van, N.T. Development of a Cell Suspension Culture System for Promoting Alkaloid and Vinca Alkaloid Biosynthesis Using Endophytic Fungi Isolated from Local Catharanthus roseus. Plants 2021, 10, 672. [Google Scholar] [CrossRef]
  10. azquez-Marquez, A.M.; Bernabé-Antonio, A.; Correa-Basurto, J.; Burrola-Aguilar, C.; Zepeda-Gómez, C.; Cruz-Sosa, F.; Nieto-Trujillo, A.; Estrada-Zúñiga, M.E. Changes in Growth and Heavy Metal and Phenolic Compound Accumulation in Buddleja cordata Cell Suspension Culture under Cu, Fe, Mn, and Zn Enrichment. Plants 2024, 13, 1147. [Google Scholar] [CrossRef]
  11. Kim, J.-H.; Han, J.-E.; Murthy, H.N.; Kim, J.-Y.; Kim, M.-J.; Jeong, T.-K.; Park, S.-Y. Production of Secondary Metabolites from Cell Cultures of Sageretia thea (Osbeck) M.C. Johnst. Using Balloon-Type Bubble Bioreactors. Plants 2023, 12, 1390. [Google Scholar] [CrossRef]
  12. Lv, S.; Ding, F.; Zhang, S.; Nosov, A.M.; Kitashov, A.V.; Yang, L. Induction and Suspension Culture of Panax japonicus Callus Tissue for the Production of Secondary Metabolic Active Substances. Plants 2024, 13, 2480. [Google Scholar] [CrossRef] [PubMed]
  13. Xu, S.; Zhang, Y.; Liang, F.; Jiang, S.; Niu, S.; Wang, X.; Zhou, Y.; Cui, B.; Yuan, X. Metabolomic and transcriptomic analyses reveal the mechanism of polysaccharide and secondary metabolite biosynthesis in Bletilla striata tubers in response to shading. Int. J. Biol. Macromol. 2024, 279 Pt 4, 135545. [Google Scholar] [CrossRef] [PubMed]
  14. Xu, M.; Li, H.; Luo, H.; Liu, J.; Li, K.; Li, Q.; Yang, N.; Xu, D. Unveiling the Role of β-Glucosidase Genes in Bletilla striata’s Secondary Metabolism: A Genome-Wide Analysis. Int. J. Mol. Sci. 2024, 25, 13191. [Google Scholar] [CrossRef]
  15. Zhou, G.L.; Zhu, P. De novo transcriptome sequencing of Rhododendron molle and identification of genes involved in the biosynthesis of secondary metabolites. BMC Plant Biol. 2020, 20, 414. [Google Scholar] [CrossRef]
  16. Meng, K.; Lv, J.; Zhang, T.; Liu, Y.; Zhang, P.; Zhang, Y.; Hu, B.; Huang, Q.; Xie, B.; Fu, J. Chromosome-Scale Genome and Transcriptomic Analyses Reveal Differential Regulation of Terpenoid Secondary Metabolites in Hericium coralloides. J. Fungi 2024, 10, 704. [Google Scholar] [CrossRef]
  17. Zhu, M.; Hsu, C.-W.; Ogorek, L.L.P.; Taylor, I.W.; La Cavera, S.; Oliveira, D.M.; Verma, L.; Mehra, P.; Mijar, M.; Sadanandom, A.; et al. Single-cell transcriptomics reveal how root tissues adapt to soil stress. Nature 2025, 642, 721–729. [Google Scholar] [CrossRef]
  18. Lu, C.H.; Engelmann, N.J.; Lila, M.A.; Erdman, J.W., Jr. Optimization of lycopene extraction from tomato cell suspension culture by response surface methodology. J. Agric. Food Chem. 2008, 56, 7710–7714. [Google Scholar] [CrossRef]
  19. Zhang, L.; Kawaguchi, R.; Enomoto, T.; Nishida, S.; Burow, M.; Maruyama-Nakashita, A. Glucosinolate Catabolism Maintains Glucosinolate Profiles and Transport in Sulfur-Starved Arabidopsis. Plant Cell Physiol. 2023, 64, 1534–1550. [Google Scholar] [CrossRef]
  20. Xu, H.; Wang, Z.; Li, Y.; He, J.; Wu, X. Dynamic growth models for Caragana korshinskii shrub biomass in China. J. Env. Environ. Manag. 2020, 269, 110675. [Google Scholar] [CrossRef]
  21. Nahar, L.; Chaiwut, P.; Sangthong, S.; Theansungnoen, T.; Sarker, S.D. Progress in the analysis of phytocannabinoids by HPLC and UPLC (or UHPLC) during 2020–2023. Phytochem Anal 2024, 35, 927–989. [Google Scholar] [CrossRef] [PubMed]
  22. Miller, J.R.; Koren, S.; Sutton, G. Assembly algorithms for next-generation sequencing data. Genomics 2010, 95, 315–327. [Google Scholar] [CrossRef] [PubMed]
  23. Tycko, J.; Van, M.V.; DelRosso, N.; Ye, H.; Yao, D.; Valbuena, R.; Vaughan-Jackson, A.; Xu, X.; Ludwig, C.; Spees, K.; et al. Development of compact transcriptional effectors using high-throughput measurements in diverse contexts. Nat. Biotechnol. 2025, 43, 1525–1538. [Google Scholar] [CrossRef] [PubMed]
  24. Huckvale, E.; Moseley, H.N.B. kegg_pull: A software package for the RESTful access and pulling from the Kyoto Encyclopedia of Gene and Genomes. BMC Bioinform. 2023, 24, 78. [Google Scholar] [CrossRef]
  25. Depuydt, T.; De Rybel, B.; Vandepoele, K. Charting plant gene functions in the multi-omics and single-cell era. Trends Plant Sci. 2023, 28, 283–296. [Google Scholar] [CrossRef]
  26. Li, B.; Dewey, C.N. RSEM: Accurate transcript quantification from RNA-Seq data with or without a reference genome. BMC Bioinform. 2011, 12, 323. [Google Scholar] [CrossRef]
  27. Yu, X.; Xie, L.; Ge, J.; Li, H.; Zhong, S.; Liu, X. Integrating single-cell RNA-seq and spatial transcriptomics reveals MDK-NCL dependent immunosuppressive environment in endometrial carcinoma. Front. Immunol. 2023, 14, 1145300. [Google Scholar] [CrossRef]
  28. Weng, J.; Wu, X.F.; Shao, P.; Liu, X.P.; Wang, C.X. Medicine for chronic atrophic gastritis: A systematic review, meta- and network pharmacology analysis. Ann. Med. 2023, 55, 2299352. [Google Scholar] [CrossRef]
  29. Chen, J.; Amdanee, N.; Zuo, X.; Wang, Y.; Gong, M.; Yang, Y.; Li, H.; Zhang, X.; Zhang, C. Biomarkers of bipolar disorder based on metabolomics: A systematic review. J. Affect. Disord. 2024, 350, 492–503. [Google Scholar] [CrossRef]
  30. Love, M.I.; Huber, W.; Anders, S. Moderated estimation of fold change and dispersion for RNA-seq data with DESeq2. Genome Biol. 2014, 15, 550. [Google Scholar] [CrossRef]
  31. Robinson, M.D.; McCarthy, D.J.; Smyth, G.K. edgeR: A Bioconductor package for differential expression analysis of digital gene expression data. Bioinformatics 2010, 26, 139–140. [Google Scholar] [CrossRef]
  32. Szklarczyk, D.; Kirsch, R.; Koutrouli, M.; Nastou, K.; Mehryary, F.; Hachilif, R.; Gable, A.L.; Fang, T.; Doncheva, N.T.; Pyysalo, S.; et al. The STRING database in 2023, protein-protein association networks and functional enrichment analyses for any sequenced genome of interest. Nucleic Acids Res. 2023, 51, D638–D646. [Google Scholar] [CrossRef] [PubMed]
  33. Sang, M.K.; Patnaik, H.H.; Park, J.E.; Song, D.K.; Jeong, J.Y.; Hong, C.E.; Kim, Y.T.; Shin, H.J.; Ziwei, L.; Hwang, H.J.; et al. Transcriptome analysis of Haemaphysalis flava female using Illumina HiSeq 4000 sequencing: De novo assembly, functional annotation and discovery of SSR markers. Parasit Vectors 2023, 16, 367. [Google Scholar] [CrossRef] [PubMed]
  34. Chen, J.; Zhao, Q.; Xie, K.; Wang, M.; Li, L.; Zeng, D.; Wang, Q.; Wang, S.; Chen, A.; Xu, G. A Mycorrhiza-Induced UDP-Glucosyl Transferase Negatively Regulates the Arbuscular Mycorrhizal Symbiosis. Plant Cell Environ. 2025, 48, 1643–1655. [Google Scholar] [CrossRef]
  35. Li, L.; Hao, B.; Zhang, Y.; Ji, S.; Chou, G. Metabolite Profiling and Distribution of Militarine in Rats Using UPLC-Q-TOF-MS/MS. Molecules 2020, 25, 1082. [Google Scholar] [CrossRef]
  36. Liu, H.; Huang, C.; Li, Q.; Wang, M.; Xiao, S.; Shi, J.; He, Y.; Wen, W.; Li, L.; Xu, D. Genome-Wide Identification of Genes Related to Biosynthesis of Phenolic Acid Derivatives in Bletilla striata at Different Suspension Culture Stages. Front. Plant Sci. 2022, 13, 875404. [Google Scholar] [CrossRef]
  37. Wu, X.; Xia, M.; Su, P.; Zhang, Y.; Tu, L.; Zhao, H.; Gao, W.; Huang, L.; Hu, Y. MYB transcription factors in plants: A comprehensive review of their discovery, structure, classification, functional diversity and regulatory mechanism. Int. J. Biol. Macromol. 2024, 282 Pt 2, 136652. [Google Scholar] [CrossRef]
  38. Liu, W.; Feng, Y.; Yu, S.; Fan, Z.; Li, X.; Li, J.; Yin, H. The Flavonoid Biosynthesis Network in Plants. Int. J. Mol. Sci. 2021, 22, 12824. [Google Scholar] [CrossRef]
  39. Peng, L.; Ru, M.; Liang, Z. Variation of photosynthesis, secondary metabolites and antioxidant activities in third generation of spaceflight-induced Salvia miltiorrhiza. Chin. Herb. Med. 2022, 14, 592–601. [Google Scholar] [CrossRef]
  40. Song, X.; Tang, S.; Liu, H.; Meng, Y.; Luo, H.; Wang, B.; Hou, X.-L.; Yan, B.; Yang, C.; Guo, Z.; et al. Inheritance of acquired adaptive cold tolerance in rice through DNA methylation. Cell 2025, 188, 4213–4224.e12. [Google Scholar] [CrossRef]
  41. Li, Y.; Zhang, Y.; He, X.; Guo, Z.; Yang, N.; Bai, G.; Zhao, J.; Xu, D. The Mitochondrial Blueprint: Unlocking Secondary Metabolite Production. Metabolites 2024, 14, 711. [Google Scholar] [CrossRef]
  42. Song, Y.; Feng, L.; Alyafei, M.A.M.; Jaleel, A.; Ren, M. Function of Chloroplasts in Plant Stress Responses. Int. J. Mol. Sci. 2021, 22, 13464. [Google Scholar] [CrossRef]
  43. Smetanska, I. Production of secondary metabolites using plant cell cultures. Adv. Biochem. Eng. Biotechnol. 2008, 111, 187–228. [Google Scholar] [CrossRef]
  44. Zhan, X.; Chen, Z.; Chen, R.; Shen, C. Environmental and Genetic Factors Involved in Plant Protection-Associated Secondary Metabolite Biosynthesis Pathways. Front. Plant Sci. 2022, 13, 877304. [Google Scholar] [CrossRef]
  45. Murthy, H.N.; Yadav, G.G.; Paek, K.Y.; Park, S.Y. Production of Terpene Trilactones from Cell and Organ Cultures of Ginkgo biloba. Plants 2024, 13, 2575. [Google Scholar] [CrossRef]
  46. Ahanger, M.A.; Qin, C.; Maodong, Q.; Dong, X.X.; Ahmad, P.; Allah, E.F.A.; Zhang, L. Spermine application alleviates salinity induced growth and photosynthetic inhibition in Solanum lycopersicum by modulating osmolyte and secondary metabolite accumulation and differentially regulating antioxidant metabolism. Plant Physiol. Biochem. 2019, 144, 1–13. [Google Scholar] [CrossRef]
  47. Howat, S.; Park, B.; Oh, I.S.; Jin, Y.W.; Lee, E.K.; Loake, G.J. Paclitaxel: Biosynthesis, production and future prospects. N. Biotechnol. 2014, 31, 242–245. [Google Scholar] [CrossRef]
  48. Lv, B.; Feng, Q.; Shao, G.; Zuo, A.; Yan, X.; Liu, J.; Dong, J.; Ma, P. The transcription factor Dof32 coordinates salvianolic acid biosynthesis and drought tolerance in Salvia miltiorrhiza. Plant Physiol. 2025, 198, kiaf221. [Google Scholar] [CrossRef]
  49. Ruan, Y.L. Sucrose metabolism: Gateway to diverse carbon use and sugar signaling. Annu. Rev. Plant Biol. 2014, 65, 33–67. [Google Scholar] [CrossRef]
  50. Diniz, S.C.; Taciro, M.K.; Gomez, J.G.; da Cruz Pradella, J.G. High-cell-density cultivation of Pseudomonas putida IPT 046 and medium-chain-length polyhydroxyalkanoate production from sugarcane carbohydrates. Appl. Biochem. Biotechnol. 2004, 119, 51–70. [Google Scholar] [CrossRef]
  51. Titova, M.; Popova, E.; Nosov, A. Bioreactor Systems for Plant Cell Cultivation at the Institute of Plant Physiology of the Russian Academy of Sciences: 50 Years of Technology Evolution from Laboratory to Industrial Implications. Plants 2024, 13, 430. [Google Scholar] [CrossRef]
  52. Ge, S.X.; Jung, D.; Yao, R. ShinyGO: A graphical gene-set enrichment tool for animals and plants. Bioinformatics 2020, 36, 2628–2629. [Google Scholar] [CrossRef]
  53. Shen, N.; Wang, T.; Gan, Q.; Liu, S.; Wang, L.; Jin, B. Plant flavonoids: Classification, distribution, biosynthesis, and antioxidant activity. Food Chem. 2022, 383, 132531. [Google Scholar] [CrossRef] [PubMed]
  54. Dastmalchi, M.; Dhaubhadel, S. Soybean chalcone isomerase: Evolution of the fold, and the differential expression and localization of the gene family. Planta 2015, 241, 507–523. [Google Scholar] [CrossRef] [PubMed]
  55. Lai, S.H.; Chye, M.L. Plant Acyl-CoA-Binding Proteins-Their Lipid and Protein Interactors in Abiotic and Biotic Stresses. Cells 2021, 10, 1064. [Google Scholar] [CrossRef] [PubMed]
  56. Kriechbaumer, V.; Brandizzi, F. The plant endoplasmic reticulum: An organized chaos of tubules and sheets with multiple functions. J. Microsc. 2020, 280, 122–133. [Google Scholar] [CrossRef] [PubMed]
  57. Li, N.; Xu, R.; Li, Y. Molecular Networks of Seed Size Control in Plants. Annu. Rev. Plant Biol. 2019, 70, 435–463. [Google Scholar] [CrossRef]
  58. Tabassum, N.; Blilou, I. Cell-to-Cell Communication During Plant-Pathogen Interaction. Mol. Plant Microbe Interact. 2022, 35, 98–108. [Google Scholar] [CrossRef]
  59. Zhaogao, L.; Yaxuan, W.; Mengwei, X.; Haiyu, L.; Lin, L.; Delin, X. Molecular mechanism overview of metabolite biosynthesis in medicinal plants. Plant Physiol. Biochem. 2023, 204, 108125. [Google Scholar] [CrossRef]
  60. Vishwakarma, S.K.; Singh, N.; Kumaria, S. Genome-wide identification and analysis of the PAL genes from the orchids Apostasia shenzhenica, Dendrobium catenatum and Phalaenopsis equestris. J. Biomol. Struct. Dyn. 2023, 41, 1295–1308. [Google Scholar] [CrossRef]
  61. Li, K.-L.; Liang, Y.-M.; Chen, Z.; Zheng, P.-J.; Zhang, G.-Q.; Yan, B.; Elshikh, M.S.; Rizwana, H.; Chen, B.; Xu, Q. Genome-wide identification of the alkaloid synthesis gene family CYP450, gives new insights into alkaloid resource utilization in medicinal Dendrobium. Int. J. Biol. Macromol. 2024, 259 Pt 2, 129229. [Google Scholar] [CrossRef] [PubMed]
  62. Ojha, M.D.; Yadav, A.; P, H. Analyzing the potential of selected plant extracts and their structurally diverse secondary metabolites for α-glucosidase inhibitory activity: In vitro and in silico approach. J. Biomol. Struct. Dyn. 2023, 41, 9523–9538. [Google Scholar] [CrossRef] [PubMed]
  63. Zhao, X.; Yan, Y.; Zhou, W.-H.; Feng, R.-Z.; Shuai, Y.-K.; Yang, L.; Liu, M.-J.; He, X.-Y.; Wei, Q. Transcriptome and metabolome reveal the accumulation of secondary metabolites in different varieties of Cinnamomum longepaniculatum. BMC Plant Biol. 2022, 22, 243. [Google Scholar] [CrossRef] [PubMed]
  64. Wong, D.C.J.; Perkins, J.; Peakall, R. Anthocyanin and Flavonol Glycoside Metabolic Pathways Underpin Floral Color Mimicry and Contrast in a Sexually Deceptive Orchid. Front. Plant Sci. 2022, 13, 860997. [Google Scholar] [CrossRef] [PubMed]
  65. Fan, Y.; Ma, J.; Liu, Y.; Tan, X.; Li, X.; Xu, E.; Xu, L.; Luo, A. Heat Stress Alleviation by Exogenous Calcium in the Orchid Dendrobium nobile Lindl: A Biochemical and Transcriptomic Analysis. Int. J. Mol. Sci. 2023, 24, 14692. [Google Scholar] [CrossRef]
  66. Suttle, J.C.; Huckle, L.L.; Lu, S.; Knauber, D.C. Potato tuber cytokinin oxidase/dehydrogenase genes: Biochemical properties, activity, and expression during tuber dormancy progression. J. Plant Physiol. 2014, 171, 448–457. [Google Scholar] [CrossRef]
  67. Du, Y.; Zhang, Z.; Gu, Y.; Li, W.; Wang, W.; Yuan, X.; Zhang, Y.; Yuan, M.; Du, J.; Zhao, Q. Genome-wide identification of the soybean cytokinin oxidase/dehydrogenase gene family and its diverse roles in response to multiple abiotic stress. Front. Plant Sci. 2023, 14, 1163219. [Google Scholar] [CrossRef]
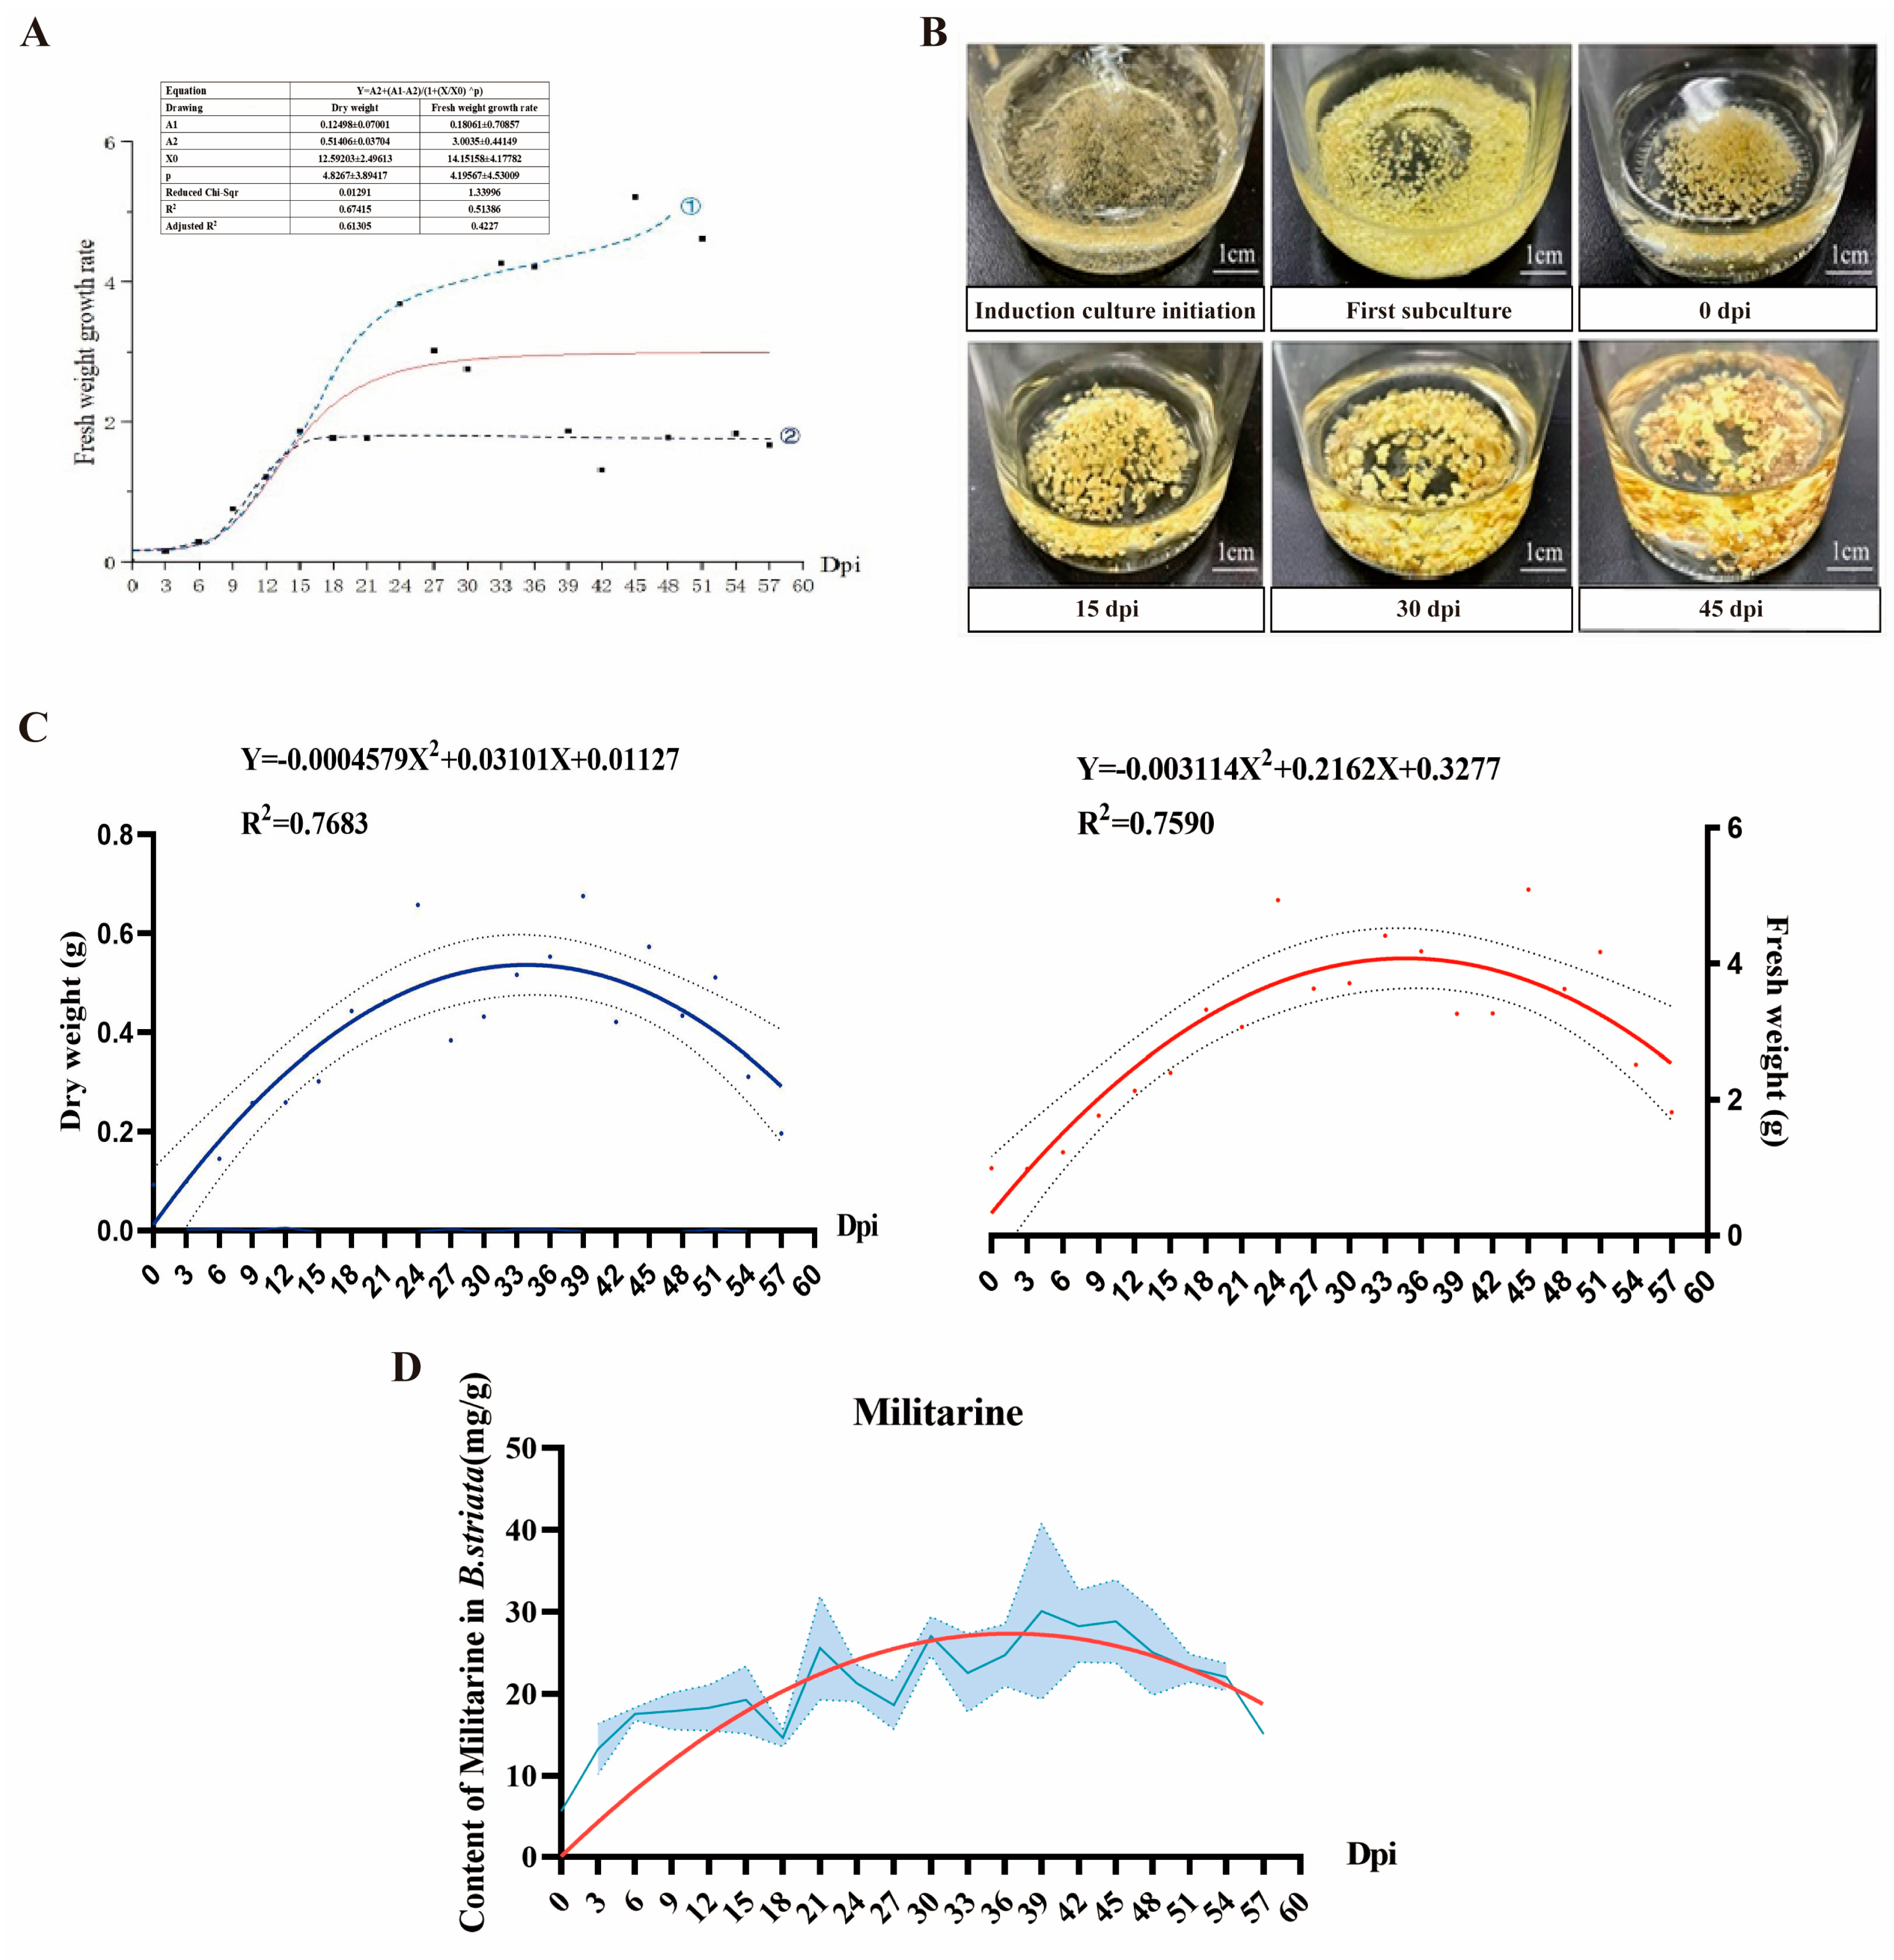
Figure 1. B. striata suspension cell growth morphology and curve and the accumulation of militarine from 0−60 dpi. (A) B. striata cell fresh weight proliferation curve (reflecting the absolute growth). Curves 1 and 2 indicate two suspension-cell lines exhibiting distinct proliferation modes; (B) B. striata cell growth morphology; (C) B. striata cell relative growth rate curve (reflecting the growth rate); (D) the linear fitting curve of militarine accumulation.
Horticulturae 11 01315 g001
Figure 2. Analysis of metabolite accumulation in B. triata suspension cells. (A) Changes in the accumulation of other metabolites in B. triata suspension cells from 0 dpi to 60 dpi. Y-axis scales have been set individually to optimally display each metabolite’s temporal profile; (B) correlation analysis between relative value-added rate and metabolite content. * p < 0.05, ** p < 0.01, *** p < 0.001.
Horticulturae 11 01315 g002
Figure 3. Analysis of metabolite accumulation in suspension cells of different landraces of B. striata. (A) Metabolite content distribution of four different landraces of B. striata suspension cells at 21 dpi. * p < 0.05, ** p < 0.01, *** p < 0.001; (B) correlation analysis between agronomic traits and metabolite accumulation of four different landraces of B. striata. *** p < 0.001.
Horticulturae 11 01315 g003
Figure 4. Contour and three-dimensional surface plots were fitted based on the response surface of sucrose concentration (A), ammonium nitrate concentration (B), and shaker speed (C).
Horticulturae 11 01315 g004
Figure 5. Annotation of common functional databases (classification statistics of GO, NR, KOG, and KEGG databases).
Horticulturae 11 01315 g005
Figure 6. The gene expression level of four different landraces of B. striata (12 samples). (A) FPKM distribution density map/box and map/violin map of sample genes under different experimental conditions; (B) heatmap of correlation coefficient between samples; (C) co-expression Wayne diagram; (D) statistical histogram of differential gene numbers.
Horticulturae 11 01315 g006
Figure 7. Differentially expressed genes between the four B. striata landraces (six comparison groups). (A) Differential gene volcano map. (The abscissa is the log2 fold-change value of gene expression in different samples, the ordinate is the significant level of expression difference (−log10 padj or −log10 pvalue), and the blue dotted line represents the standard threshold line for differential gene screening). (B) Differential gene Venn diagram.
Horticulturae 11 01315 g007
Figure 8. GO enrichment of DEGs across six pairwise comparisons among four B. striata landraces. (A) Differential gene GO enrichment histogram and GO classification histogram. The abscissa is the GO term of the next level of the three major categories of GO, and the ordinate is the number of differential genes annotated to the term (including the subterm of the term). Three different classifications represent the three basic classifications of GO terms (from left to right: biological processes, cellular components, and molecular functions). * p < 0.05 (B) Differential gene GO enrichment scatter plot. y-axis shows pathway names, and x-axis shows Gene Ratio. The size of the padj is expressed by the color of the point. The smaller the padj, the closer the color is to red. The number of differential genes contained in each pathway is expressed by the size of the point.
Horticulturae 11 01315 g008
Figure 9. KEGG enrichment dot plot: top 20 significantly enriched pathways. y-axis shows pathway names, and x-axis shows Gene Ratio. The size of padj is represented by the color of the point. The smaller the padj is, the closer the color is to red. The number of differential genes contained in each pathway is represented by the size of the point.
Horticulturae 11 01315 g009
Figure 10. The expression patterns of highly expressed genes in 12 samples of four landraces.
Horticulturae 11 01315 g010
Table 1. Basic culture conditions.
Cultivation PeriodMedium FormulaOther Cultivation Conditions
0–30 daysMS + 1 mg/L 6-BA + 2 mg/L 2,4-D + 0.5 mg/L NAA + 30 g/L sucrose120 rpm, 25 °C, dark cultivation
30–45 days1/2 MS + 1 mg/L 6-BA + 3 mg/L 2,4-D + 0.5 mg/L NAA + 30 g/L sucrose + 150 μmol/L NaAc
0–21 dpi1/2 MS + 1 mg/L 6-BA + 3 mg/L 2,4-D+ 0.5 mg/L NAA + 30 g/L sucrose + 150 μmol/L NaAc
Table 2. Analysis of the overall diversity of B. striata resources in 2023 and 2024.
Years (n)TraitsMinMaxMeanSDCV/%
2023 (260)BL1.5036.0015.983.880.24
BW0.309.002.841.190.42
LWRB2.4116.927.022.560.36
PL8.0050.8028.758.510.36
FN2.0015.005.902.100.33
2024 (318)BL1.2057.5016.858.410.50
BW0.3016.003.902.400.62
LWRB0.1510.954.851.540.32
PL4.0065.0030.0619.060.63
FN0.0015.006.002.590.43
Note: SD, standard deviation; CV, coefficient of variation; n, number of B. striata sample.
Table 3. Summary of sample sequencing data quality.
SampleLibraryRaw ReadsRaw BasesClean ReadsClean BasesError RateQ20Q30GC Pct
LDDPF1FRAS240241839-1r233865037.02228008066.840.0197.9694.1645.54
LDDPF4FRAS240241840-1r202597186.08197052865.910.0197.6293.4144.67
LDDPF30FRAS240241841-1r231396466.94226780576.800.0197.8593.9645.86
LDLPF63FRAS240241846-1r238410347.15233132516.990.0197.4593.1946.08
LDLPF86FRAS240241847-1r228236806.85221554426.650.0197.5093.2444.80
LDLPF133FRAS240241848-1r230771436.92224848126.750.0197.8593.9345.20
SMPFWL2FRAS240241851-1r233247527.00228074986.840.0197.6093.4045.60
SMPFWL3FRAS240241852-1r244777167.34238455057.150.0197.6093.4445.42
SMPFWL5FRAS240241853-1r228660366.86219990316.600.0197.6293.4745.74
SMPFNL86FRAS240241858-1r237123057.11232070066.960.0197.8994.0745.62
SMPFNL93FRAS240241859-1r279604788.39272500898.180.0197.6493.5644.44
SMPFNL101FRAS240241860-1r230725626.92224542736.740.0197.5193.3045.20
Disclaimer/Publisher’s Note: The statements, opinions and data contained in all publications are solely those of the individual author(s) and contributor(s) and not of MDPI and/or the editor(s). MDPI and/or the editor(s) disclaim responsibility for any injury to people or property resulting from any ideas, methods, instructions or products referred to in the content.