Article

Wounding Citrus Peel By-Products as Abiotic Stress to Induce the Synthesis of Phenolic Compounds?

by
Rosa Zapata
1,
Lorena Martínez-Zamora
1,2,
Marina Cano-Lamadrid
1 and
Francisco Artés-Hernández
1,*
1
Postharvest and Refrigeration Group, Department of Agricultural Engineering and Institute of Plant Biotechnology, Universidad Politécnica de Cartagena, 30203 Cartagena, Spain
2
Department of Food Technology, Nutrition, and Food Science, Faculty of Veterinary Sciences, University of Murcia, 30071 Espinardo, Spain
*
Author to whom correspondence should be addressed.
Horticulturae 2024, 10(8), 885; https://doi.org/10.3390/horticulturae10080885
Submission received: 16 July 2024 / Revised: 14 August 2024 / Accepted: 19 August 2024 / Published: 21 August 2024
(This article belongs to the Special Issue From Farm to Table in the Era of a New Horticulture in Spain)

Abstract

:
Wounding stress stimulates secondary metabolism and induces the phytochemical accumulation of fresh-cut fruit and vegetables. This research aims to study the biosynthesis of secondary metabolites in citrus peel by-products after different wounding intensities. Orange, grapefruit, and lemon peels were cut into rectangular shapes of 8.5 × 2 cm (CTRL), 1 × 1 cm dices (D), and 0.25 cm grates (G). Samples were stored at 15 °C and 65% relative humidity. Their total phenolic content (TPC), total antioxidant capacity (TAC), and individual organic and phenolic compounds were analyzed after 0, 4, 8, 24, 28, and 36 h. The results showed that the metabolite content decreased with the incubation time, so it is recommended to sample by-products between the first 8 h to achieve the maximum content. Grating, the most severe abiotic stress, was not a suitable technique to induce the synthesis of biocompounds because it allowed the full recovery of flavedo, but partial of albedo. However, it was different for CTRL and D, whose TPCs were ~170 and ~200%, ~98 and ~78%, and ~8 and ~36% higher for orange, grapefruit, and lemon, respectively, compared to G. A principal component analysis confirmed differences between the fruit species and cutting shapes combining all factors. Wounding citrus peels induces the accumulation of phytochemical compounds, but the layer of peel recovered in the cut is crucial in the concentration of phytochemicals extracted. It could be an innovative tool to revalorize these inedible parts of citrus, but further research is still needed.

Graphical Abstract

1. Introduction

Fruit and vegetable products are constantly subjected to environmental conditions, which, in many cases, are variable and even adverse. The survivability of plants and plant-derived products depends on their ability to adapt to stressful conditions, which disrupt their metabolic homeostasis. Two types of stress are distinguished: biotic stress, caused by insects and microorganisms, and abiotic stress, caused by water and oxygen deficiency/excess, extreme temperatures, phytohormones, heavy metals, salt, pressure, ultraviolet light, and other electromagnetic spectrum radiations, as well as physical tissue damage, like wounding [1,2,3]. Fruit and vegetables, as living organisms after harvesting, also present stress tolerance through changes in their gene expression pattern of proteins that control the metabolism pathways [4,5], although this behavior has not been studied in the discards of such fruit or vegetables after harvesting.
The positive response of plant-derived products has been extensively studied in the literature, and it is currently being implemented in the fresh and minimally processed industry to produce plant-based foods with higher nutritional value and health-promoting properties [6]. Wounding is the main postharvest stress experienced by fruit and vegetables, whether due to random mechanical damage or controlled during fresh-cut processing. After wounding, the damaged tissue triggers the organism’s defense mechanisms. Hydrolytic enzymes initiate signaling–wounding responses, and they release the key molecules, reactive oxygen species, ethylene, and jasmonic acid, which induce the accumulation of antioxidant phenolic compounds and lignin, involved in wound healing and the restoration of damaged cell walls [7,8].
At the beginning, it could be observed that cutting shape and blade sharpness affect the physical quality of fresh-cut products. For example, papaya slices exhibit 20% higher quality than cubes [9], and a sharp blade is better for cutting melon cylinders than a blunt one [10]. At the same time, the accumulation of bioactive compounds in fresh-cut products also began to be studied. A lot of reports showed an increase of phenolic content in wounded horticultural crops, such as potatoes [11,12], lotus roots [13], broccoli [14], carrots [15,16], and berries [17], among others. Subsequent research reported differences in the accumulation of phytochemical compounds based on the wounding shape and intensity. A study in which carrots were cut into three different shapes—slices, pies, and shreds—demonstrated that higher wounding intensity increased the phenolic content and antioxidant activity [7]. Another study, in which pitaya fruit were cut into slices, half-slices, and quarter-slices, demonstrated that the phenolic content, total antioxidant capacity, and PAL enzyme activity increased with the cutting wounding intensity [18]. All these results prove that the fresh-cut industry can use this environmental-friendly technology to produce nutraceutical food with higher phenolic content and antioxidant activity.
The fruit and vegetable industry faces a large food loss in the form of by-products and waste. Throughout the food supply chain, from production to consumption, up to 45% of the total fruit and vegetable production is lost [19]. Citrus fruits are among the fruit genera from which a wide variety of products are formulated. Of the annual production, which reaches 124.3 million tons, a significant percentage is allocated to the juice industry: 45%, 36%, and 23% for oranges, grapefruits, and lemons, respectively [20]. By-product generation accounts for 40 to 60% of the total production, including peels, pulp, and seeds [21]. Citrus peels are rich in pectin, cellulose, and hemicellulose, but they also contain an interesting variety of secondary metabolites with antimicrobial, anti-inflammatory, anticancer, antidiabetic, and antioxidant properties, including polyphenols, phenolic acid and flavonoids, organic acids, coumarins, limonoids, and terpenoids. The most abundant form of flavonoids is in the O-diglucoside structure, with a flavonoid core of flavanone, flavone, and flavonol, such as naringin, diosmin, and quercetin, respectively [22].
The main strategy to address the issue of food loss is the revalorization of by-products by extracting their bioactive compounds and subsequently applying them as supplements in novel foods, cosmetics, pharmaceuticals, and edible coatings for fruit and vegetables to harness their healthful properties. Most of the research in this field is focused on extraction techniques and their optimization, from conventional to emerging green non-thermal technologies [23]. However, there are few studies in the literature on the enrichment of phytochemicals in by-products before extraction by applying abiotic stress, even less by wounding. Since postharvest abiotic stress increases the phytochemical content of fresh-cut fruit and vegetables, it is expected that it also occurs in by-products, and it could also be used as an eco-friendly enrichment technique. The scarce literature in which this approach has been applied has reported an increase of phenolic content and antioxidant capacity in pineapple by-products subjected to hydrostatic pressure [24], and in carrot bagasse subjected to UV-C light and stored at room temperature [25].
Due to the nutraceutical richness of citrus peel, the potential for enrichment by abiotic stress, and the lack of research in this field, the objective of this work is to apply wounding stress in the citrus peel by-products of sweet orange (Citrus sinensis), lemon (Citrus limon), and grapefruit (Citrus paradise) to induce the accumulation of secondary metabolites. Three different cutting shapes were applied in each peel (rectangles, dices, and shreds), and they were stored for 36 h at 15 °C.

2. Materials and Methods

2.1. Plant Material

Organic ‘Fino 95’ lemons (Citrus limon), ‘Navelina’ sweet oranges (Citrus sinensis), and ‘Star Ruby’ grapefruits (Citrus paradise) were provided by Toñifruit S.L. (Librilla, Murcia, Spain). Citrus fruits grew in open air in southeast Mediterranean Spanish lands. They were harvested in January at the commercial maturity stage; approximately eight months elapsed between full bloom and harvest. The fruits passed through the handling line, including washing and disinfection, and were suitable for human consumption, but presented some defects (we used them as by-products of the handling line). They were transported by car about 60 km to Universidad Politécnica de Cartagena, where all the analyses were performed.

2.2. Initial Quality Parameters of Citrus Fruit

The physicochemical analyses were carried out on 10 non-damaged entire fruits of each species, lemon, orange, and grapefruit, which were randomly selected to assess their initial quality. All fruits were weighed (g) using an FH-2000 scale (GRAM, Barcelona, Spain), and their equatorial and longitudinal caliber (mm) was measured with a digital caliper (Mitutoyo, Neuss, Germany). Their color was determined according to CIELab system (L*, a*, and b* coordinates) using a Konica Minolta CR-400 colorimeter (Tokyo, Kanto, Japan). From the L*, a*, and b* coordinates, the hue angle (°hue) as tan−1(b*/a*) and chroma (C) as (a*2 + b*2)1/2 were calculated. The firmness of each whole fruit was expressed as a percentage of deformation (%), calculated as the length of deformation (mm) divided by the applied force (N). It was measured at room temperature using a Universal Texturometer press (MTS-Criterion®, Créteil Cedex, Francia) with a plate of 8 cm diameter that compressed at a speed of 2 mm s−1 by subjecting the fruits to a constant 10 N force.
Afterwards, five fruits of each citrus variety were cut equatorially into two halves to measure their albedo and flavedo thickness by a caliper. Then, both parts were squeezed to analyze the juice physicochemical parameters. The volume of juice (mL) was obtained and divided by the fruit weight to calculate the fruit percentage of juice. The pH was measured using a digital pH-meter (GLP21, Crison, Alella, Cataluña, Spain). The titratable acidity (TA), expressed as mg citric acid 100 mL−1, was calculated by diluting 5 mL of juice in 45 mL of distilled water and titrating it with a certain volume (mL) of 0.1 M NaOH solution to pH 8.1 (T50, Metter Toledo, Milan, Lombardia, Italy). The total soluble solids content (TSS), expressed as a percentage, was determined by a digital handled refractometer (Atago N1; Tokyo, Kanto, Japan). Finally, the maturity index of all samples was obtained as the ratio of TSS/TA, and the remaining peel was weighed (g).

2.3. Wounding Treatment and Sample Preparation

The by-products used for the experiment consisted of the peels (flavedo and albedo) of lemon, orange, and grapefruit, which were cut into 8.5 × 2 cm rectangles (CTRL), 1 × 1 cm dices (D), and 0.25 cm-width grated shapes (G). All samples were prepared in a cold and sterilized clean room at 15 °C and 65% relative humidity (RH). The CTRL samples were performed by marking the corresponding shape longitudinally on the peel of the whole fruit with a knife; once the incision was sufficient to separate the rectangles from each other, they were taken off the flesh. For dicing (D), the fruit was peeled with a knife using circular movements in an equatorial direction; then, the separated peel was cut into 1 × 1 cm dices. G was carried out by directly grating the peel of the entire fresh fruit, without separating it previously, using a manual grater in a longitudinal direction. The obtained samples of each citrus variety and shape cut (~2.7 kg of citrus peel per variety and cut) were packaged separately in sterilized, covered, and sealed PP trays, reaching ~50 g (Figure 1), and each box was stored at 15 °C and 65% RH, following the conditions previously reported and recommended to prevent the degradation of flavonoids and the volatilization of essential oils, which are sensitive to temperature, being still appropriate to accelerate the response to wounding stress [7,18]. As for the RH, 65% was selected for packaging under ambient-air gas partial pressures to maintain a controlled condition that would be able to decrease dehydration. Additionally, it is not recommended to exceed 70% to avoid the appearance of fungi and yeasts. Samplings were carried out during different time periods (0, 4, 8, 24, 28, and 36 h). Three replicates for each incubation time were analyzed (n = 3).
After the specific sampling time, the samples were frozen at −80 °C, and three days later, they were freeze-dried using a Telstar® LyoBeta (Terrassa, Barcelona, Spain) and grounded into fine powder with a mincer (IKA, A 11 basic, Berlin, Germany) to obtain a stable and homogeneous raw material to continue with the analyses.

2.4. Extraction of Bioactive Compounds

Samples of 0.1 g of citrus peel powder were weighed in PP plastic tubes and mixed with 10 mL of 80% methanolic/20% aqueous solution (n = 3). The solid–liquid extraction was performed using an orbital shaker (Stuart, Stone, UK) for 1 h at 200 rpm in darkness at 4 °C. Finally, the mixture was centrifuged at 3220× g for 10 min at 4 °C, and the supernatants were isolated using hydrophobic 0.2 µm polytetrafluoroethylene (PTFE) membrane filters. All samples were kept in Eppendorf tubes at −80 °C for further analyses.

2.5. Chemical Reagents

The chemical solvents used, 0.1 M NaOH, 40 mM HCl, formic acid solution, methanol of HPLC grade, and acetonitrile of LC–MS grade, were purchased from PanReac AppliChem (Castellar del Vallès, Barcelona, Spain), and milliQ water was obtained from a Synergy-UV ultra-purification system (Millipore, Bradford, MA, USA). The reagents used, 2 N Folin–Ciocalteu reagent, Na2CO3, NaOH, ABTS (2,2′-azino-bis[3-ethylbenzothiazoline-6-]), DPPH (2,2-diphenyl-1-picrylhydrazyl), CH3COONa, TPTZ (2,4,6-tris[2-pyridyl]-s-triazine), and 20 mM FeCl3, were purchased from Sigma-Aldrich (Saint Louis, Missouri, USA), as gallic and citric acid, naringenin, and trolox standards. The rest of the standards for LC–MS analyses, hesperidin, naringin, diosmin, rutin, and eriocitrin, were supplied by CymitQuimica S.L (Sant Martí, Barcelona, Spain).

2.6. Total Phenolic Content and Total Antioxidant Capacity

For the analysis of the bioactive compounds in the extracts, the total phenolic content (TPC) and total antioxidant capacity (TAC) were determined by UV-vis absorption spectrophotometry using a microplate reader (Tecan Infinite M200, Mäneford, Switzerland). The TPC was analyzed using the Folin–Ciocalteu reagent colorimetric method [26], with modifications [27]. For that, 19 µL of each isolated supernatant was dispensed into a flat-bottom PS 96-well plate (Greiner Bio-One; Frickenhausen, Germany), followed by the addition of 29 µL of 1 N Folin–Ciocalteu reagent. Three minutes later, at room temperature in darkness, 192 µL of Na2CO3 (0.4%) and NaOH (2%) aqueous solution were added. The plate was incubated for 1 h at room temperature in darkness and spectrophotometrically measured at a wavelength of 750 nm. The analytical calibration was performed using gallic acid as external standard, so the TPC was expressed as g gallic acid kg−1 dw (dry weight) of peel powder.
The TAC determination was carried out using three different colorimetric methods: the DPPH, ABTS, and FRAP (Ferric Reducing Antioxidant Power) assays previously described, with modifications [28]. For the DPPH assay, 194 µL of DPPH solution (0.7 mM) were added to 21 µL of extract in a 96-well plate. The mixture was incubated for 30 min at room temperature in darkness; the absorbance was measured at 515 nm. For the ABTS assay, 200 µL of the activated ABTS solution (32 µm) were added to 11 µL of citrus peel extract. It was incubated for 20 min at room temperature in darkness, and the absorbance values were measured at 414 nm. Through both methods, the TAC is calculated based on changes relative to the initial DPPH and ABTS values, respectively. The FRAP assay was carried out as previously described [29], with some modifications. Firstly, the FRAP solution containing sodium acetate buffer (pH 3.6), 10 mM TPTZ solution in 40 mM HCl, and 20 mM FeCl3 solution in a v/v/v proportion of 10:1:1 was prepared. Then, it was incubated at 37 °C for 2 h in darkness. After preparation, 198 µL of this solution were added to 6 µL of extract, and the mixture was incubated for 30 min at room temperature in darkness. The absorbance values were measured at 593 nm. The calibration of all TAC assays was performed using an external Trolox standard, so the results were expressed as g Trolox equivalents kg−1 dw.

2.7. Quantification of Individual Phenolic Compounds by HPLC–ESI–QqQ–MS/MS

The separation and quantification of individual organic acids and flavonoids of citrus fruits peels were performed using High-Performance Liquid Chromatography coupled to Mass Spectrometry (HPLC–MS), particularly, an Agilent 1200 liquid chromatograph (Sant Clara, CA, USA) equipped with a G1311B quaternary pump, G1329B Standard Autosampler, and G1316A column heater, coupled to a 6420 triple-quadrupole mass spectrometer (QqQ) with an electrospray ionization (ESI) source in negative mode. The stationary phase was a C18 reversed-phase column, Luna Omega C18 (2.1 × 100 mm; 3 µm). The mobile phase consisted of a 0.1% formic acid aqueous solution (A) and an organic phase consisting of acetonitrile (B), applied as follows: 0 min, 10% B; 3 min, 30% B; 8 min, 80% B; 8.50 min, 95% B; 12.00 min, 95% B; and 17.10 min, 5% B. The sample volume injected by autosampler was 1 µL, the flow rate was kept at 0.3 mL/min, and the oven temperature was set at 40 °C.
The QqQ source parameters were set as previously described [30]: The gas temperature, flow, capillary voltage, and nebulizer were set at 350 °C, 11 L/min, 4000 V, and 40 psi, respectively. Individual compounds were quantified by multiple reaction monitoring (MRM) considering the most suitable transition. The analytical calibration was carried out using commercial external standards purchased after the tentative identification of the compounds by comparing their fragmentation patterns with the available literature. The identified, separated, and quantified compounds were citric acid, hesperidin, naringin, diosmin, rutin, eriocitrin, and naringenin, all of them being expressed as g kg−1 dw. Chromatograms and specific data for identification in HPLC–ESI–QqQ–MS/MS are shown in Figures S1–S7 and Table S1.

2.8. Statistical Analyses

This experiment was a two-factor design to determine the effect of storage time (linked to the accumulation of phytochemicals induced by the defense response to abiotic stress) and cutting intensity, so the results were subjected to two-way analysis of variance (ANOVA) (p < 0.05) using GraphPad Prism statistic software (v. 8.0.2. GraphPad Software, Boston, MA, USA). Tukey’s multiple range test was used to compare all pairwise differences between group means to determine if they were significantly different.
A principal component analysis (PCA) was used to visualize whether the different treatments provide statistically similar TPC, TAC, and content of individual bioactive compounds. This multivariate analysis was performed using The Unscrambler X 10.4 software (CAMO Software, Oslo, Norway).

3. Results

3.1. Initial Physicochemical Parameters of Citrus Fruits

The quality parameters of fresh oranges, grapefruits, and lemons are shown in Table 1. The fruits were harvested based on a certain caliber at the commercial maturity stage, but they were discarded in the handling line for not being of enough quality for the fresh market with no evidence of microbial contamination. The oranges, grapefruits, and lemons reported an equatorial caliber of 75.75 ± 3.44 mm, 83.34 ± 2.09 mm, and 63.74 ± 1.45 mm, respectively, and a longitudinal caliber of 70.61 ± 3.95 mm, 74.79 ± 4.43 mm, and 82.00 ± 9.44 mm, respectively. The mean weights of the oranges, grapefruits, and lemons were 213.92 ± 14.81 g, 227.86 ± 8.04 g, and 158.80 ± 18.85 g, respectively. All species reported a similar juice percentage: 46.55 ± 5.02%, 45.47 ± 3.43%, and 42.33 ±10.76%, for orange, grapefruit, and lemon, respectively. Lemon juice exhibited the highest TA and the lowest TSS. The characterization of the peels, which are the raw material from which the bioactive compounds were obtained, reported similar albedo/flavedo thickness ratios for the three citrus species (Table 1). The percentage of albedo in the peels of the oranges, grapefruits, and lemons was 71.01 ± 2.93%, 74.15 ± 4.76%, and 79.13 ± 3.55%, respectively.

3.2. Total Phenolic Content and Total Antioxidant Capacity Results

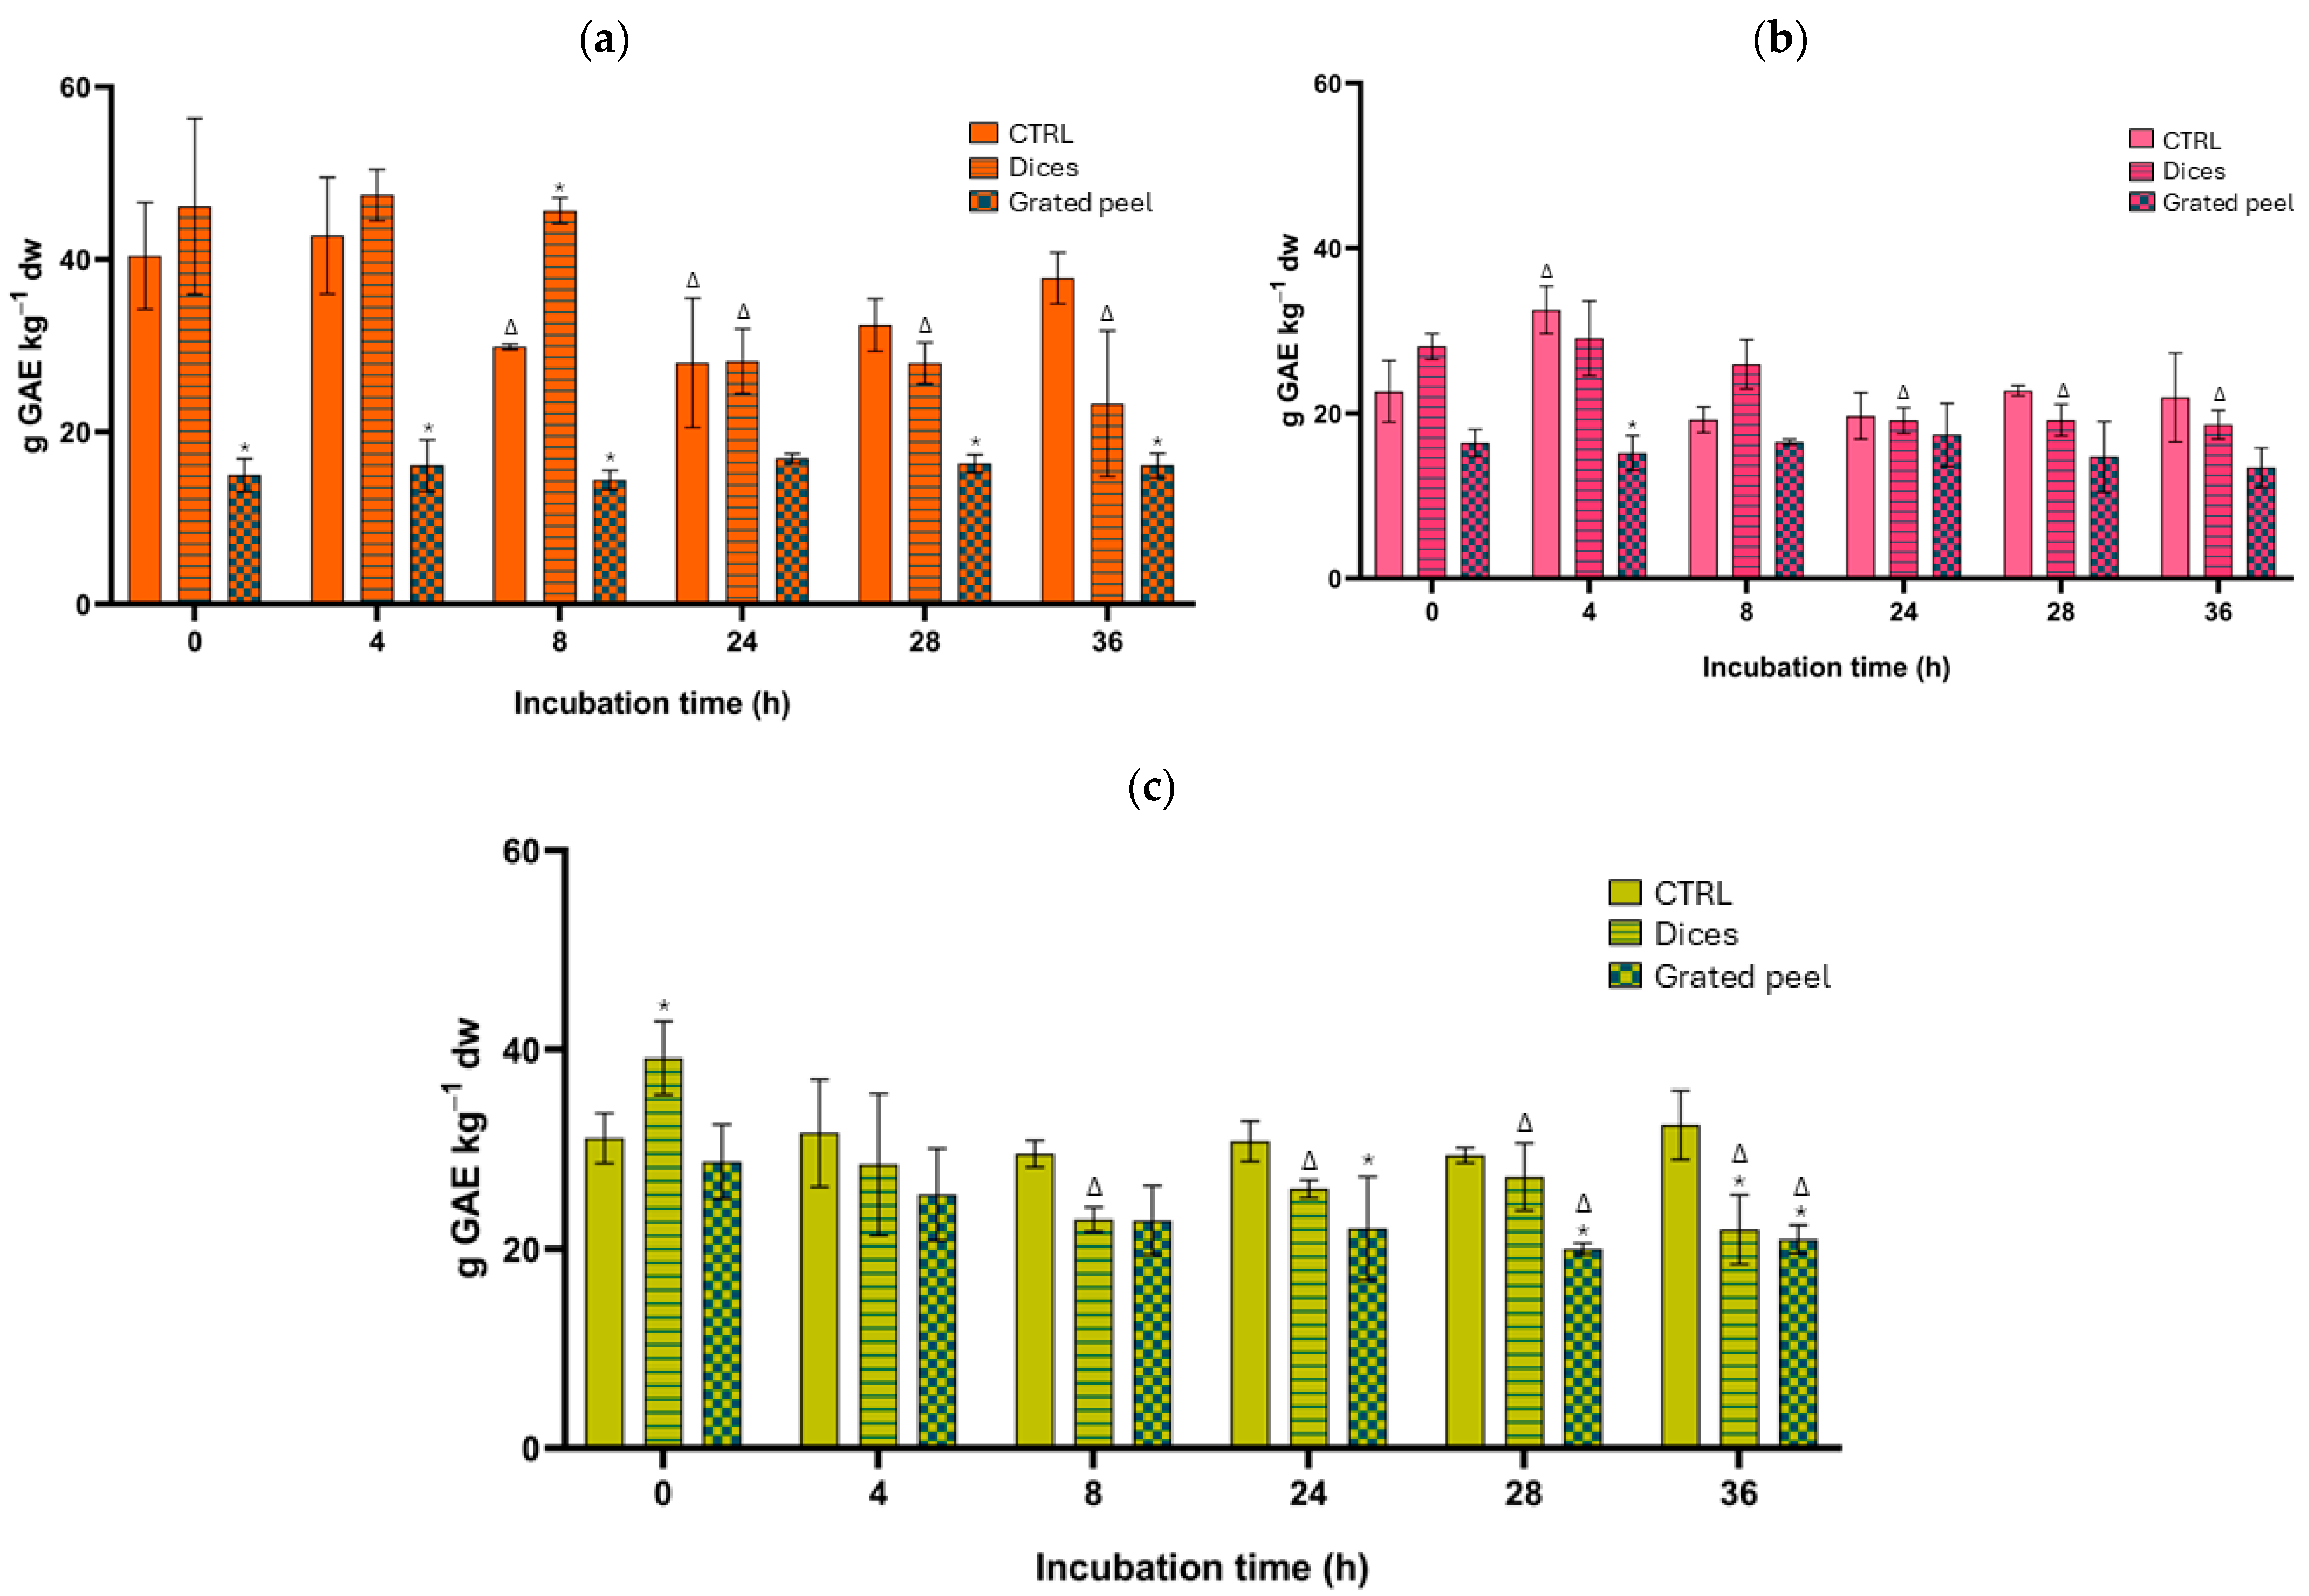
The TPC of citrus by-products is related to the content of the flavonoids and phenolic acids extracted. Regarding the different cutting modalities applied, no differences of TPC were observed between the extracts provided by the peel cut into dices and those from the CTRL group, except for the orange (*) after 8 h of incubation (Figure 2). The accumulation of TPC after grating was lower than for the CTRL and diced shapes (*), except in particular cases in which no differences were found. After 0 h of incubation, the grated TPC was 62.9, 41.7, and 26.5% lower for orange, grapefruit, and lemon, respectively. No differences were observed between the CTRL samples after a certain incubation time regarding CTRL at 0 h, except for the grapefruit peel after 4 h. The incubation time did not induce the accumulation of TPC, but rather, remained stable or decreased (Δ). In the case of diced shapes, the TPC remained constant the first 8 h, but from 24 h onwards, it decreased (Δ) (Figure 2).
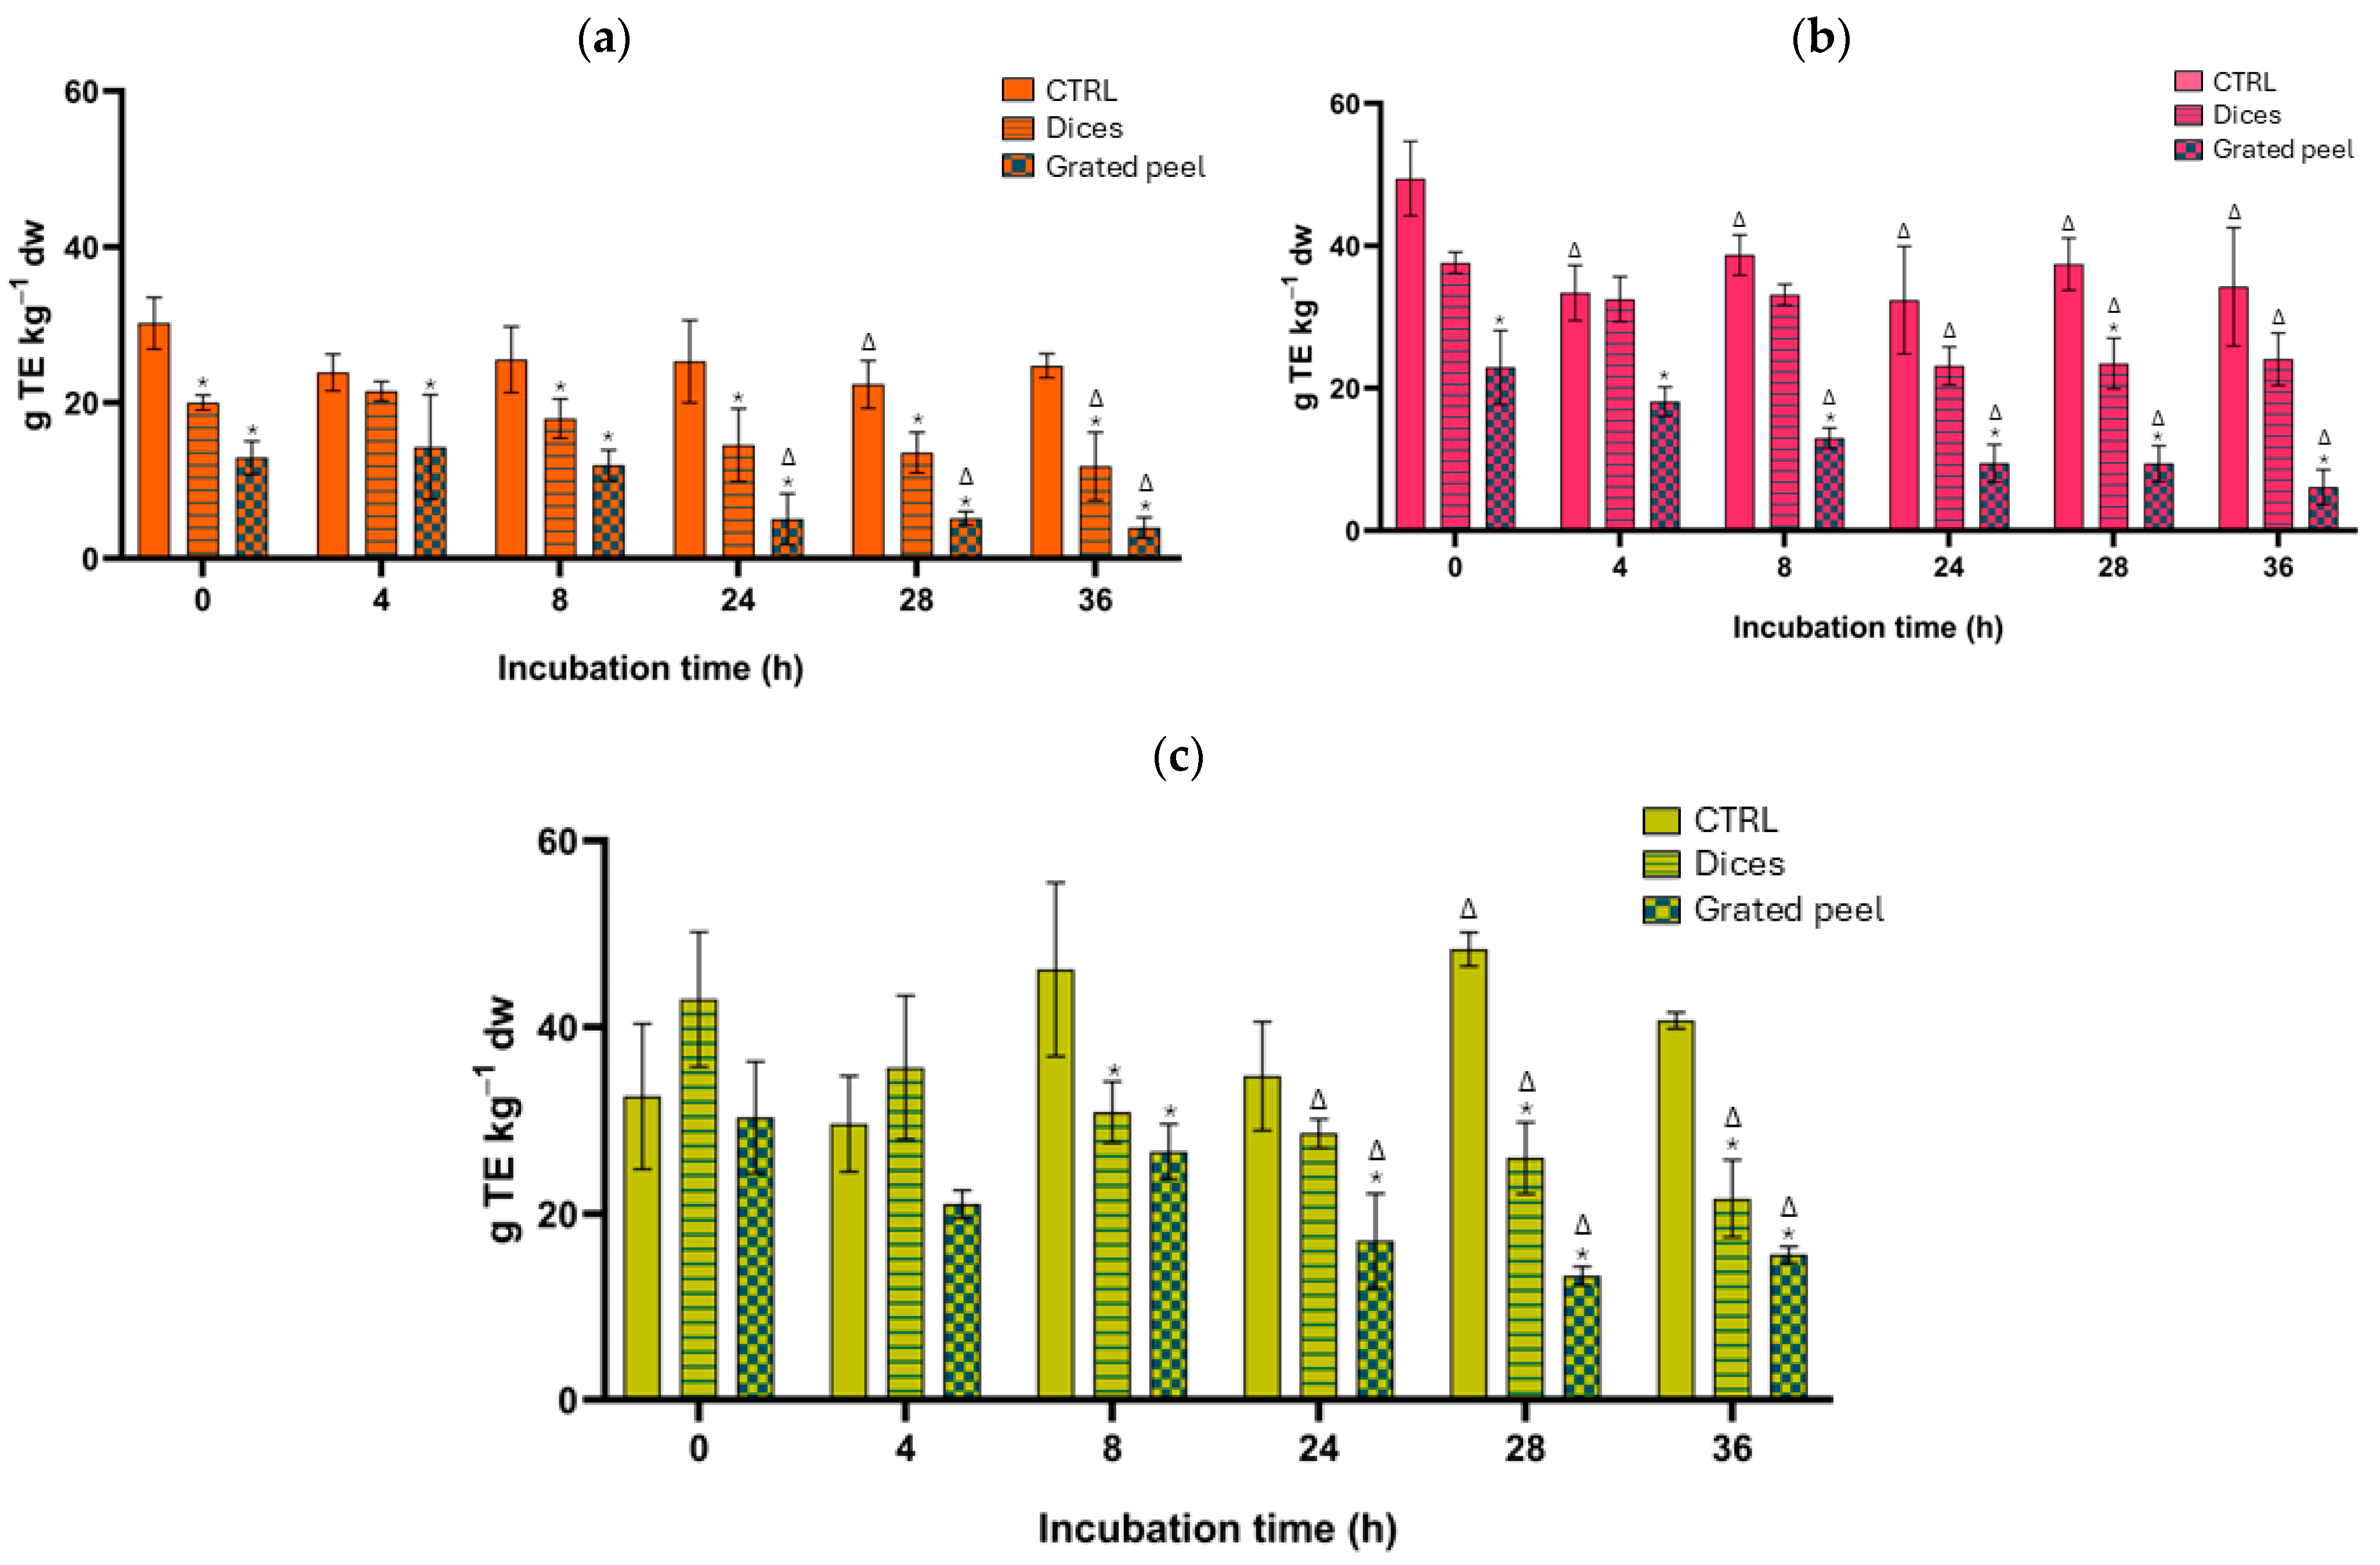
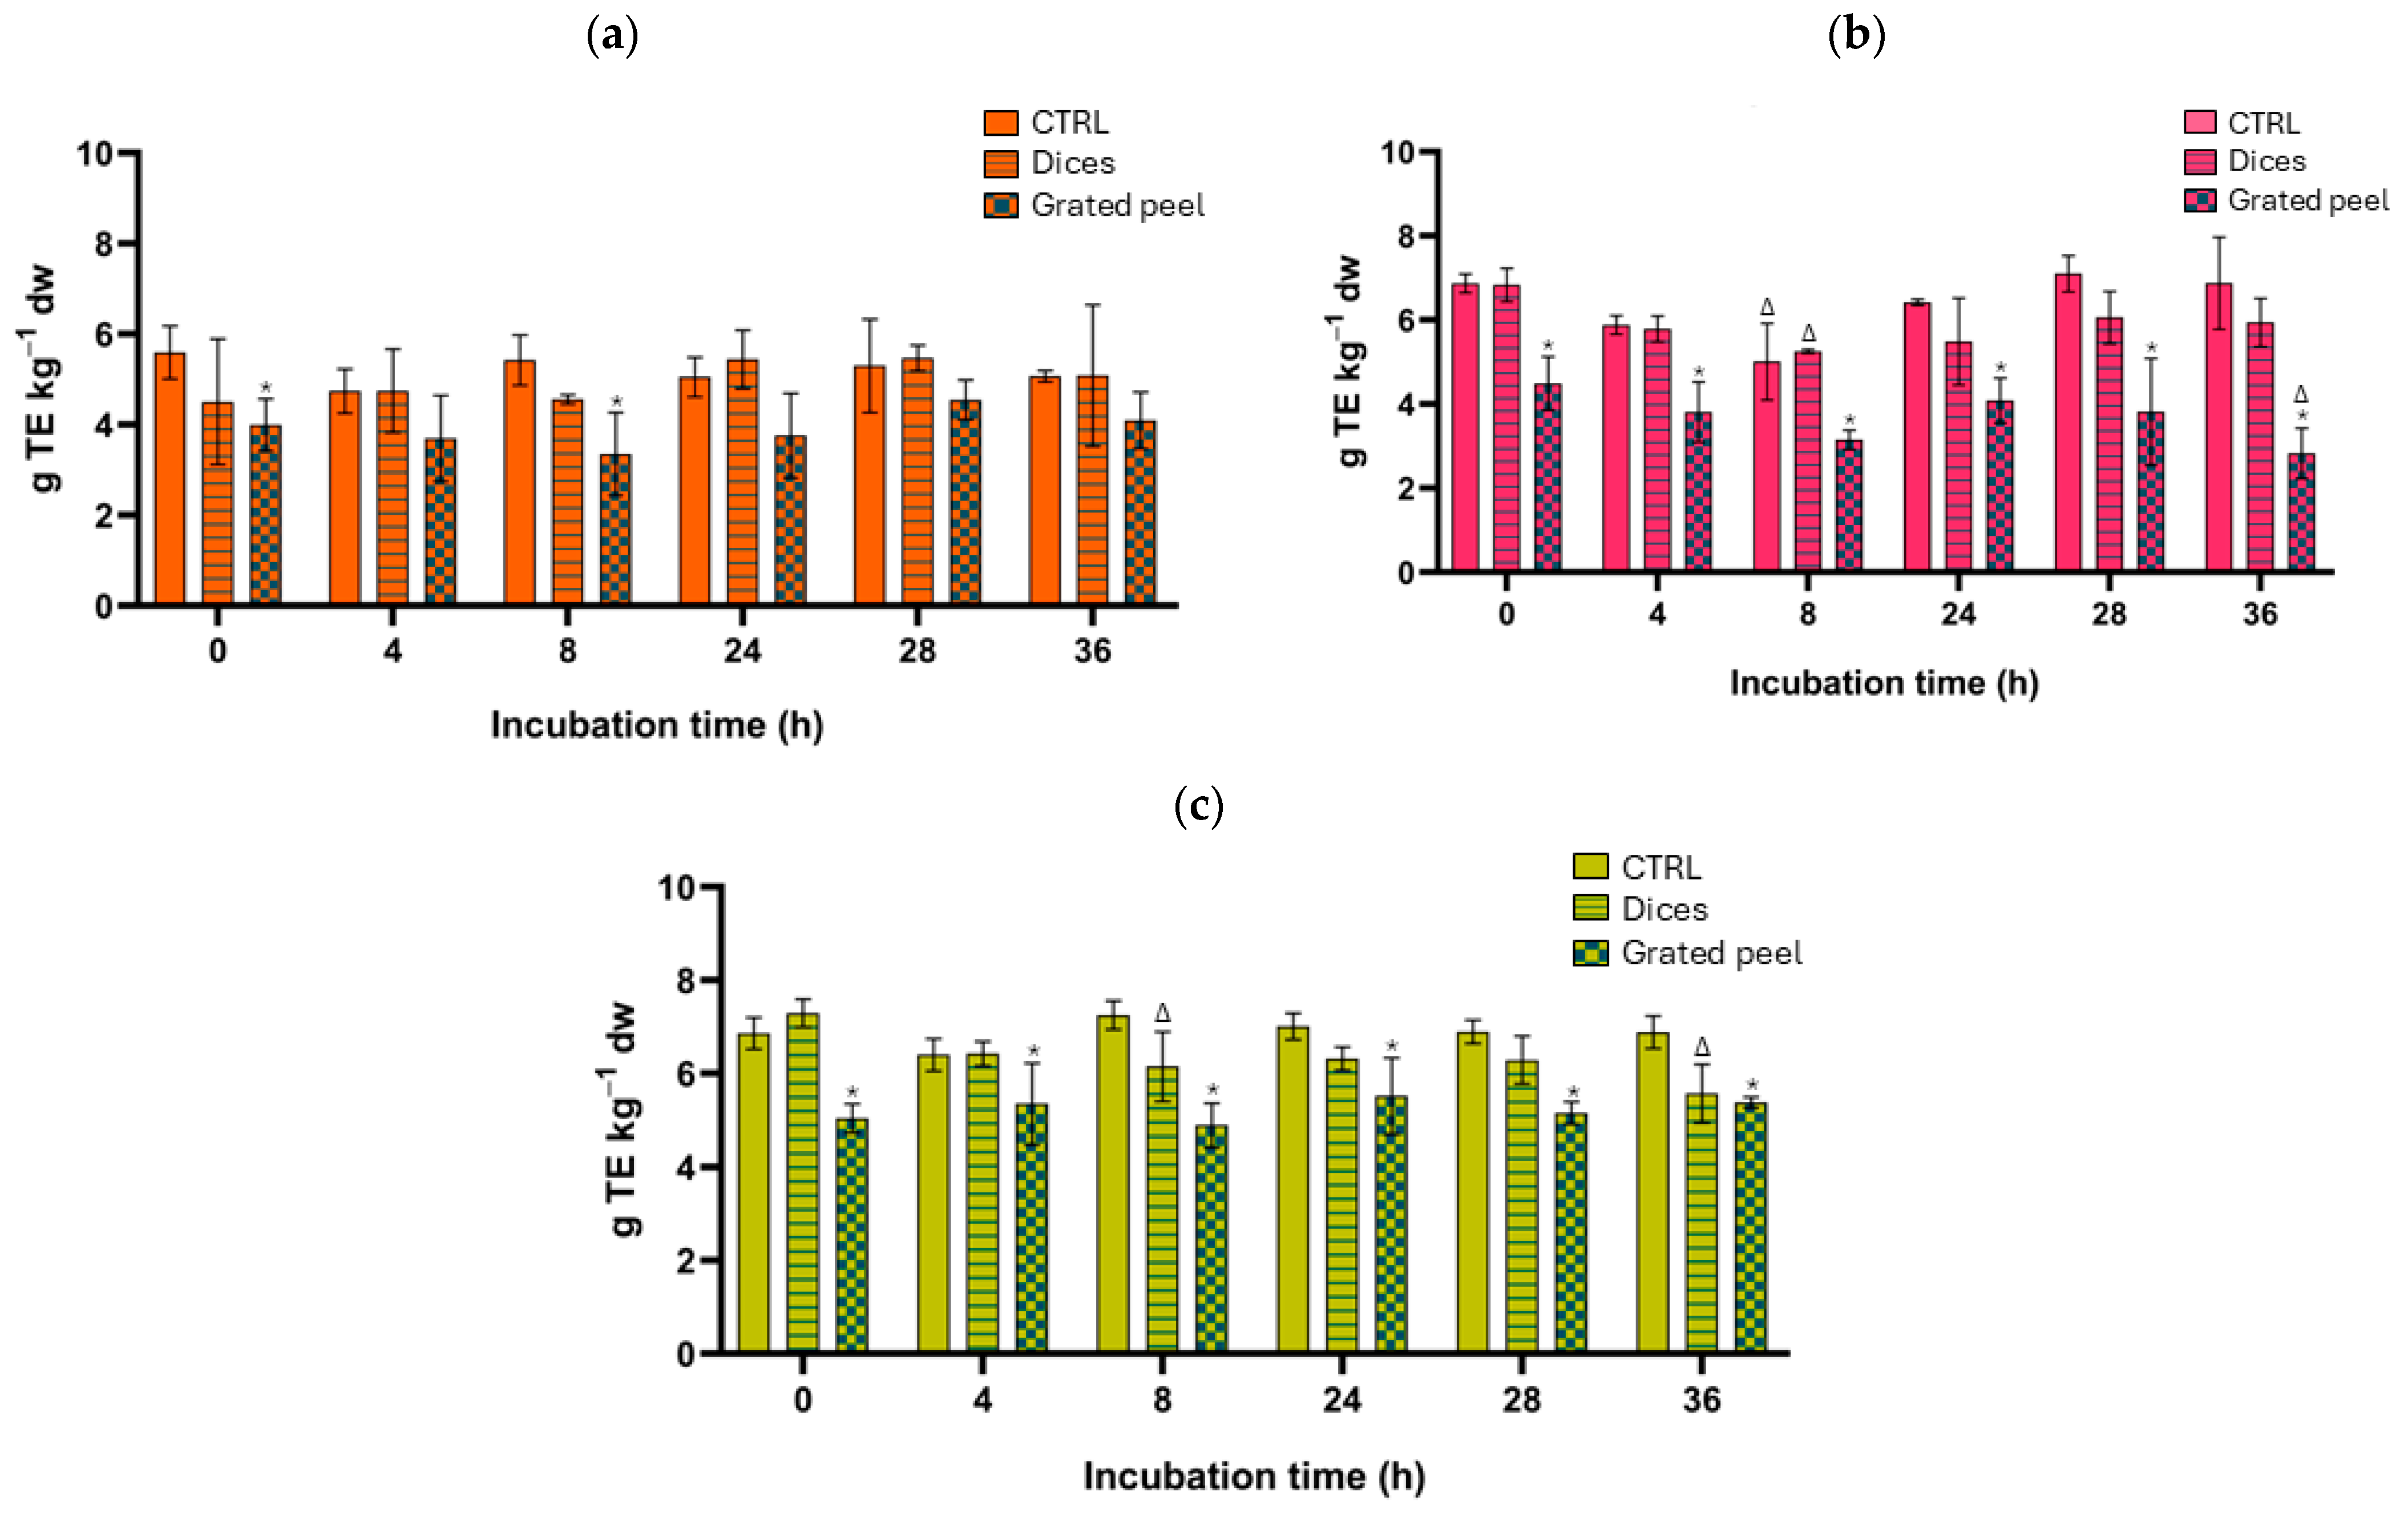
The TAC of methanolic extracts from citrus peel by-products is attributed to the secondary metabolites (phenolic compounds, organic acids, and terpenoids), and it was determined by three different methods: DPPH, ABTS, and FRAP assays. The TAC values determined by the DPPH assay showed that, in comparison with the different cutting intensities applied, there were no differences between the dice-shaped cut and the control group for grapefruit, except after 28 h, when the control TAC was higher. For the orange and lemon peels, the control group’s TAC was higher than that of the dice-shaped group, except for 4 h, and 0, 4, and 24 h of incubation (*), respectively. The TAC provided by the grated peel was lower than for the CTRL and diced shapes (*), except in particular cases without differences (e.g., lemon 0 h), in which the grated TAC after 0 h of incubation was 57.2 and 53.6% lower than the control samples for orange and grapefruit, respectively. Regarding the tested incubation time, a decrease in TAC is observed starting at 24 h for the G samples, and specific decreases for CTRL and D at 28 and 36 h, respectively, for the orange peel samples. In the grapefruit peels, a decrease in TAC was observed for all three cut shapes starting at 24 h (Δ). For the lemons, the variation in TAC with incubation time did not show a clear trend (Figure 3). The FRAP and ABTS assays reported similar results, confirming a similar influence of the variables on the TAC. These findings are presented in Figure 4 and Figure 5, respectively.

3.3. Identification and Quantification of Individual Phenolic Compounds (HPLC–MS/MS)

The most abundant secondary metabolites in citrus peels are polyphenols and organic acids, of which seven different analytes were identified. Four of these were glycosylated flavanones (naringin, hesperidin, diosmin, and eriocitrin), one was a flavanone aglycone (naringenin), one was a glycosylated flavonol (rutin), and the last one was an organic acid (citric acid). The tentative identification was carried out by comparing the fragmentation pattern of each molecule with the literature [31] and the elution order of the compounds, which clarifies their polarity and, thus, the compound family to which they belong. The subsequent comparison of the analyte retention times with the commercial standard allowed for their definitive identification. Since the incubation time during the first 8 h did not induce the accumulation of TPC for any of the cutting intensities, and it decreased after 24 h, the previously mentioned individual metabolites were quantified in samples incubated for 0 h.
The quantified bioactive compounds were found in varying proportions in the peels of each of the species, orange, grapefruit, and lemon. The di-glycosylated flavanones were the metabolites found in greater quantities, reaching 16.9 ± 0.7 g kg−1dw of hesperidin in orange peel. The highest content of naringin was found in the grapefruit peel, with a concentration of 9.1 ± 1.0 and 6.30 ± 0.11 g kg−1 dw, respectively. Interestingly, diosmin and rutin were not detected in the grapefruit peel, and naringenin was not detected in the lemon peel. The trend of individual flavonoid content (Table 2) followed the same behavior described above for the TPC (Figure 2) and TAC assays (Figure 3, Figure 4 and Figure 5). The grated peel exhibited a lower concentration of secondary metabolites compared to the other two cutting methods. However, regarding citric acid, either there were no differences compared to the CTRL (orange and grapefruit), or it was higher in the grated peel, certainly 129% for lemon. The only cases in which the diced cut provided a higher concentration of analyte than the control group were rutin in the lemon peel (45.6%) and citric acid in the grapefruit peel (59.2%).
In general, the CTRL group exhibited the highest flavonoid content, although this difference was only significant in some cases. Specifically, the naringin content in the control group of grapefruit was 11.0 and 24.7% higher than that in the diced and grated peel, respectively. The hesperidin content in the control group of orange peel was 30.0 and 92.5% higher than that in the diced and grated peel, respectively. In the lemon peel, it was 35.5% higher than in the grated peel. The rutin content in the control orange peel was 170.9% higher than in the grated peel. The eriocitrin content was 13.6% higher in the control lemon peel compared to the grated, and the naringenin content was 4.4% higher for the control grapefruit compared to the grated peel.

3.4. Correlation between the Studied Variables

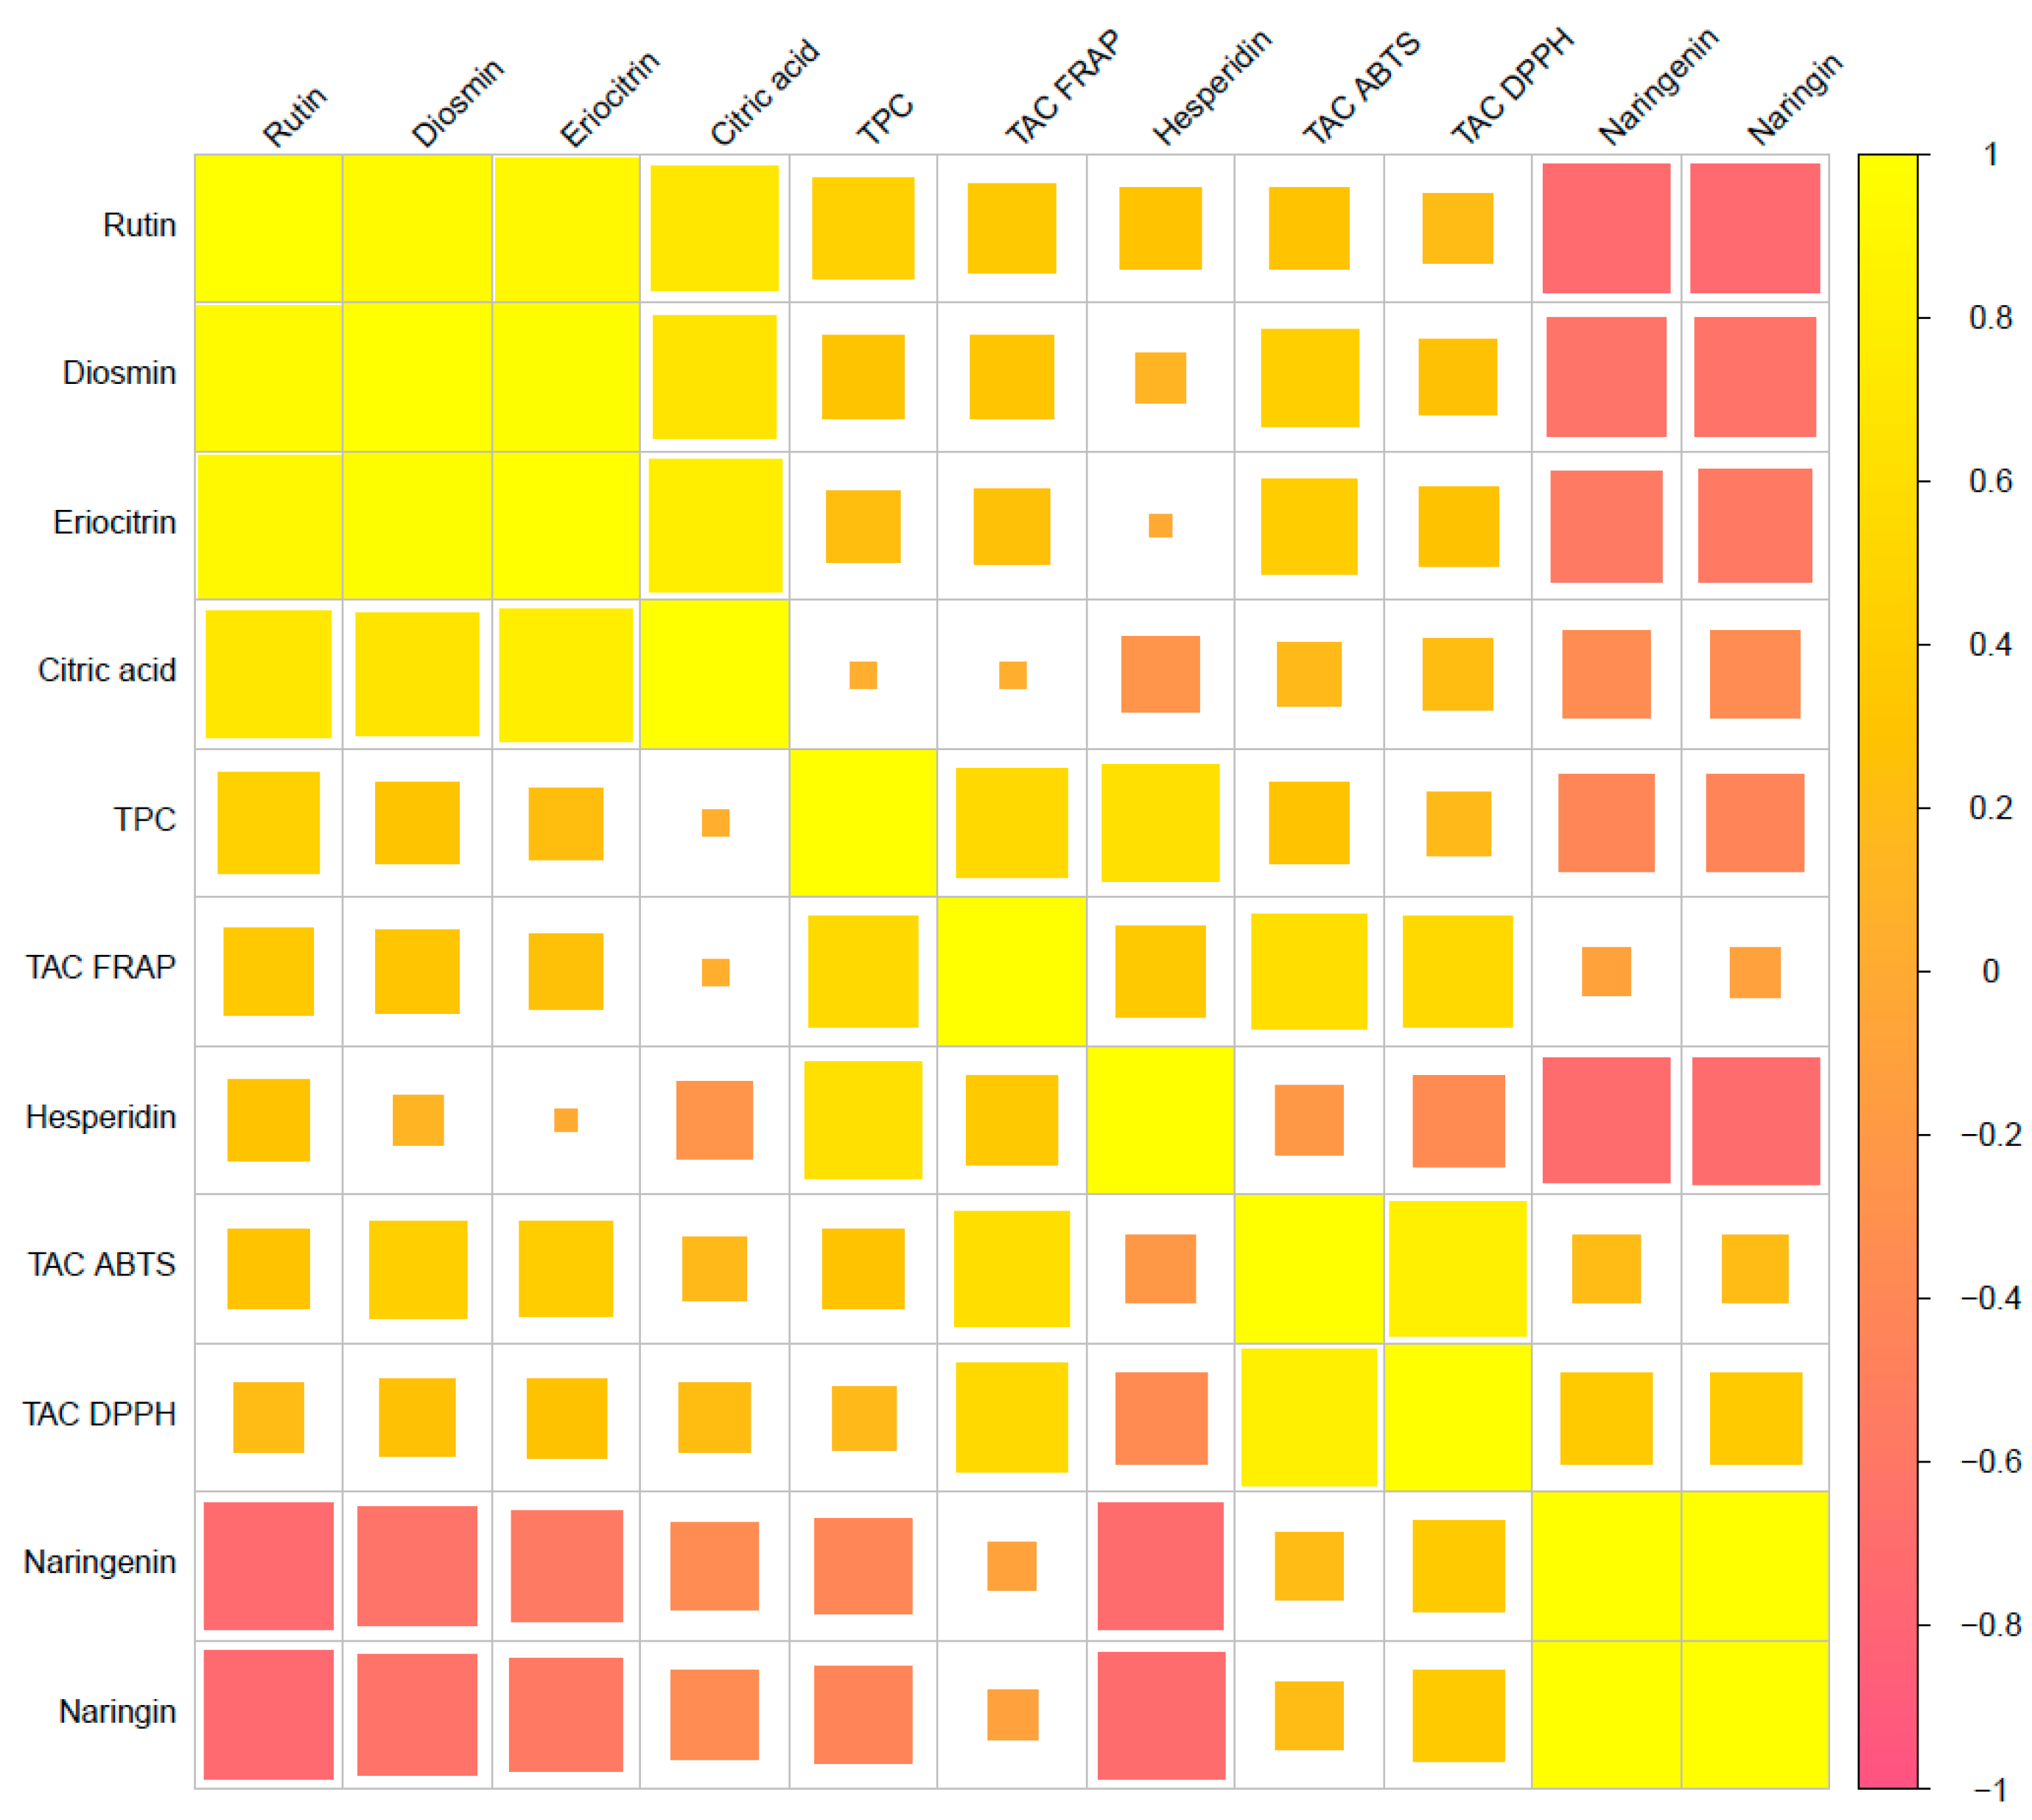
The obtained results from the Pearson correlation between the studied variables are shown in Figure 6. The highest (R2 > 0.9) and most significative (p < 0.0001) positive correlation was shown among diosmin, rutin, and eriocitrin. A negative correlation was shown among the two groups of compounds, diosmin, rutin, eriocitrin, and hesperidin vs. naringenin and naringin, showing R2 from −0.75 to −0.62, which was highly significant (p < 0.0001). Also, the content of citric acid was highly correlated with the presence of diosmin, rutin, and eriocitrin (R2 from 0.67 to 0.79). Focusing on the TPC and TAC spectrophotometrically measured, we found that TPC was highly correlated with the presence of the most of the phenolic compounds quantified by HPLC–MS/MS (naringin, narigenin, hesperidin, and rutin), although it was not correlated with diosmin or citric acid content. By contrast, the TAC analyses were not significantly correlated with individual phenolic or organic compounds, although these analyses were highly correlated among them (DPPH vs. ABTS vs. FRAP).

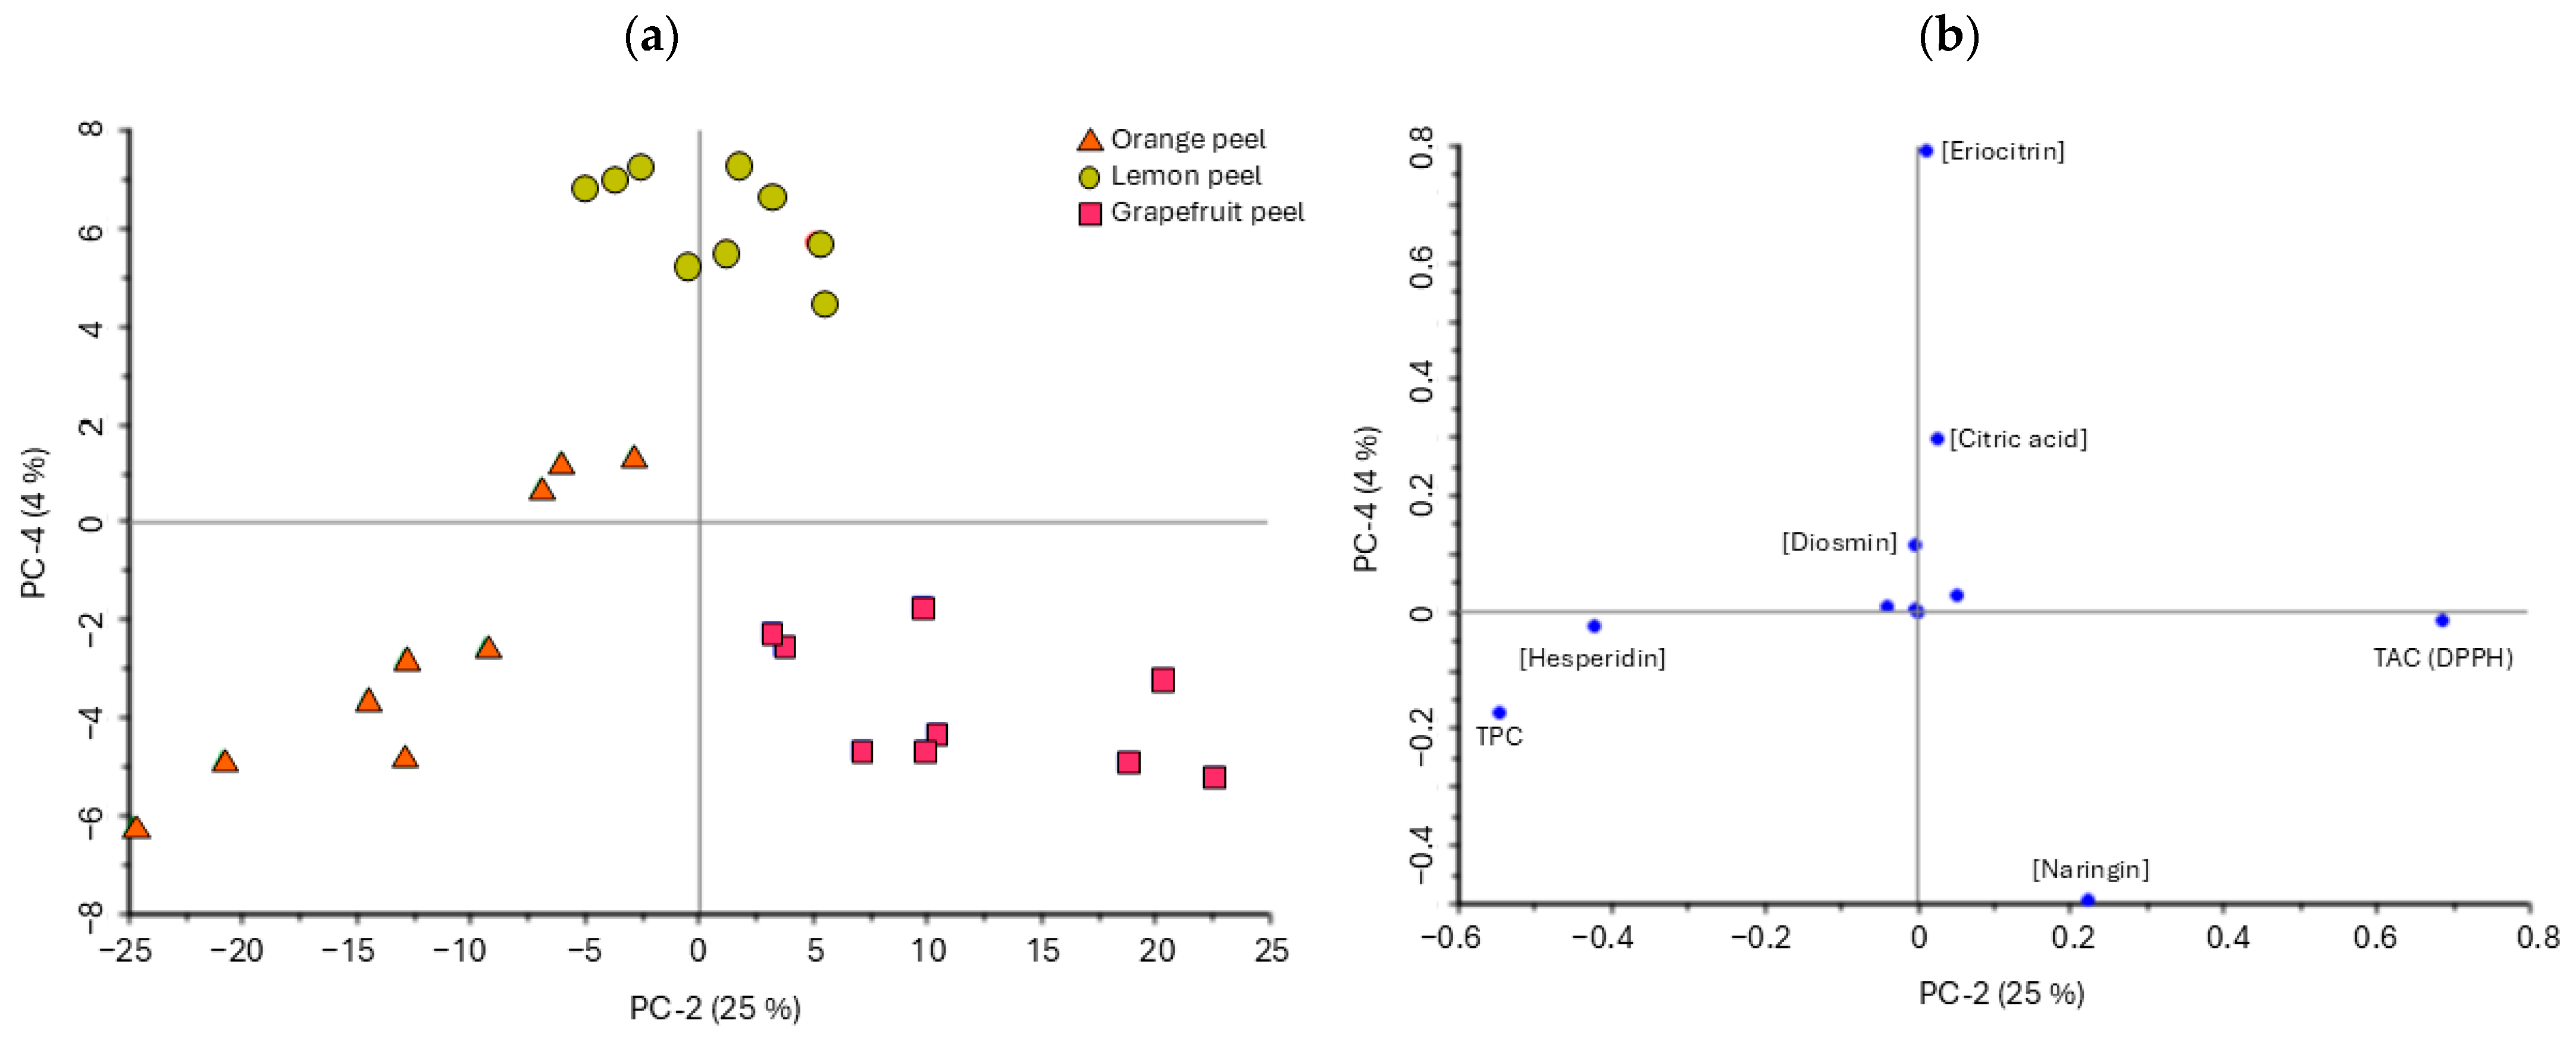
3.5. Principal Component Analysis

The PCA allowed us to verify whether combining all the determined factors reveals differences between fruit type and cut, as well as to understand the influence of each factor on those differences. The representation (Figure 7) shows the use of the two principal components (PC2 and PC4), which capture greater intergroup variance and lower intragroup variance. This results in three distinct groups in the score plot corresponding to the three fruit species, orange, lemon, and grapefruit, from left to right in the scores graph. PC2 accounts for 25% of the data variance, while PC4 accounts for 4%. The factors that most influence dispersion along the PC2 axis were TPC, hesperidin content, and TAC by DPPH assay. Along the PC4 axis, the most influential factors were eriocitrin and naringenin content, followed by citric acid. As seen in Figure 7b, the loadings corresponding to the TPC and hesperidin content were in the negative direction of PC2. Consequently, the points with higher values for these factors, representing the orange sample, cluster around this position in the scores plot. On the other hand, the lemon samples cluster around the eriocitrin and citric acid loadings in the positive direction of PC4, as they exhibited the highest content of these metabolites. The points of the grapefruit samples are located in quadrant 4 around the loadings for naringin content and TAC by DPPH assay.
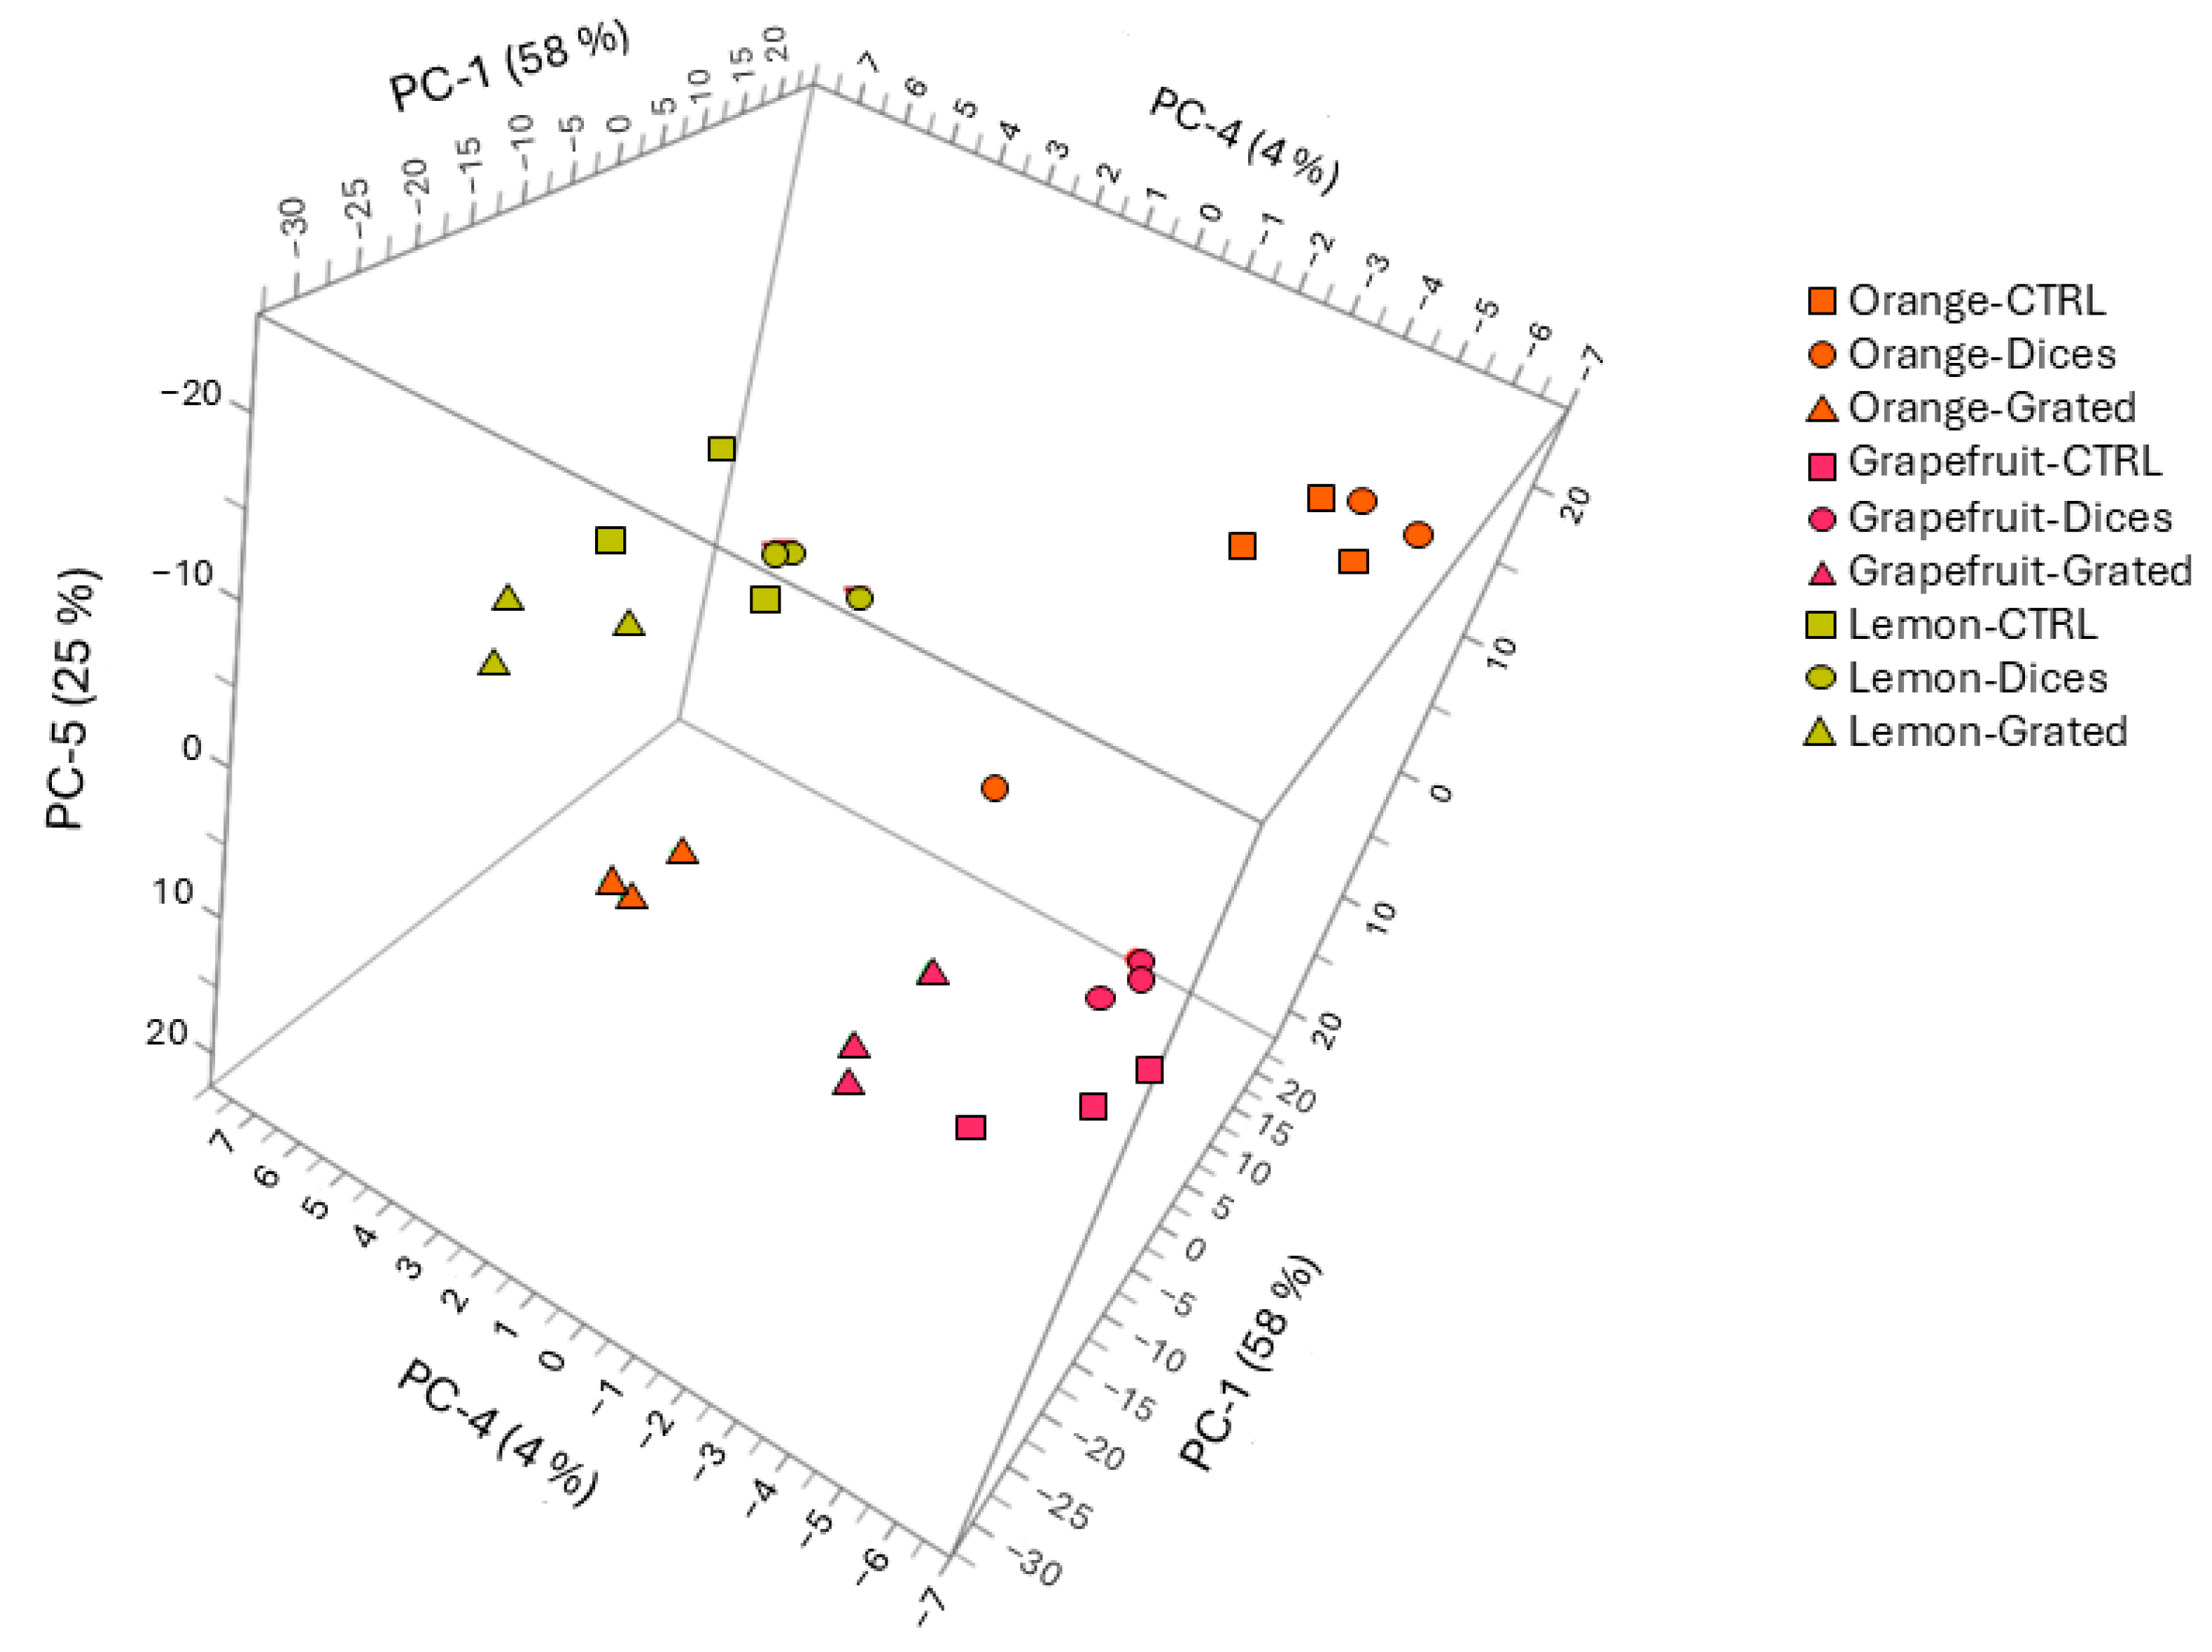
Once the differences due to citrus species were verified, the PCA was visualized based on the cutting intensity for each species. The greatest intergroup dispersion was observed for the primary components PC1, PC2, and PC4, which account for 87% of the total variance, 58, 25, and 4%, respectively. As seen in Figure 8, for the orange samples, the points corresponding to grated peels are distant from the CTRL and dice samples, indicating that the TPC, TAC, and individual compound content differ for this cutting intensity compared to the other two, which are similar to each other. In the case of lemons, it is also evident that the points corresponding to grated peels are farther from the CTRL samples than the diced cut. However, for grapefruit, the intergroup dispersion is similar to the intragroup one, suggesting that cutting intensity does not appear to be a determining factor in the TPC, TAC, or individual compound content of the samples.

4. Discussion

The quality parameters of the three citrus species harvested at their commercial maturity stage are specific to the correspondent varieties. Such quality parameters obtained for the ‘Fino’ lemon match those reported in the literature for this variety. Regarding the average weight, it was 159 ± 19 g, which is similar to what the literature reports (151 ± 17 g). The average equatorial and longitudinal diameters were 63.7 ± 1.5 g and 82.0 ± 9.4, respectively, which aligns with the reported values of 62.5 ± 3.5 g and 85.3 ± 7.2 g. The juice yield percentage, 42.3 ± 10.8%, also matches the reported value of 40.9 ± 3.9%. As for peel thickness, the experimental measurement was 5.6 ± 1.4 mm, while the literature reports 5.7 ± 0.8 mm [32]. In the case of the ‘Navelina’ sweet orange, the experimental values obtained for weight, equatorial diameter, juice percentage, and peel thickness (214 ± 15 g, 75.8 ± 3.4 mm, 70.6 ± 3.9 mm, 46.5 ± 5.0%, and 6.9 ± 1.5 mm) match those reported in the literature (227.7 ± 4.2 g, 75.8 ± 0.7 mm, 80.17 ± 1.97 mm, 46.00 ± 1.67%, and 5.07 ± 0.21 mm, respectively) [33]. The quality parameters of the ‘Star Ruby’ grapefruit, weight, equatorial diameter, juice percentage, and peel thickness (227.9 ± 8.0 g, 83.34 ± 2.09 mm, 74.79 ± 4.43 mm, 45.47 ± 3.43%, and 6.48 ± 0.55 mm) were also similar to those reported in the literature (285.2 ± 18.6 g, 88.3 ± 0.3 mm, 75.2 ± 0.1 mm, 45.18 ± 0.46%, and 6.34 ± 0.16 mm, respectively) [34].
The variety of fresh fruit and vegetables (even within the same genus) is crucial for their content of bioactive compounds. The same happens in the case of by-products, such as peels, so it is important to know the variety of the plant material under study to compare the results obtained with the literature.
Regarding the different cutting intensities applied to induce abiotic stress and secondary metabolite accumulation, there are several examples reported in the literature, especially in fresh-cut products. In the case of fresh-cut carrots, an increase in TPC was reported with higher cutting intensity. The highest TPC was found in shredded carrot tissue, followed by pies, slices, and whole carrots, in this order [7,35]. A subsequent study in which the carrots were cut into the same shapes and then blanched showed that the TPC decreased with the cutting intensity. However, this result, according to the authors, was due to the higher leaching of phenolic compounds when there was greater surface contact with blanching water [36]. Another study on fresh pitaya cut into different shapes, including slices, half-slices, and quarter-slices, also reported an increase of TPC and TAC with higher cutting intensity [18]. There are few studies related to wounding fresh citrus, i.e., ‘Lisbon’ lemons were subjected to different cutting shapes, wedges, slices, ½ slices, and ¼ slices, and a lower decrease in TPC throughout storage, with increasing wounding intensity, was found, possibly due to the stimulation of phenolic synthesis [37].
Our study does not follow the trend observed in the literature. Even though dicing represents greater cutting intensity, there is no clear trend that confirms an increase in TPC or TAC values compared to the control group. In fact, the TPC and TAC obtained for grated peel, which represents the highest cutting intensity, are lower than in the other two shapes, CTRL and dices, for all three citrus species. This different behavior may be due to the methodology followed in applying wound treatments. In the case of grating, when obtained directly from the whole fruit, the peel was not fully recovered; while the recovery of the flavedo was complete, that of the albedo was partial. It is known that the composition of flavedo and albedo in citrus fruits is different; in fact, the reported results of the literature show a higher TPC in the albedo layer.
In the case of grapefruit, the albedo TPC was 12.67 ± 0.16 g GAE kg−1 dw, while the flavedo TPC was 10.45 ± 0.08 g GAE kg−1 dw [38]. The difference regarding the experimental TPC found by us (32.5 ± 2.9 in CTRL after 4 h incubation) may be because they belonged to different varieties [38]. Another study on the grapefruit peel of the same variety, Star Ruby, reported a higher TPC value of 55.9 ± 2.5 g GAE kg−1 dw [39], which can be justified by the variations in the concentration of these phytochemicals according to the climatic conditions, the harvesting method, the irrigation, or even the size of the tree from which these grapefruits came from.
In the case of lemon, the TPC values for albedo and flavedo reported in the literature are 61.08 and 51.71 g GAE kg−1 dw, respectively [40]. The differences in our experimental value, 39.2 ± 3.6 g GAE kg−1 dw, may be due to a different drying method or solvent used [40]. Regarding orange peels, the albedo and flavedo TPC reported by the literature are 52.9 ± 0.1 and 17.7 ± 0.1 g GAE kg−1 dw, respectively, for sour orange, while the value obtained by us for sweet orange (CTRL after 4 h incubation) was 47.5 ± 2.9 g GAE kg−1 dw [41].
The observed correlations among individual flavonoids align with the extensively researched phenylpropanoid metabolic pathway in the literature [42]. The condensation of one molecule of p-coumaroyl-CoA with three molecules of malonyl-CoA, followed by isomerization, generates the flavanone aglycone naringenin. The high correlation between naringenin and naringin is due to both having the same flavonoid core. Naringin arises from the substitution of the hydroxyl group at position C7 of naringenin with O-rutinoside. The high negative correlation of both with the rest of flavonoids is possibly due to them being products of the enzymatic reaction of naringenin through different metabolic pathways. These include the hydroxylation of the flavanone (eriocitrin and hesperidin), as well as the synthesis of flavone (diosmin and rutin) [43,44]. The correlation between the TPC and most of the flavonoids is high because they are the major phenolic compounds present in citrus peel. Hesperidin (the flavonoid with the highest concentration) and rutin exhibit the highest correlation with TPC, R2 = 0.621 and R2 = 0.451, respectively, surpassing the reported literature correlation between total flavonoid content (TFC) and TPC in citrus peel (R2 = 0.231) [45]. The comparison with TFC instead of individual flavonoids is necessary due to the lack of results reported in the literature. The absence of correlation between TPC and TAC (by FRAP, DPPH, and ABTS) has also been observed in other studies [46,47]. This is because several other compounds contribute to the antioxidant activity besides polyphenols, such as organic acids and terpenoids [48]. Additionally, since all three TAC methods (Fe3+ ion reduction and free radical stabilization) are indirect measures, they are also influenced by the synergistic effects of phenolic compounds [49].
These facts justify that despite the greater intensity of wounding in grated peel, the accumulation of secondary metabolites is lower than in the CTRL and dice samples, which also accounts for their higher intergroup dispersion in PCA compared to the other two cutting shapes. The literature concerning TAC results and individual phenolic compound content by HPLC–MS/MS confirm a higher concentration of phenolic compounds in the albedo compared to the flavedo [41,50]. Specifically, in lemon albedo, the reported content of eriocitrin, naringin, and hesperidin is 266, 380, and 350% greater [51]. In our case, the diced cuts (composed of both flavedo and albedo) have a content of these analytes that is 13.5, 123, and 98.5% higher than in the grated peel (complete recovery of flavedo and partial recovery of albedo). This behavior is similar in Citrus sinensis and Citrus paradisi peels. The accumulation of bioactive compounds is not clearly confirmed by increasing the wounding intensity between diced and control samples. However, to verify if it induces biosynthesis in grated peels, further research would be necessary, ensuring the complete recovery of both layers of the peel.

5. Conclusions

The application of different wounding intensities on citrus peel by-products can be a natural technique to enrich these tissues and increase the extraction yield of bioactive compounds for use in food supplementation and coatings, to facilitate their revalorization. This research has provided clarity on how the cuts should be made, as the layer of peel obtained is crucial for assuring the maximum recovery of the phytochemicals extracted. The cuts in which the percentage of albedo in the obtained peel is higher relative to the flavedo provide better extraction yields. The rectangle cutting technique (CTRL) provides a greater amount of extracted bioactive compounds, with little difference compared to dicing, as demonstrated in the PCA. Both techniques promote greater accumulation of metabolites compared to the more severe cutting technique, grating. However, these facts do not confirm that higher abiotic stress does not induce biosynthesis, since with the grating technique, the proportion of albedo recovered in the total peel is lower than in the other two shapes. In fact, the CTRL and D cuttings showed an increase in lemon, grapefruit, and orange by ~8 and ~36, ~98 and ~78%, and ~170 and ~200%, respectively, compared to the G samples from the same citrus. It has been observed that abiotic stress due to wounding affects metabolite accumulation, so further research wherein the grating is differently performed is needed.

Supplementary Materials

The following supporting information can be downloaded at https://www.mdpi.com/article/10.3390/horticulturae10080885/s1: Figure S1: MRM chromatogram of citric acid; Figure S2: MRM chromatogram of eriocitrin flavonoid; Figure S3: MRM chromatogram of naringin flavonoid; Figure S4: MRM chromatogram of naringenin flavonoid; Figure S5: MRM chromatogram of diosmin flavonoid; Figure S6: MRM chromatogram of hesperidin flavonoid; Figure S7: MRM chromatogram of rutin flavonoid; and Table S1: Optimized HPLC–MS/MS parameters for MRM quantification ([M-H]: m/z of the precursor ion [deprotonated quasi-molecular ion]; [M-H] MS/MS: m/z of the fragment used for MRM transition).

Author Contributions

Conceptualization and methodology, F.A.-H., M.C.-L. and L.M.-Z.; software, R.Z.; validation, F.A.-H., M.C.-L., L.M.-Z. and R.Z.; formal analysis, L.M.-Z. and M.C.-L.; investigation, F.A.-H., M.C.-L., L.M.-Z. and R.Z.; resources, F.A.-H.; data curation, R.Z.; writing—original draft preparation, F.A.-H., L.M.-Z. and R.Z; writing—review and editing, F.A.-H., M.C.-L., L.M.-Z. and R.Z.; visualization, F.A.-H.; supervision, F.A.-H.; project administration, F.A.-H.; funding acquisition, F.A.-H. All authors have read and agreed to the published version of the manuscript.

Funding

Grant PID2021-123857OB-I00 funded by MICIU/AEI/10.13039/501100011033 and by “ERDF/EU”. This work is also a result of the AGROALNEXT program and was supported by MICIU with funding from EU NextGeneration (PRTR-C17.I1) and by Seneca Foundation with funding from Autonomous Community of the Region of Murcia (CARM).

Data Availability Statement

The original contributions presented in the study are included in the article/Supplementary Materials; further inquiries can be directed to the corresponding authors.

Acknowledgments

RZ acknowledges the predoctoral scholarship IFPI—SEFYCU 2629070 from UPCT. L.M.Z. thanks the postdoctoral contract Margarita Salas from University of Murcia, funded by the EU Next GenerationEU/PRTR. M.C.L. acknowledges the postdoctoral contract Juan de la Cierva-Formación (FJC2020-043764-I) from MICIU. The authors would like to thank Eva Alvarez Sanchez for her assistance in the laboratory.

Conflicts of Interest

The authors declare no conflicts of interest. The funders had no role in the design of the study; in the collection, analyses, or interpretation of data; in the writing of the manuscript; or in the decision to publish the results.

References

  1. Cisneros-Zevallos, L. The Use of Controlled Postharvest Abiotic Stresses as a Tool for Enhancing the Nutraceutical Content and Adding-Value of Fresh Fruits and Vegetables. J. Food Sci. 2003, 68, 1560–1565. [Google Scholar]
  2. Toscano, S.; Trivellini, A.; Cocetta, G.; Bulgari, R.; Francini, A.; Romano, D.; Ferrante, A. Effect of Preharvest Abiotic Stresses on the Accumulation of Bioactive Compounds in Horticultural Produce. Front. Plant Sci. 2019, 10, 1212. [Google Scholar]
  3. Formica-Oliveira, A.C.; Martínez-Hernández, G.B.; Aguayo, E.; Gómez, P.A.; Artés, F.; Artés-Hernández, F. A Functional Smoothie from Carrots with Induced Enhanced Phenolic Content. Food Bioprocess. Technol. 2017, 10, 491–502. [Google Scholar]
  4. Oh, M.M.; Trick, H.N.; Rajashekar, C.B. Secondary Metabolism and Antioxidants Are Involved in Environmental Adaptation and Stress Tolerance in Lettuce. J. Plant Physiol. 2009, 166, 180–191. [Google Scholar] [CrossRef]
  5. Oh, M.M.; Carey, E.E.; Rajashekar, C.B. Environmental Stresses Induce Health-Promoting Phytochemicals in Lettuce. Plant Physiol. Biochem. 2009, 47, 578–583. [Google Scholar] [CrossRef]
  6. Castillejo, N.; Martínez-Zamora, L.; Artés-Hernández, F. Postharvest UV Radiation Enhanced Biosynthesis of Flavonoids and Carotenes in Bell Peppers. Postharvest Biol. Technol. 2022, 184, 111774. [Google Scholar] [CrossRef]
  7. Surjadinata, B.B.; Cisneros-Zevallos, L. Biosynthesis of Phenolic Antioxidants in Carrot Tissue Increases with Wounding Intensity. Food Chem. 2012, 134, 615–624. [Google Scholar] [CrossRef]
  8. Hodges, D.M.; Toivonen, P.M.A. Quality of Fresh-Cut Fruits and Vegetables as Affected by Exposure to Abiotic Stress. Postharvest Biol. Technol. 2008, 48, 155–162. [Google Scholar]
  9. Rivera-López, J.; Vázquez Ortiz, F.A.; Ayala-Zavala, F.; Sotelo-Mundo, R.R.; González-Aguilar, G.A. Cutting Shape and Storage Temperature Affect Overall Quality of Fresh-Cut Papaya Cv. “Maradol”. J. Food Sci. 2005, 70, s482–s489. [Google Scholar]
  10. Portela, S.I.; Cantwell, M.I. Cutting Blade Sharpness Affects Appearance and Other Quality Attributes of Fresh-Cut Cantaloupe Melon. J. Food Sci. 2001, 66, 1265–1270. [Google Scholar]
  11. Reyes, L.F.; Cisneros-Zevallos, L. Wounding Stress Increases the Phenolic Content and Antioxidant Capacity of Purple-Flesh Potatoes (Solanum tuberosum L.). J. Agric. Food Chem. 2003, 51, 5296–5300. [Google Scholar] [CrossRef]
  12. Torres-Contreras, A.M.; Nair, V.; Cisneros-Zevallos, L.; Jacobo-Velázquez, D.A. Plants as Biofactories: Stress-Induced Production of Chlorogenic Acid Isomers in Potato Tubers as Affected by Wounding Intensity and Storage Time. Ind. Crops Prod. 2014, 62, 61–66. [Google Scholar] [CrossRef]
  13. Hu, J.; Yang, L.; Wu, W.; Li, Y.; Zhan, L. Slicing Increases Antioxidant Capacity of Fresh-Cut Lotus Root (Nelumbo Nucifera G.) Slices by Accumulating Total Phenols. Int. J. Food Sci. Technol. 2014, 49, 2418–2424. [Google Scholar] [CrossRef]
  14. Villarreal-García, D.; Nair, V.; Cisneros-Zevallos, L.; Jacobo-Velázquez, D.A. Plants as Biofactories: Postharvest Stress-Induced Accumulation of Phenolic Compounds and Glucosinolates in Broccoli Subjected to Wounding Stress and Exogenous Phytohormones. Front. Plant Sci. 2016, 7, 45. [Google Scholar] [CrossRef]
  15. Gastélum-Estrada, A.; Rabadán-Chávez, G.; Reza-Zaldívar, E.E.; de la Cruz-López, J.L.; Fuentes-Palma, S.A.; Mojica, L.; Díaz de la Garza, R.I.; Jacobo-Velázquez, D.A. Biofortified Beverage with Chlorogenic Acid from Stressed Carrots: Anti-Obesogenic, Antioxidant, and Anti-Inflammatory Properties. Foods 2023, 12, 3959. [Google Scholar] [CrossRef]
  16. Jacobo-Velázquez, D.A.; González-Aguëro, M.; Cisneros-Zevallos, L. Cross-Talk between Signaling Pathways: The Link between Plant Secondary Metabolite Production and Wounding Stress Response. Sci. Rep. 2015, 5, 8608. [Google Scholar] [CrossRef]
  17. Candar, S. How Abiotic Stress Induced by Artificial Wounding Changes Maturity Levels and Berry Composition of Merlot (Vitis vinifera L.). Eur. Food Res. Technol. 2023, 249, 2611–2623. [Google Scholar] [CrossRef]
  18. Li, X.; Long, Q.; Gao, F.; Han, C.; Jin, P.; Zheng, Y. Effect of Cutting Styles on Quality and Antioxidant Activity in Fresh-Cut Pitaya Fruit. Postharvest Biol. Technol. 2017, 124, 1–7. [Google Scholar] [CrossRef]
  19. M’hiri, N.; Ioannou, I.; Ghoul, M.; Boudhrioua, N.M. Extraction Methods of Citrus Peel Phenolic Compounds. Food Rev. Int. 2014, 30, 265–290. [Google Scholar]
  20. Zayed, A.; Badawy, M.T.; Farag, M.A. Valorization and Extraction Optimization of Citrus Seeds for Food and Functional Food Applications. Food Chem. 2021, 355, 129609. [Google Scholar] [CrossRef] [PubMed]
  21. Mahato, N.; Sharma, K.; Sinha, M.; Baral, E.R.; Koteswararao, R.; Dhyani, A.; Hwan Cho, M.; Cho, S. Bio-Sorbents, Industrially Important Chemicals and Novel Materials from Citrus Processing Waste as a Sustainable and Renewable Bioresource: A Review. J. Adv. Res. 2020, 23, 61–82. [Google Scholar]
  22. Anoopkumar, A.N.; Aneesh, E.M.; Sirohi, R.; Tarafdar, A.; Kuriakose, L.L.; Surendhar, A.; Madhavan, A.; Kumar, V.; Awasthi, M.K.; Binod, P.; et al. Bioactives from Citrus Food Waste: Types, Extraction Technologies and Application. J. Food Sci. Technol. 2024, 61, 444–458. [Google Scholar]
  23. Cano-Lamadrid, M.; Artés-Hernández, F. By-Products Revalorization with Non-Thermal Treatments to Enhance Phytochemical Compounds of Fruit and Vegetables Derived Products: A Review. Foods 2022, 11, 59. [Google Scholar]
  24. Santos, D.I.; Martins, C.F.; Amaral, R.A.; Brito, L.; Saraiva, J.A.; Vicente, A.A.; Moldão-Martins, M. Pineapple (Ananas comosus L.) by-Products Valorization: Novel Bio Ingredients for Functional Foods. Molecules 2021, 26, 3216. [Google Scholar] [CrossRef] [PubMed]
  25. Sánchez-Rangel, J.C.; Benavides, J.; Jacobo-Velázquez, D.A. Production of Nutraceuticals in Carrot Bagasse Using Abiotic Stresses. In Proceedings of the VII International Postharvest Symposium 1012, Kuala Lumpur, Malaysia, 25–29 June 2012; pp. 1475–1479. [Google Scholar]
  26. Singleton, V.L.; Rossi, J.A. Colorimetry of Total Phenolics with Phosphomolybdic-Phosphotungstic Acid Reagents. Am. J. Enol. Vitic. 1965, 16, 144–158. [Google Scholar]
  27. Martínez-Zamora, L.; Castillejo, N.; Artés-Hernández, F. Postharvest UV-B and Photoperiod with Blue + Red LEDs as Strategies to Stimulate Carotenogenesis in Bell Peppers. Appl. Sci. 2021, 11, 3736. [Google Scholar] [CrossRef]
  28. Castillejo, N.; Martínez-Zamora, L.; Gómez, P.A.; Pennisi, G.; Crepaldi, A.; Fernández, J.A.; Orsini, F.; Artés-Hernández, F. Postharvest LED Lighting: Effect of Red, Blue and Far Red on Quality of Minimally Processed Broccoli Sprouts. J. Sci. Food Agric. 2021, 101, 44–53. [Google Scholar] [CrossRef]
  29. Castillejo, N.; Martínez-Hernández, G.B.; Artés-Hernández, F. Revalorized Broccoli By-Products and Mustard Improved Quality during Shelf Life of a Kale Pesto Sauce. Food Sci. Technol. Int. 2021, 27, 734–745. [Google Scholar] [CrossRef]
  30. Salas-Millán, J.Á.; Aznar, A.; Conesa, E.; Conesa-Bueno, A.; Aguayo, E. Functional Food Obtained from Fermentation of Broccoli By-Products (Stalk): Metagenomics Profile and Glucosinolate and Phenolic Compounds Characterization by LC-ESI-QqQ-MS/MS. LWT 2022, 169, 113915. [Google Scholar] [CrossRef]
  31. Ledesma-Escobar, C.A.; Priego-Capote, F.; Luque De Castro, M.D. Characterization of Lemon (Citrus Limon) Polar Extract by Liquid Chromatography-Tandem Mass Spectrometry in High Resolution Mode. J. Mass. Spectrom. 2015, 50, 1196–1205. [Google Scholar] [CrossRef]
  32. Aguilar-Hernández, M.G.; Núñez-Gómez, D.; Forner-Giner, M.Á.; Hernández, F.; Pastor-Pérez, J.J.; Legua, P. Quality Parameters of Spanish Lemons with Commercial Interest. Foods 2021, 10, 62. [Google Scholar] [CrossRef]
  33. Domínguez-Gento, A.; Di Giorgi, R.; García-Martínez, M.D.; Raigón, M.D. Effects of Organic and Conventional Cultivation on Composition and Characterization of Two Citrus Varieties ‘Navelina’ Orange and ‘Clemenules’ Mandarin Fruits in a Long-Term Study. Horticulturae 2023, 9, 721. [Google Scholar] [CrossRef]
  34. Srivastav, M. Fruit Quality, Antioxidant Enzymes Activity and Yield of Six Cultivars of Grapefruit (Citrus paradisi) Grown under Subtropical Conditions. Indian J. Agric. Sci. 2013, 83, 842–846. [Google Scholar]
  35. Jacobo-Velázquez, D.A.; Martínez-Hernández, G.B.; Del C. Rodríguez, S.; Cao, C.M.; Cisneros-Zevallos, L. Plants as Biofactories: Physiological Role of Reactive Oxygen Species on the Accumulation of Phenolic Antioxidants in Carrot Tissue under Wounding and Hyperoxia Stress. J. Agric. Food Chem. 2011, 59, 6583–6593. [Google Scholar] [CrossRef]
  36. Santana-Gálvez, J.; Santacruz, A.; Cisneros-Zevallos, L.; Jacobo-Velázquez, D.A. Postharvest Wounding Stress in Horticultural Crops as a Tool for Designing Novel Functional Foods and Beverages with Enhanced Nutraceutical Content: Carrot Juice as a Case Study. J. Food Sci. 2019, 84, 1151–1161. [Google Scholar] [CrossRef] [PubMed]
  37. Artés-Hernández, F.; Rivera-Cabrera, F.; Kader, A.A. Quality Retention and Potential Shelf-Life of Fresh-Cut Lemons as Affected by Cut Type and Temperature. Postharvest Biol. Technol. 2007, 43, 245–254. [Google Scholar] [CrossRef]
  38. Rahman, N.F.A.; Shamsudin, R.; Ismail, A.; Shah, N.N.A.K.; Varith, J. Effects of Drying Methods on Total Phenolic Contents and Antioxidant Capacity of the Pomelo (Citrus grandis (L.) Osbeck) Peels. Innov. Food Sci. Emerg. Technol. 2018, 50, 217–225. [Google Scholar] [CrossRef]
  39. Guimarães, R.; Barros, L.; Barreira, J.C.M.; Sousa, M.J.; Carvalho, A.M.; Ferreira, I.C.F.R. Targeting Excessive Free Radicals with Peels and Juices of Citrus Fruits: Grapefruit, Lemon, Lime and Orange. Food Chem. Toxicol. 2010, 48, 99–106. [Google Scholar] [CrossRef]
  40. Mcharek, N.; Hanchi, B. Maturational Effects on Phenolic Constituents, Antioxidant Activities and LC-MS/MS Profiles of Lemon (Citrus Limon) Peels. J. Appl. Bot. Food Qual. 2017, 90, 1–9. [Google Scholar] [CrossRef]
  41. Yerlikaya, P.; Gokoglu, N.; Topuz, O.K.; Gumus, B.; Aydan Yatmaz, H. Antioxidant Activities of Citrus Albedo and Flavedo Fragments against Fish Lipid Oxidation. J. Aquat. Food Prod. Technol. 2016, 25, 1339–1347. [Google Scholar] [CrossRef]
  42. Dixon, R.; Paiva, N. Stress-Induced Phenylpropanoid Metabolism. Plant Cell 1995, 7, 1085–1097. [Google Scholar] [CrossRef] [PubMed]
  43. Kim, D.-S.; Lee, S.; Man Park, S.; Hyun Yun, S.; Gab, H.-S.; Suk Kim, S.; Kim, H.-J.; Comparative, H. Comparative Metabolomics Analysis of Citrus Varieties. Foods 2021, 10, 2826. [Google Scholar] [CrossRef]
  44. Zeng, J.; Chen, C.; Chen, M.; Chen, J. Comparative Transcriptomic and Metabolomic Analyses Reveal the Delaying Effect of Naringin on Postharvest Decay in Citrus Fruit. Front. Plant Sci. 2022, 13, 1045857. [Google Scholar] [CrossRef]
  45. Zhang, H.; Yang, Y.F.; Zhou, Z.Q. Phenolic and Flavonoid Contents of Mandarin (Citrus reticulata Blanco) Fruit Tissues and Their Antioxidant Capacity as Evaluated by DPPH and ABTS Methods. J. Integr. Agric. 2018, 17, 256–263. [Google Scholar] [CrossRef]
  46. Chang, S.Q.; Azrina, A. Antioxidant Content and Activity in Different Parts of Pomelo [Citrus grandis (L.) Osbeck] by-Products. In Proceedings of the III International Conference on Agricultural and Food Engineering 1152, Kuala Lumpur, Malaysia, 23–25 August 2017; Volume 1152, pp. 27–34. [Google Scholar]
  47. Tsai, H.L.; Chang, S.K.C.; Chang, S.J. Antioxidant Content and Free Radical Scavenging Ability of Fresh Red Pummelo [Citrus grandis (L.) Osbeck] Juice and Freeze-Dried Products. J. Agric. Food Chem. 2007, 55, 2867–2872. [Google Scholar] [CrossRef]
  48. Breksa, A.P.; Manners, G.D. Evaluation of the Antioxidant Capacity of Limonin, Nomilin, and Limonin Glucoside. J. Agric. Food Chem. 2006, 54, 3827–3831. [Google Scholar] [CrossRef]
  49. Zaporozhets, O.A.; Krushynska, O.A.; Lipkovska, N.A.; Barvinchenko, V.N. A New Test Method for the Evaluation of Total Antioxidant Activity of Herbal Products. J. Agric. Food Chem. 2004, 52, 21–25. [Google Scholar] [CrossRef]
  50. Corradini, C.; Borromei, C.; Cavazza, A.; Merusi, C.; De Rossi, A.; Nicoletti, I. Determination of Flavanones in Citrus Byproducts and Nutraceutical Products by a Validated RP-HPLC Method. J. Liq. Chromatogr. Relat. Technol. 2009, 32, 1448–1462. [Google Scholar] [CrossRef]
  51. Rosa, A.; Petretto, G.L.; Maldini, M.; Tirillini, B.; Chessa, M.; Pintore, G.; Sarais, G. Chemical Characterization, Antioxidant and Cytotoxic Activity of Hydroalcoholic Extract from the Albedo and Flavedo of Citrus limon Var. pompia Camarda. J. Food Meas. Charact. 2023, 17, 627–635. [Google Scholar] [CrossRef]
Figure 1. Incubation of lemon, grapefruit, and orange cut peels (CTRL, D, and G) for 0, 4, 8, 24, 28, and 36 h at 15 °C and 65% RH (n = 3).
Horticulturae 10 00885 g001
Figure 2. Total phenolic content of orange (a), grapefruit (b), and lemon (c) peels after different cutting intensities (CTRL, dices, and grated peel) and incubation time (h) at 15 °C and 65% RH. *: significant differences (p < 0.05) among cutting intensity regarding CTRL samples within each incubation time. Δ: significant differences (p < 0.05) among incubation time regarding the same cutting at time 0 h.
Horticulturae 10 00885 g002
Figure 3. Total antioxidant capacity of orange (a), grapefruit (b), and lemon (c) peels determined by DPPH assay after different cutting intensities (CTRL, dices, and grated peel) and incubation time (h) at 15 °C and 65% RH. *: significant differences (p < 0.05) among cutting intensity regarding CTRL samples within each incubation time. Δ: significant differences (p < 0.05) among incubation time regarding the same cutting at time 0 h.
Horticulturae 10 00885 g003
Figure 4. Total antioxidant capacity of orange (a), grapefruit (b), and lemon (c) peels determined by ABTS assay after different cutting intensities (CTRL, dices, and grated peel) and incubation time (h) at 15 °C and 65% RH. *: significant differences (p < 0.05) among cutting intensity regarding CTRL samples within each incubation time. Δ: significant differences (p < 0.05) among incubation time regarding the same cutting at time 0 h.
Horticulturae 10 00885 g004
Figure 5. Total antioxidant capacity of orange (a), grapefruit (b), and lemon (c) peels determined by FRAP assay after different cutting intensities (CTRL, dices, and grated peel) and incubation time (h) at 15 °C and 65% RH. *: significant differences (p < 0.05) among cutting intensity regarding CTRL samples within each incubation time. Δ: significant differences (p < 0.05) among incubation time regarding the same cutting at time 0 h.
Horticulturae 10 00885 g005
Figure 6. Pearson correlation between studied variables of orange, grapefruit, and lemon peels after different cutting intensities (CTRL, dices, and grated peel) and incubation time (h) at 15 °C and 65% RH.
Horticulturae 10 00885 g006
Figure 7. (a) The 2D-PCA scores plot and (b) 2D-PCA loadings plot of orange, lemon, and grapefruit peel samples considering their experimental analyses of TPC, TAC (by DPPH, ABTS, and FRAP assays), and individual phenolic and organic compounds.
Horticulturae 10 00885 g007
Figure 8. The 3D-PCA scores plot of orange, lemon, and grapefruit peels comparing different cutting intensities considering their experimental analyses of TPC, TAC (by DPPH, ABTS, and FRAP assays), and individual compound content.
Horticulturae 10 00885 g008
Table 1. Initial physicochemical parameters of fresh citrus fruits studied: orange (Citrus sinensis), grapefruit (Citrus paradisi), and lemon (Citrus limon) before peel by-product obtention.
OrangeGrapefruitLemon
L*67.0 ± 0.974.2 ± 2.475.9 ± 1.9
a*27.58 ± 1.9514.81 ± 3.361.12 ± 2.12
b*51.74 ± 1.4046.15 ± 3.8355.14 ± 2.86
°h1.09 ± 0.041.27 ± 0.091.53 ± 0.02
C58.8 ± 1.348.8 ± 2.755.2 ± 3.1
Weight (g)214 ± 15228 ± 8159 ± 19
Longitudinal diameter (mm)70.6 ± 3.974. ± 4.482.0 ± 9.4
Equatorial diameter (mm)75.8 ± 3.483.3 ± 2.163.7 ± 1.4
Deformation (%)2.5 ± 0.32.2 ± 0.43.2 ± 0.5
Flavedo thickness (mm)2.0 ± 0.71.7 ± 0.41.2 ± 0.4
Albedo thickness (mm)4.8 ± 0.94.8 ± 0.44.4 ± 1.2
Albedo in the peel (%)71.0 ± 2.974.1 ± 4.879.1 ± 3.5
Juice (%)46.6 ± 5.045.5 ± 3.442.3 ± 10.8
TSS (°Brix)13.9 ± 0.512.3 ± 0.64.5 ± 0.7
pH3.6 ± 0.42.83 ± 0.032.18 ± 0.09
TA (g citric acid 100 mL−1)0.31 ± 0.070.98 ± 0.122.9 ± 0.5
Maturity Index46.2 ± 10.912.8 ± 1.62.8 ± 0.4
Means (n = 10 ± SD). TSS: total soluble solids. TA: titratable acidity. Albedo (%) was calculated as the percentage of this layer in the peel.
Table 2. Main individual phenolic compounds and organic acid concentration (g kg−1 dw) in orange, grapefruit, and lemon peels just after different cutting intensities (CTRL, dices, and grated peel).
Compound
(g kg−1 dw)
NaringinHesperidinDiosminRutinEriocitrinNaringeninCitric Acid
OrangeCTRL1.14 ± 0.0816.9 ± 0.7 a0.19 ± 0.080.577 ± 0.003 a1.194 ± 0.0020.028 ± 0.0010.50 ± 0.11
D1.00 ± 0.0513.0 ± 1.6 b0.12 ± 0.030.363 ± 0.002 ab1.140 ± 0.0050.030 ± 0.0010.30 ± 0.07
G0.64 ± 0.018.78 ± 0.10 c0.19 ± 0.010.213 ± 0.004 b0.704 ± 0.0070.007 ± 0.0010.47 ± 0.08
GrapefruitCTRL9.1 ± 1.0 a0.14 ± 0.02ndnd3.20 ± 0.010.25 ± 0.01 a0.93 ± 0.04 b
D8.2 ± 0.3 b0.24 ± 0.03ndnd3.53 ± 0.030.24 ± 0.01 a1.48 ± 0.07 a
G7.3 ± 0.4 c0.184 ± 0.004ndnd2.66 ± 0.020.206 ± 0.001 b1.08 ± 0.14 b
LemonCTRL0.125 ± 0.0067.9 ± 0.5 a1.38 ± 0.14 b1.003 ± 0.007 b9.2 ± 1.0 and2.75 ± 0.19 b
D0.099 ± 0.0016.86 ± 0.10 a1.71 ± 0.10 a1.46 ± 0.01 a9.2 ± 0.3 and2.93 ± 0.10 b
G0.056 ± 0.0023.98 ± 0.12 b1.02 ±0.02 c1.31 ± 0.01 a b8.1 ± 0.5 bnd6.30 ± 0.11 a
Means (n = 3 ± SD). Nd: non detectable. D: diced cutting. G: grated peel. Different letters denote significant differences (p < 0.05) among different cutting treatment. Absence of letters indicates no significant differences (p < 0.05).
Disclaimer/Publisher’s Note: The statements, opinions and data contained in all publications are solely those of the individual author(s) and contributor(s) and not of MDPI and/or the editor(s). MDPI and/or the editor(s) disclaim responsibility for any injury to people or property resulting from any ideas, methods, instructions or products referred to in the content.