Article

Wild Edible Plant Species in the ‘King’s Lagoon’ Coastal Wetland: Survey, Collection, Mapping and Ecological Characterization

by
Anna Rita Bernadette Cammerino
*,
Lorenzo Piacquadio
,
Michela Ingaramo
,
Maurizio Gioiosa
and
Massimo Monteleone
Department of Science of Agriculture, Food, Natural Resources and Engineering, University of Foggia, Via Napoli, 25, 71122 Foggia, Italy
*
Author to whom correspondence should be addressed.
Horticulturae 2024, 10(6), 632; https://doi.org/10.3390/horticulturae10060632
Submission received: 15 May 2024 / Revised: 3 June 2024 / Accepted: 10 June 2024 / Published: 12 June 2024
(This article belongs to the Topic Mediterranean Biodiversity)

Abstract

:
Wild edible plants, botanically defined as phytoalimurgical species, have historically been a useful source of food to cope with recurrent famines and poor farming conditions. If properly identified, harvested, transformed and promoted, alimurgical plants could further enhance the wellbeing of rural and urban communities and the multifunctional productivity of agriculture. The research aimed to survey alimurgical species in a wetland, map their location, detect their spatial richness, and develop a monitoring plan for ongoing vegetation succession. The study area is the King’s Lagoon, a wetland that has recently undergone a radical restoration of its natural layout. A satellite image was used to create a land cover map and interpret the relationship between plant species and land cover. The survey provided a snapshot of the wetland’s current ecosystem status and used botanical analysis and ecological indices to investigate biodiversity levels. The alpha, beta and gamma levels of biodiversity were explored and interpreted through the statistical processing of a comprehensive dataset of species occurrence and abundance, together with the calculation of Shannon’s, Simpson’s and Jaccard’s indices. It was observed that biodiversity in the wetland is developing gradually following restoration and is expected to increase over time as successional stages take hold. Biodiversity is more pronounced along the banks of the canals and watercourses connecting the basins and open ponds, while it is less pronounced in areas where the soil has been disturbed by previous excavations. Salicornia spp., Beta vulgaris subsp. maritima and Suaeda vera were identified as the most common and interesting species found in the study area. The potential for cultivation of some of the halophyte species that were monitored was also highlighted, with particular reference to the selection of the most commercially interesting species, the best species associations and intercropping practices in a wetland context, which must always prioritize the conservation of wild biodiversity. The spring surveys should be repeated in the coming years in order to accurately trace the dynamics of the ecological succession of this particular ecosystem, once it has returned to its natural development.

1. Introduction

Modern food production systems seriously threaten climate and global health [1,2,3]. Research is therefore underway into alternative food sources, local food production systems and sustainable farming methods to alleviate hunger, meet the growing demand for healthy diets and protect the environment [2,3,4]. Despite the gradual abandonment of traditional agricultural practices, the increasing expansion of food markets on a global scale, and changing lifestyles and diets, interest in wild edible plants has grown in many parts of Europe [5].
A special branch of botany, known as phytoalimurgy, is concerned with wild edible plants (WEPs). Its birth is marked by the book “De alimenti urgentia”, the first scientific publication on the subject, written by the Florentine physician Giovanni Targioni-Tozzetti in 1767. It was probably the constant famines that led this doctor and botanist to become interested in the use of spontaneous herbs. He is credited with the word “alimurgia”, which refers to the science of finding solutions to urgent food needs. However, the term phytoalimurgy was used much later by Oreste Mattirolo in his book “Phytoalimurgia Pedemontana” (1918). He added the prefix phyto to emphasize the plant origin of alimurgical foods [6]. Phytoalimurgy became the research discipline interested in the knowledge of wild edible plants [7,8,9].
WEPs have been an extremely useful source of food in the past to cope with recurrent famines and poor peasant livelihood conditions. Today, in the face of rapid environmental change, particularly the climate crisis, livelihoods may increasingly depend on low-cost, environmentally friendly, resilient and adaptable sources of nutritious food [10,11]. WEPs could play a strategic role in disrupted climate scenarios, where new food sources could be important to ensure food security and where particular landraces or ecotypes could be of paramount importance for gene selection and crop genetic improvement. This is why these ancient food traditions of peasant origin are so highly valued today. If properly identified, harvested, transformed and promoted, WEPs will further enhance both the wellbeing of rural and urban communities and the multifunctional productivity of agriculture. According to the Food and Agriculture Organization [3], over 100 million people in the EU (i.e., 20% of the population) consume WEPs, while 65 million (14%) collect some form of WEPs themselves, at least occasionally [12,13].
The availability of WEPs can be included as a provisioning service in ecosystem service classifications such as the Millenium Assessment (MA) and The Economics of Ecosystems and Biodiversity (TEEB) assessments [14,15]. Classifications of ecosystem services only consider the role of wild plants in providing food. However, the literature suggests that there are also several cultural reasons for collecting WEPs, depending on regional traditions. Indeed, there is also a historical and anthropological rediscovery of the culture of the past and a renewed interest in healthy eating. This type of traditional knowledge has a very localized meaning and a specific geographical value, which makes it a very important cultural knowledge that is now in danger of being lost [16]. Rediscovering these forgotten food resources can significantly support several Sustainable Development Goals (SDGs), including SDG 1 (reduce poverty), SDG 2 (end hunger), SDG 3 (promote health and wellbeing), SDG 12 (ensure sustainable consumption and production patterns), SDG 13 (combat climate change and its impacts) and SDG 15 (preserve ecosystems), as established by the United Nations [17].
Wild plants tend to be richer in micronutrients and bioactive secondary metabolites than their cultivated counterparts [18,19]. Wild vegetables often contain high concentrations of minerals, proteins, high levels of vitamins A and C, and significant amounts of fiber, often more than in cultivated vegetables [20,21,22]. WEPs also generally contain a wide range of plant secondary metabolites such as polyphenols, terpenoids, polysaccharides, etc., making them good candidates for nutraceuticals, i.e., functional foods containing potentially health-promoting ingredients. More than simple food, WEPs can be considered a protodietary supplement with possible cardioprotective and chemopreventive properties [23,24], e.g., via microbiota modulation [25] or nitrate provision [26]. In the last decade, for example, borage (Borago officinalis L.) has received increasing agricultural interest because of the potential market for gamma-linolenic acid extracted from its seeds [27]. Similarly, purslane (Portulaca oleracea L.) is a major source of short-chain omega3 fatty acids, alpha-tocopherol, and bioactive compounds [28]; because of this, there is increasing interest in its cultivation as a food crop [29]. From another perspective, purslane also appears to be an excellent candidate for inclusion in saline drainage water reuse systems [30]. Even those plants containing toxic compounds can be broadly included into the alimurgical categories by considering that local communities did not eat only edible plants but also particular parts of toxic plants [31]. The risk of the inappropriate use of toxic WEPs is well known, as are the operations that must be carried out to neutralize the toxic substances in order to make such plants fit for human consumption [32].
In addition to their health-related properties, WEPs are highly valuable as reservoirs of crop genetic diversity at the farm level. WEP species and varieties have a high level of genetic variation and exhibit distinctive drought and climate resilience, pest and disease resistance, and many other interesting traits because they have not gone through the genetic bottleneck of domestication [10].
Given the significant and largely untapped nutritional, agricultural, economic and ecological potential of WEPs, their current limited use represents a lost opportunity at a cost to our economy and society. According to some authors, there are between 300,000 and 500,000 plant species on the planet, of which 30,000 can be considered edible [33]. Throughout history, only 7000 of these 30,000 edible plants have been cultivated or collected for food [34,35]. Yet today, only 20 species supply 90% of the world’s food needs, with wheat, maize and rice accounting for 60% of the human diet [36].
Apart from a handful of studies [12,16,19,37,38], quantitative data on wild food collection are scarce and scattered. In contrast with the limited quantitative information on the geographical distribution of WEPs, the literature review provides a wealth of information on the reasons for collecting wild plants [38,39,40,41,42,43,44,45,46,47,48]. Plants are collected close to peasants’ homes, from crop fields, uncultivated field margins, wild areas or hedgerows near the village [37,41,42,49,50,51]. Participation in collecting WEPs is still common in rural communities [13,37,43,52] where wild plants are available and easy to harvest, even in large quantities, so that a limited but interesting market can take place [41,43,48,52].
Collecting WEPs is considered an important part of the cultural tradition of a rural community [37,46,53].
The strategy to be followed is quite clear: in order to rediscover and valorize WEPs, an interdisciplinary approach is needed. First the most interesting species at country level should be prioritized, then in situ survey and mapping of the selected WEP species are necessary to address gaps in the data regarding distribution, abundance, conservation status and collection. In parallel, the creation of ex situ genetic reserves can contribute to WEP conservation. Recent scientific advances can be applied to better characterize WEP varieties and assess their safety for human and animal consumption to meet consumer demand and provide additional market opportunities. Government could also be encouraged to promote the cultivation of WEPs in sustainable cropping systems and contribute to the protection of ecological rich spaces at the agricultural margins. Finally, proper dissemination and communication activities are mandatory to increase consumer’s awareness about WEPs and their use to enhance their consumption as a healthy and environmentally sound foodstuff [54].
This paper is a first attempt to present the results of a survey and mapping of the spatial distribution of WEPs in the “King’s Lagoon”, a coastal wetland of about 40 ha in the Gulf of Manfredonia (southern Italy, province of Foggia), within the Gargano National Park. This area has recently been restored to its original wetland state through the reconstruction of canals and flooded areas. It is therefore interesting to note that this area is in its first stage of ecological restoration and that it is expected that in the coming years a dynamic spatial and functional arrangement in the distribution of WEPs will develop according to the ecological conditions that will be established in the area.
There are two main broad, though closely related, aims that we have identified for the work presented here: the first is more research oriented to ecology and botany and the second is more research applied to horticulture and cultivation.
(1)
The aim of the experimental work presented here was to survey and identify the alimurgical species present in the wetland at this stage of ecological succession, to map their spatial location according to a land cover composition, to verify their presence and abundance, to establish the most frequent correspondences between the various species and any systematic associations between them, and to define a monitoring plan that can be adopted in subsequent years to follow the ongoing succession of the vegetation (limited to alimurgical plant species in this particular study).
(2)
Another aim of the research is to select the most widespread, suitable and useful WEPs for the possible experimental start of a productive activity of cultivation, processing and marketing of these alimurgical plants, in order to plan an activity that, while maintaining the priority of safeguarding the precious and fragile natural context, also allows a certain rural sustainable development in the area of interest.
It should be remarked that the “King’s Lagoon” has been selected as a reference study area in a national project called AGRITECH (WP7.3.3); this wetland is a showcase for several nature-based solutions that have been specifically considered in the project activities [55]. In addition to the strategic importance of restoring the wetland through renaturation and protection measures, the agricultural activity is also subject to specific evaluation so that it can be carried out in symbiosis with the conservation of biodiversity, establishing a mutually beneficial relationship with the latter. In this context, experience is being developed in regenerative agriculture through the cultivation of spontaneous edible grasses in soil and brackish water conditions, together with agroforestry and permaculture [55].

2. Materials and Methods

2.1. Study Area

A qualitative and quantitative survey of the phytoalimurgical species present in the meadows and grasslands of the “King’s Lagoon” (the English translation from the Italian “Laguna del Re”) was carried out in the spring 2023. The King’s Lagoon is located in Siponto (Manfredonia, province of Foggia, southern Italy). It is a coastal wetland directly connected to the Adriatic Sea, at the mouth of the Candelaro stream, with an extension of 40 hectares, part of the whole reclamation system of the Siponto polder (Figure 1).
The reclamation began a long time ago but was decisively carried out just before the Second World War and completed in the 1950s. It involved a radical alteration of the natural hydrological regime in order to reclaim land for agriculture and human settlement. The remaining wetlands that still exist are one of the cornerstones of the Apulian coastal landscape. Today, the King’s Lagoon plays an important naturalistic role, it is included in the European Natura 2000 network and is designated both as a zone of special conservation (ZSC), called the “Capitanata wetlands”, and as a special protected area (SPA), called the “Marshes of the Gulf of Manfredonia”. It is characterized by two priority habitats: 1150* “coastal lagoons” and 1510* “mediterranean salt steppes”, according to the EU Habitats Directive (please note that the asterisk conventionally indicates the “priority” status of the habitat). For more information on how the King’s Lagoon fits into the Natura 2000 network, see Supplementary Material (S1).
An important EU environmental LIFE project [55] was developed in the Siponto area; as a result, the new wetland, i.e., the King’s Lagoon, was created on the site of a previously reclaimed wetland. The project was completed in 2019 after 5 years of activity. The project consisted of a wetland restoration project, which was carried out by replacing some agricultural land and illegally built areas with a natural-looking wetland system; the redesign of new and the reopening of old canals that had silted up; the digging of “valleys” (i.e., stretches of open water); the installation of weirs to regulate the inflow and outflow of water; and the creation of sluices in order to restore the typical transitional coastal environment, characterized by the alternation of flooded areas and dry land for agricultural use [56].
The new wetland has also been equipped with wildlife observation structures (towers, boardwalks, and hides) to promote the naturalistic practice of birdwatching, as well as footpaths, huts, and terraces for visitors to encourage them to visit the natural oasis. It should be noted that the EU project also had an important social impact in terms of reestablishing legality, as after the demolition of the unauthorized buildings and the restoration of the natural environment, the former inhabitants were given small plots of land to grow fruit and vegetables under legal contracts. Today, agriculture is only allowed in certain areas of the entire wetland system and is properly regulated [56].
The climate is typically Mediterranean (hot, dry summers and mild, rainy winters), while the soil is highly saline and sodic, often clayey, making it difficult to grow wild plants or cultivate crops.

2.2. Land Cover Mapping

The land cover map of the King’s Lagoon was processed with a GIS software (QGIS 3.34.3-Prizren) using a Pleiades NEO satellite image (30 cm resolution) acquired on 24 July 2023. The image details correspond to an information scale of 1:500 (System Reference: EPSG:32633–WGS 84/UTM zone 33N). Considering the limited extent of the area and the high variability of the land cover classes to be mapped and their scattered spatial distribution, the photo interpretation was made by an initial identification and subsequent polygonization of different land cover classes according to a predefined set of categories. The polygonization was carried out directly on the satellite image by drawing from an empty vector base, i.e., without the aid of reference cartography. The polygonization consisted of drawing polygons and circumscribing homogeneous areas according to their recognized typology (land cover category).
The map produced in this way, at a very detailed scale, was compared with other, broader maps produced by other institutes, such as the Regional Land Use and Land Cover Map [57] and the Nature Map [58], in order to check their congruence. The resultant land cover classification has been structured into two hierarchical levels (Table 1), the first of which is made up of only four general classes, as follows: wetland and aquatic/riparian ecosystems (WET), semi-natural vegetation areas (MEAD), built-up areas (BUILT), agricultural areas (AGR). The second level contains more differentiated land cover categories.
This mapping result meets the following criteria:
-
Unique definition of each category;
-
Hierarchical organization of the classification structure, i.e., the higher-level categories are made up of a set of lower level categories;
-
Categories at the same level are mutually exclusive.
At the end of the photo-interpretation phase, a field check was carried out to resolve any doubts or uncertainties about category assignment and to assess the reliability of the procedure followed.

2.3. The Species under Study

The phytoalimurgical species prioritized in the field surveys are mostly identified as ‘focus species’ for two reasons: their possible or expected presence in the wetland and their actual or potential use. In this work, phytoalimurgical properties are considered in a broad sense, including not only plants that are directly edible, but also plants that are partially edible (with respect to certain parts or plant organs), and plants that are not directly edible or even toxic, but from which compounds of nutritional, nutraceutical or pharmaceutical interest can be extracted. These “focus species” were six plants, as follows: Portulaca oleracea L., Cichorium intybus L. and Beta vulgaris L. These plants are widely used as vegetables in various Apulian gastronomic recipes. Salicornia spp. is used as a vegetable and it is currently gaining increasing commercial interest; it is a halophyte species (i.e., it can tolerate high soil salinity concentrations) and it can be cultivated under very high soil salinity conditions [59,60,61]. Suaeda vera J. F. Gmel. is not used in gastronomy, although it may have interesting uses in pharmaceuticals and nutraceuticals [62,63,64]; it was included in the study as it was considered to be a dominant plant in the area. Finally, Glycyrrhiza glabra L. is an officinal species widely observed in the nearby wetlands and is considered interesting due to its very high economic potential.
In addition to the ‘focus species’ taken as reference plants, many other phytoalimurgical species were detected in the wetland that are widely used in local gastronomy [6], along with some other officinal species also considered in this study as well as plant sources of bioactive molecules, anticancer agents or, more generally, health-promoting biomolecules and pharmaceuticals from saline environments [65,66,67].

2.4. Plant Species Detection and Survey Design

The orthophoto of the study area was ideally overlaid with a 50 m grid to define regular survey plots or square cells. A total of 165 square cells were placed on the map and used to locate the sampling areas. Two close-up surveys were carried out in July 2023 (on 11 July and on 14 July), crossing the peak of the phenological stage of anthesis (i.e., flowering). Each cell/site was identified in the field by the geographical coordinates of its center. For each cell/site, the area covered by herbaceous vegetation (grasses and meadows) was identified and visually estimated, excluding areas covered by water bodies, waterways and canals, reed beds, agricultural land, roads, buildings and other man-made infrastructure. This process was greatly facilitated by the use of the previously prepared land use map.
This plant species survey was designed to identify and then collect information not on the vegetation as a whole, but only on the plants belonging to the species of interest, i.e., the broadly defined alimurgical category (WEPs). The resulting methodological approach can therefore be considered close to, but not identical with, an effective ‘floristic survey’. In fact, while floristic surveys are concerned with a total and complete inventory of all the species in a vegetation, the botanical survey, as applied in this case, focused exclusively on species belonging to the natural grass and meadow plant type.
Vegetation data were systematically collected from each cell/site along a number of defined and permanent transect lines, following a modified [68] floristic approach. In most cases the transects coincided with existing footpaths, but in the case of cells with large and dense grass areas with non-linear displacement, one or more circular sample plots of standard size (10 m diameter) were randomly selected and the plant composition assessed in this way. The importance of accurate species identification is, of course, paramount in surveys. The use of field guides and taxonomic keys are important components of every floristic survey. In this study, plant species were identified according to Pignatti [69], life forms and chorotypes were assigned also according to Pignatti [70] and for nomenclature we followed Bertolucci [71] and Galasso [72]. A range of contextual information, defined as ‘stationary data’, was recorded, including elevation, slope, exposure, substrate type, possible presence of outcropping rock, etc. Rather than a simple list of species detected (i.e., species “occurrence”), a semi-quantitative analysis was carried out for each species in each cell/site. In fact, the list of species was also linked to an estimate of species “abundance”, namely their estimated land cover. The latter is the proportion of the ground area occupied by a species when viewed from above. Among the visual estimation methods, the Braun–Blanquet (BB) scale [73] is the most popular method as it is faster, cheaper and easier to use when compared with the other botanical field survey methods [74]. The BB scale, as modified in this study, shows six levels of grass cover (Table 2).
In addition to the cell/site assignment, the biological form, chorology, ecology and plant associations were defined for each species surveyed. Finally, the species detected were characterized in terms of their potential nutritional or medicinal interest, distinguishing between edible (C), officinal edible (C-CO), officinal (O), toxic (T) and toxic-officinal (TO) species according to the Acta Plantorum data sheets [75].

2.5. Data Analysis and Statistical Processing

Land cover. The dataset obtained from the land cover map was organized while taking into account each 50 × 50 m2 cell/site and the distribution of each land cover category (shown in Table 1, first column) within the cells. Therefore, the presence of each first-order land cover category was determined, together with its areal extent in each square cell/site. First, the total distribution of the main cover categories was assessed. Then, for each category, the relative spatial occurrence in each cell was also calculated in the form of a frequency distribution histogram.
A summary of the overall experimental data processing approach is shown as a flowchart in Figure 2.
As shown in Figure 2, land cover composition and land cover frequency distribution were obtained from the land cover analysis (top left-hand side of the figure). By superimposing the regular grid on the map, the cells/sites where the plant survey was to be carried out were identified; the plant survey in each cell/site provided the raw database from which all the ecological indices to be compared between cells and between species could be further processed according to the flowchart shown in Figure 2.
Cell x Species [C;S] and Species x Cell [S;C] matrices. The central part of the diagram in Figure 2 shows the plant survey from which all of the experimental data were obtained. These data consisted of species occurrence and species abundance in relation to each 50 × 50 m2 cell/site (165 in total). While species occurrence should be considered simply as the presence of a species in a cell/site, abundance is related to the estimated ground cover of each species detected, expressed by one of the codes already reported in Table 2. A cell × species matrix [C;S] was thus developed and, alternatively, a species × cell matrix [S;C] can be developed; here, the first matrix is the transpose of the second and vice versa. The occurrence matrix [C;S]O is simply a presence–absence matrix (0 = species not present and 1 = species present), while the abundance matrix [C;S]A reports data by specifying its cover code or by reporting a converted estimate of its ground cover fraction (using the conversion factors reported in the last column of Table 2). The same is true for its transpose [S;C]. The occurrence matrix [C;S]O can be easily derived from the abundance matrix [C;S]A (the original survey dataset) by simply considering that, for each value of ai,j, the corresponding value of ri,j is as follows:
If ai,j > 0, Then ri,j = 1;   Else ri,j = 0
where ai,j is the abundance record in the i-th cell (by row, from 0 to n) and when considering the j-th species (by column, from 0 to m), and ri,j is the corresponding occurrence record, expressed as the presence or absence data (1 or 0, respectively).
As shown in Figure 2, two different types of statistical data processing can be performed. The analysis can be focused on “species” (column mode) or on “cells” (row mode). If the interest is focused on “species”, then a “species x species” matrix [S;S] can be extracted from the two data matrix by the following matrix multiplication:
[S;S] = [S;C] × [C;S]
Conversely, if the interest is focused on “cells”, then a “cell × cell” matrix [C;C] can be extracted from the two data matrix by the following matrix multiplication:
[C;C] = [C;S] × [S;C]
where [S;C] is the transpose matrix of [C;S]. In other words, in the first case the matrix [C;S] is pre-multiplied by its transpose, while in the second case the same matrix [C;S] is post-multiplied by its transpose. Both of the resulting matrices, [S;S] and [C;C], are square and symmetric matrices, i.e., the upper and lower triangles along the main diagonal are mirrored, and the same diagonal expresses self-comparisons (between cells or between species, depending on the case). Figure 2 clearly shows these aspects.
Plant species. First, the list of all detected plant species of alimurgical interest was compiled; then, species by species, a summary statistic of their occurrence and abundance or relative ground coverage was arranged. Then, considering the “species × species” matrix [S;S] calculated from the occurrence matrix [C;S]O, its main diagonal (bj,j) reports the self-occurrence by species, i.e., how many times each species is detected considering all the cells/sites of the study area, while the other b terms in the same matrix inform about the cross-occurrence, i.e., how many times each species is detected together with another species considering all the cells/sites of the study area. The latter is a measure of the association between pairs of species observed in the wetland. Correspondingly, when considering again the “species × species” matrix [S;S], but this time obtained from the abundance matrix [C;S]A, its main diagonal (bj,j) reports the degree or average strength of the presence of each observed species in the area (another way to express the magnitude or strength of the species occurrence), while all of the other b terms in the same matrix inform about the strength of the cross-species link, i.e., how strong the linkage is between pairs of species observed in the wetland or, in other words, the strength of the inter-species association. The values in the matrix are scaled to an average score in the range 0–5 as already shown in Table 2.
The possible ecological arrangement of the species detected, i.e., the successional occupation of ecological niches by species entering the wetland system, was explored using a rank–abundance plot, the so-called Whittaker plot [76,77]. From the resulting scatterplot, a suitable mathematical function was selected to fit the data properly; in our case, an equilateral hyperbola proved to be the best fitting choice.
Cell/Site phytoalimurgical diversity. Species richness (R) and species abundance (A) were determined for each cell/site. The absolute species richness corresponds with the number of species ni detected in the i-th cell/site during the survey; the relative richness is the ratio of this number (ni) to the total number of species observed in the whole study area. The frequency distribution of the relative richness index (ni/N) of each i-th cell was therefore determined for the whole area. Similarly, the species abundance in each cell/site is calculated by summing the estimated land cover (see first column of Table 2) of all the species detected in that cell/site; the relative species abundance is then obtained by converting this value to the fraction of land area actually covered by the species of interest (conversion factors are given in the third column of Table 2). The frequency distribution of the relative abundance index for each i-th cell was also determined for the whole area.
Considering the “cell × cell” matrix [C;C] calculated from the occurrence matrix [C;S]O, its main diagonal (cj,j) reports the species richness per cell/site, i.e., how many species are detected in each cell/site of the study area, while all of the other c terms in the same matrix give information about the cross-richness, i.e., how many species are in common with pairs of cells/sites in the study area. The latter is a measure of the species association between pairs of cells/sites in the wetland or, in other words, the inter-cell species similarity or communality. Correspondingly, when considering again the “cell × cell” matrix [C;C], but this time obtained from the abundance matrix [C;S]A, its main diagonal (cj,j) reports the species abundance within each cell/site, while the other b terms in the same matrix inform about the cross-species abundance, i.e., the shared species abundance between pairs of cells/sites in the wetland. The values in the matrix are scaled to a score in the range 0–5 as already shown in Table 2.
From the values of species richness and species abundance of each cell/site it was possible to calculate both the well-known Shannon’s diversity index (H) and Simpson’s diversity index (D). A diversity index is a mathematical measure of species diversity in a community. Diversity indices provide more information about community composition than simply species richness as they also take the relative abundances of different species into account. A diversity index, indeed, depends not only on species richness but also on the evenness, or equitability, with which species are distributed in the same community.
Considering pj as the relative abundance (i.e., cover fraction) of each j-th species within the s total number of species detected in a cell/site, the H index can be calculated as follows:
H = j = 1 s p j l n ( p j )
The Shannon index takes into account both the richness and the evenness of the species present in a community [78,79]. The evenness of the species distribution increases as all pj values tend to converge, thus assuming a single, uniform value. While the minimum value of H is zero, there is no maximum value, which grows as the number of species increases, evenness being equal. This index is related to the concept of entropy interpreted in terms of information theory and quantifies the uncertainty or the degree of surprise associated with a given event [79]; in other words, it is the probability associated with a given event, such as the random extraction of an individual of a certain species in a heterotypic community.
Alternatively, the diversity can be calculated using the Simpson index according to the following formula:
D = 1 j = 1 s p j 2
In this case, the value of 1 − D is the probability of extracting individuals of the same species within a heterotypic community after two consecutive random extractions, but with replacement. The D index has a value between 0 and 1, with higher values indicating greater diversity and lower values indicating lower diversity. In the case of two consecutive random samples, but without replacement, the same index (expressed in frequency units) has the following formula:
D = 1 j = 1 s p j × p j = 1 j = 1 s n j N × n j 1 N 1  
where nj is the number of individuals of each j-th species within the s total number of species detected in a cell/site, while N is the total number of individuals, regardless of their species, namely N = ∑nj.
With respect to the Simpson index, the “cell × cell” matrix [C;C] is obtained from the abundance matrix [C;S]A but expressed in the form of relative abundance (i.e., cover fraction pij); its main diagonal (cj,j) reports the 1 − D values per cell/site of the wetland, while the other b terms in the same matrix inform about the common or shared species D-diversity between pairs of cells/sites in the study area.
Differently, when considering the H-Shannon index, the “cell × cell” matrix [C;C] is obtained, this time by a slightly different procedure and according to the following matrix multiplication:
[C;C]H = −[C;S] × ln [S;C]
where the ln [S;C] is the natural logarithmic transpose matrix of the relative abundance matrix [C;S]A with the condition that the zero (0) values in the same matrix have been converted into one (1) in order to avoid the undefined solution ln(0). Its main diagonal (cj,j) represents the H-Shannon values per cell/site of the wetland, while the other b terms in the same matrix inform about the common or shared H-diversity between pairs of cells/sites in the study area.
Once the H and D biodiversity indices were calculated for each cell/site, their frequency distribution was plotted and interpreted. In addition, a functional relationship was established between the values of the D index (as dependent or response variable) and the values of the H index (as independent variable or regressor), taking into account the statistical significance of the effects of both species richness (R) and species abundance (A). A negative exponential equation was chosen as the appropriate function from which to interpret the data and to explain most of the total variability of the data.
Finally, by working on the presence–absence occurrence matrix [S;C]O, it was possible to compute a similarity coefficient known as the Jaccard index [80]. The latter can be defined synthetically as the size of the intersection divided by the size of the union of sample sets. Given two cells/sites, for example A and B, the Jaccard coefficient is a measure of the overlap that A and B have in terms of their species occurrence. If A and B have some species in common, this combination can be reported as M11 (total number of species shared); A and B may also not share some species, this combination is reported as M00 (total number of species not in shared); alternatively, a given species may be present in A but not in B, or vice versa; in these cases M10 and M01 are the corresponding numbers of possible combinations. Each possible combination must fall into one of these four categories, therefore (M11 + M00 + M10 + M01) = N (total number of species in the cell/site) or, in relative terms: (M11 + M00 + M10 + M01) = 1. The Jaccard similarity coefficient (J) is given by:
J ( A B ) = M 11 M 11 + M 10 + M 01
Taking into account the usual matrix operations, the Jaccard matrix [C;C]J can be calculated according to the following formula:
[ C ; C ] J = C ; C C ; C + 1 2 × N C ; C M  
where:
[C;C] = [C;S] × [S;C]
provided that [C;S] = [C;S];
[C;C]M = [C;S] × [S;C]
provided that [C;S] = [C;S]O and the zero (0) values in the same matrix have been converted into minus one (−1) and where N represents the total number of detected species.
The interpretation of the formula is as follows:
[C;C] = M11
[C;C]M = M11 + M00 − M10 − M01
N = M11 + M00 + M10 + M01
therefore:
N − [C;C]M = (M11 + M00 + M10 + M01) − (M11 + M00 − M10 − M01) = 2 (M10 + M01)
All possible [C;C]J values are in the range from 0 (no species in common) to 1 (all species in common); for example, J = 0.5 means that fifty percent of the species occurring in both A and B cells/sites are in common.
Cluster analysis was performed on both [C;S] and [S;C] matrices using the hierarchical clustering method according to Ward’s minimum variance procedure.
JMP software (Statistical Discovery, JMP Pro 16.0, SAS Institute Inc., Cary, NC, USA, 2021) was used for all types of statistical data processing.

2.6. Seed Collection and Conservation

Once the survey had been carried out and the plants had been biologically identified and ecologically characterized, the decision was made to proceed with seed collection. Not all of the species identified were selected, only those species that showed the greatest potential for cultivation and use for a range of alimurgical purposes. Seeds were collected by hand at a time corresponding with their physiological maturity for each species selected. The aim of the seed collection was to initiate, at least as a first attempt, a horticultural production based on native plants. The supply of seed from the wild was kept very limited in order to avoid any possible negative impact on the conservation of native species, but an attempt was made to obtain an adequate representation of the genetic diversity of the populations through random sampling in different cells/sites. Given the limited size of the study area, its state of relative isolation in being surrounded by highly anthropized neighboring areas, and the threatened status of the species present, the decision was made to limit collection of this seed to a strict minimum, reserving the possibility of initiating seed multiplication through subsequent nursery activities. No precise harvesting plan was drawn up for this purpose, as even less than roughly 1% of the total seed availability for each species of interest was taken. The collected seeds were left to air dry without any forcing (neither heat nor ventilation) and then stored in cloth bags in a dry place at a relatively constant temperature of 20 °C. The prepared seed was entrusted to an experienced nurseryman who sowed the seeds in trays of honeycomb pots and prepared the seedlings in time for transplanting outdoors.

3. Results

3.1. Land-Cover Analysis

The study area was divided into a total of 165 square cells/sites by conceptually overlaying a regular 50 × 50 m2 grid. The total expected area was therefore (165 × 50 × 50=) 412,500 m2. However, the actual area covered by the survey was 397,768, or 96% of the theoretical total (Table 3), due to incomplete square cells at the edges of the study area.
As expected, wetlands and aquatic/riparian ecosystems (WET) were the most representative land cover category and was present in 99% of the cells/sites and accounted for 57% of the total area of King’s Lagoon. Semi-natural vegetation (MEAD) was the second most relevant land cover category in the study area. It was present in 97% of the cells/sites and accounted for 28% of the total area of the King’s Lagoon.
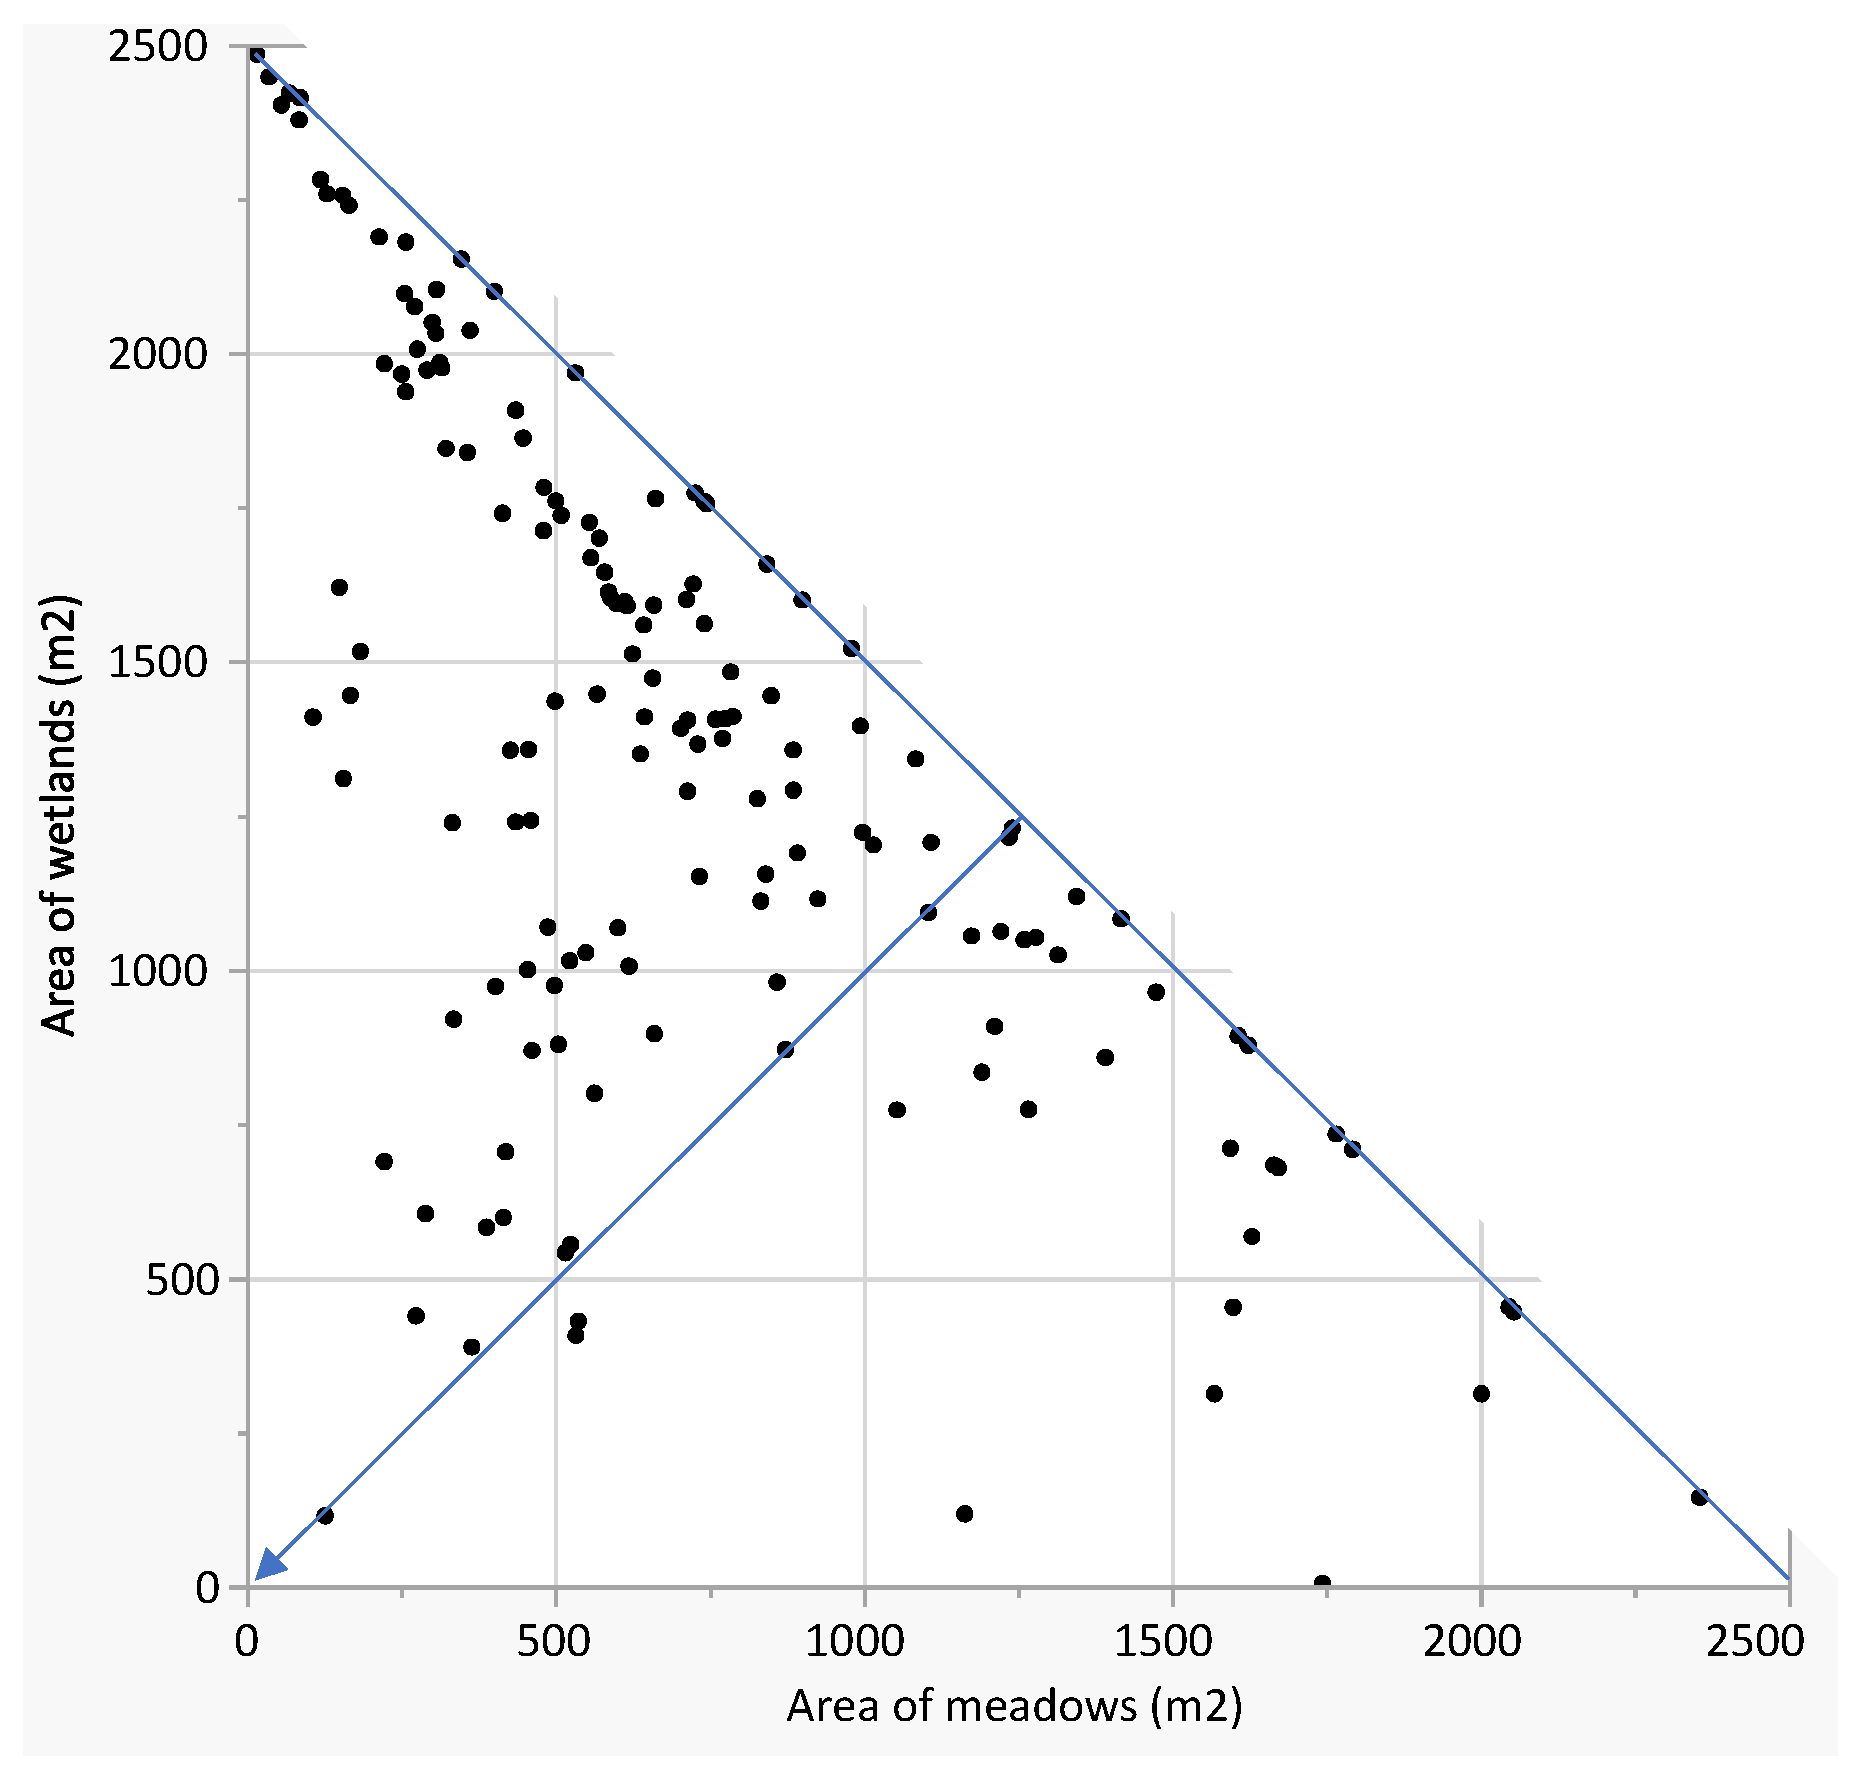
Figure 3 shows the distribution of cells/sites between the WET and MEAD categories. There is no particular clustering of site cover composition and sites are fairly evenly distributed between the two categories.
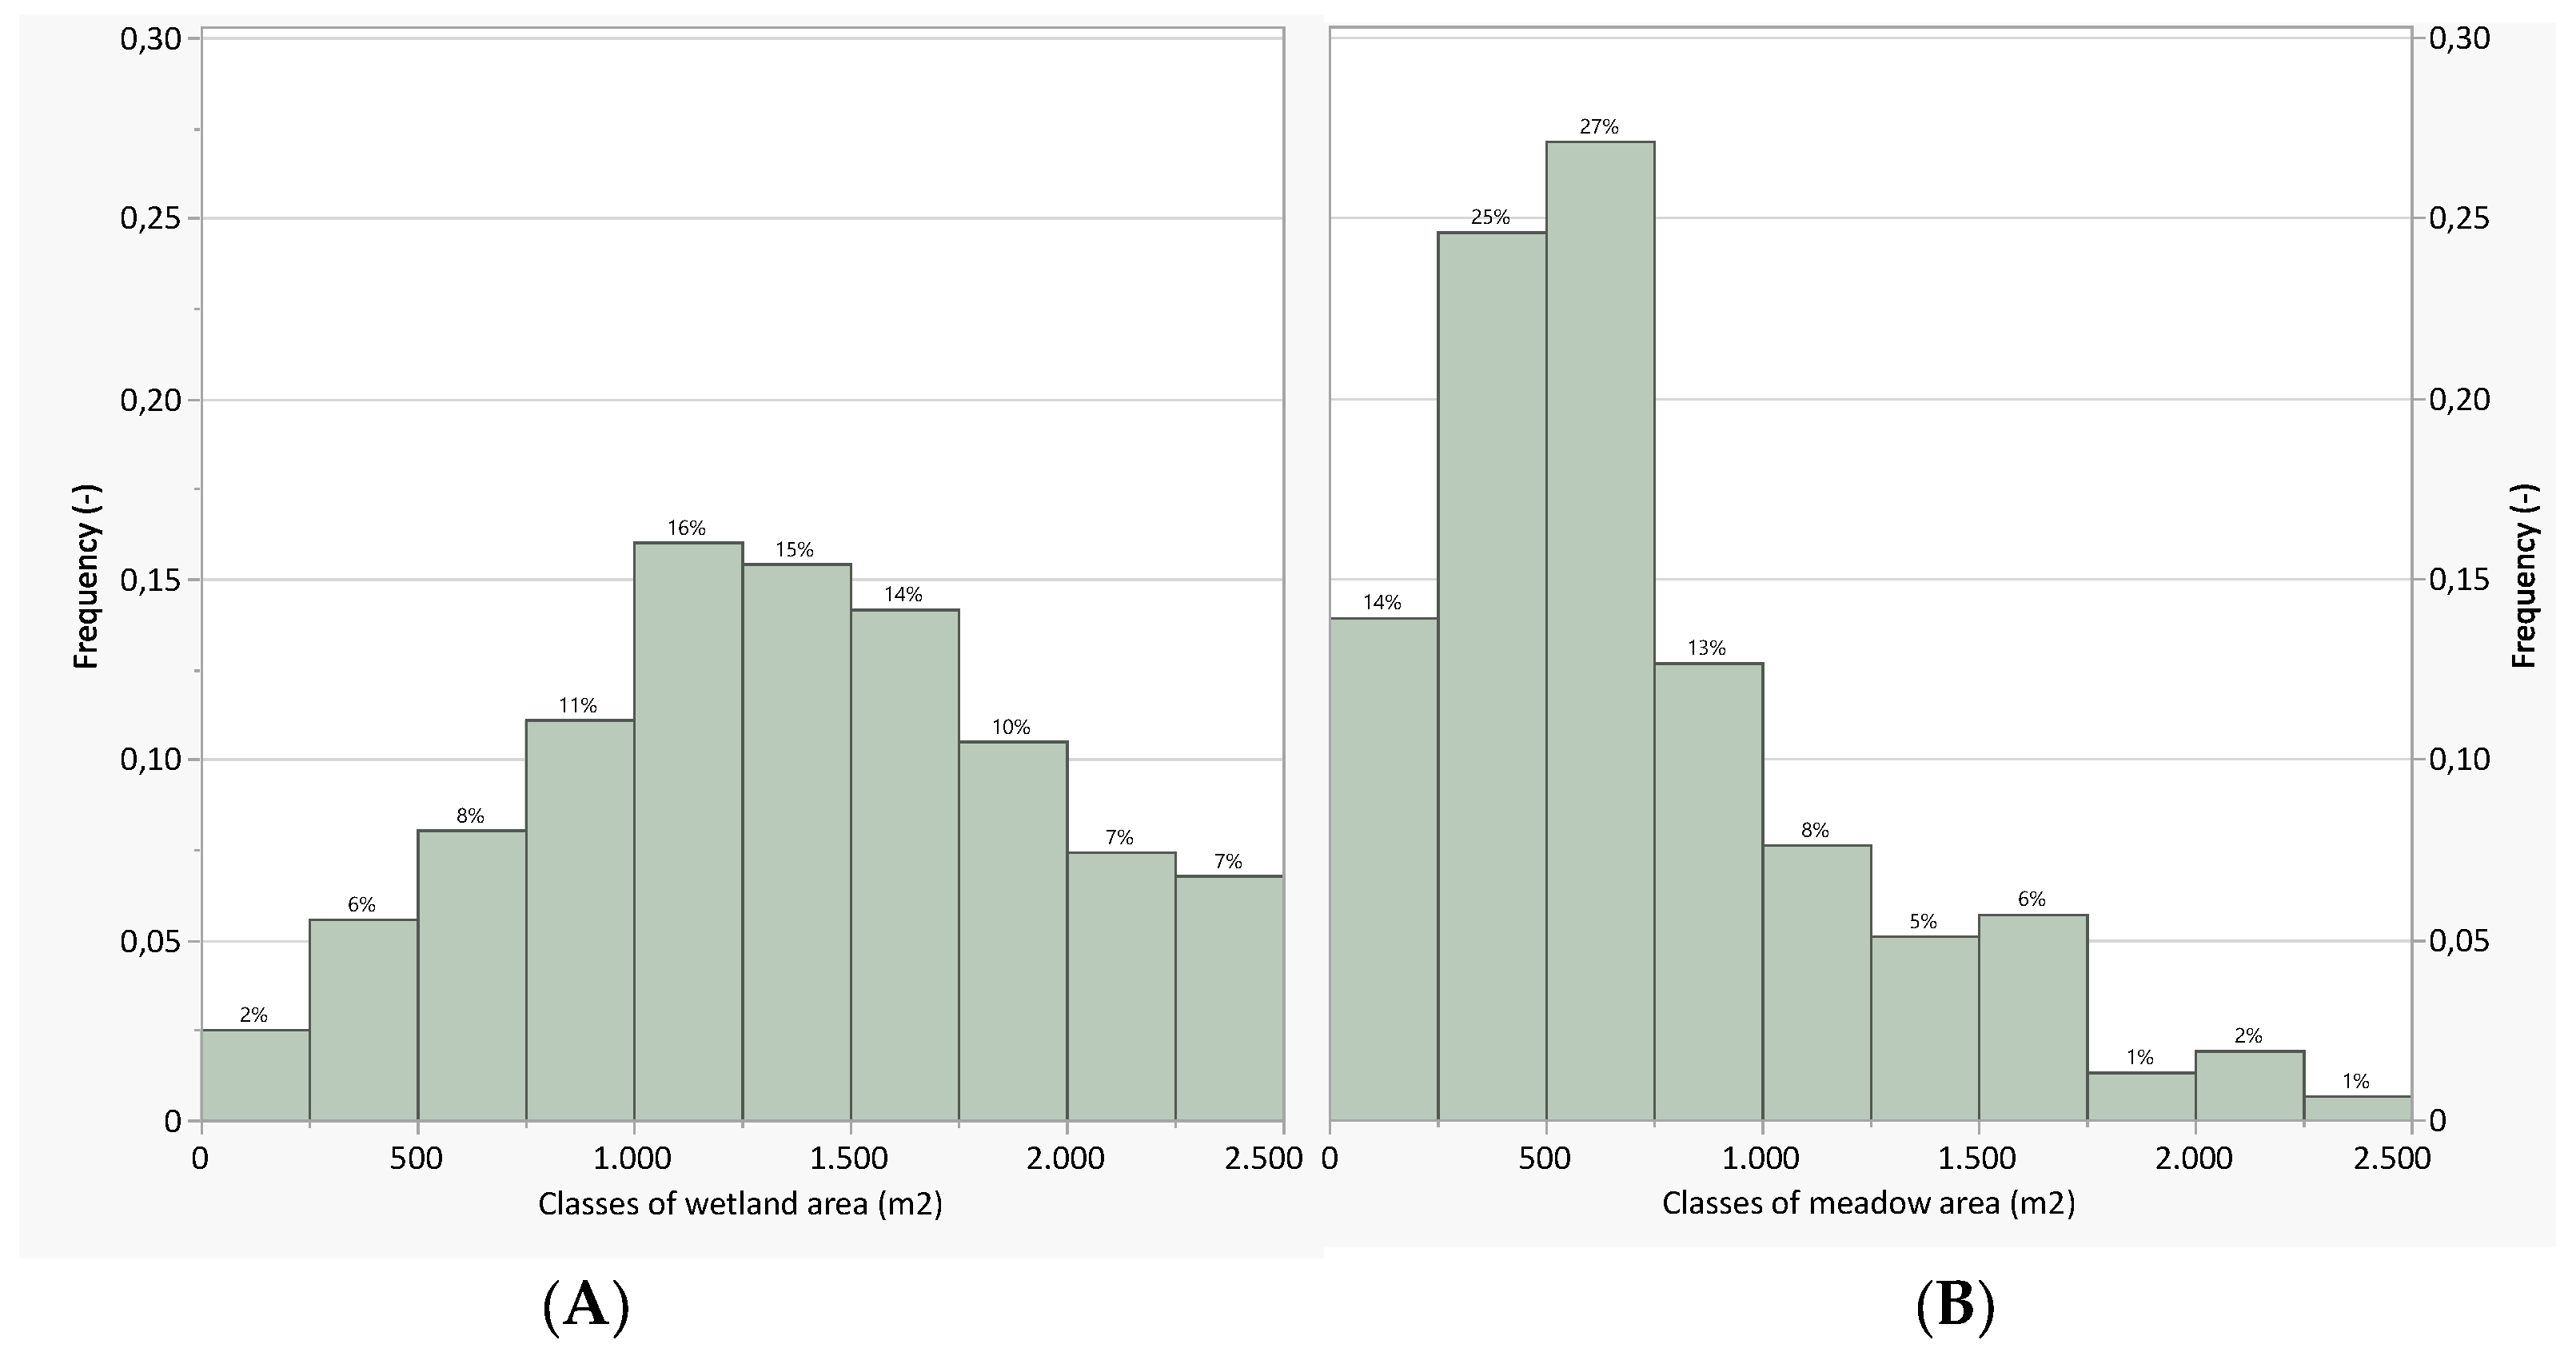
The frequency distribution of the WET area in the cells (Figure 4A) shows that the three main classes (from 1.000 to 1.750 m2) account for about 45% of all the observations.
Differently, the frequency distribution of the MEAD area in the cells (Figure 4B) shows that the two main classes (from 250 to 750 m2) account for more than 50% of all of the observations. Both of the figures (Figure 4A,B) clearly indicate that wetlands are a much larger and more dispersed land cover component than meadows and that the latter are rarely the main or dominant feature of the overall landscape. However, it should be remembered that the natural restoration process has only just begun and that this structural arrangement is likely to evolve further as the ongoing ecological succession continues.

3.2. Species Analysis

Table 4 shows a list of all phytoalimurgic species detected in the two surveys. A more detailed description of these species can be found in Supplementary Material (S2), including biological forms, chorological types, geographical distribution and typology of use, which are also reported in the same appendix. Focus species are identified from S1 to S6 in Table 4 and are shown in bold.
The first step in processing the species data was to identify the most common and abundant species in the study area. The results are presented in Table 5.
Firstly, it should be noted that the S1 species is not included in the list presented in Table 5 because Glycyrrhiza glabra, surprisingly, was not detected in the study area on either of the two survey dates, although it was quite common in the surrounding area of the King’s Lagoon. In terms of relative species occurrence, the percentages given in the table refer to the proportion of cells in which the species are present at a given cover fraction (A, R, U, C, CC, CCC and total, in respective accordance with the categories reported in Table 2). For example, with regard to S6 (Suaeda vera), the plant was detected in 73% of the cells/sites (column “total occurrence”), while it was apparently absent in 27% of the cells/sites (column A); in 49% of the cells/sites, the plant covered between 75 and 100% of the area occupied by grasses and meadows (column CCC). The last two columns of Table 5 (i.e., species coverage) give the relative (expressed in %) and the absolute (expressed in m2) of the area where each species or species groups were observed.
The species S6 (Suaeda vera) was, by far, the most common species (73%) with the highest degree of coverage (55%), while S7 (Sonchus oleraceus) and S10 (Picris hieracioides) were significantly more common (47–59%) and abundant (11–13%) with respect to all of the other remaining groups of species; S8, S4 and S5 (Daucus carota, Beta vulgaris, and Salicornia spp., respectively) can be grouped together given that they have similar occurrence (14–16%) and coverage (3–4%). Finally, all of the other plant species can be joined together as they showed lower occurrence (<8.0%) and coverage (<1.7%).
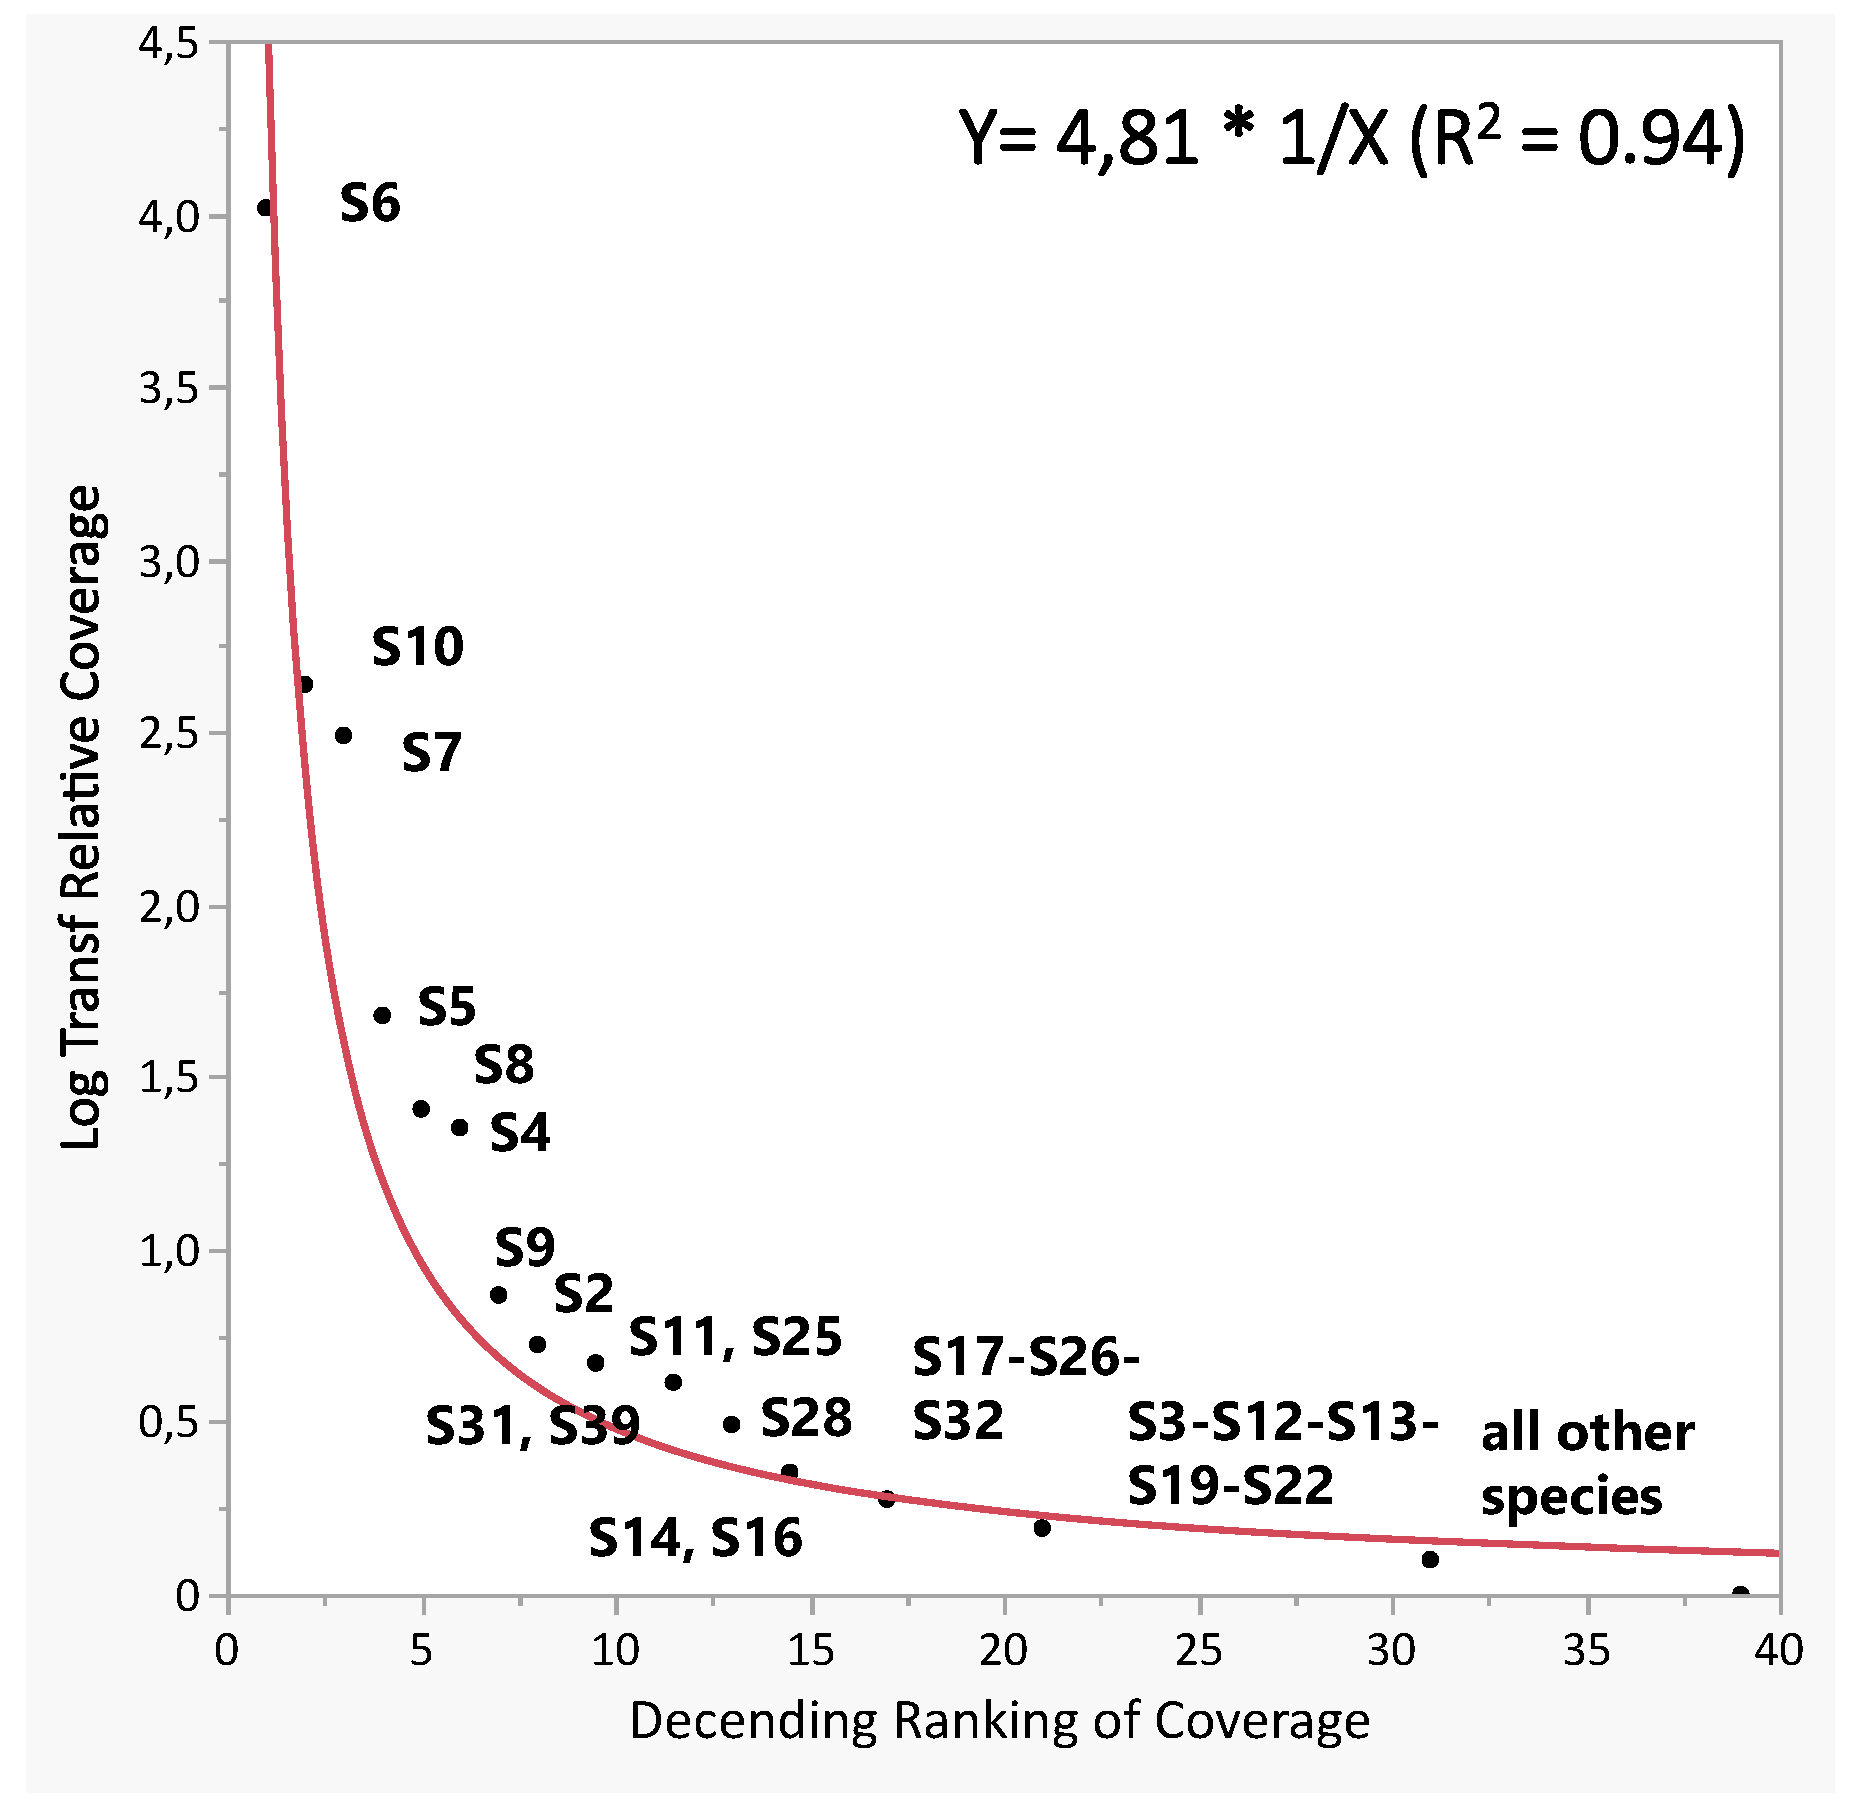
When information on the relative abundance of species is available, a meaningful description of diversity can be made by looking at its distribution among species ranked in order of abundance. A common approach is to use rank–abundance plots, also known as dominance–diversity curves (Figure 5).
This type of purely descriptive approach attempts to interpret the relative abundance of species (i.e., relative coverage in our case) by fitting a mathematical function to the data in order to derive a possible underlying biological pattern [76,81]. In this type of plot, species are plotted in ascending order of abundance (relative cover in our case) from left to right on the x-axis, with the most abundant species on the far left and the rarest species on the far right. Proportional abundance is plotted on the y-axis, using the natural logarithmic scale (ln), so that the resulting curve reflects the hierarchical distribution of abundances across species. With this in mind, Figure 5 was developed using the rank–abundance plot (or ‘Whittaker plot’). An equilateral hyperbola was then fitted to the data and the fit was statistically significant (R2 = 0.94; SSE = 0.25). The resulting rank–abundance curve provides information about the ecological plant community (limited to the selected species), information that is quite accessible at a glance.
The plot in Figure 5 shows that only a small number of species (and in particular only one of them, S6) are visibly abundant and thus monopolize a considerable part of the dominance (in other words, controlling almost all the available resources).
A in Table 6 shows a limited part of the “species × species” matrix [S;S] calculated from the occurrence matrix [C;S]O, while B in Table 6 shows the same part of the “species × species” matrix [S;S] but with calculations starting from the abundance matrix [C;S]A. Only the main species in the area have been considered in this table, i.e., group 1 (S6), group 2 (S7 and S10), group 3 (S8, S4, S5) and group 4 (S9, S25, S11, S31, S39), as originally reported in Table 5.
Looking at the two tables side by side, the diagonal values in A in Table 6 correspond exactly with the total relative species occurrence (%), as reported in Table 5. Due to the relevant predominance of S6, its self-occurrence, shown in A in Table 6, is 72.72% and its self-coverage, shown in B in Table 6, is also very high (score 4.34). This latter information means that the self-link strength of S6 is, on average, very strong (>4.00). On the other hand, S7, although it was the second most diffused species (self-occurrence 58.79%), has a rather low self-coverage (score 1.04). Looking at the mutual association of S6 with S7, we can see that their cross-occurrence is high (55.15%) but that the strength of their mutual link is not the highest (1.73). In other words, 91 out of the 165 cells/sites have both S6 and S7 present, but the average strength of this link is not very strong. Another considerable species is S10, its self-occurrence, shown in A in Table 6, is 47.27% and its self-coverage, shown in B in Table 6, is also quite high (score 1.38). When considering the association of S6 with S10, 73 out of 165 of the cells/sites have both present (44.24% of cross-occurrence) and 1.83 is the strength of this link (cross-coverage). Another relevant cross-species link is the association of S6 with S5; their cross-occurrence (B in Table 6) is higher than 1.00 (and equal to 1.19).

3.3. Cells/Sites Analysis

When looking at the biodiversity data expressed by the 164 cells/sites that make up the study area, species richness (R) and species abundance (A) were the first attributes considered. The frequency distribution of the relative richness index (ni/N) for each i-th cell is shown in Figure 6A.
Similarly, the species abundance in each cell/site is calculated by summing the estimated land cover (according to the score reported in the first column of Table 2) corresponding with that cell/site over all species; the relative species abundance is then obtained by converting this value to the fraction of land area actually covered by the species of interest (conversion factors are given in the third column of Table 2). The frequency distribution of the relative abundance index for each i-th cell is shown in Figure 6B.
It should be noted that 39 out of 165 cells/sites (representing 24% of all cells in the study area) were characterized by the complete absence of at least one of the 38 listed species of interest. In terms of species richness (Figure 6A), the three main classes of cell/site relative occurrence (from 5.0 to 7.5%, from 7.5 to 10.0%, and from 10.0 to 12.5% of the total number of species in the study) were characterized by the following respective frequencies: 21, 24 and 28%, totaling 73% of the entire distribution.
In terms of relative species abundance or relative plant cover of the species of interest (Figure 6B), more than 50% of the cells/sites (52% exactly) were characterized by a percentage cover in the range of 80–100% of the total grass cover, while more than 10% (12% exactly) were characterized by a percentage in the range of 60–80%. Therefore, if present, the phytoalimurgic species make up the majority of the grass and meadow species in the study area, at least in 64% of the cells/sites.
The Shannon’s (H) and Simpson’s (D) biodiversity indices were computed for each cell/site and their frequency distribution is shown in Figure 7A,B respectively.
Thirty percent of cells/sites had an H index between 1.00 and 1.25, while the cells/sites with values between 0.75 and 1.00 represented approximately 22% of the total number of cells/sites. Regarding the D index, by far the largest proportion of cells/sites (around 28%) were found to have values between 0.6 and 0.7.
To obtain a reference order of magnitude for the H and D values, one can simply calculated that an even distribution of 7–8 species in a cell/site corresponds to an H value of 1.95–2.08 and a D value of 0.86–0.88. These should be considered among the higher biodiversity values in terms of H and D indices observed in the dataset. However, if the distribution of species within the cells is no longer homogeneous (i.e., an equal share of the ground cover), so that, for example, one species represents 50% of the ground cover and the others share the remaining cover equally, the two indices are drastically reduced. For example, in relation to the presence of 8 species in a cell/site, H goes from 2.08 to 0.347, while D goes from 0.88 to 0.250.
Species richness, species abundance as well as Shannon’s and Simpson’s indexes were found to be significantly correlated with each other (Table 7).
The high statistical redundancy between these biodiversity variables means that, in reality, only one of the variables could be sufficient to convey almost all of the statistical information associated with the others, a condition that greatly facilitates the interpretation of the data. A detailed statistical description of the functional relationships linking Simpson’s and Shannon’s indices, as well as the other biodiversity indices, such as species abundance and richness, can be found in Supplementary Material (S3), to which reference is made.
Finally, the similarity coefficient, known as the Jaccard index (J), can provide information on the profile of species shared by cell/site pairs. The largest group of cells/sites with the highest Jaccard index value (equal to 1) is the one that brings together the following 17 cells: C6, C15, C16, C18, C37, C47, C48, C51, C52, C60, C85, C98, C109, C113, C135, C147, C165. In this cluster, three species are represented: S6 (average score 4.3), S7 (average score 1.0) and S10 (average score 1.5). The second larger group of cells/sites with J equal to 1 is represented by the following eight cells: C4, C27, C38, C45, C46, C130, C139, C157. In this cluster, four species are represented: S6 (average score 4.6), S7 (average score 1.0) and S10 (average score 1.3), S4 (average score 1.1). Moreover, the third larger group of cells/sites with J equal to 1 is represented by the following 7 cells: C22, C23, C24, C33, C34, C35, C36. In this latter cluster, only two species are represented: S6 (average score 5) and S39 (average score 1). There are several other smaller clusters sharing exactly the same species (J = 1), such as the following: C11, C30, C31, C42, C43, C44 (two species in common); C13, C49, C64, C80, C138, C161 (two species in common); C2, C3, C19, C39, C110 (four species in common); C73, C86, C120, C123, C136 (four species in common); and so on for other even smaller groups. Cluster analysis was performed on this similarity data and the corresponding dendrogram was obtained (but reported as Supplementary Material S4).

4. Discussion

4.1. Plant Survey and Ecological Charactwrization

Whittaker [82] originally proposed the partitioning of diversity into alpha, beta and gamma components to characterize different scale levels of diversity. Thus, alpha and beta diversity can be considered as a pair of complementary aspects of biodiversity, within and between habitats respectively, whereas gamma diversity should be considered as the total diversity over the entire area under consideration [83]. According to our methodological approach, alpha diversity can be derived from the “cell × cell” matrix [C;C], conversely, gamma diversity can be obtained from the “species × species” matrix [S;S], both extracted from the same raw data matrix [C;S]. When considering the beta diversity the two matrix approaches can be useful; for example, the inter-species association and their association strengths were obtained from the [S;S] matrix, while the Jaccard index was obtained from the [C;C] matrix (refer to Figure 2 for a visual representation of the overall statistical data processing).
The most widely used ecological measures of compositional similarity [84] include the classic metrics proposed by Jaccard [80] and Sorensen [85]. In our work the Jaccard index was applied. However, an important ecological issue is to understand how much of this similarity (or, conversely, dissimilarity) is driven by simple compositional differences and how much is driven by differences in relative abundance [83]. This problem was methodologically solved, in this paper, by using two different kinds of matrices: the occurrence matrix [C;S]O, that is simply a presence–absence matrix (0 = species not present and 1 = species present), and the abundance matrix [C;S]A whose data report the ground cover fraction of each species in each cell.
Species richness, occurrence, cell/site plant composition and land cover have been reported in the previous section; now, it will be interesting to assess whether and, if so, how (i.e., according to which criteria) the land cover arrangement (obtained from photointerpretation of a satellite image) affects the composition of grass species between cells/sites and, consequently, whether there are variations in species configuration that can be associated with corresponding variations in the arrangements of land cover categories. In other words, our present objective is to assess the spatial distribution of the observed diversity among the surveyed plants.
Shannon’s index, was able to discriminate different levels of biodiversity between cells/sites better than other ecological indexes, such as species richness and abundance alone, and more accurately than Simpson’s index. Accordingly, Shannon’s index was taken as the reference biodiversity variable, also considering its strong association with Simpson’s index, species richness and species abundance, as confirmed by the significantly high correlation coefficients between them (Table 7).
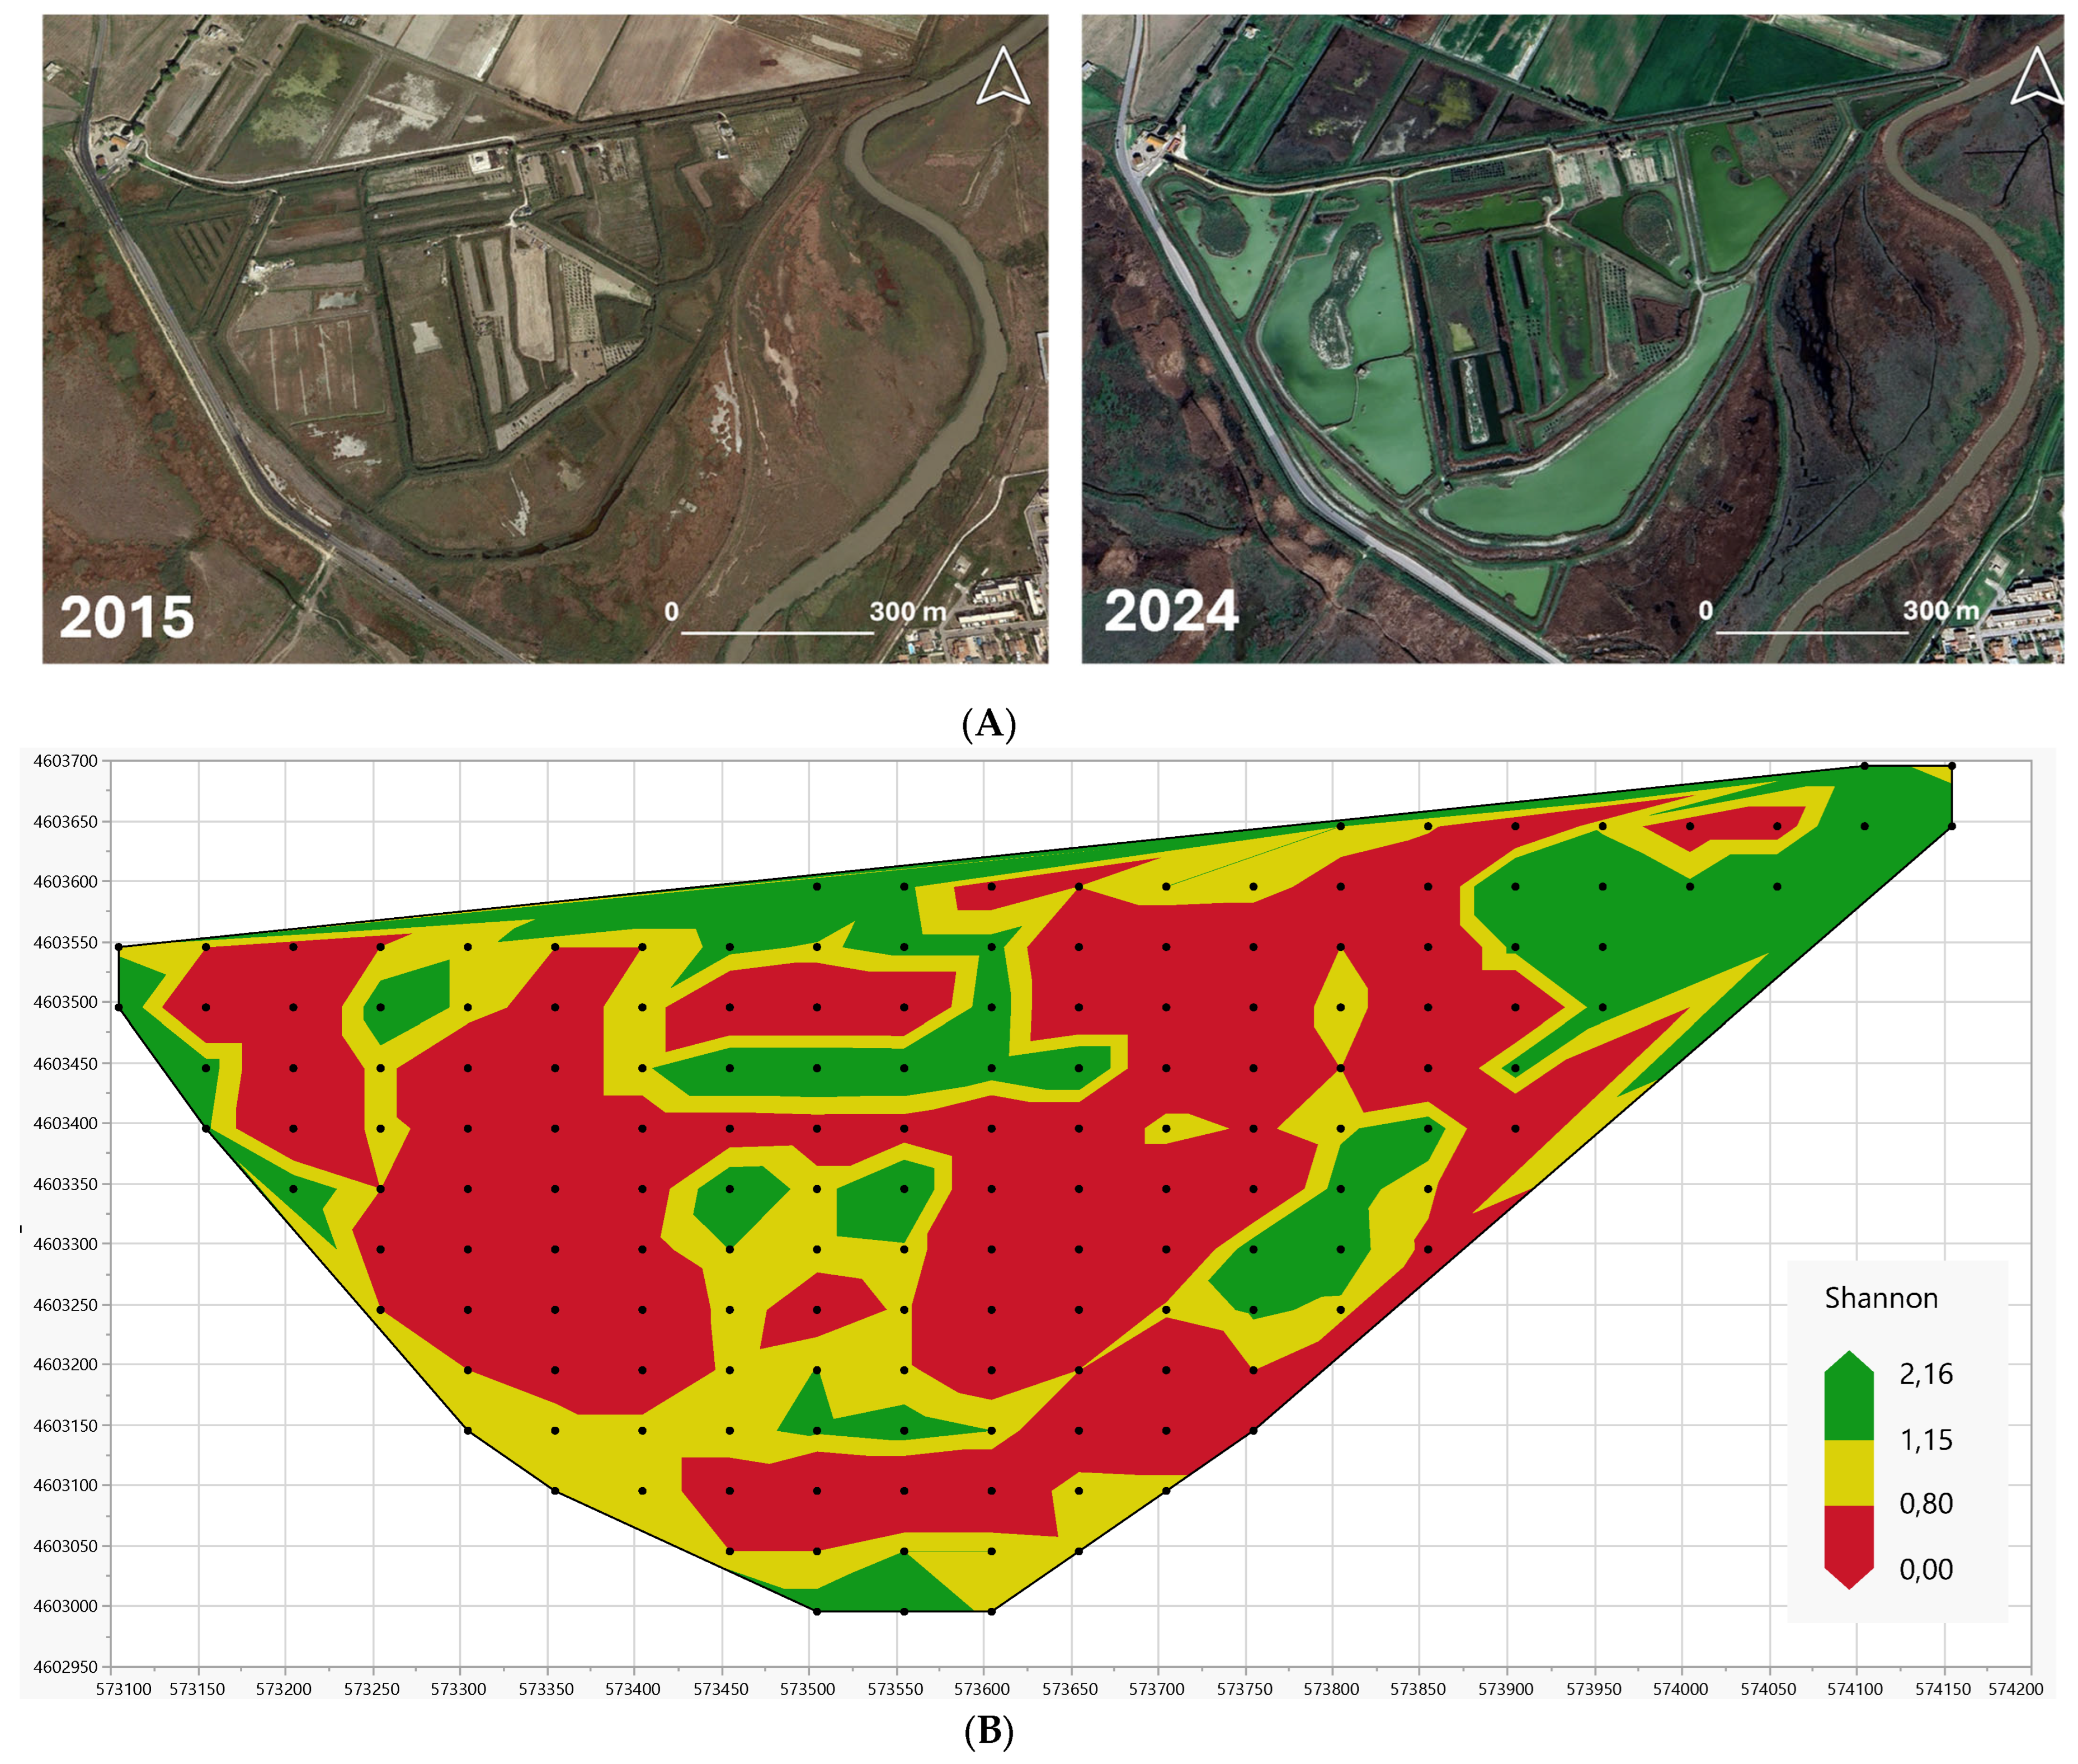
Three successively decreasing biodiversity levels (according to Shannon’s values) were identified, mapped (Figure 8B) and compared (Figure 8A).
The following zonation was derived from the spatial mapping of Shannon’s results:
-
Sites with the highest diversity (green areas in Figure 8B). These correspond with the forth (upper) quartile of the Shannon distribution (Figure 7A, cumulative frequency higher than 75%). Undisturbed sites are included in this category, i.e., sites not involved in the LIFE project earthworks aimed at wetland restoring; embankment areas, i.e., areas along the edge line between agriculture and reedbeds, which correspond with areas that existed prior to restoration, but which are adjacent to new wetlands created as a result of recent excavations; and “corridors” connecting new stretches of water (“valleys”) and halophilic meadows, which are periodically and partially flooded and act as “sources” of biodiversity. In all of these areas, the natural vegetation has developed freely, without any particular interference or disturbance from human activity.
-
Sites of higher diversity (yellow areas in Figure 8B). These correspond with the third quartile of the Shannon distribution (Figure 7A, cumulative frequency in the range 50–75%). These sites are located along the banks of streams with soils of different textures; from west to east the soil texture changes from clayey to sandy, which slightly affects plant diversity.
-
Sites with lower diversity (red areas in Figure 8B). These correspond with the first and second quartiles of the Shannon distribution (Figure 7A, cumulative frequency in the range 0–50%). These sites are characterized by high soil salinity and have therefore been occupied by pioneer Salicornia vegetation and other annuals colonizing mud and sand.
Biodiversity is developing gradually and is expected to increase over time as the restoration phases take hold. Diversity is most pronounced along the banks of the canals and watercourses that connect the basins or “valleys” (open stretches of water). In fact, these areas can be considered as transitional or ecotonal environments, where the edge effect prevails and the most suitable conditions are found for a significant increase in ecological niches and, consequently, species diversity.
The well-known “edge effect” encompasses a set of influences that act on the boundary between two types of adjacent environments, or on the contact zone between the two (for example, the tension zone between valley and canal, or between footpath and embankment). This effect causes a change in environmental conditions (such as microclimate) and thus a change in vegetation structure and land cover in the tiles or fragments of the ecological mosaic, which has direct and indirect effects on the distribution and abundance of species [86,87].
The construction of the embankments involved massive earth movements, with the addition and/or relocation of soil and the alteration of soil horizons. All this may have favored, depending on conditions, the establishment of different species, which may or may not have contributed to the increase in biodiversity. In addition, the soils are saline sodic, and the area has undergone massive excavations that have resulted in the repositioning of the soils, so that today we have a varied situation where we move from areas with predominantly sandy and sandy–loamy soils to others with predominantly clayey soils.
It should be recalled that the most commonly occurring species are represented, in descending order, by Suaeda vera (S6), Sonchus oleraceus (S7), Picris hieracioides (S10), Daucus carota (S8), Beta vulgaris (S4), and Salicornia spp. (S5). The descriptions of these plant species in the literature are in perfect agreement with what was observed in our analysis, confirming all of their ecological characteristics and properties. Suaeda vera (S6), is a perennial halophyte commonly found in high to moderate salinity conditions; it has the ability to thrive in dry to very dry soils [60,61,88]. According to Sordes et al. [89], Suaeda vera can be the dominant species, is able to recolonize silty salt sediments, and, together with other species, such as Salicornia sp., is a facilitator pioneer species in salt marsh succession. Sonchus oleraceus (S7) is a tolerant species to high salinity and alkalinity conditions [90]. It is considered a noxious invasive weed [91]. It is a highly competitive plant with the aptitude to adapt very well in newly establishment environments [92,93]; it possesses a high tolerance to prolonged drought and it can germinate under varying pH levels and is not completely suppressed by saline soil conditions [93]. Picris hieracioides L. (S10) is an annual or biennial herbaceous plant that colonizes the early and middle stages of post-cultivation succession in the Mediterranean region. It is widespread in Europe and tends to be basophil, settling into nitrophilous vegetation, such as that of uncultivated land, margins, grassland, etc. Daucus carota (S8), beyond its cultivated forms, is a weed that tolerates drought but prefers periodically moist areas with moderately nutritious soils and warm and sunny areas. Beta vulgaris L. (S4) grows spontaneously in uncultivated lands and near the sea; it is resistant to salt water and is therefore widespread along the Mediterranean coasts. Wild beet display considerable salinity tolerance during germination and early seedling development [94]. Beets are salt and drought tolerant plants [95]. Salicornia sp. (S5) is a pioneer plant [96,97] and, being a halophyte that is frequently found in salt marshes and that grows in saline areas near the coastlines, is known as one of the most salt-tolerant and low-water–demanding plants [60,61,98]. From an ecological perspective, this plant belongs to a family of extreme halophytes, a specific plant group that can be strongly adapted to saline environments. This genus may thrive in a wide range of temperatures, it has an annual life cycle, and supports uncommon plant conditions in hard seasons [99].
It is possible to observe that the species we have indicated as focal plants in the area can be broadly divided into two categories: (1) predominantly halophilic species (such as Suaeda, Salicornia and Beta) and (2) predominantly ruderal and/or native invasive species (such as Sonchus, Picris, Daucus); the latter are not purely halophilic species but can easily adapt to the harsh conditions of the area. In particular, Suaeda vera is the dominant species, it is well adapted to arid conditions and, together with Salicornia, has excellent salinity tolerance. It seems to be the species best able to colonize brackish environments on marginal soils. As previously reported, Suaeda is associated with Salicornia in only 14% of the sites, and the strength of the association is not very high (a score just a little higher than 1); in fact, Salicornia requires the presence of water, whereas Suaeda can survive in arid conditions. As a result, Salicornia is more present along the edges of the canal and in areas that are periodically flooded, while Suaeda is found in the innermost parts of the wetland, in areas that are not systematically flooded. The co-occurrence of the two species may be related to ecotonal environments that are only periodically flooded. Suaeda is frequently associated with Sonchus (55% of the cells/sites) and with Picris (44% of cells/sites) and the strength of these relationships is quite strong (although always to the total advantage of Suaeda), though it is higher in Picris (score 1.83), given its superior ruderal and invasive traits, than in Sonchus (score 1.73). Picris and Sonchus are associated in 42% of the cells/sites but the presence of Sonchus is weak because Picris is more ruderal (association strength less than 1).
Complementary to species richness, the greater the evenness of a site, the greater its ecological diversity, assuming that evenness corresponds with equitability, i.e., there is an equal probability of occurrence. The underlying concept is such that, if one or a few species dominate the species assemblage, the community will not be very diverse. Conversely, if no species dominates, the community will be more diverse. Diversification is related to ecological development or succession; in particular, this type of arrangement, also known as “niche apportionment”, seems to be a feature of early successional stages, particularly when considering plant communities in harsh environments. The concept of niche preemption assumes that species colonize a region sequentially, with the first species to arrive receiving the majority of resources [100]. As a result, species richness in these early communities is highly uneven and ecological diversity is very low, with the overwhelming dominance of a few or a single species [100]. This particular initial condition of ecological succession, characterized by the presence of dominant, pioneering species, was clearly observed in the King’s Lagoon study area; it was undoubtedly recognized by the shape offered by the rank–abundance or dominance–diversity plot (Whittaker curve plotted in Figure 5). The resulting species distribution follows an equilateral hyperbola, clearly showing that one or very few species absolutely dominate the heterotypic community.

4.2. New Edible Crop Potential: From Wild to Cultivated Plant

In one of our earlier but recently published papers [55], a comprehensive wetland planning process was proposed and the aim of the work was precisely to “assess the role of agriculture and biodiversity” in a restored coastal wetland, using King’s Lagoon as a study area. Among a number of actions to be considered, the proper design and management of agricultural activity was identified as a top priority. Indeed, agriculture should work in alliance with the conservation of biodiversity, both wild and cultivated, rather than in opposition to it. Wetlands and agriculture, although historically seen as antagonistic environments, are still closely linked [3] and in many cases agriculture in wetlands remains a persistent human activity [2]. In this respect, agriculture can be a risk factor for the conservation of wetland ecosystems or, conversely, a stabilizing factor. It all depends on the agricultural model applied. Agricultural practices should not only be fully compatible with the conservation of this fragile ecosystem, but also contribute to its regeneration and further diversification. At the same time, we expect that wetland agriculture and its associated biodiversity will be able to benefit from a compensatory effect resulting from the functioning of the natural wetland ecosystem, thus allowing agriculture to achieve greater autonomy from agro-technical inputs and a higher level of resilience [55].
In this respect, a number of actions were identified as being closely related to the exercise of agriculture/horticulture.
-
Promoting low-input/low-impact farming practices;
-
Developing agronomic practices based on the ecosystem structure and functioning;
-
Applying innovative cropping models and agricultural practices related to permaculture (food forest) and agroforestry;
-
Cultivating traditional crops, old varieties, and phytoalimurgic species;
-
Cultivating halophytic species;
-
Creating permanent strips of spontaneous or cultivated vegetation;
-
Making proper use of brackish water irrigation techniques;
-
Applying alkaline soil remediation techniques;
-
Utilizing climatic adaptation to increase the resilience of farming systems (mixed- and inter-cropping, minimum soil mechanical disturbance, maintenance of a permanent soil cover, diversification of plant species, prevention of soil losses from water run-off and consequent erosion, improvement of the agricultural soil quality, etc.).
Within this framework, Salicornia spp., Beta vulgaris subsp. maritima and Suaeda vera were identified as the most interesting of the species found in the study area and, among others, the most prevalent halophytes in the Atlantic and Mediterranean regions, often thriving in salt marshes and abandoned salt pans [101].
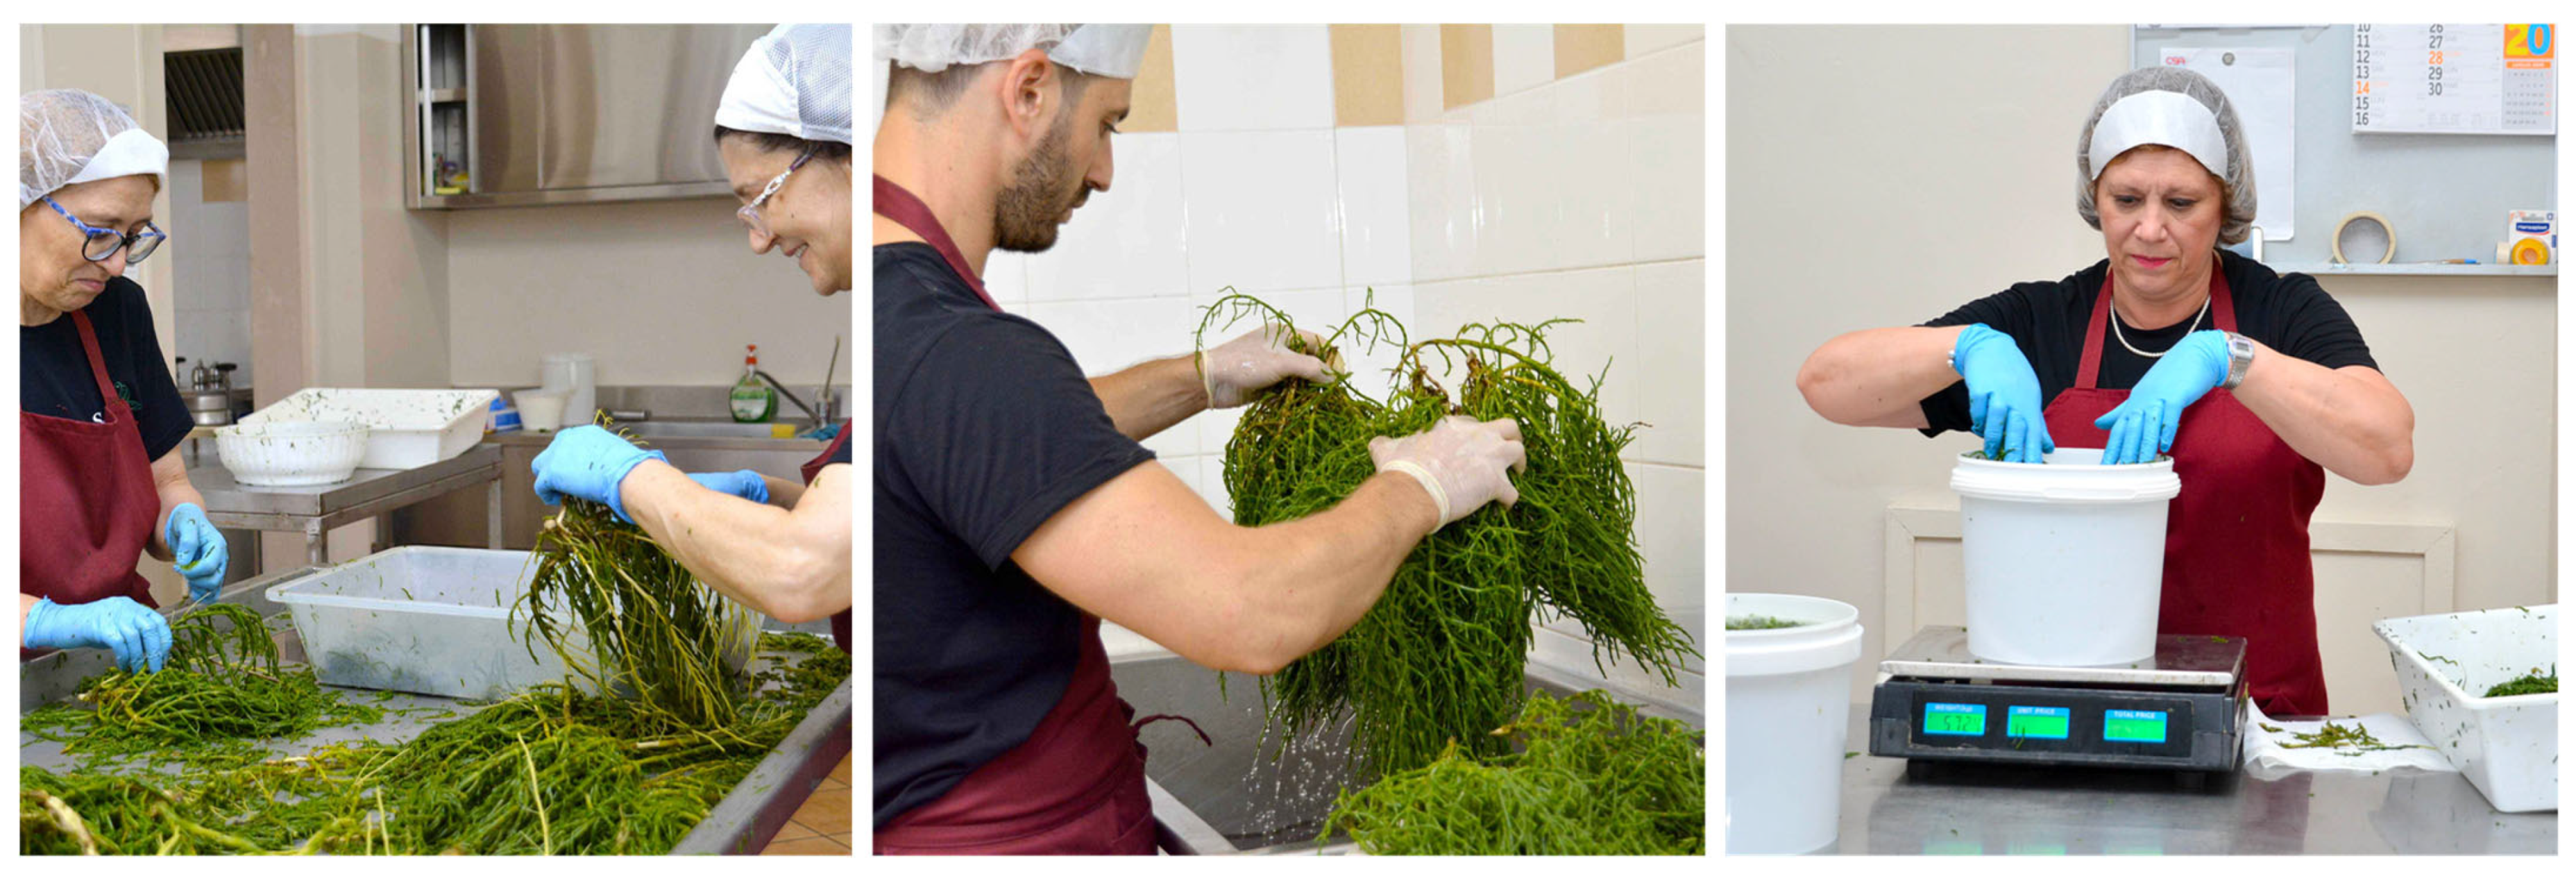
Salicornia has long been an object of interest for local farmers, although not in this area of the Gargano promontory facing south, but in the area facing north. Salicornia is probably one of the most successful examples of halophyte cultivation to date. In fact, some companies in this area cultivate and market Salicornia, both raw and, above all, in oil (Figure 9).
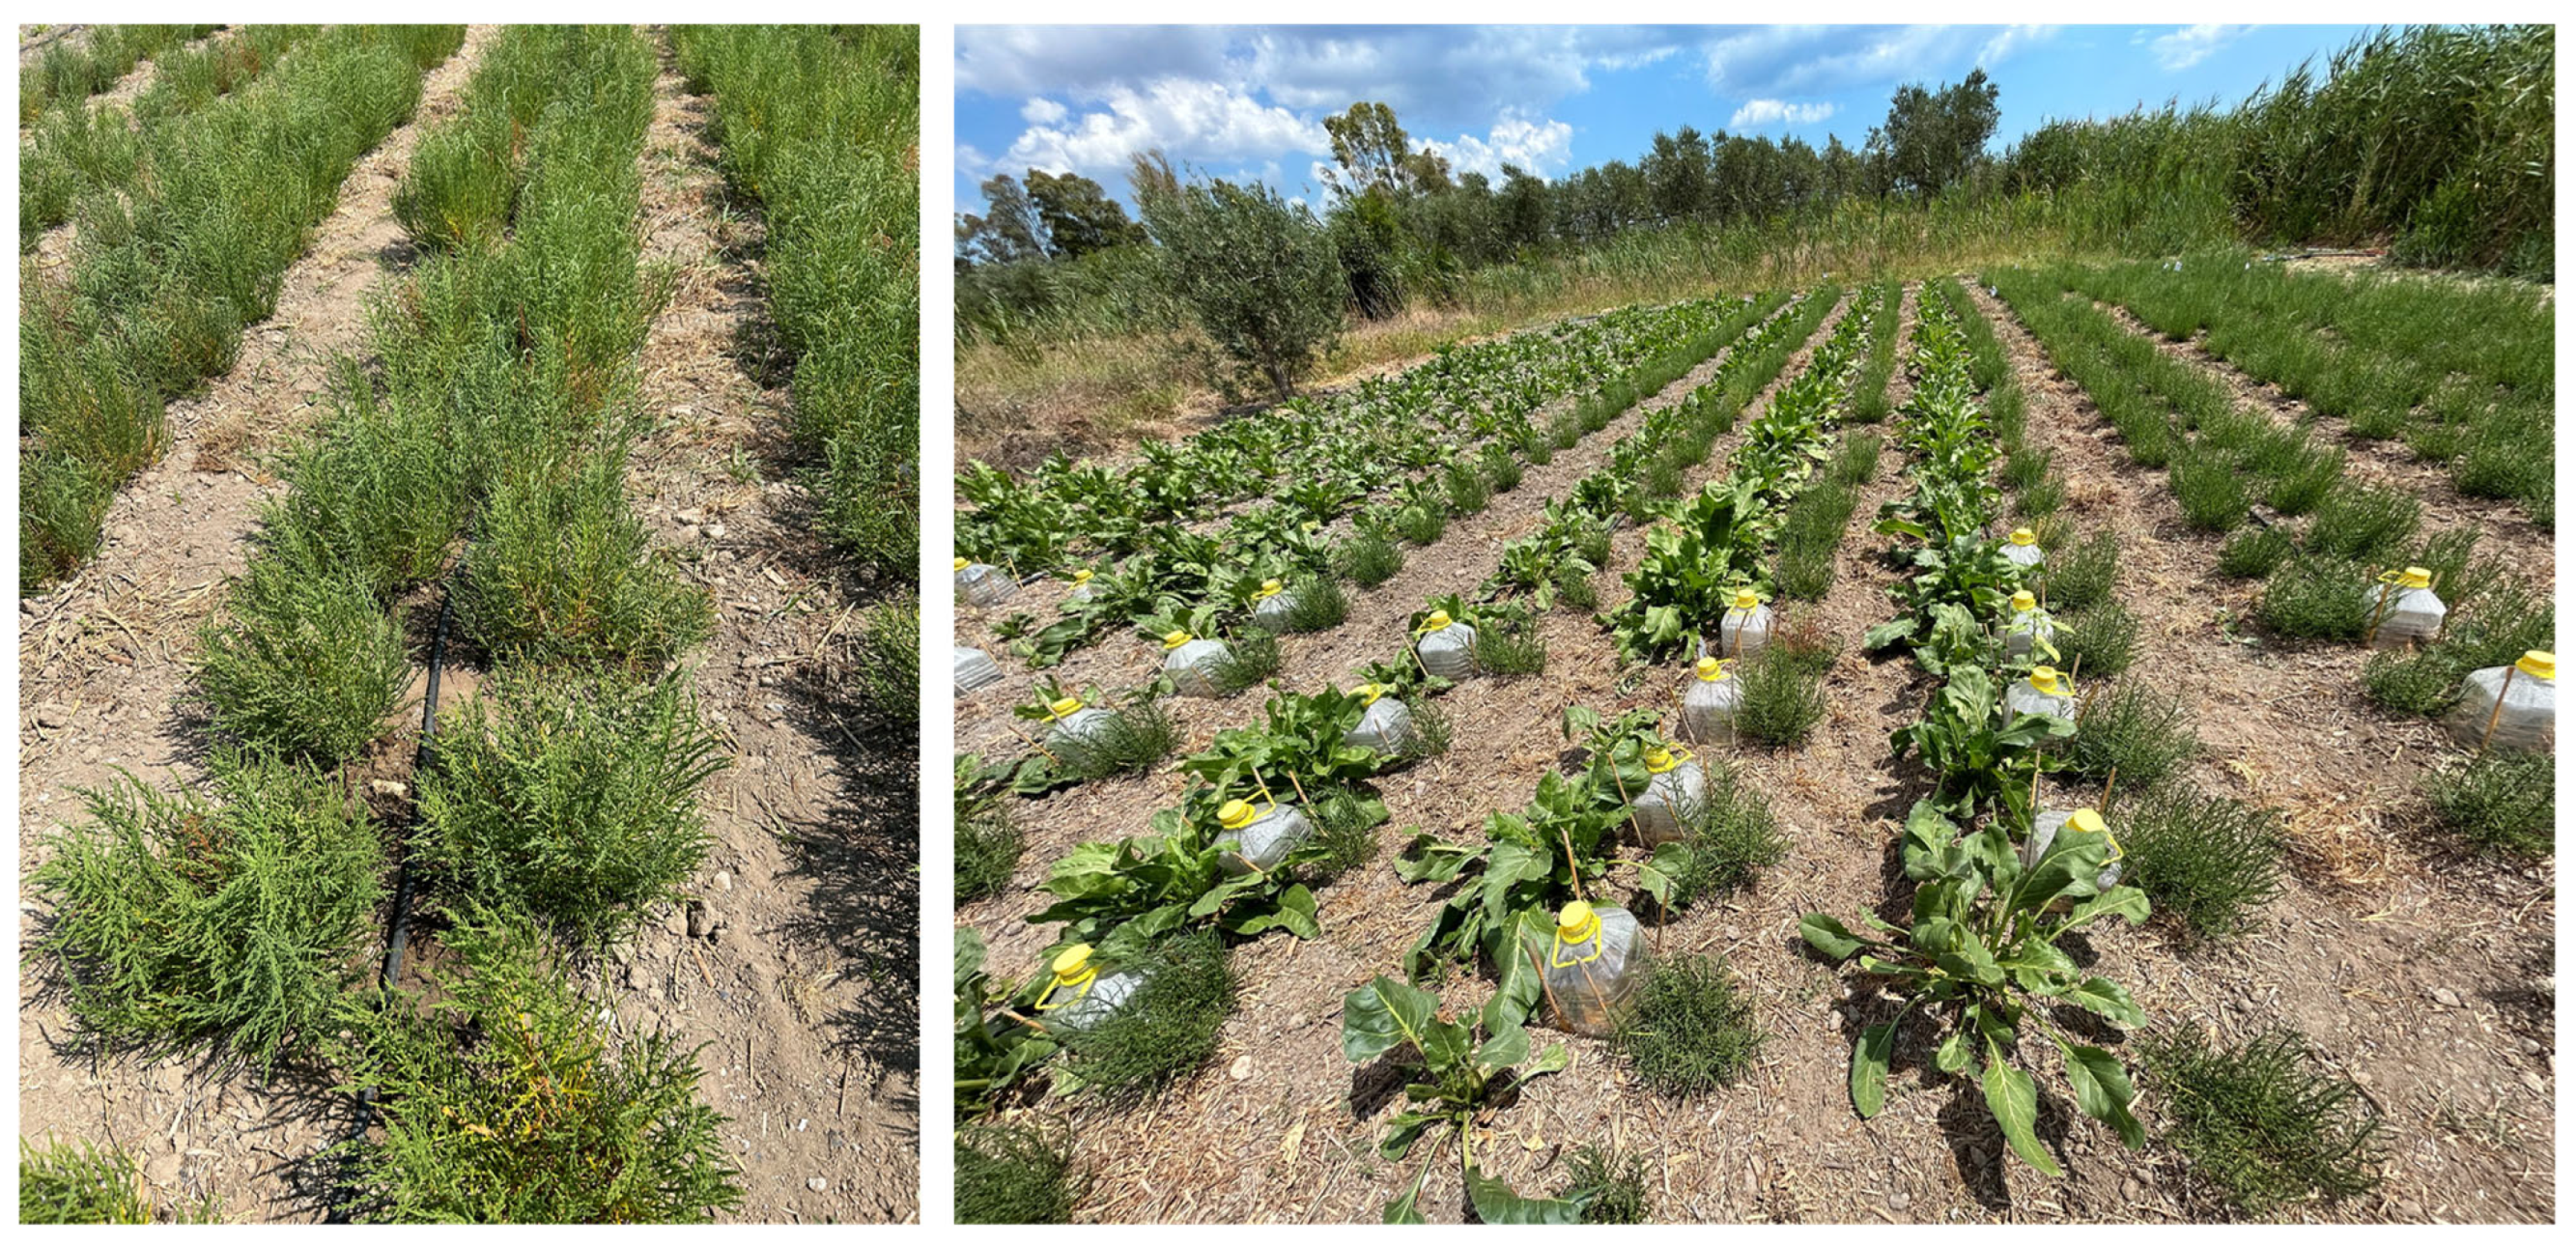
With reference to the King’s Lagoon, a first crop trial was carried out last year and a second has just started, focusing on Salicornia and Beta, by comparing their productivity both as single crops and in combination, i.e., intercropping (Figure 10).
The diversification of the cropping system, such as mixed and intercropping systems, diversification of plant species, together with permanent soil cover and minimum soil mechanical disturbance, improves biodiversity [20,21], prevents losses of arable land, increases soil quality, and preserves water resources [22,23].
Halophytic properties can be used to improve the productivity of less salt-resistant crops by growing them in intercropping, creating more resilient farming systems and reaping the economic benefits of harvesting both plant species. Halophytes in general, and Salicornia, Suaeda and also Beta, may be an option where soil salinity is extreme and only brackish water is available for irrigation, as in the study area.
To date, halophytes are regularly collected from wild populations and sold fresh or preserved at local farmers’ markets. Cultivation is still limited and often confined to private backyards and kitchen gardens. In the study area, efforts are being made to begin local production, followed by the processing of vegetables in oil (also mixed with other wild or cultivated alimurgical plants) and the organization of a cooperative sales market. This is an important first territorial initiative in its start-up phase.

5. Conclusions

The aim of this work was to identify and make a survey of the alimurgical vegetation present in the King’s Lagoon, a wetland that has recently undergone radical restoration of its natural layout.
The survey was preceded by the interpretation of a high-resolution satellite image of the study area; this allowed the derivation of a land cover map useful for the preparation of a regular grid to which the presence/absence of species and their degree of land cover could be related, as well as the interpretation of the relationship between the presence and association of the identified plant species with the characteristics or types of land cover.
The survey provided a snapshot of the state of this wetland ecosystem at the beginning of the process of ecological succession towards a state of the progressive recovery of naturalness, just a few years after a renaturation intervention to restore the flooded areas and the canals connecting them.
The methodological tools adopted are those of a classical botanical analysis, through surveys along transects, and a subsequent ecological interpretation, making use of the elaboration of some ecological indices that allowed for the exploration of the different scale levels of biodiversity (alpha, beta and gamma) in the area.
A few clarifications make it possible to specify the limitations of the present research, in particular the fact that it was not a conventional wide-ranging botanical study, but rather focused on the herbaceous and shrub components of the vegetation and, within its scope, only those plants that were of general alimurgical interest. It was, therefore, programmatically and deliberately a partial and selective survey.
Since the methodology used and the results obtained seem particularly useful and encouraging, it is desirable to proceed in the future as schematically outlined below:
  • To repeat the spring survey in the coming years, at least every two years, in order to reconstruct precisely the dynamics of the ecological succession in which this particular ecosystem is developing, once it has returned to its natural development.
  • To integrate the information to be obtained from the surveys at a broader and more general level, in the sense of carrying out a comprehensive botanical analysis.
  • To derive some indications and suggestions on the potential for establishing appropriate intercropping between alimurgical species, to be applied in the possible start of cultivation practices of these species for commercial purposes. Indeed, good insights can be gained by analyzing natural plant associations (i.e., the strong and balanced combination of some of the most representative plant species in the wetland).
Finally, it should be emphasized that wild edible plants are perfectly integrated into the wetland environment and that the objective of their horticultural valorization, together with the conservation of the whole natural wetland vegetation, can be achieved by properly combining provisioning and regulation/support ecosystem services from wetland. At the same time, cultural ecosystem services can be provided, preserving local knowledge and promoting historical traditions within human communities, together with a new interest from conscious, mindful and informed tourism development.

Supplementary Materials

The following supporting information can be downloaded at: https://www.mdpi.com/article/10.3390/horticulturae10060632/s1: S1: King’s Lagoon and the EU Natura 2000 network; S2: List of species under consideration and assigned to the alimurgical plant category; S3: Empirical equation connecting Simpson index (D) with Shannon index (H); S4: Hierarchical cluster analysis performed on [C;S] and [S;C] matrices.

Author Contributions

Conceptualization, A.R.B.C., L.P., M.I., M.G. and M.M.; methodology, A.R.B.C., L.P., M.I., M.G. and M.M.; formal analysis, M.M.; investigation, L.P., M.I. and M.G.; writing—original draft preparation A.R.B.C. and M.I.; writing—review and editing M.M.; funding acquisition, M.M. All authors have read and agreed to the published version of the manuscript.

Funding

This research was funded by the Agritech National Research Center and received funding from the European Union Next-GenerationEU, Piano Nazionale di Ripresa e Resilienza (PNRR)—Missione 4, Componente 2, Investimento 1.4—D.D. 1032 17/06/2022, CN00000022. This manuscript reflects only the authors’ views and opinions, and neither the European Union nor the European Commission can be considered responsible for them.

Data Availability Statement

The raw data supporting the conclusions of this article will be made available by the authors on request.

Acknowledgments

We would like to thank the Centro Studi Naturalistici Onlus (Foggia, Italy) for its valuable contribution in support of this work and, in particular, Vincenzo Rizzi for his help and Planetek Italia for the pre-processing of the Pleiades NEO data.

Conflicts of Interest

The authors declare no conflict of interest.

References

  1. Clark, M.A.; Domingo, N.G.G.; Colgan, K.; Thakrar, S.K.; Tilman, D.; Lynch, J.; Azevedo, I.L.; Hill, J.D. Global Food System Emissions Could Preclude Achieving the 1.5° and 2°C Climate Change Targets. Science 2020, 370, 705–708. [Google Scholar] [CrossRef] [PubMed]
  2. Crane, P.R.; Ge, S.; Hong, D.; Huang, H.; Jiao, G.; Knapp, S.; Kress, W.J.; Mooney, H.; Raven, P.H.; Wen, J.; et al. The Shenzhen Declaration on Plant Sciences—Uniting Plant Sciences and Society to Build a Green, Sustainable Earth. Plants People Planet 2019, 1, 59–61. [Google Scholar] [CrossRef]
  3. FAO (Ed.) Transforming Food Systems for Food Security, Improved Nutrition and Affordabel Healthy Diets for All; The State of Food Security and Nutrition in the World; FAO: Rome, Italy, 2021; ISBN 978-92-5-134325-8. [Google Scholar]
  4. Mariutti, L.R.B.; Rebelo, K.S.; Bisconsin-Junior, A.; De Morais, J.S.; Magnani, M.; Maldonade, I.R.; Madeira, N.R.; Tiengo, A.; Maróstica, M.R.; Cazarin, C.B.B. The Use of Alternative Food Sources to Improve Health and Guarantee Access and Food Intake. Food Res. Int. 2021, 149, 110709. [Google Scholar] [CrossRef] [PubMed]
  5. Tardío, J. CHAPTER 10 Spring Is Coming the Gathering and Consumption of Wild Vegetables in Spain. In Ethnobotany in the New Europe; Pardo-de-Santayana, M., Pieroni, A., Puri, R.K., Eds.; Berghahn Books: New York, NY, USA, 2022; pp. 211–238. ISBN 978-1-84545-814-0. [Google Scholar]
  6. Biscotti, N. Peregrinazioni Fitoalimurgiche-Dal Gargano Alle Puglie; Centro Grafico Francescano: Foggia, Italy, 2012. [Google Scholar]
  7. Aliotta, G. Edible Wild Plants in Italy. Inform. Bot. Ital. 1987, 19, 17–30. [Google Scholar]
  8. Guarrera, P.M.; Savo, V. Perceived Health Properties of Wild and Cultivated Food Plants in Local and Popular Traditions of Italy: A Review. J. Ethnopharmacol. 2013, 146, 659–680. [Google Scholar] [CrossRef] [PubMed]
  9. Luciano, R.; Gatti, C. Erbe Spontanee Commestibili; Nuova ed. riv. e integrata.; Araba Fenice: Boves, Italy, 2014; ISBN 978-88-95853-10-9. [Google Scholar]
  10. Dempewolf, H.; Eastwood, R.J.; Guarino, L.; Khoury, C.K.; Müller, J.V.; Toll, J. Adapting Agriculture to Climate Change: A Global Initiative to Collect, Conserve, and Use Crop Wild Relatives. Agroecol. Sustain. Food Syst. 2014, 38, 369–377. [Google Scholar] [CrossRef]
  11. Reyes-García, V.; Menendez-Baceta, G.; Aceituno-Mata, L.; Acosta-Naranjo, R.; Calvet-Mir, L.; Domínguez, P.; Garnatje, T.; Gómez-Baggethun, E.; Molina-Bustamante, M.; Molina, M.; et al. From Famine Foods to Delicatessen: Interpreting Trends in the Use of Wild Edible Plants through Cultural Ecosystem Services. Ecol. Econ. 2015, 120, 303–311. [Google Scholar] [CrossRef]
  12. Schulp, C.J.E.; Thuiller, W.; Verburg, P.H. Wild Food in Europe: A Synthesis of Knowledge and Data of Terrestrial Wild Food as an Ecosystem Service. Ecol. Econ. 2014, 105, 292–305. [Google Scholar] [CrossRef]
  13. Łuczaj, Ł.; Pieroni, A.; Tardío, J.; Pardo-de-Santayana, M.; Sõukand, R.; Svanberg, I.; Kalle, R. Wild Food Plant Use in 21st Century Europe: The Disappearance of Old Traditions and the Search for New Cuisines Involving Wild Edibles. Acta Soc. Bot. Pol. 2012, 81, 359–370. [Google Scholar] [CrossRef]
  14. De Groot, R.S.; Fisher, B.; Christie, M.; Aronson, J.; Braat, L.; Haines-Young, R.; Gowdy, J.; Maltby, E.; Neuville, A.; Polasky, S. Integrating the Ecological and Economic Dimensions in Biodiversity and Ecosystem Service Valuation. In The Economics of Ecosystems and Biodiversity: Ecological and Economic Foundations; Kumar, P., Ed.; Earthscan: London, UK; Washington, DC, USA, 2012; pp. 9–40. [Google Scholar]
  15. Hassan, R.M.; Scholes, R.J.; Ash, N.; Millennium Ecosystem Assessment (Program) (Eds.) Ecosystems and Human Well-Being: Current State and Trends: Findings of the Condition and Trends Working Group of the Millennium Ecosystem Assessment; The Millennium Ecosystem Assessment Series; Island Press: Washington, DC, USA, 2005; ISBN 978-1-55963-227-0. [Google Scholar]
  16. Ghirardini, M.P.; Carli, M.; Del Vecchio, N.; Rovati, A.; Cova, O.; Valigi, F.; Agnetti, G.; Macconi, M.; Adamo, D.; Traina, M.; et al. The Importance of a Taste. A Comparative Study on Wild Food Plant Consumption in Twenty-One Local Communities in Italy. J. Ethnobiol. Ethnomed. 2007, 3, 22. [Google Scholar] [CrossRef]
  17. THE 17 GOALS|Sustainable Development. Available online: https://sdgs.un.org/goals (accessed on 2 May 2024).
  18. Heinrich, M.; Kufer, J.; Leonti, M.; Pardo-de-Santayana, M. Ethnobotany and Ethnopharmacology—Interdisciplinary Links with the Historical Sciences. J. Ethnopharmacol. 2006, 107, 157–160. [Google Scholar] [CrossRef] [PubMed]
  19. Heinrich, M.; Nebel, S.; Leonti, M.; Rivera, D.; Obón, C. ‘Local Food-Nutraceuticals’: Bridging the Gap between Local Knowledge and Global Needs. In Forum of Nutrition; Heinrich, M., Müller, W.E., Galli, C., Eds.; S. Karger AG: Basel, Switzerland, 2006; Volume 59, pp. 1–17. ISBN 978-3-8055-8124-0. [Google Scholar]
  20. Aberoumand, A.; Deokule, S.S. Determination of Elements Profile of Some Wild Edible Plants. Food Anal. Methods 2009, 2, 116–119. [Google Scholar] [CrossRef]
  21. Amirul Alam, M.; Juraimi, A.S.; Rafii, M.Y.; Hamid, A.A.; Kamal Uddin, M.; Alam, M.Z.; Latif, M.A. Genetic Improvement of Purslane (Portulaca oleracea L.) and Its Future Prospects. Mol. Biol. Rep. 2014, 41, 7395–7411. [Google Scholar] [CrossRef]
  22. Guil Guerrero, J.L.; Giménez Martínez, J.J.; Torija Isasa, M.E. Mineral Nutrient Composition of Edible Wild Plants. J. Food Compos. Anal. 1998, 11, 322–328. [Google Scholar] [CrossRef]
  23. Visioli, F.; Galli, C. The Role of Antioxidants in the Mediterranean Diet. Lipids 2001, 36, S49–S52. [Google Scholar] [CrossRef]
  24. Visioli, F.; Grande, S.; Bogani, P.; Galli, C. The Role of Antioxidants in the Mediterranean Diets: Focus on Cancer. Eur. J. Cancer Prev. 2004, 13, 337–343. [Google Scholar] [CrossRef]
  25. Goulet, O. Potential Role of the Intestinal Microbiota in Programming Health and Disease: Figure 1. Nutr. Rev. 2015, 73, 32–40. [Google Scholar] [CrossRef] [PubMed]
  26. Bondonno, C.P.; Croft, K.D.; Ward, N.; Considine, M.J.; Hodgson, J.M. Dietary Flavonoids and Nitrate: Effects on Nitric Oxide and Vascular Function. Nutr. Rev. 2015, 73, 216–235. [Google Scholar] [CrossRef] [PubMed]
  27. El Hafid, R.; Blade, S.F.; Hoyano, Y. Seeding Date and Nitrogen Fertilization Effects on the Performance of Borage (Borago officinalis L.). Ind. Crops Prod. 2002, 16, 193–199. [Google Scholar] [CrossRef]
  28. Uddin, M.K.; Juraimi, A.S.; Ali, M.E.; Ismail, M.R. Evaluation of Antioxidant Properties and Mineral Composition of Purslane (Portulaca oleracea L.) at Different Growth Stages. Int. J. Mol. Sci. 2012, 13, 10257–10267. [Google Scholar] [CrossRef]
  29. De Lisi, A.; Montesano, V.; Negro, D.; Sarli, G.; Blanco, E.; Sonnante, G.; Laghetti, G. Genetic Diversity in Borago Officinalis Germplasm as Revealed by Seed Oils and AFLP Polymorphism. Genet. Resour. Crop. Evol. 2014, 61, 853–859. [Google Scholar] [CrossRef]
  30. Grieve, C.M. Purslane (Portulaca oleracea L.): A Halophytic Crop for Drainage Water Reuse Systems. Plant Soil 1997, 192, 277–283. [Google Scholar] [CrossRef]
  31. Biscotti, N.; Bonsanto, D.; Del Viscio, G. The Traditional Food Use of Wild Vegetables in Apulia (Italy) in the Light of Italian Ethnobotanical Literature. Ital. Bot. 2018, 5, 1–24. [Google Scholar] [CrossRef]
  32. Paura, B.; Di Marzio, P. Making a Virtue of Necessity: The Use of Wild Edible Plant Species (Also Toxic) in Bread Making in Times of Famine According to Giovanni Targioni Tozzetti (1766). Biology 2022, 11, 285. [Google Scholar] [CrossRef]
  33. Garn, S.M.; Leonard, W.R. What Did Our Ancestors Eat? Nutr. Rev. 2009, 47, 337–345. [Google Scholar] [CrossRef]
  34. Chivenge, P.; Mabhaudhi, T.; Modi, A.; Mafongoya, P. The Potential Role of Neglected and Underutilised Crop Species as Future Crops under Water Scarce Conditions in Sub-Saharan Africa. Int. J. Environ. Res. Public Health 2015, 12, 5685–5711. [Google Scholar] [CrossRef]
  35. Collins, W.W.; Qualset, C.O. (Eds.) Biodiversity in Agroecosystems; CRC Press: Boca Raton, FL, USA, 1998; ISBN 978-1-00-304066-8. [Google Scholar]
  36. Prescott-Allen, R.; Prescott-Allen, C. How Many Plants Feed the World? Conserv. Biol. 1990, 4, 365–374. [Google Scholar] [CrossRef]
  37. Schunko, C.; Vogl, C.R. Organic Farmers Use of Wild Food Plants and Fungi in a Hilly Area in Styria (Austria). J. Ethnobiol. Ethnomed. 2010, 6, 17. [Google Scholar] [CrossRef]
  38. Tardío, J.; Pardo-De-Santayana, M.; Morales, R. Ethnobotanical Review of Wild Edible Plants in Spain. Bot. J. Linn. Soc. 2006, 152, 27–71. [Google Scholar] [CrossRef]
  39. Bonet, M.À.; Vallès, J. Use of Non-Crop Food Vascular Plants in Montseny Biosphere Reserve (Catalonia, Iberian Peninsula). Int. J. Food Sci. Nutr. 2002, 53, 225–248. [Google Scholar] [CrossRef]
  40. Cornara, L.; La Rocca, A.; Marsili, S.; Mariotti, M.G. Traditional Uses of Plants in the Eastern Riviera (Liguria, Italy). J. Ethnopharmacol. 2009, 125, 16–30. [Google Scholar] [CrossRef]
  41. Della, A.; Paraskeva-Hadjichambi, D.; Hadjichambis, A.C. An Ethnobotanical Survey of Wild Edible Plants of Paphos and Larnaca Countryside of Cyprus. J. Ethnobiol. Ethnomed. 2006, 2, 34. [Google Scholar] [CrossRef]
  42. González, J.A.; García-Barriuso, M.; Amich, F. The Consumption of Wild and Semi-Domesticated Edible Plants in the Arribes Del Duero (Salamanca-Zamora, Spain): An Analysis of Traditional Knowledge. Genet. Resour. Crop. Evol. 2011, 58, 991–1006. [Google Scholar] [CrossRef]
  43. Idolo, M.; Motti, R.; Mazzoleni, S. Ethnobotanical and Phytomedicinal Knowledge in a Long-History Protected Area, the Abruzzo, Lazio and Molise National Park (Italian Apennines). J. Ethnopharmacol. 2010, 127, 379–395. [Google Scholar] [CrossRef]
  44. Mattalia, G.; Quave, C.L.; Pieroni, A. Traditional Uses of Wild Food and Medicinal Plants among Brigasc, Kyé, and Provençal Communities on the Western Italian Alps. Genet. Resour. Crop. Evol. 2013, 60, 587–603. [Google Scholar] [CrossRef]
  45. Nebel, S.; Heinrich, M. Ta Chòrta: A Comparative Ethnobotanical-Linguistic Study of Wild Food Plants in a Graecanic Area in Calabria, Southern Italy. Econ. Bot. 2009, 63, 78–92. [Google Scholar] [CrossRef]
  46. Rigat, M.; Bonet, M.A.; Garcia, S.; Garnatje, T.; Valles, J. Ethnobotany of Food Plants in the High River Ter Valley (Pyrenees, Catalonia, Iberian Peninsula): Non-Crop Food Vascular Plants and Crop Food Plants with Medicinal Properties. Ecol. Food Nutr. 2009, 48, 303–326. [Google Scholar] [CrossRef]
  47. Łuczaj, Ł.; Szymański, W.M. Wild Vascular Plants Gathered for Consumption in the Polish Countryside: A Review. J. Ethnobiol. Ethnomed. 2007, 3, 17. [Google Scholar] [CrossRef]
  48. Pardo-de-Santayana, M.; Tardío, J.; Blanco, E.; Carvalho, A.M.; Lastra, J.J.; San Miguel, E.; Morales, R. Traditional Knowledge of Wild Edible Plants Used in the Northwest of the Iberian Peninsula (Spain and Portugal): A Comparative Study. J. Ethnobiol. Ethnomed. 2007, 3, 27. [Google Scholar] [CrossRef]
  49. Pouta, E.; Sievänen, T.; Neuvonen, M. Recreational Wild Berry Picking in Finland—Reflection of a Rural Lifestyle. Soc. Nat. Resour. 2006, 19, 285–304. [Google Scholar] [CrossRef]
  50. Pieroni, A.; Nebel, S.; Quave, C.; Münz, H.; Heinrich, M. Ethnopharmacology of Liakra: Traditional Weedy Vegetables of the Arbëreshë of the Vulture Area in Southern Italy. J. Ethnopharmacol. 2002, 81, 165–185. [Google Scholar] [CrossRef]
  51. Stryamets, N.; Elbakidze, M.; Angelstam, P. Role of Non-Wood Forest Products for Local Livelihoods in Countries with Transition and Market Economies: Case Studies in Ukraine and Sweden. Scand. J. For. Res. 2012, 27, 74–87. [Google Scholar] [CrossRef]
  52. Menendez-Baceta, G.; Aceituno-Mata, L.; Tardío, J.; Reyes-García, V.; Pardo-de-Santayana, M. Wild Edible Plants Traditionally Gathered in Gorbeialdea (Biscay, Basque Country). Genet. Resour. Crop. Evol. 2012, 59, 1329–1347. [Google Scholar] [CrossRef]
  53. Seeland, K.; Staniszewski, P. Indicators for a European Cross-Country State-of-the-Art Assessment of Non-Timber Forest Products and Services. Small-Scale For. 2007, 6, 411–422. [Google Scholar] [CrossRef]
  54. Bacchetta, L.; Visioli, F.; Cappelli, G.; Caruso, E.; Martin, G.; Nemeth, E.; Bacchetta, G.; Bedini, G.; Wezel, A.; Van Asseldonk, T.; et al. A Manifesto for the Valorization of Wild Edible Plants. J. Ethnopharmacol. 2016, 191, 180–187. [Google Scholar] [CrossRef]
  55. LIFE 3.0-LIFE Project Public Page. Available online: https://webgate.ec.europa.eu/life/publicWebsite/project/LIFE09-NAT-IT-000150/conservation-actions-of-habitats-in-the-coastal-wetlands-of-sci-wetlands-of-capitanata (accessed on 2 May 2024).
  56. Cammerino, A.R.B.; Ingaramo, M.; Monteleone, M. Complementary Approaches to Planning a Restored Coastal Wetland and Assessing the Role of Agriculture and Biodiversity: An Applied Case Study in Southern Italy. Water 2023, 16, 153. [Google Scholar] [CrossRef]
  57. Uso del Suolo-S.I.T.-SIT Puglia. Available online: https://pugliacon.regione.puglia.it/web/sit-puglia-sit/uso-del-suolo (accessed on 2 May 2024).
  58. Puglia. Available online: https://www.isprambiente.gov.it/it/servizi/sistema-carta-della-natura/cartografia/carta-della-natura-alla-scala-1-50.000/puglia (accessed on 2 May 2024).
  59. Pignatti, S.; Bianco, P.M.; Fanelli, G.; Paglia, S.; Pitrosanti, S.; Tescarollo, P. Le Piante Come Indicatori Ambientali; Manuale tecnico-scientifico; ANPA RTI CTN_CON 1/2001; Agenzia Nazionale Protezione Ambiente: Roma, Italy, 2001. [Google Scholar]
  60. Lombardi, T.; Bertacchi, A.; Pistelli, L.; Pardossi, A.; Pecchia, S.; Toffanin, A.; Sanmartin, C. Biological and Agronomic Traits of the Main Halophytes Widespread in the Mediterranean Region as Potential New Vegetable Crops. Horticulturae 2022, 8, 195. [Google Scholar] [CrossRef]
  61. Lombardi, T.; Ventura, I.; Bertacchi, A. Floristic Inventory of Ethnobotanically Important Halophytes of North-Western Mediterranean Coastal Brackish Areas, Tuscany, Italy. Agronomy 2023, 13, 615. [Google Scholar] [CrossRef]
  62. Wang, X.; Shao, X.; Zhang, W.; Sun, T.; Ding, Y.; Lin, Z.; Li, Y. Genus Suaeda: Advances in Phytology, Chemistry, Pharmacology and Clinical Application (1895–2021). Pharmacol. Res. 2022, 179, 106203. [Google Scholar] [CrossRef]
  63. Mohammed, H.A. The Valuable Impacts of Halophytic Genus Suaeda; Nutritional, Chemical, and Biological Values. Med. Chem. 2020, 16, 1044–1057. [Google Scholar] [CrossRef]
  64. Ayaz, A.; Jamil, Q.; Hussain, M.; Anjum, F.; Sarfraz, A.; Alqahtani, T.; Hussain, N.; Gahtani, R.M.; Dera, A.A.; Alharbi, H.M.; et al. Antioxidant and Gastroprotective Activity of Suaeda Fruticosa Forssk. Ex J.F.Gmel. Molecules 2022, 27, 4368. [Google Scholar] [CrossRef]
  65. Stanković, M.; Stojanović-Radić, Z.; Jakovljević, D.; Zlatić, N.; Luković, M.; Dajić-Stevanović, Z. Coastal Halophytes: Potent Source of Bioactive Molecules from Saline Environment. Plants 2023, 12, 1857. [Google Scholar] [CrossRef]
  66. Custodio, L.; Garcia-Caparros, P.; Pereira, C.G.; Castelo-Branco, P. Halophyte Plants as Potential Sources of Anticancer Agents: A Comprehensive Review. Pharmaceutics 2022, 14, 2406. [Google Scholar] [CrossRef] [PubMed]
  67. Ksouri, R.; Ksouri, W.M.; Jallali, I.; Debez, A.; Magné, C.; Hiroko, I.; Abdelly, C. Medicinal Halophytes: Potent Source of Health Promoting Biomolecules with Medical, Nutraceutical and Food Applications. Crit. Rev. Biotechnol. 2012, 32, 289–326. [Google Scholar] [CrossRef]
  68. Braun-Blanquet, J. Pflanzensoziologie; Springer: Vienna, Austria, 1964; ISBN 978-3-7091-8111-9. [Google Scholar]
  69. Pignatti, S. Flora d’Italia; Seconda Edizione in 4 Volumi.; Edagricole: Milano, Italy, 2017; Volume 2, ISBN 978-88-506-5243-3. [Google Scholar]
  70. Pignatti, S. New species of Limonium from Italy and Tunesia. Webbia 1982, 36, 47–56. [Google Scholar] [CrossRef]
  71. Bartolucci, F.; Peruzzi, L.; Galasso, G.; Albano, A.; Alessandrini, A.; Ardenghi, N.M.G.; Astuti, G.; Bacchetta, G.; Ballelli, S.; Banfi, E.; et al. An Updated Checklist of the Vascular Flora Native to Italy. Plant Biosyst.-Int. J. Deal. All Asp. Plant Biol. 2018, 152, 179–303. [Google Scholar] [CrossRef]
  72. Galasso, G.; Conti, F.; Peruzzi, L.; Ardenghi, N.M.G.; Banfi, E.; Celesti-Grapow, L.; Albano, A.; Alessandrini, A.; Bacchetta, G.; Ballelli, S.; et al. An Updated Checklist of the Vascular Flora Alien to Italy. Plant Biosyst.-Int. J. Deal. All Asp. Plant Biol. 2018, 152, 556–592. [Google Scholar] [CrossRef]
  73. Westhoff, V.; Van der Maarel, E. The Braun-Blanquet Approach. In Classificationof Plant Communities; Whittaker, R.H., Ed.; Springer: Hague, The Netherlands, 1973; pp. 617–726. [Google Scholar]
  74. Chmura, D.; Salachna, A. The Errors in Visual Estimation of Plants Cover in the Context of Education of Phytosociology. Chem.-Didact.-Ecol. -Metrol. 2016, 21, 75–82. [Google Scholar] [CrossRef]
  75. Acta Plantarum. 2023. Available online: https://www.actaplantarum.org/ (accessed on 2 May 2024).
  76. Whittaker, R.H. Evolution and Measurement of Species Diversity. Taxon 1972, 21, 213–251. [Google Scholar] [CrossRef]
  77. Whittaker, R.H. Dominance and Diversity in Land Plant Communities: Numerical Relations of Species Express the Importance of Competition in Community Function and Evolution. Science 1965, 147, 250–260. [Google Scholar] [CrossRef]
  78. Spellerberg, I.F.; Fedor, P.J. A Tribute to Claude Shannon (1916–2001) and a Plea for More Rigorous Use of Species Richness, Species Diversity and the ‘Shannon–Wiener’ Index. Glob. Ecol. Biogeogr. 2003, 12, 177–179. [Google Scholar] [CrossRef]
  79. Shannon, C.E. A Mathematical Theory of Communication. Bell Syst. Tech. J. 1948, 27, 379–423. [Google Scholar] [CrossRef]
  80. Jaccard, P. Contribution Au Problème de l’immigration Post-Glaciaire de La Flore Alpine: Étude Comparative de La Flore Alpine Du Massif de Wildhorn, Du Haut Bassin Du Trient et de La Haute Vallée de Bagnes. Bull. Soc. Vaudoise Sci. Nat. 1900, 36, 87–130. [Google Scholar] [CrossRef]
  81. Peet, R.K. The Measurement of Species Diversity. Annu. Rev. Ecol. Syst. 1974, 5, 285–307. [Google Scholar] [CrossRef]
  82. Whittaker, R.H. Vegetation of the Siskiyou Mountains, Oregon and California. Ecol. Monogr. 1960, 30, 279–338. [Google Scholar] [CrossRef]
  83. Anderson, M.J.; Ellingsen, K.E.; McArdle, B.H. Multivariate Dispersion as a Measure of Beta Diversity. Ecol. Lett. 2006, 9, 683–693. [Google Scholar] [CrossRef]
  84. Chao, A.; Chazdon, R.L.; Colwell, R.K.; Shen, T. A New Statistical Approach for Assessing Similarity of Species Composition with Incidence and Abundance Data. Ecol. Lett. 2005, 8, 148–159. [Google Scholar] [CrossRef]
  85. Sorensen, T. A Method of Establishing Groups of Equal Amplitude in Plant Sociology Based on Similarity of Species Content and Its Application to Analyses of the Vegetation on Danish Commons. Biol. Skr. /K. Dan. Vidensk. Selsk. 1948, 5, 1–34. [Google Scholar]
  86. Laurance, W.F.; Yensen, E. Predicting the Impacts of Edge Effects in Fragmented Habitats. Biol. Conserv. 1991, 55, 77–92. [Google Scholar] [CrossRef]
  87. Schonewald-Cox, C.; Buechner, M. Park Protection and Public Roads. In Conservation Biology; Fiedler, P.L., Jain, S.K., Eds.; Springer: Boston, MA, USA, 1992; pp. 373–395. ISBN 978-1-4684-6428-3. [Google Scholar]
  88. Naz, N.; Fatima, S.; Hameed, M.; Ashraf, M.; Ahmad, M.S.A.; Ahmad, F.; Shah, S.M.R.; Islam, F.; Ahmad, I.; Ejaz, F.; et al. Contribution of Structural and Functional Adaptations of Hyper-Accumulator Suaeda Vera Forssk. Ex J.F. Gmel. for Adaptability across Salinity Gradients in Hot Desert. Environ. Sci. Pollut. Res. 2022, 29, 64077–64095. [Google Scholar] [CrossRef]
  89. Sordes, F.; Pellequer, E.; Sahli, S.; Sarzynski, T.; Denes, M.; Techer, I. Phytoremediation of Chloride from Marine Dredged Sediments: A New Model Based on a Natural Vegetation Recolonization. J. Environ. Manag. 2023, 344, 118508. [Google Scholar] [CrossRef] [PubMed]
  90. Salonikioti, A.; Petropoulos, S.; Antoniadis, V.; Levizou, E.; Alexopoulos, A. Wild Edible Species with Phytoremediation Properties. Procedia Environ. Sci. 2015, 29, 98–99. [Google Scholar] [CrossRef]
  91. Adkins, S.W.; Wills, D.; Boersma, M.; Walker, S.R.; Robinson, G.; Mcleod, R.J.; Einam, J.P. Weeds Resistant to Chlorsulfuron and Atrazine from the North-east Grain Region of Australia. Weed Res. 1997, 37, 343–349. [Google Scholar] [CrossRef]
  92. Chauhan, B.S.; Johnson, D.E. Responses of Rice Flatsedge (Cyperus Iria) and Barnyardgrass (Echinochloa Crus-Galli) to Rice Interference. Weed Sci. 2010, 58, 204–208. [Google Scholar] [CrossRef]
  93. Manalil, S.; Haider Ali, H.; Chauhan, B.S. Germination Ecology of Turnip Weed (Rapistrum rugosum (L.) All.) in the Northern Regions of Australia. PLoS ONE 2018, 13, e0201023. [Google Scholar] [CrossRef] [PubMed]
  94. Skorupa, M.; Gołębiewski, M.; Kurnik, K.; Niedojadło, J.; Kęsy, J.; Klamkowski, K.; Wójcik, K.; Treder, W.; Tretyn, A.; Tyburski, J. Salt Stress vs. Salt Shock-the Case of Sugar Beet and Its Halophytic Ancestor. BMC Plant Biol. 2019, 19, 57. [Google Scholar] [CrossRef] [PubMed]
  95. Yolcu, S.; Alavilli, H.; Ganesh, P.; Panigrahy, M.; Song, K. Salt and Drought Stress Responses in Cultivated Beets (Beta vulgaris L.) and Wild Beet (Beta maritima L.). Plants 2021, 10, 1843. [Google Scholar] [CrossRef]
  96. Davy, A.J. Development of Eco-Hydrological Guidelines for Dune Habitats–Phase 1; English Nature: Peterborough, UK, 2006. [Google Scholar]
  97. Ventura, Y.; Eshel, A.; Pasternak, D.; Sagi, M. The Development of Halophyte-Based Agriculture: Past and Present. Ann. Bot. 2015, 115, 529–540. [Google Scholar] [CrossRef] [PubMed]
  98. Mishra, A.; Tanna, B. Halophytes: Potential Resources for Salt Stress Tolerance Genes and Promoters. Front. Plant Sci. 2017, 8, 829. [Google Scholar] [CrossRef]
  99. Davy, A.J.; Bishop, G.F.; Costa, C.S.B. Salicornia L. (Salicornia pusilla J. Woods, S. ramosissima J. Woods, S. europaea L., S. obscura P.W. Ball & Tutin, S. nitens P.W. Ball & Tutin, S. fragilis P.W. Ball & Tutin and S. dolichostachya Moss). J. Ecol. 2001, 89, 681–707. [Google Scholar] [CrossRef]
  100. He, F.; Tang, D. Estimating the Niche Preemption Parameter of the Geometric Series. Acta Oecologica 2008, 33, 105–107. [Google Scholar] [CrossRef]
  101. Caçador, I.; Neto, J.M.; Duarte, B.; Barroso, D.V.; Pinto, M.; Marques, J.C. Development of an Angiosperm Quality Assessment Index (AQuA-Index) for Ecological Quality Evaluation of Portuguese Water Bodies—A Multi-Metric Approach. Ecol. Indic. 2013, 25, 141–148. [Google Scholar] [CrossRef]
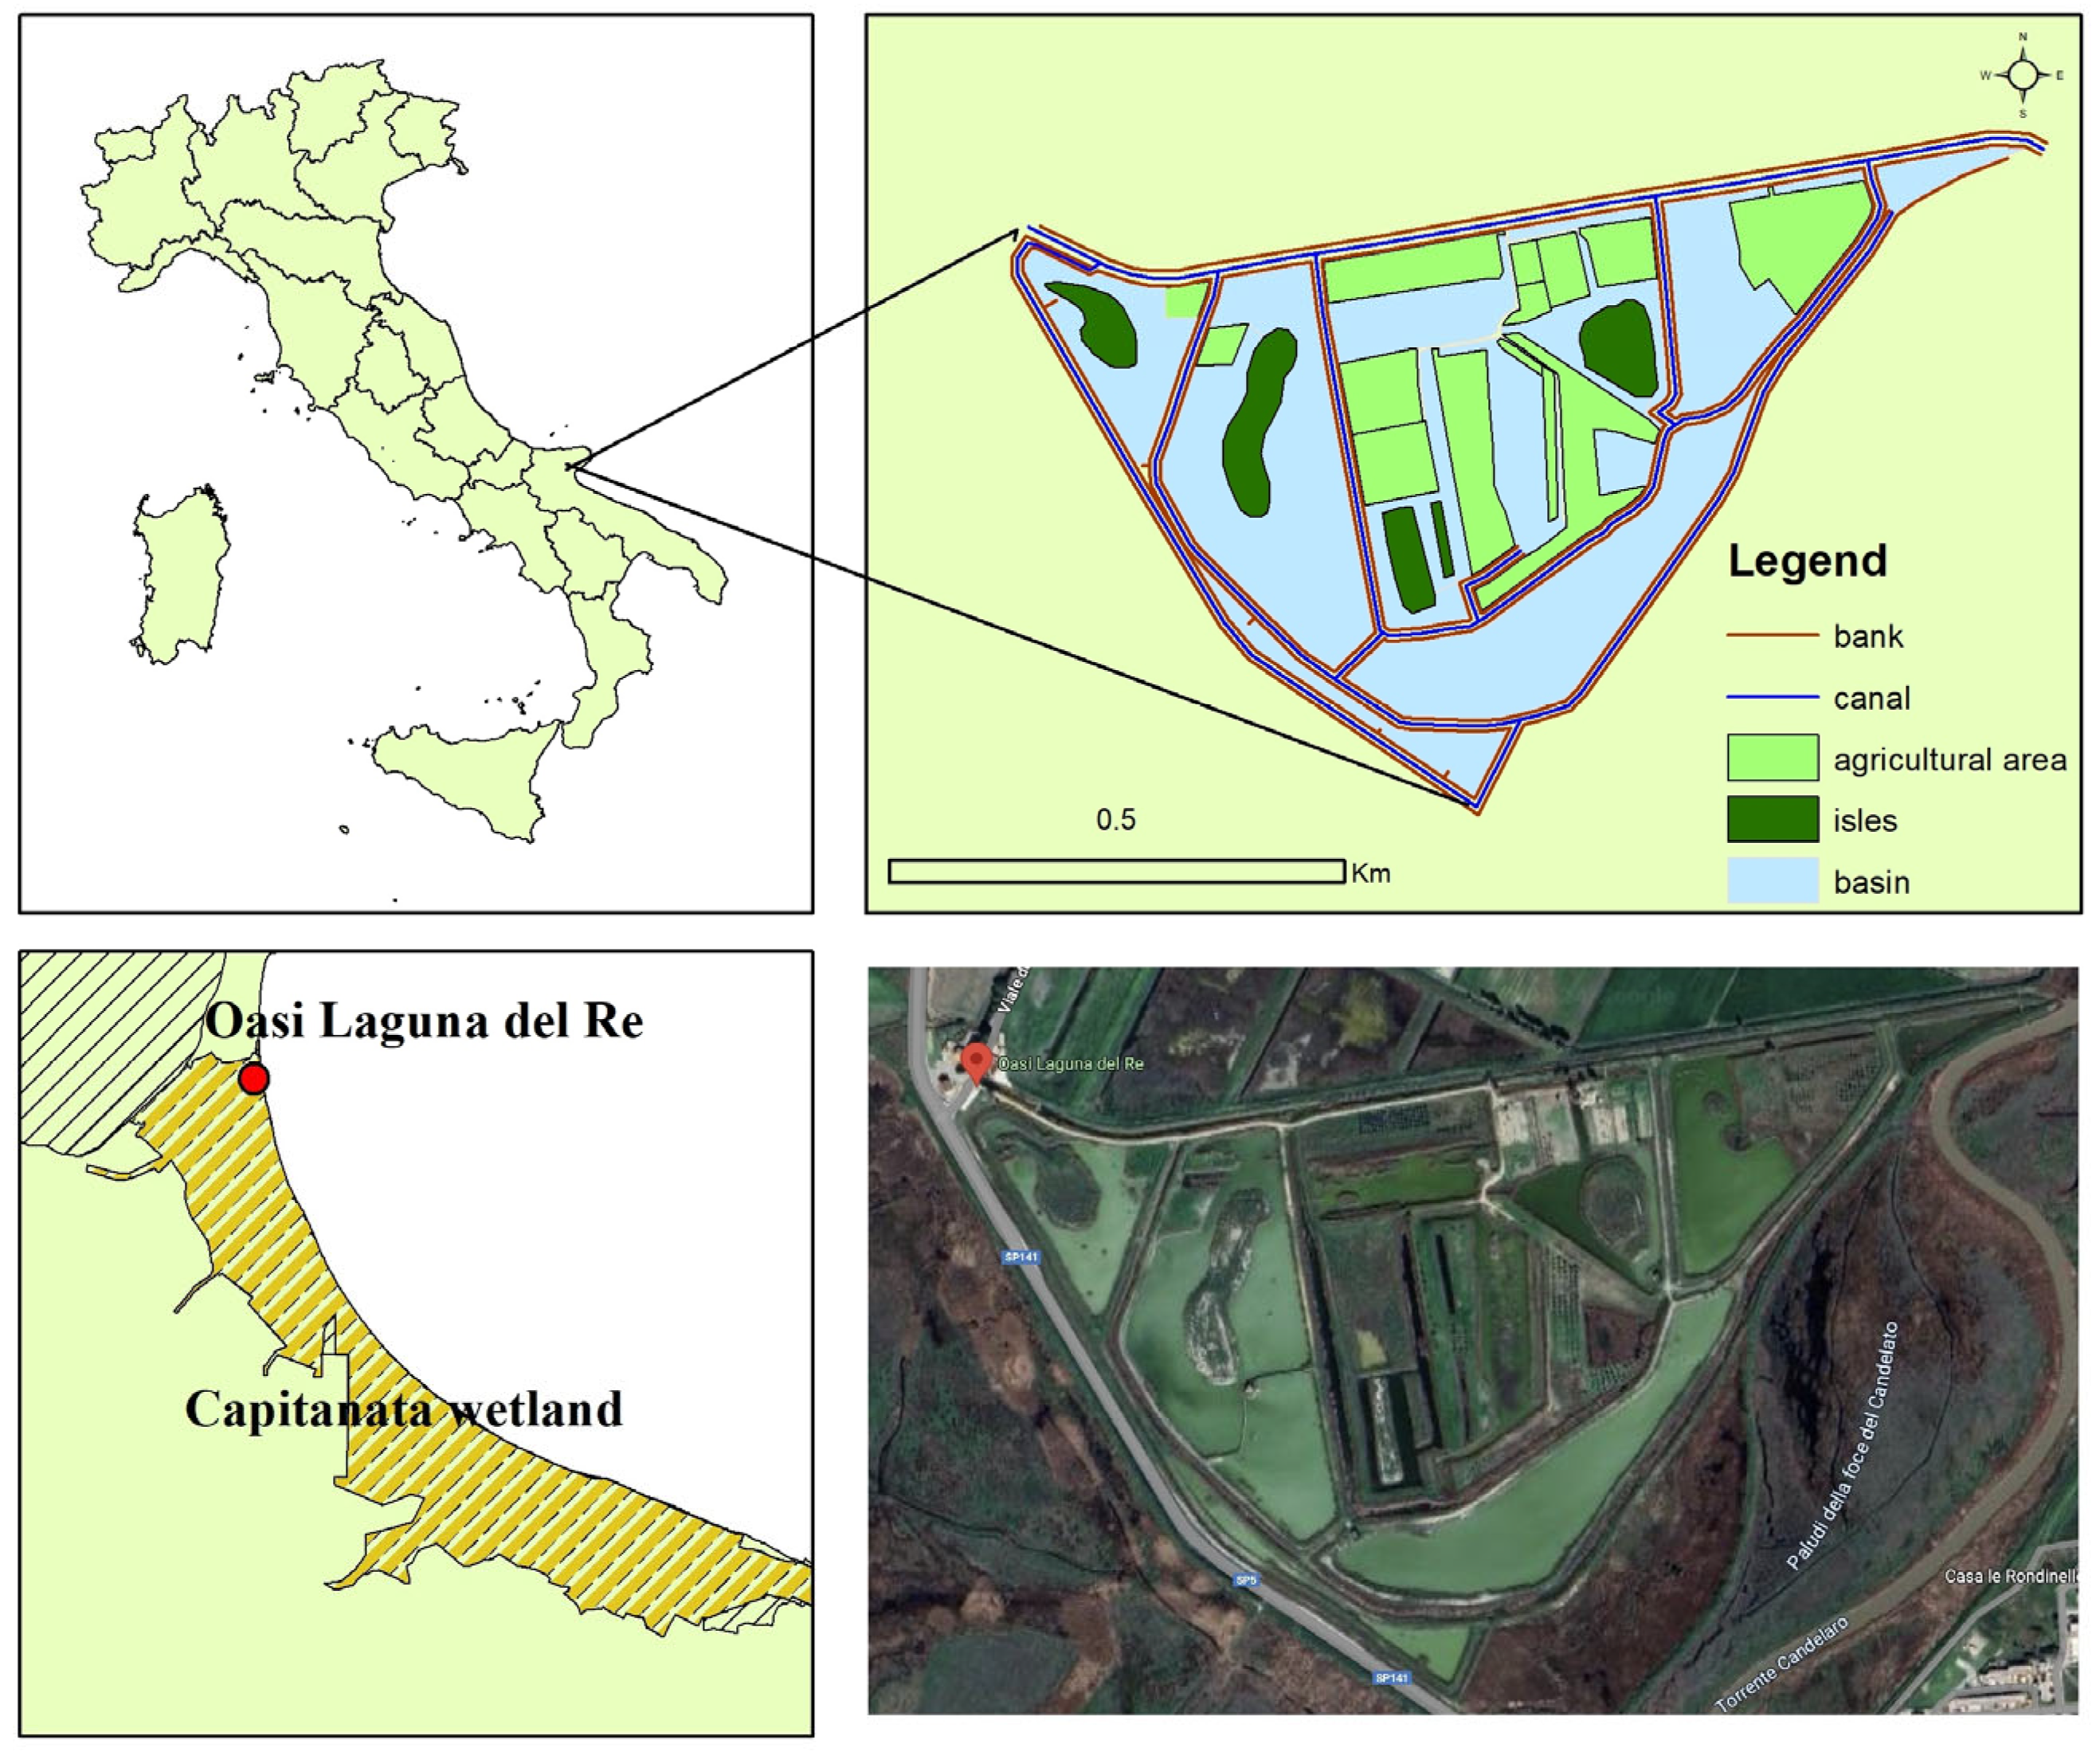
Figure 1. Satellite image and planimetric map of King’s Lagoon, the coastal wetland considered in the case study, located in the Apulia region of southern Italy, along the Gulf of Manfredonia (Adriatic Sea).
Horticulturae 10 00632 g001
Figure 2. Flowchart summarizing the overall data analysis approach and statistical data processing (see text for more detailed explanation). White background matrices, [C;S] and [S;C], are those directly obtained from the plant survey. On the other hand, green background matrices, [C;C] and [S;S], are obtained by multiplying one of the two data matrices by its transpose and are therefore square and symmetrical matrices. Note that n refers to the number of cells/sites and m to the number of species detected in the wetland. For more information on alpha, beta and gamma diversity, please read the discussion section.
Horticulturae 10 00632 g002
Figure 3. Scatter plot showing the cell/site combinations of wetland (WET) and meadow (MEAD) areas. The cell/site dimensions are 50 × 50 m2, corresponding to a unit area of 2500 m2. For each cell (a dot in the figure), the smaller the areas allocated to WET and MEAD, the larger the complementary areas allocated to AGR and BUILT (as indicated by the blue arrow). Total number of cells/sites is 165.
Horticulturae 10 00632 g003
Figure 4. Histograms showing the frequency distribution of the two main coverage classes: (A) WET and (B) MEAD, found in the study area. The cell/site dimensions are 50 × 50 m2, corresponding with a unit area of 2500 m2. Total number of cells/sites is 165.
Horticulturae 10 00632 g004
Figure 5. Rank–abundance plots, also known as dominance–diversity curves. The total number of species plotted is 39. An equilateral hyperbola was fitted to the data and the fit was statistically significant (R2 = 0.94; SSE = 0.25). The equation is shown in the graph frame.
Horticulturae 10 00632 g005
Figure 6. Frequency distributions of the relative richness index (A) and of the relative abundance index (B) for each cell in the study area.
Horticulturae 10 00632 g006
Figure 7. Frequency distributions of Shannon’s diversity index (A) and of Simpson’s diversity index (B) for each cell in the study area.
Horticulturae 10 00632 g007
Figure 8. (A) Diachronic comparison (2015 vs. 2024) of the layout of King’s Lagoon (the study area) before and after the wetland restoration intervention. (B) Spatialized Shannon’s index values (WGS coordinate system).
Horticulturae 10 00632 g008
Figure 9. Sorting, cleaning, washing and packaging of glasswort, i.e., Salicorna (https://foodoteka.com/saporita, accessed on 9 June 2024).
Horticulturae 10 00632 g009
Figure 10. Cultivation trial of Salicornia and Beta in monocultures and intercultures at the King’s Lagoon (spring–summer 2023).
Horticulturae 10 00632 g010
Table 1. First- and second-order land cover categories detected in the “King’s Lagoon”, the coastal wetland considered in the study case.
First-Order Land Cover CategoriesSecond-Order Land Cover Categories
WET
Wetlands and aquatic/riparian ecosystems
Reed and reedbed
Wetland and lagoon
Channel
Non-permanent channel
Temporary pond
MEAD
Semi-natural vegetation areas (meadows)
Sparse semi-natural vegetation
Herbaceous vegetation and scattered trees
BUILT
Built-up areas
Roads and paths
Rural buildings
Rural building annexes
Roof terrace rural shed
AGR
Agricultural areas
Arable agricultural land
Tree-lined and wooded agricultural area
Complex cropping and parcel systems including small orchard and olive groves
Abandoned olive grove
Table 2. The modified Braun–Blanquet scale as applied in the visual assessment of species belonging to the phytoalimurgical wild grasses and meadows in the course of the King’s Lagoon survey, the coastal wetland considered in the study case.
Land Cover
Code or Score
Land Cover Range
(Relative Abundance)
(%)
Corresponding
Average Land Cover
(%)
0 (A = absent)0(Unseen or unobserved species)-
1 (R = rare or occasional species)<1(Just one or few individuals)0.5
2 (U = uncommon)1–25(Slightly low land cover)12.0
3 (C = quite common)25–50(Medium land cover)37.5
4 (CC = common)50–75(Slightly high land cover)62.5
5 (CCC = very common)75–100(High land cover)87.5
Table 3. Distribution of the King’s Lagoon study area in the four different land cover categories.
Land Cover
Category
§
Absolute
Occurrence
(N)
Relative
Occurrence
(%)
Area
(m2)
Area
Partitioning
(%)
WET16398.8225.41156.7
MEAD16097.0112.04328.2
AGR4627.931.7748.0
BUILT12575.828.5417.2
Total165 397.768100.0
Note: §: See Table 1 for the extended names of the four main land cover categories.
Table 4. List of species under consideration and assigned to the alimurgical plant category. In bold character the six focus species are identified.
CodeSpeciesCodeSpeciesCodeSpecies
S1Glycyrrhiza glabra L.S14Nigella damascena L.S27Plantago argentea Chax
S2Portulaca oleracea L.S15Plantago coronopus L.S28Dittrichia viscosa (L.) Greuter
S3Cichorium intybus L.S16Verbascum sinuatum L.S29Juncus sp.
S4Beta vulgaris L.S17Scabiosa columbaria L.S30Allium roseum L.
S5Salicornia spp.S18Echium vulgare L.S31Ferula communis L.
S6Suaeda vera J.F.Gmel.S19Scolymus hispanicus L.S32Ficus carica L.
S7Sonchus oleraceus L.S20Diplotaxis erucoides (L.) DC.S33Cidonia oblonga Mill.
S8Daucus carota L.S21Solanum nigrum L.S34Punica granatum L.
S9Malva sylvestris L.S22Borago officinalis L.S35Prunus domestica L.
S10Picris hieracioides L.S23Plantago lanceolata L.S36Malus domestica (Suckow) Borkh
S11Limonium bellidifolium (Gouan) Dumort.S24Rumex conglomeratus MurrayS37Morus nigra L.
S12Cirsium arvense (L.) Scop.S25Rumex acetosa L.S38Pistacia lentiscus L.
S13Carlina gummifera (L.) LessS26Dipsacus follonum L.S39Tamarix gallica L.
Table 5. Relative species occurrence, i.e., proportion of cells (%) in which the species are present at a given cover fraction (according to the categories reported in Table 2) and their corresponding relative (%) and absolute (m2) coverage.
Species
Groups
SpeciesRelative Species OccurrenceRelative
Coverage
Area of
Coverage
A
(%)
R
(%)
U
(%)
C
(%)
CC
(%)
CCC
(%)
Total §
(%)
(%)(m2)
1S627.273.646.674.858.4849.0972.7354.5259,200
2S741.2157.58--0.610.6158.7911.0512,002
S1052.7326.6716.971.821.210.6147.2712.9614,079
3S884.2413.941.82---15.763.083347
S484.8513.941.21---15.152.873116
S586.066.675.45-1.82-13.944.364731
4S992.127.88----7.881.381500
S2594.555.45----5.450.961039
S1195.154.240.61---4.850.961039
S31–S3995.154.85----4.851.701846
5S297.581.21--1.21-2.421.061154
S2897.581.211.21---2.420.64692
S14, S1697.582.42----2.420.85923
S17, S26, S3298.181.82----1.820.961039
S3, S13, S19, S2298.791.21----1.210.85923
S1299.39-0.61---0.610.21231
remaining species99.390.61----0.611.591731
Note: §: Values reported in the “Total” column are the sum of R, U, C, CC and CCC.
Table 6. Self-occurrence (along the diagonal) and cross-occurrence values by species (A), together with magnitude or strength of self-(along the diagonal) and cross-species link (B). While values in A are expressed in percentage (%), values in B are expressed in score, ranging from 0 to 5.
(A) SpeciesS6S7S10S8S4S5
S672.73
S755.1558.79
S1044.2442.4247.27
S815.1513.3310.9115.76
S415.1515.159.701.8215.15
S513.9411.527.274.242.4213.94
S97.276.676.672.421.82
S253.644.854.85 1.82
S114.854.853.03 1.21
S314.853.032.42 1.821.82
S394.85
Percentages below the value of 1 have been deleted
 Values > 40%
 Values = 10–16%
(B) SpeciesS6S7S10S8S4S5
S64.34
S71.731.04
S101.830.941.38
S80.960.440.500.53
S40.930.460.480.180.50
S51.190.470.450.300.200.87
S90.570.300.380.200.15
S250.420.250.41 0.15
S110.490.270.220.13 0.15
S310.470.200.220.130.150.27
S390.56
Link strengths below the value of 0.10 have been deleted
 Values > 1.00
 Values = 0.50–1.00
Table 7. Correlation matrix (Pearson’s coefficients) of biodiversity variables calculated with respect to all of the cells/sites of the study area. All resulting correlation coefficients were highly significant (p < 1%).
RichnessAbundanceShannonSimpson
Richness1.000.900.980.91
Abundance0.901.000.870.85
Shannon0.980.871.000.97
Simpson0.910.850.971.00
Disclaimer/Publisher’s Note: The statements, opinions and data contained in all publications are solely those of the individual author(s) and contributor(s) and not of MDPI and/or the editor(s). MDPI and/or the editor(s) disclaim responsibility for any injury to people or property resulting from any ideas, methods, instructions or products referred to in the content.