Author Contributions
Conceptualization, Y.L. and J.G. methodology, Y.L., T.Z. and J.G.; software, T.Z., H.S. and Y.L.; validation, Y.L., T.Z. and J.G.; formal analysis, D.L.; investigation, Y.L., C.L. and R.X.; resources, M.S., J.Z. and D.L.; data curation, T.Z., C.L. and R.X.; writing—original draft preparation, Y.L., T.Z. and J.G.; writing—review and editing, Y.L. and J.Z.; visualization, Y.L. and H.S.; supervision, M.S.; project administration, M.S.; funding acquisition, M.S. All authors have read and agreed to the published version of the manuscript.
Figure 1.
Effect of substitute substrates on the physiological indices of potted chrysanthemums: (a) Intercellular CO2 concentration (vertical coordinate: Ci; mmol H2O/m2·s); (b) Stomatal conductance (vertical coordinate: Gs; μmol CO2/m2·s); (c) Transpiration rate (vertical coordinate: Tr; mmol H2O/m2·s); (d) Net photosynthetic rate (vertical coordinate: Pn; μmol CO2/m2·s). The horizontal coordinates represent the 18 treatment groups CK, T1–T17. Data are mean ± standard error (n = 3). Different lowercase letters indicate significant differences (p < 0.05), as determined by Duncan’s multiple range test.
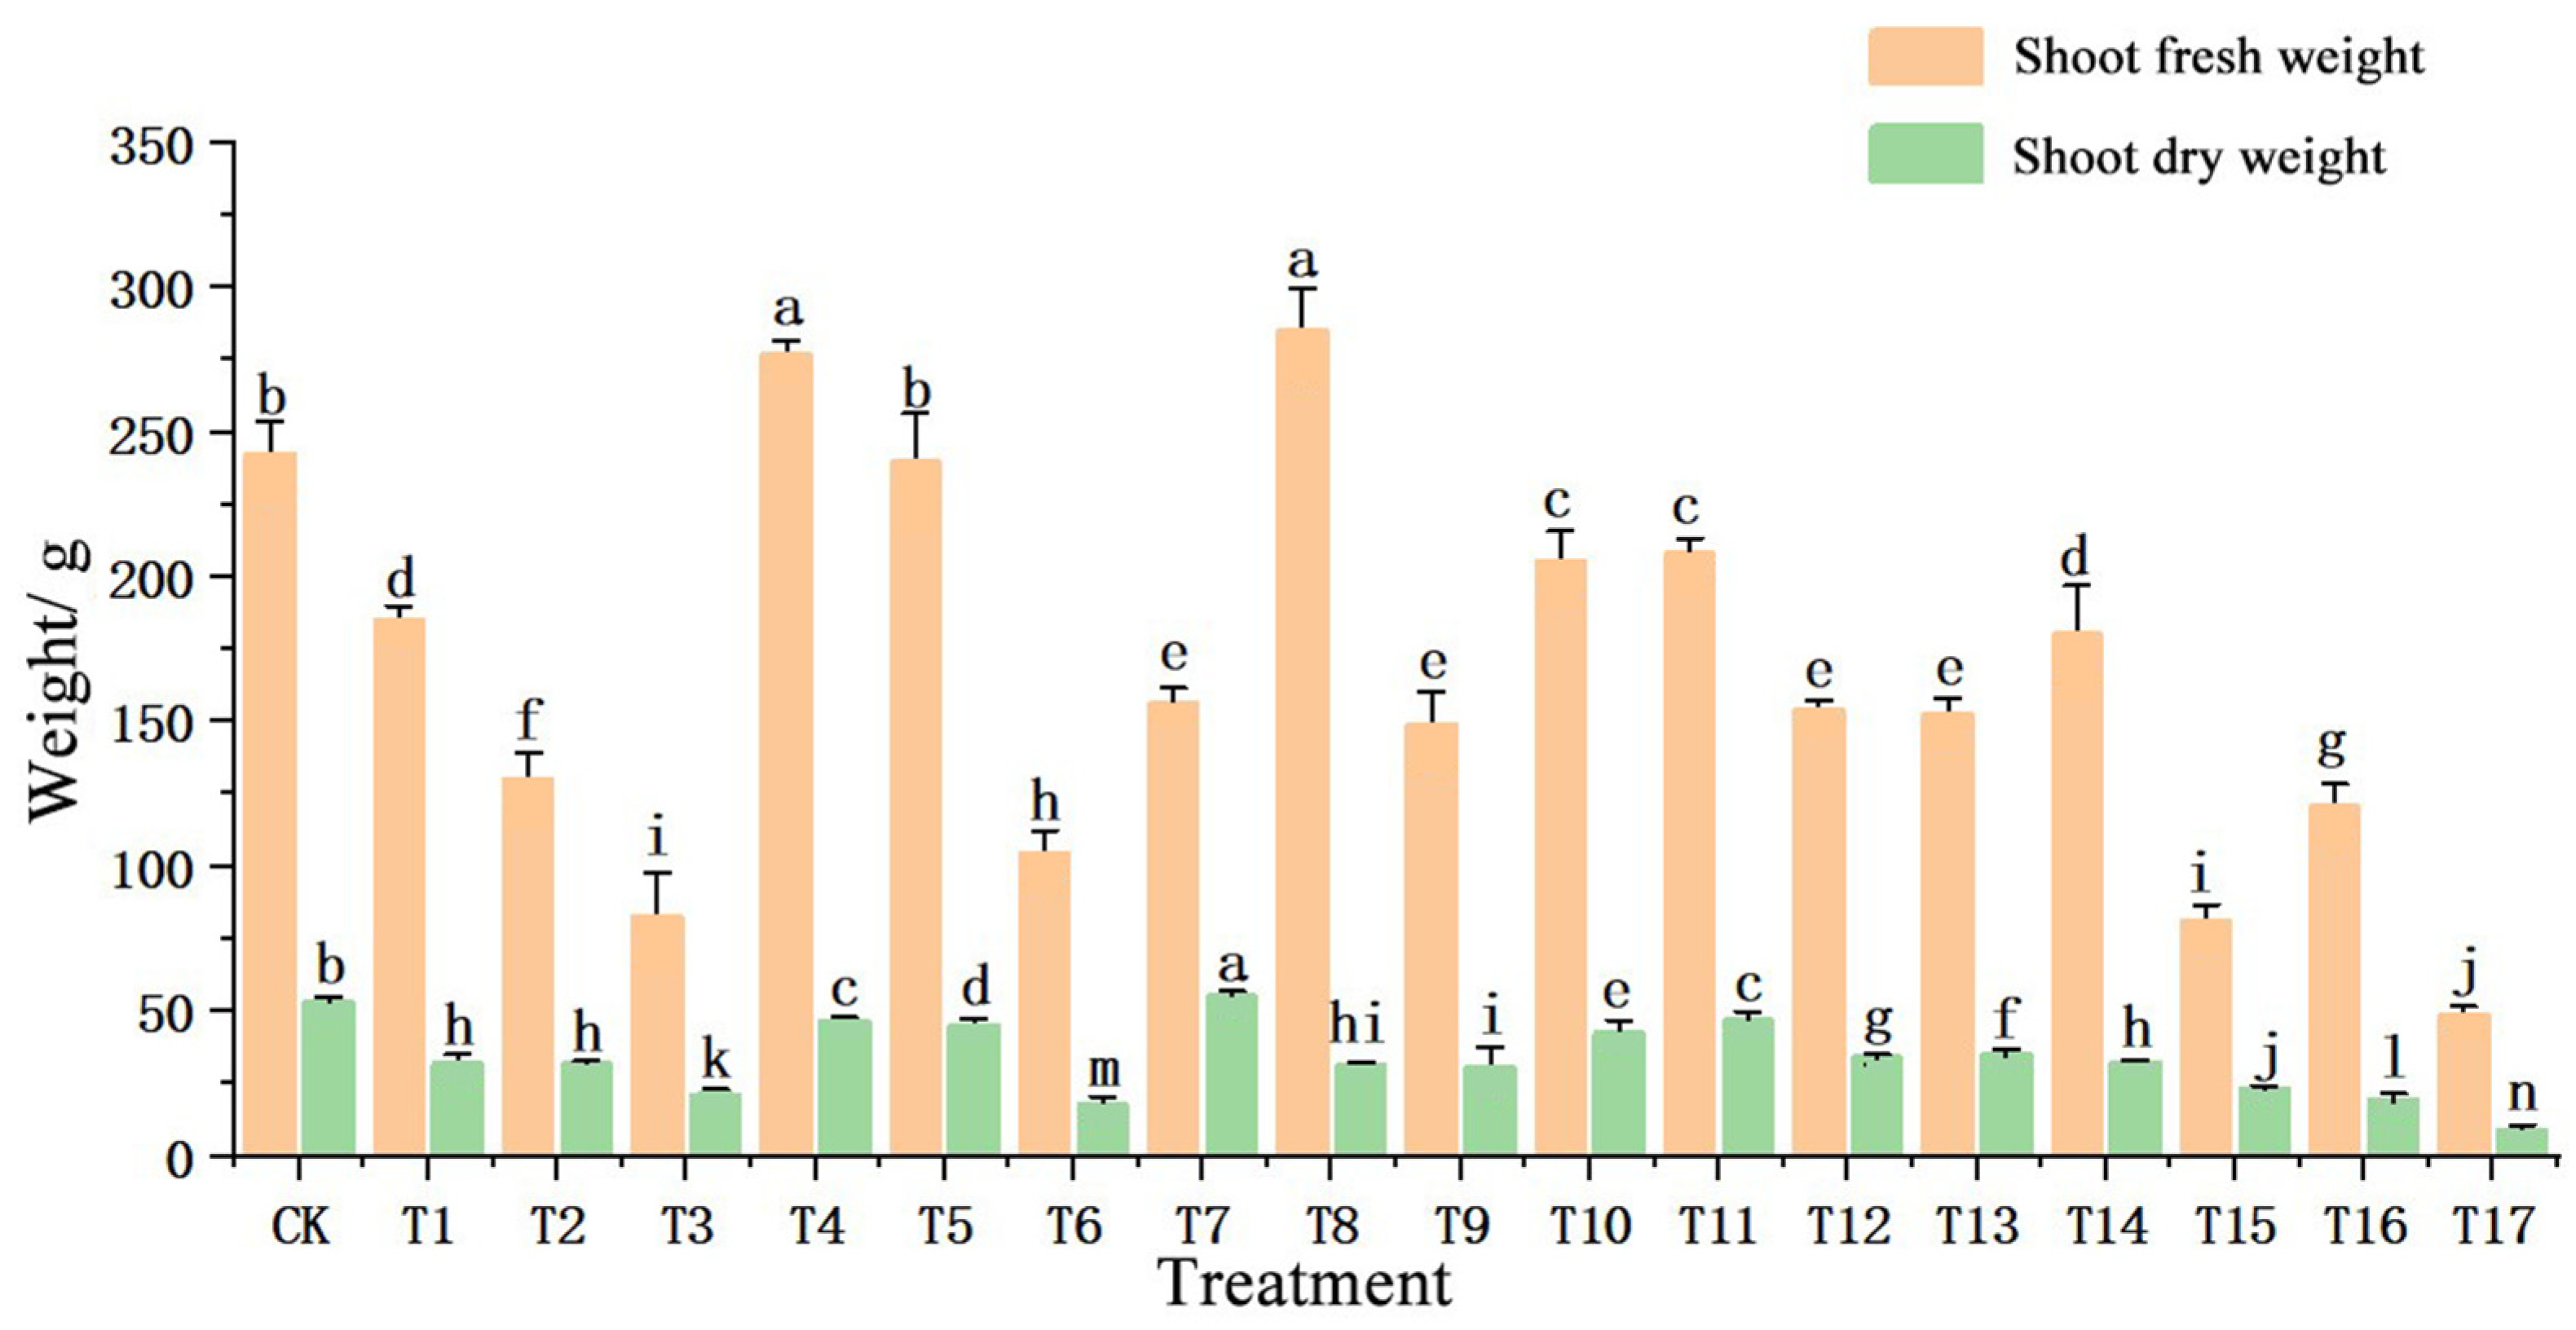
Figure 2.
Effect of substitute substrates on the biomass of potted chrysanthemums. The vertical coordinate represents the weight (g). The horizontal coordinates represent the 18 treatment groups CK, T1-T17. Data are mean ± standard error (n = 3). Different lowercase letters indicate significant differences (p < 0.05), as determined by Duncan’s multiple range test.
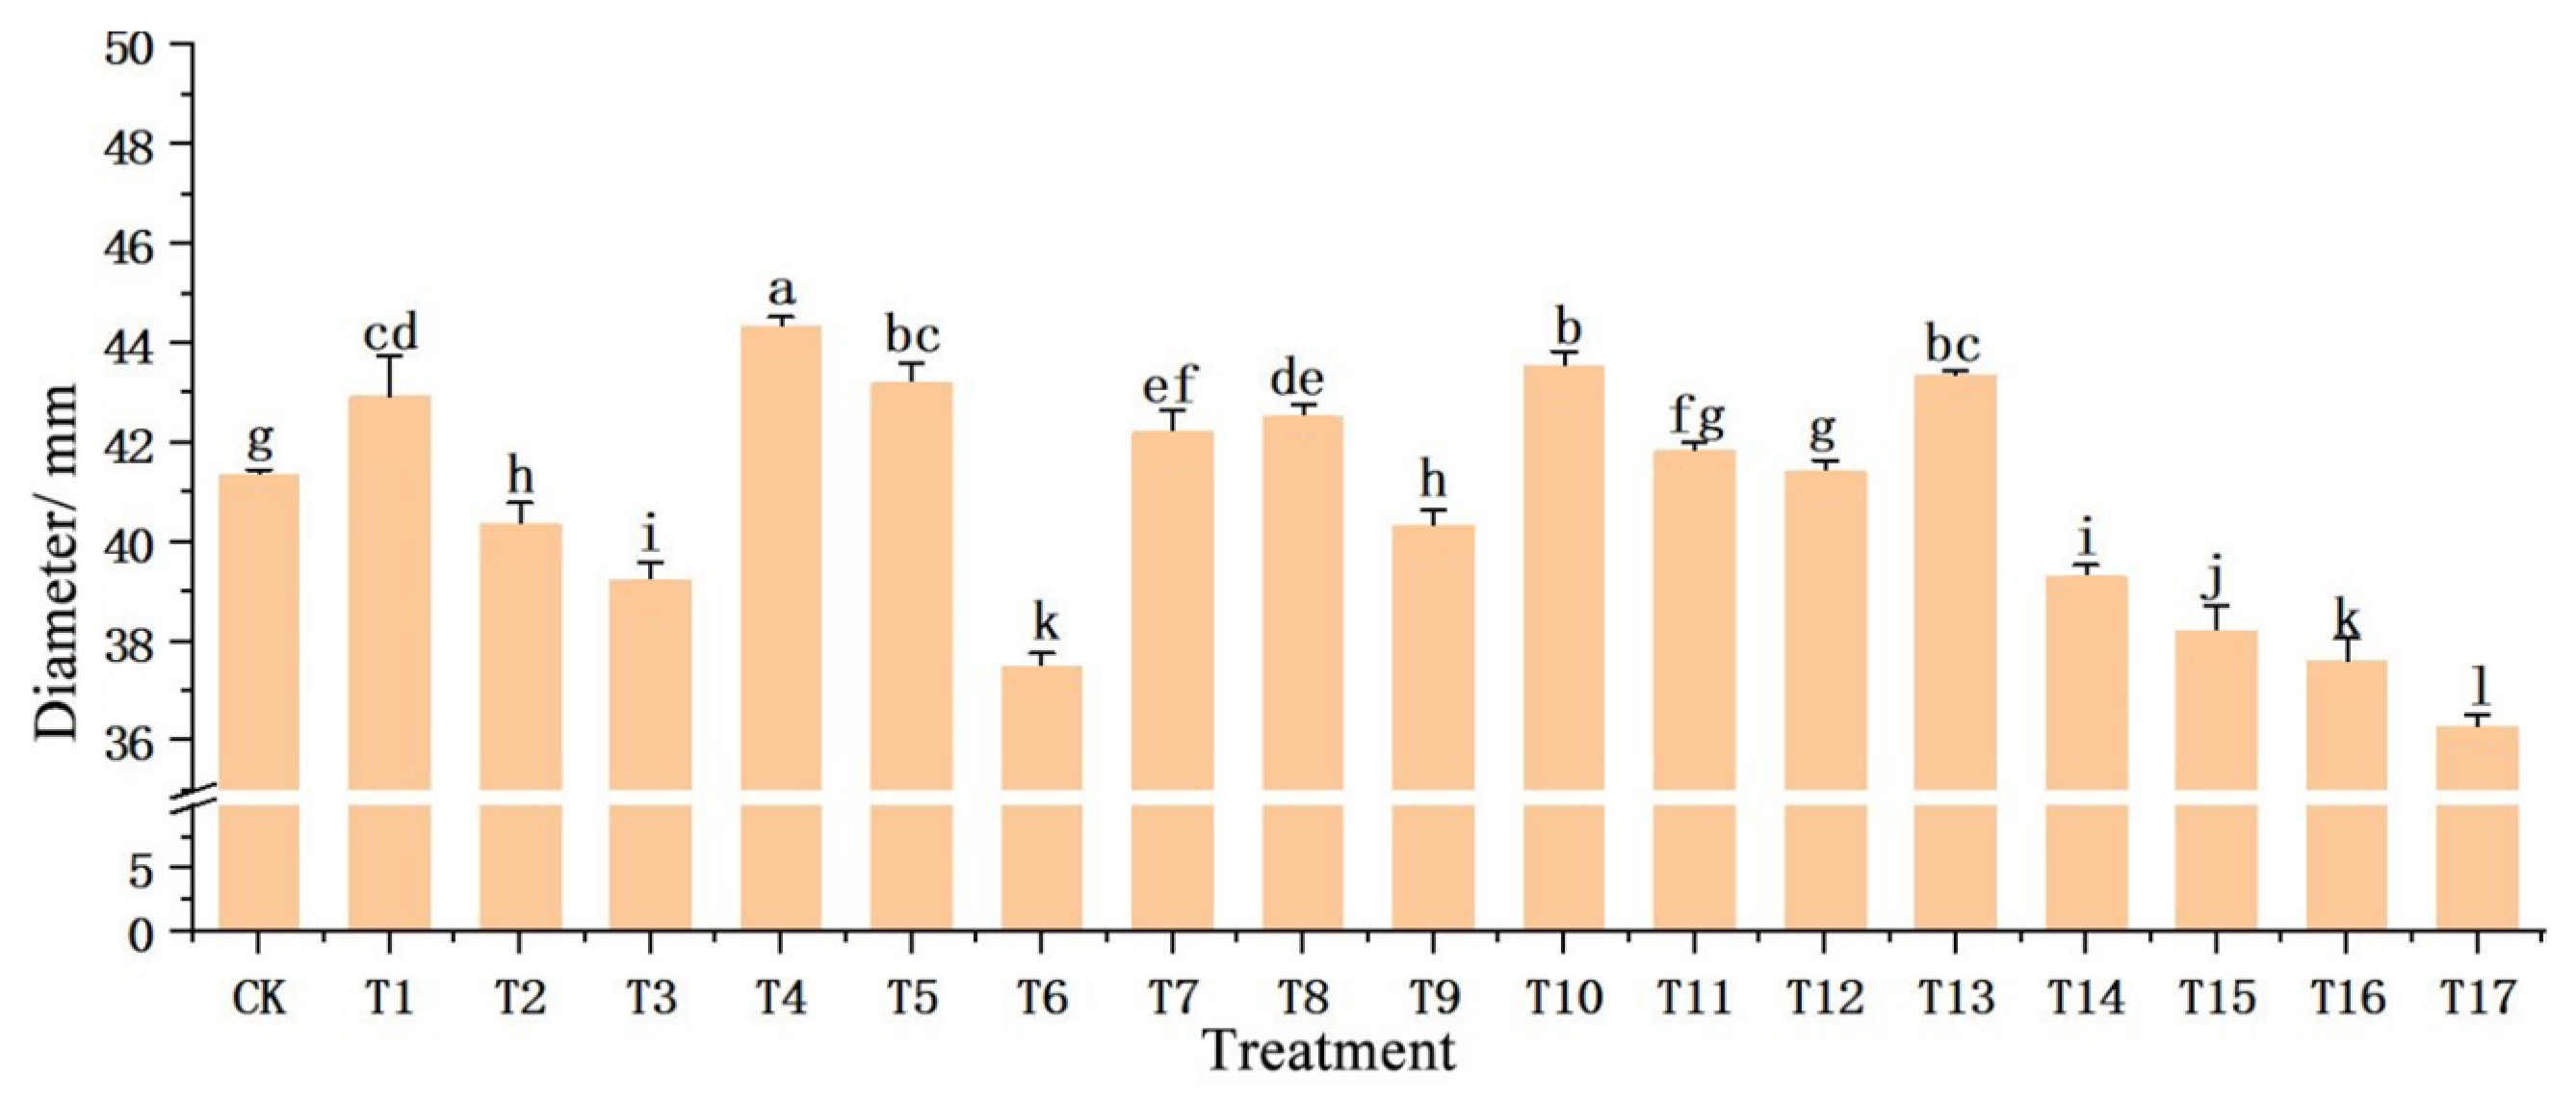
Figure 3.
Effect of substitute substrates on the flower diameter of potted chrysanthemums. The vertical coordinate represents the flower diameter (mm). The horizontal coordinates represent the 18 treatment groups CK, T1–T17. Different lowercase letters indicate significant differences (p < 0.05), as determined by Duncan’s multiple range test.
Figure 4.
Effect of substitute substrates on the flower quality of potted chrysanthemums.
Figure 4.
Effect of substitute substrates on the flower quality of potted chrysanthemums.
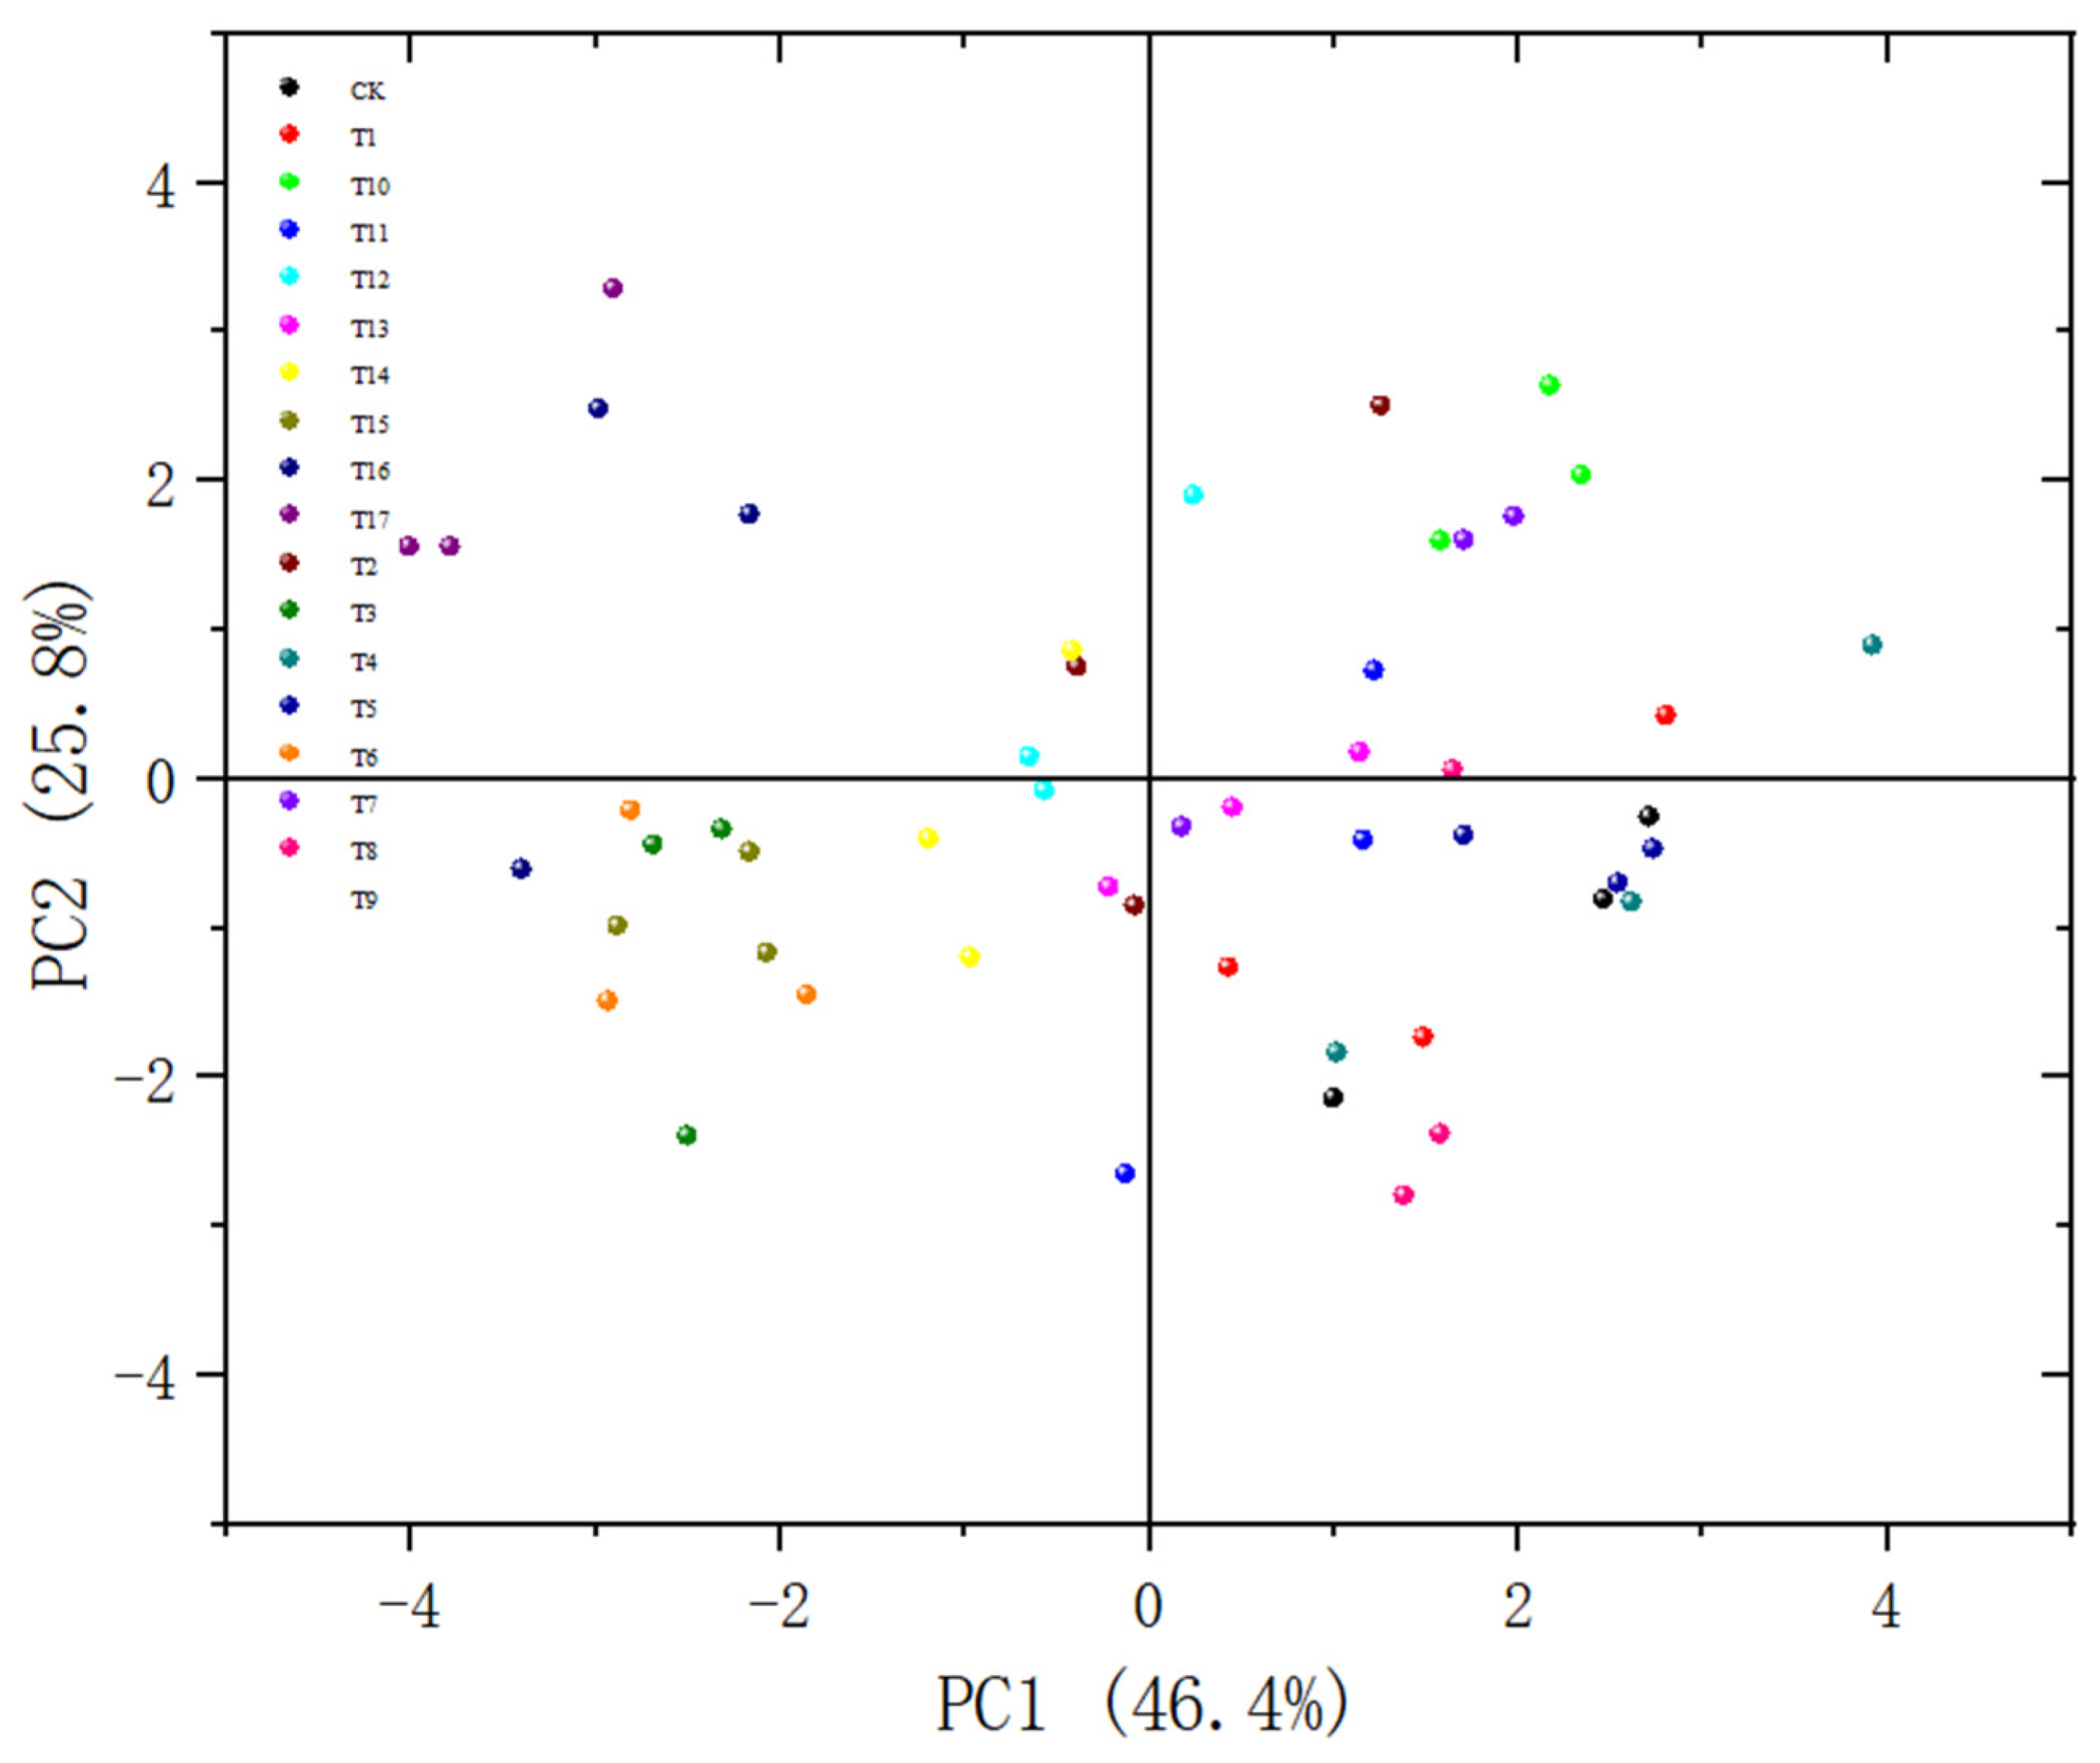
Figure 5.
Principal component analysis for substitute substrates.
Figure 5.
Principal component analysis for substitute substrates.
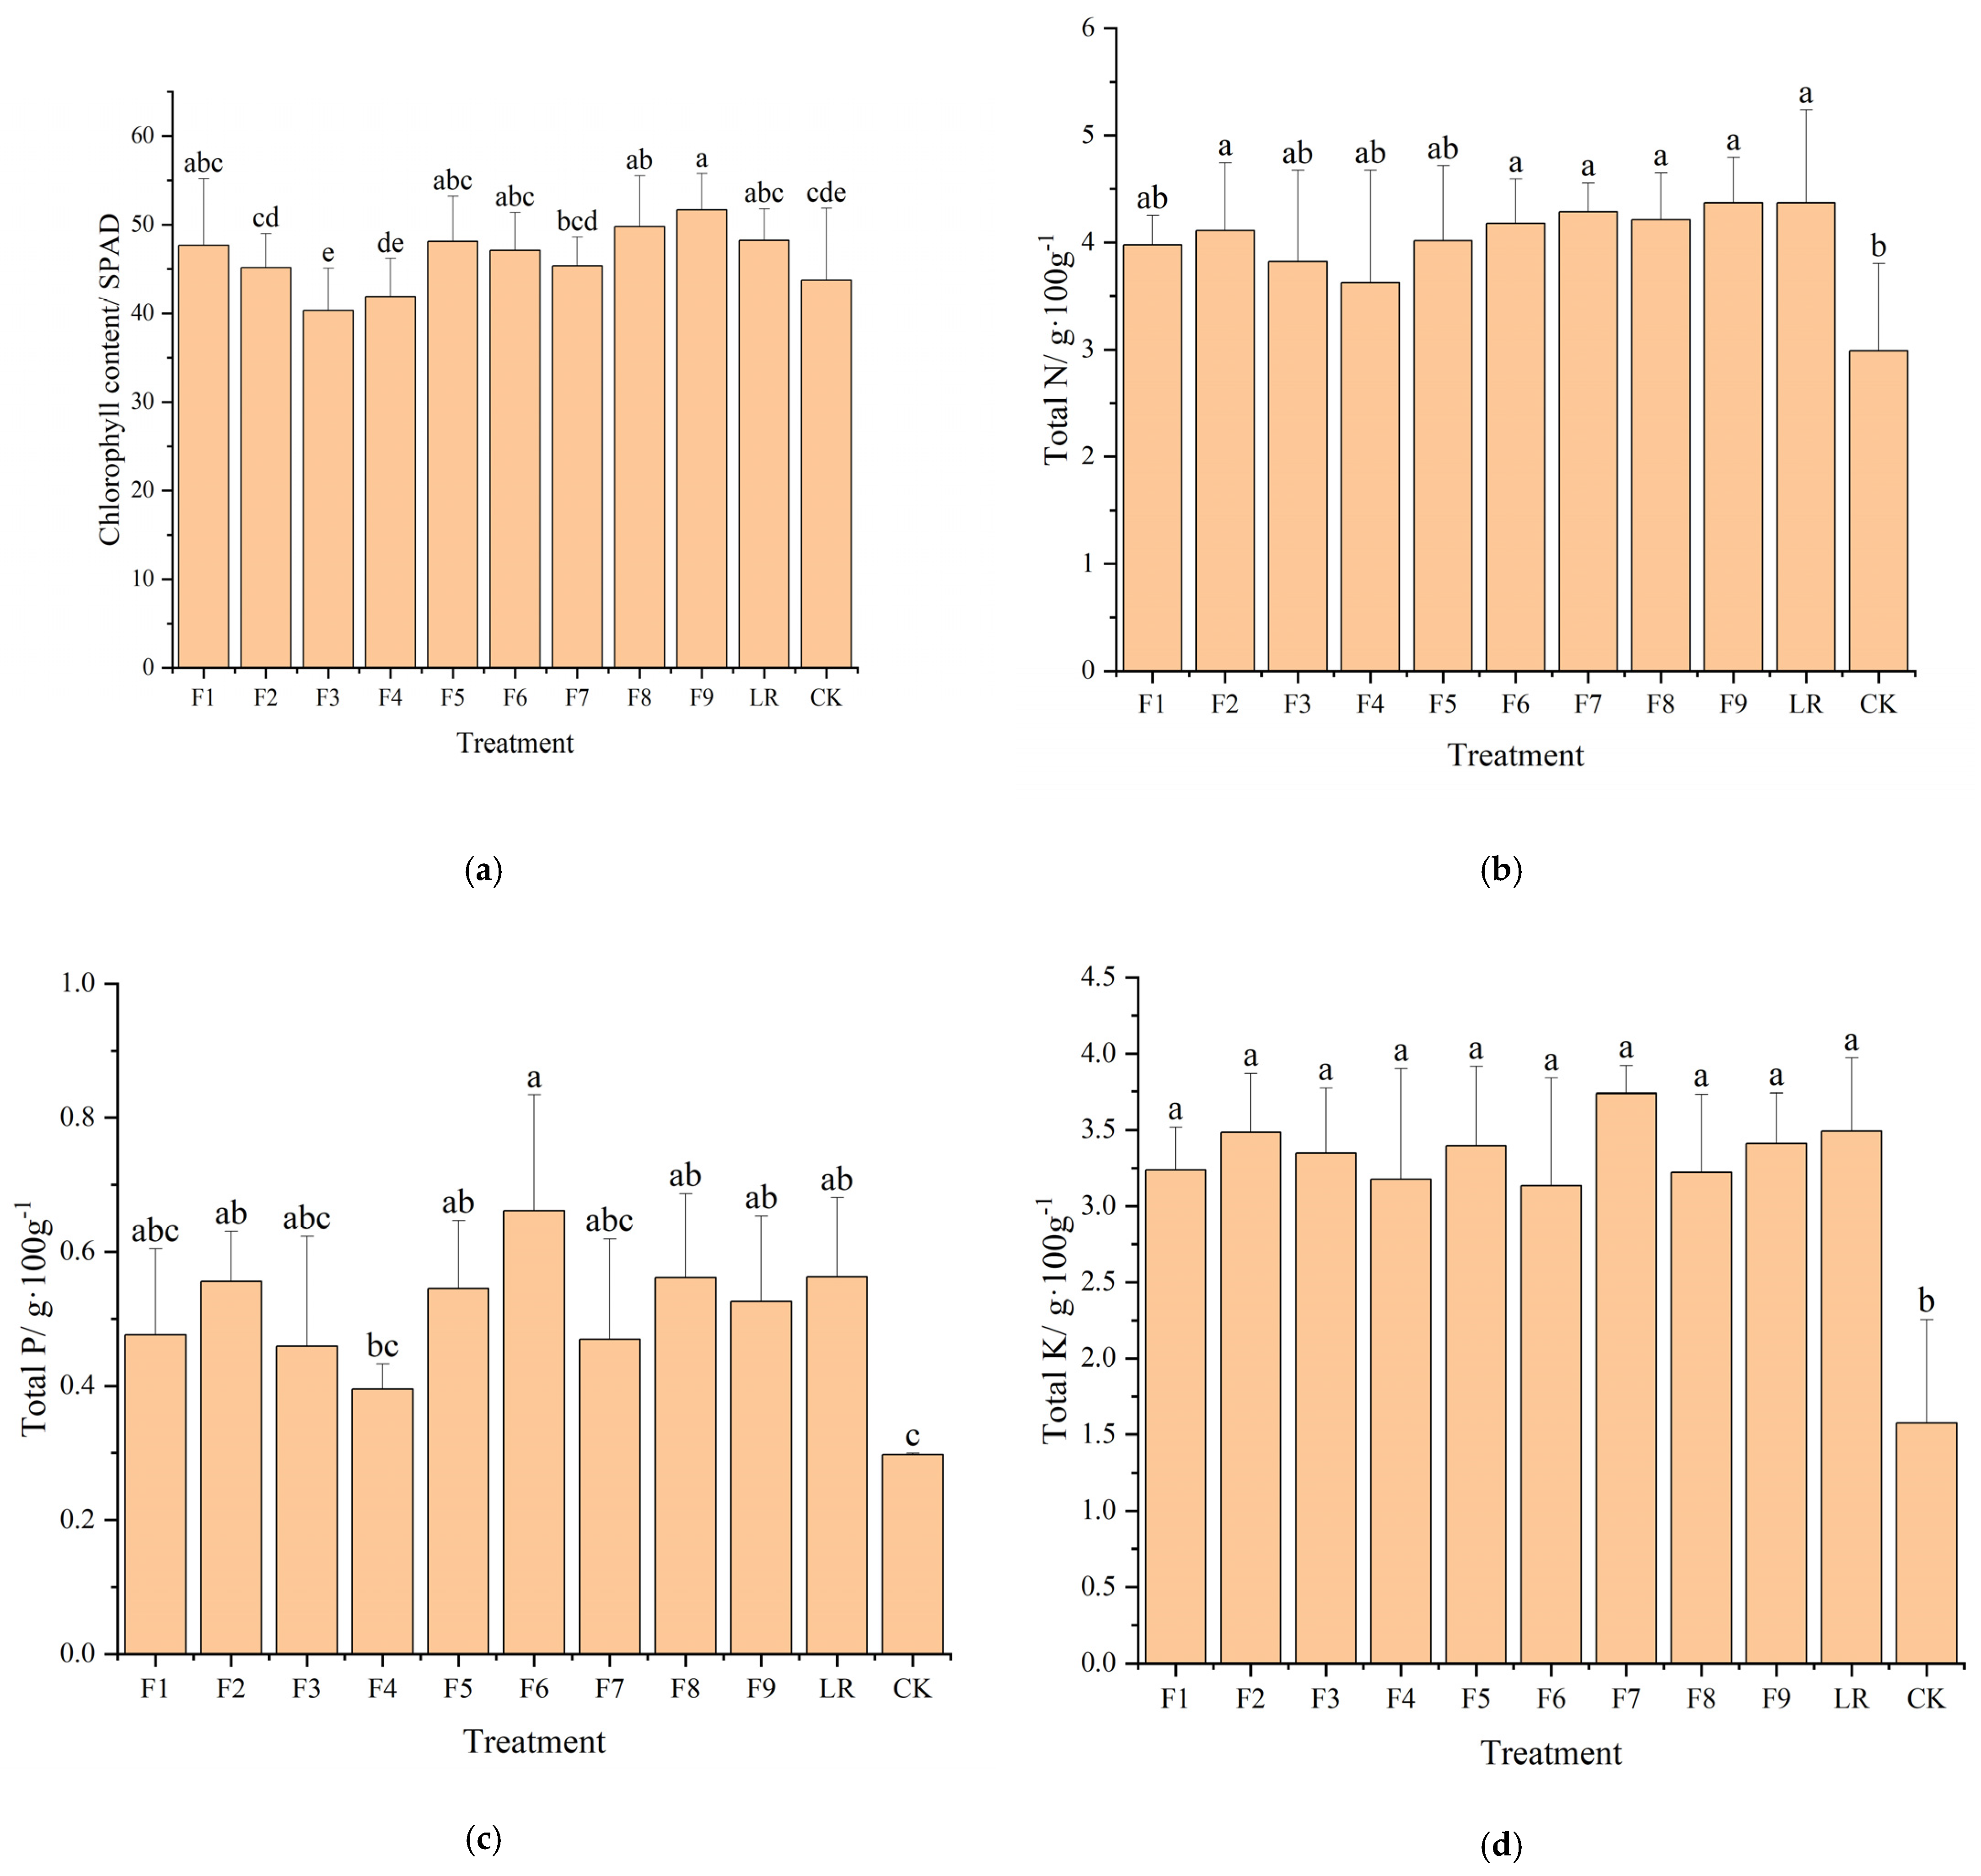
Figure 6.
Effect of chlorophyll content, nitrogen, phosphorus, and potassium ratio on the total chlo-rophyll content and N/P/K of potted chrysanthemums: (a) The total chlorophyll content (SPAD); (b) Total N (g/100 g); (c) Total P (g/100 g); (d) Total K (g/100 g). The horizontal coordinates represent the 11 treatment groups CK, LR, and F1-F9. Data are mean ± standard error (n = 5). Different lower-case letters indicate significant differences (p < 0.05), as determined by Duncan’s multiple range test.
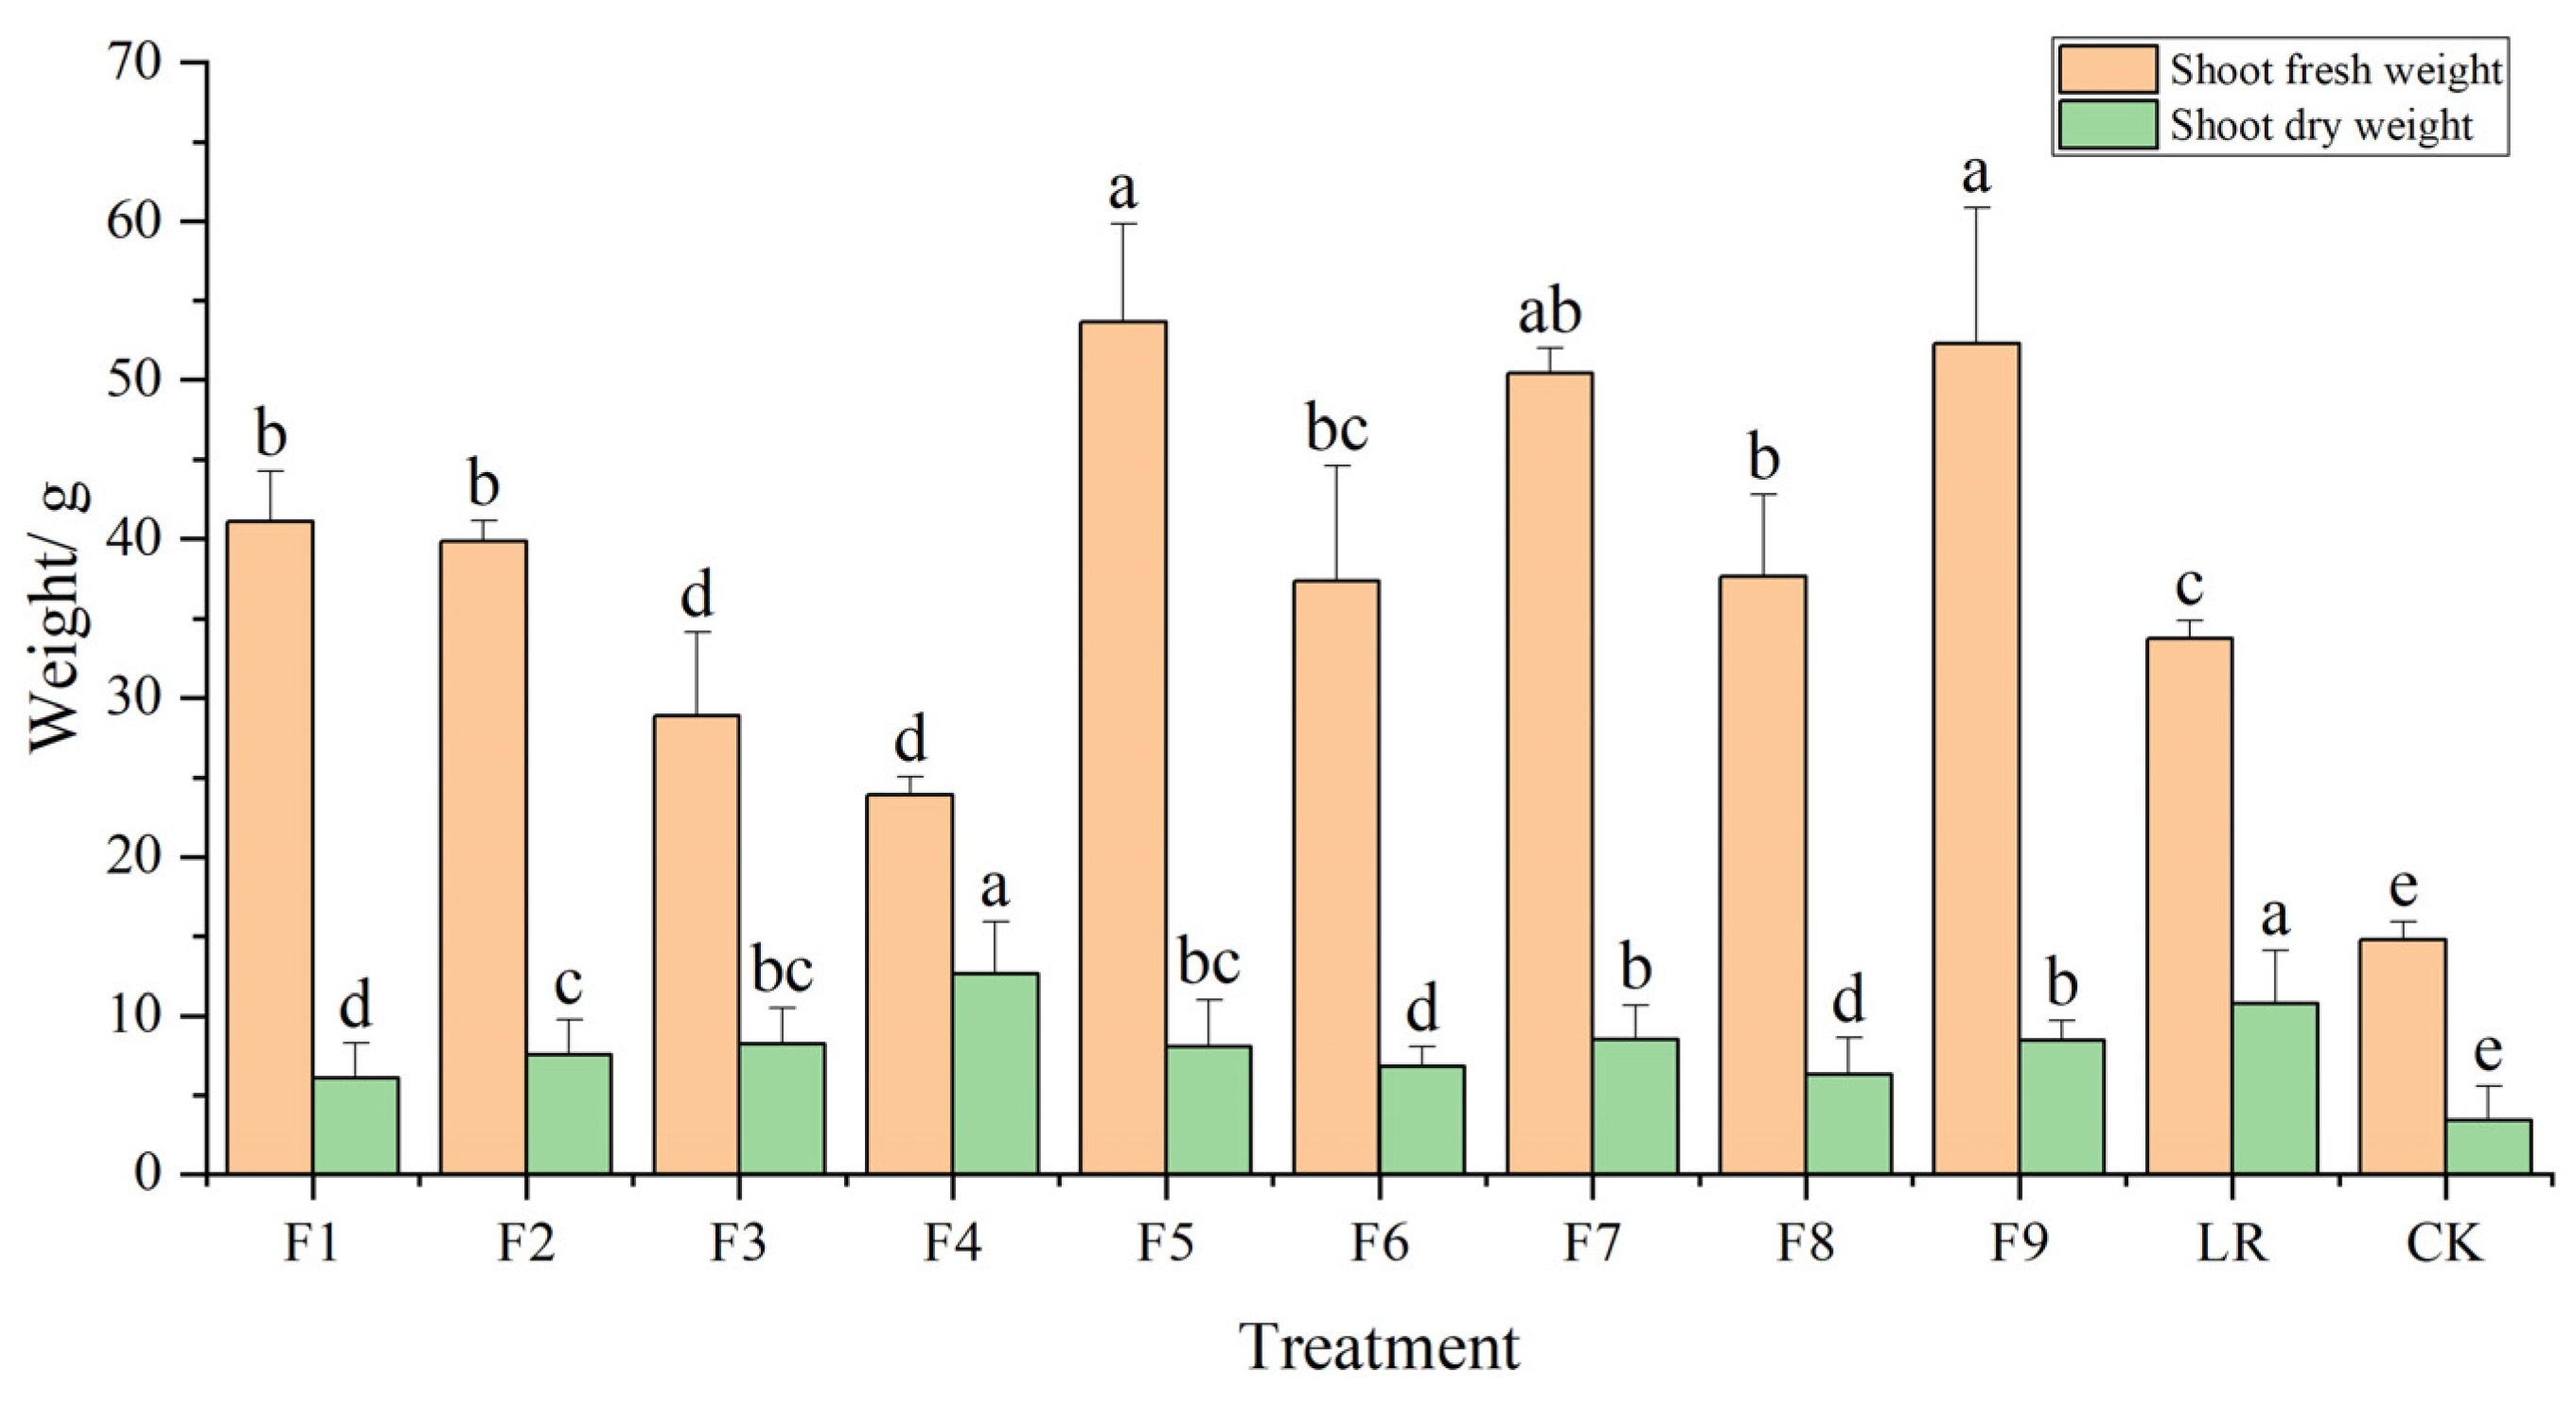
Figure 7.
Effect of nitrogen, phosphorus, and potassium ratio on the biomass of potted chrysanthemums. The horizontal coordinates represent the 11 treatment groups (CK, LR, and F1–F9). Data are mean ± standard error (n = 5). Different lowercase letters indicate significant differences (p < 0.05), as determined by Duncan’s multiple range test.
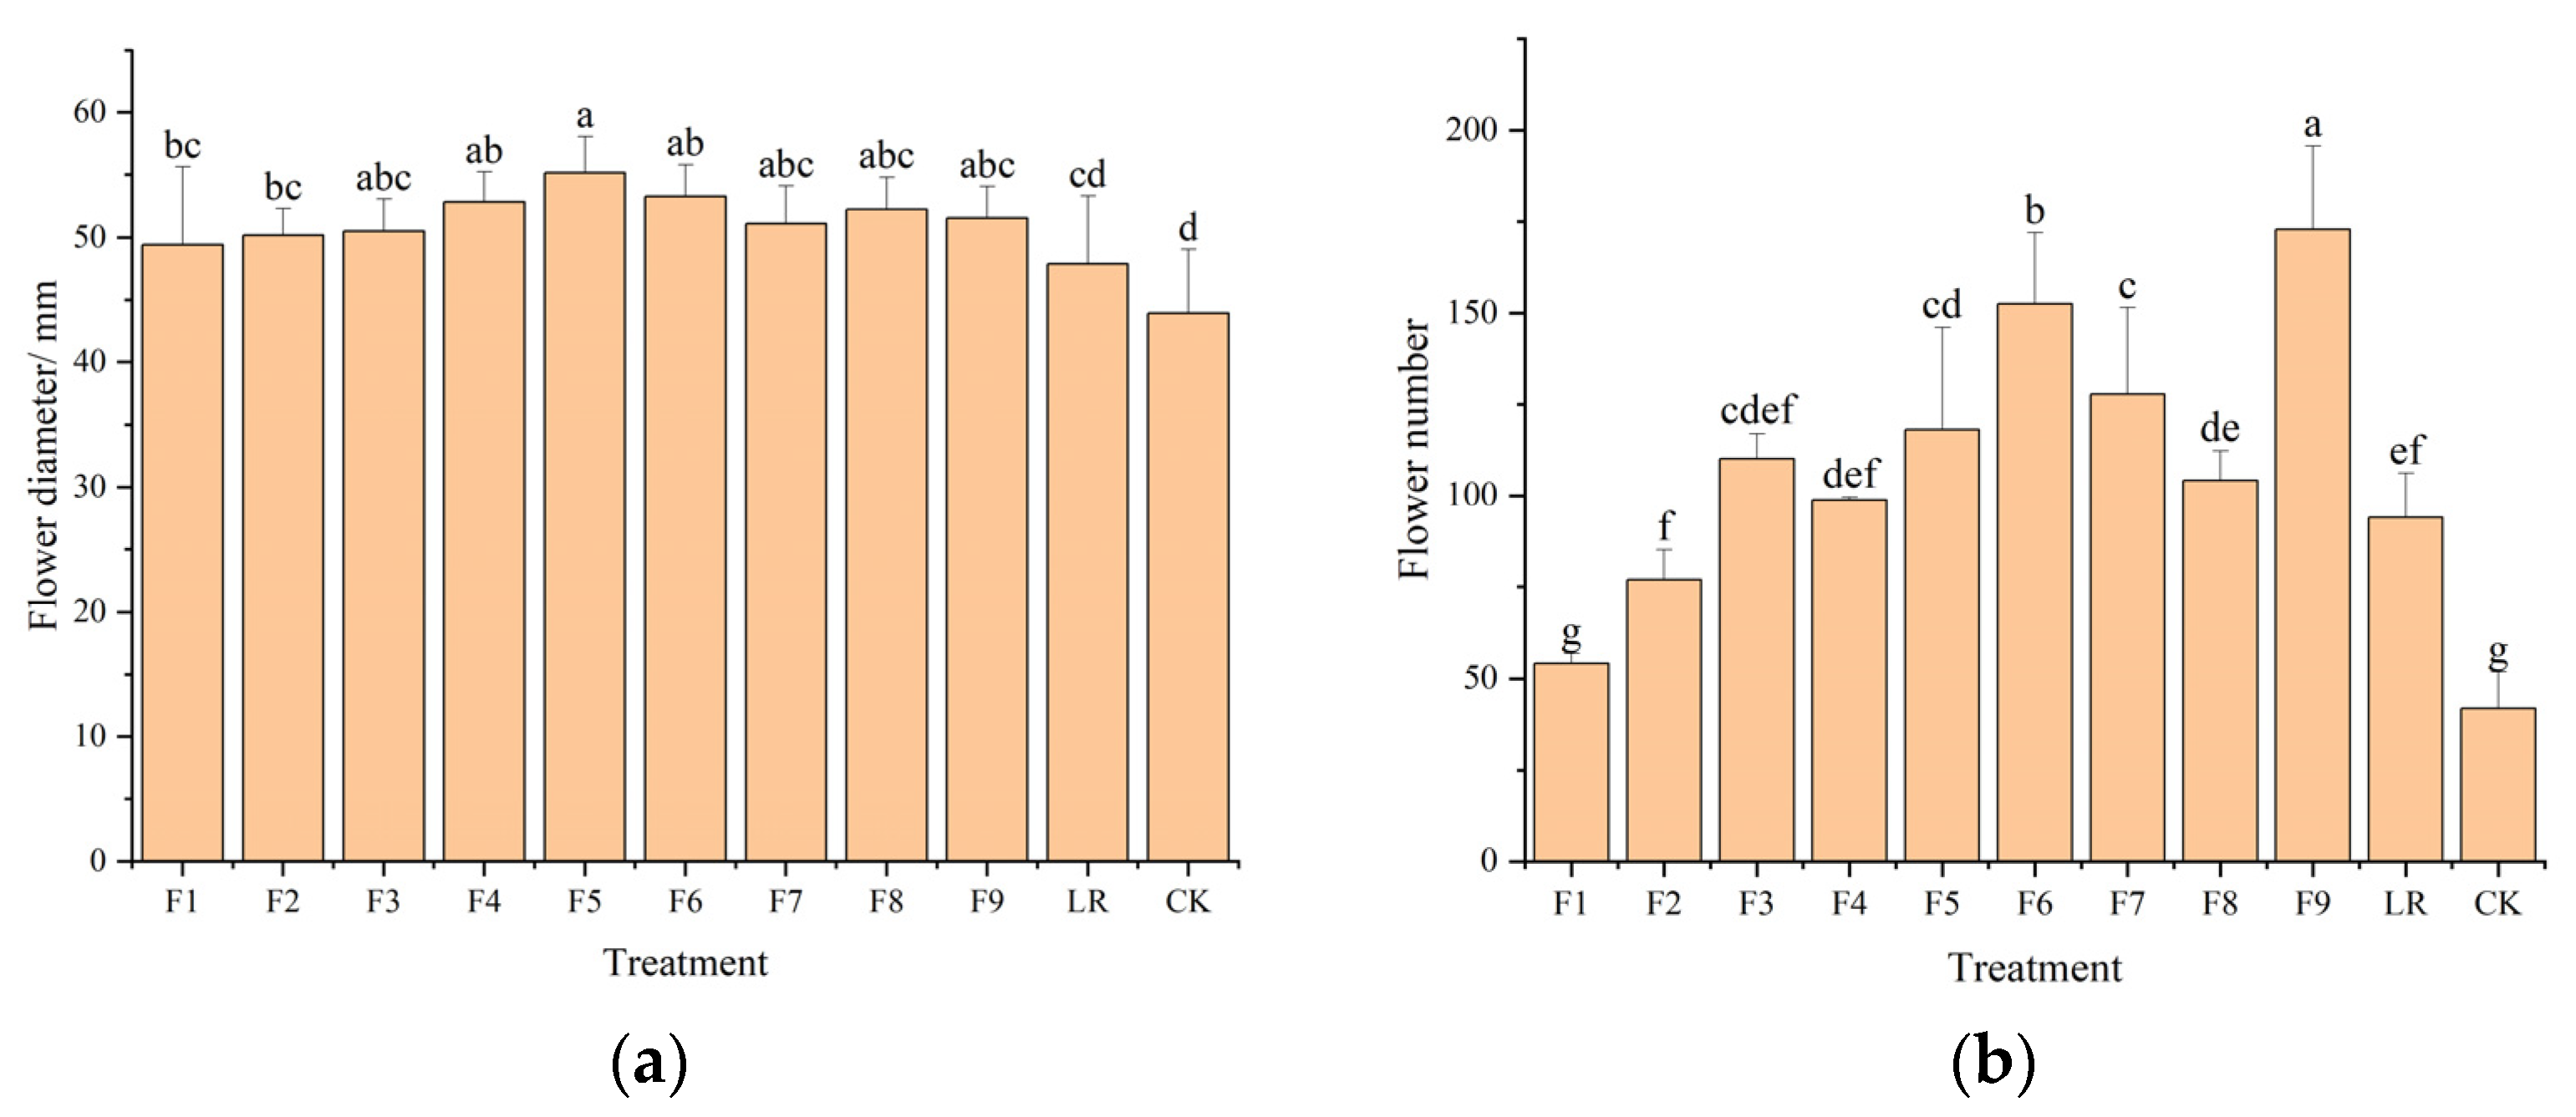
Figure 8.
Effect of nitrogen, phosphorus, and potassium ratio on the flowering number and diameter of potted chrysanthemums: (a) Flower diameter (mm); (b) Flower number. The horizontal coordinates represent the 11 treatment groups (CK, LR, and F1–F9). Data are mean ± standard error (n = 5). Different lowercase letters indicate significant differences (p< 0.05), as determined by Duncan’s multiple range test.
Figure 9.
Effect of nitrogen, phosphorus, and potassium ratio on the flowering quality of potted chrysanthemums.
Figure 9.
Effect of nitrogen, phosphorus, and potassium ratio on the flowering quality of potted chrysanthemums.
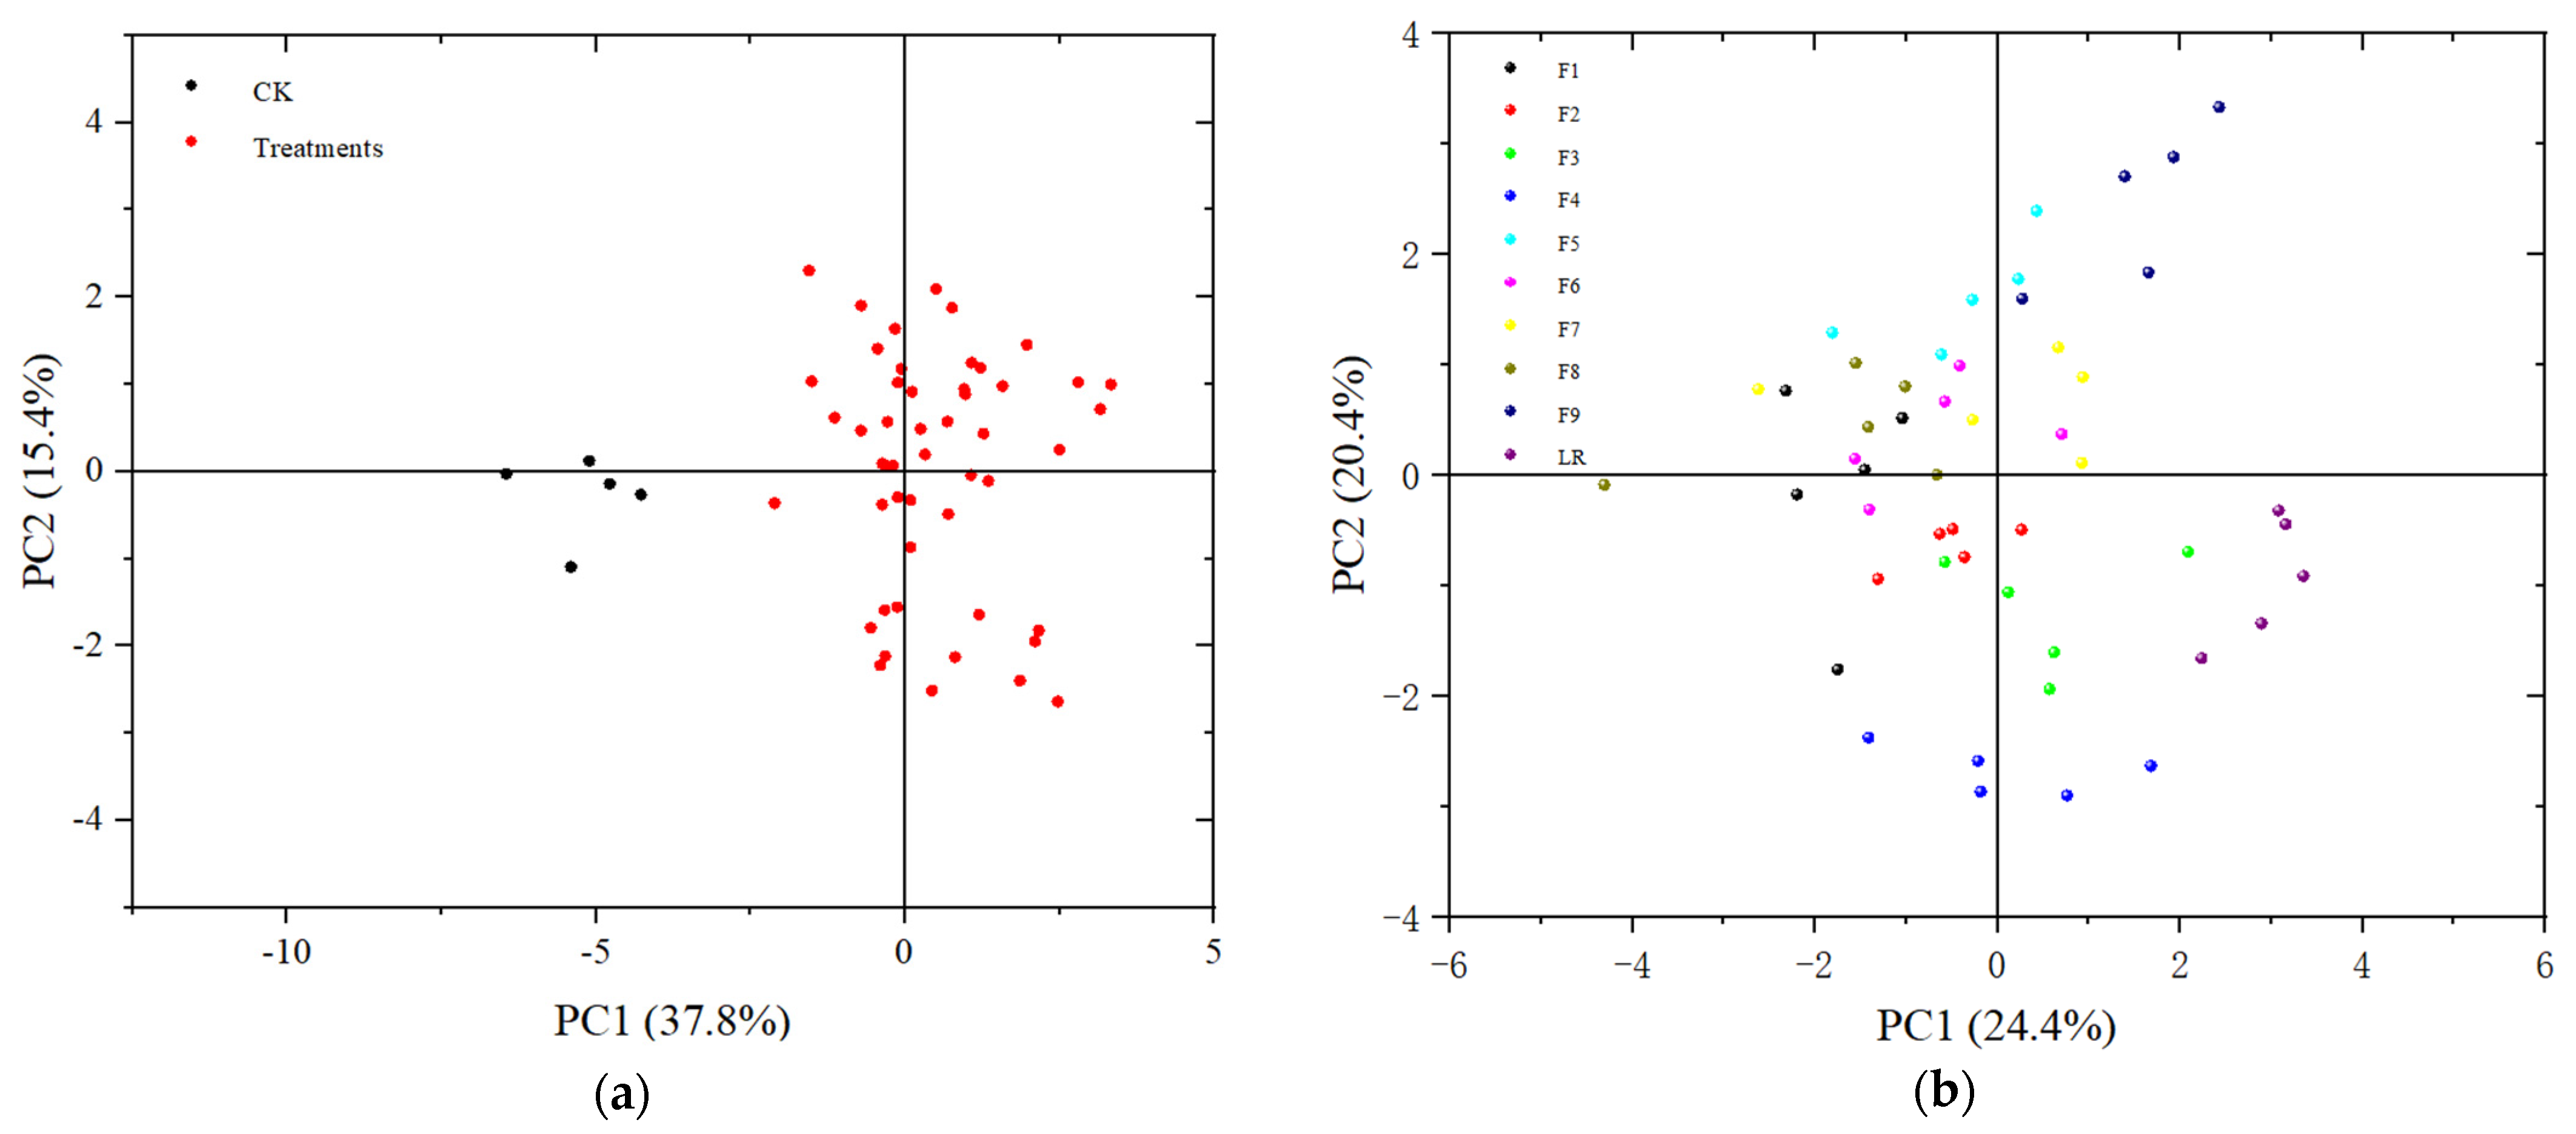
Figure 10.
Principal component analysis for nitrogen, phosphorus, and potassium fertilizer ration-ing. (a) PCA between CK and other treatments; (b) PCA between different treatments.
Figure 10.
Principal component analysis for nitrogen, phosphorus, and potassium fertilizer ration-ing. (a) PCA between CK and other treatments; (b) PCA between different treatments.
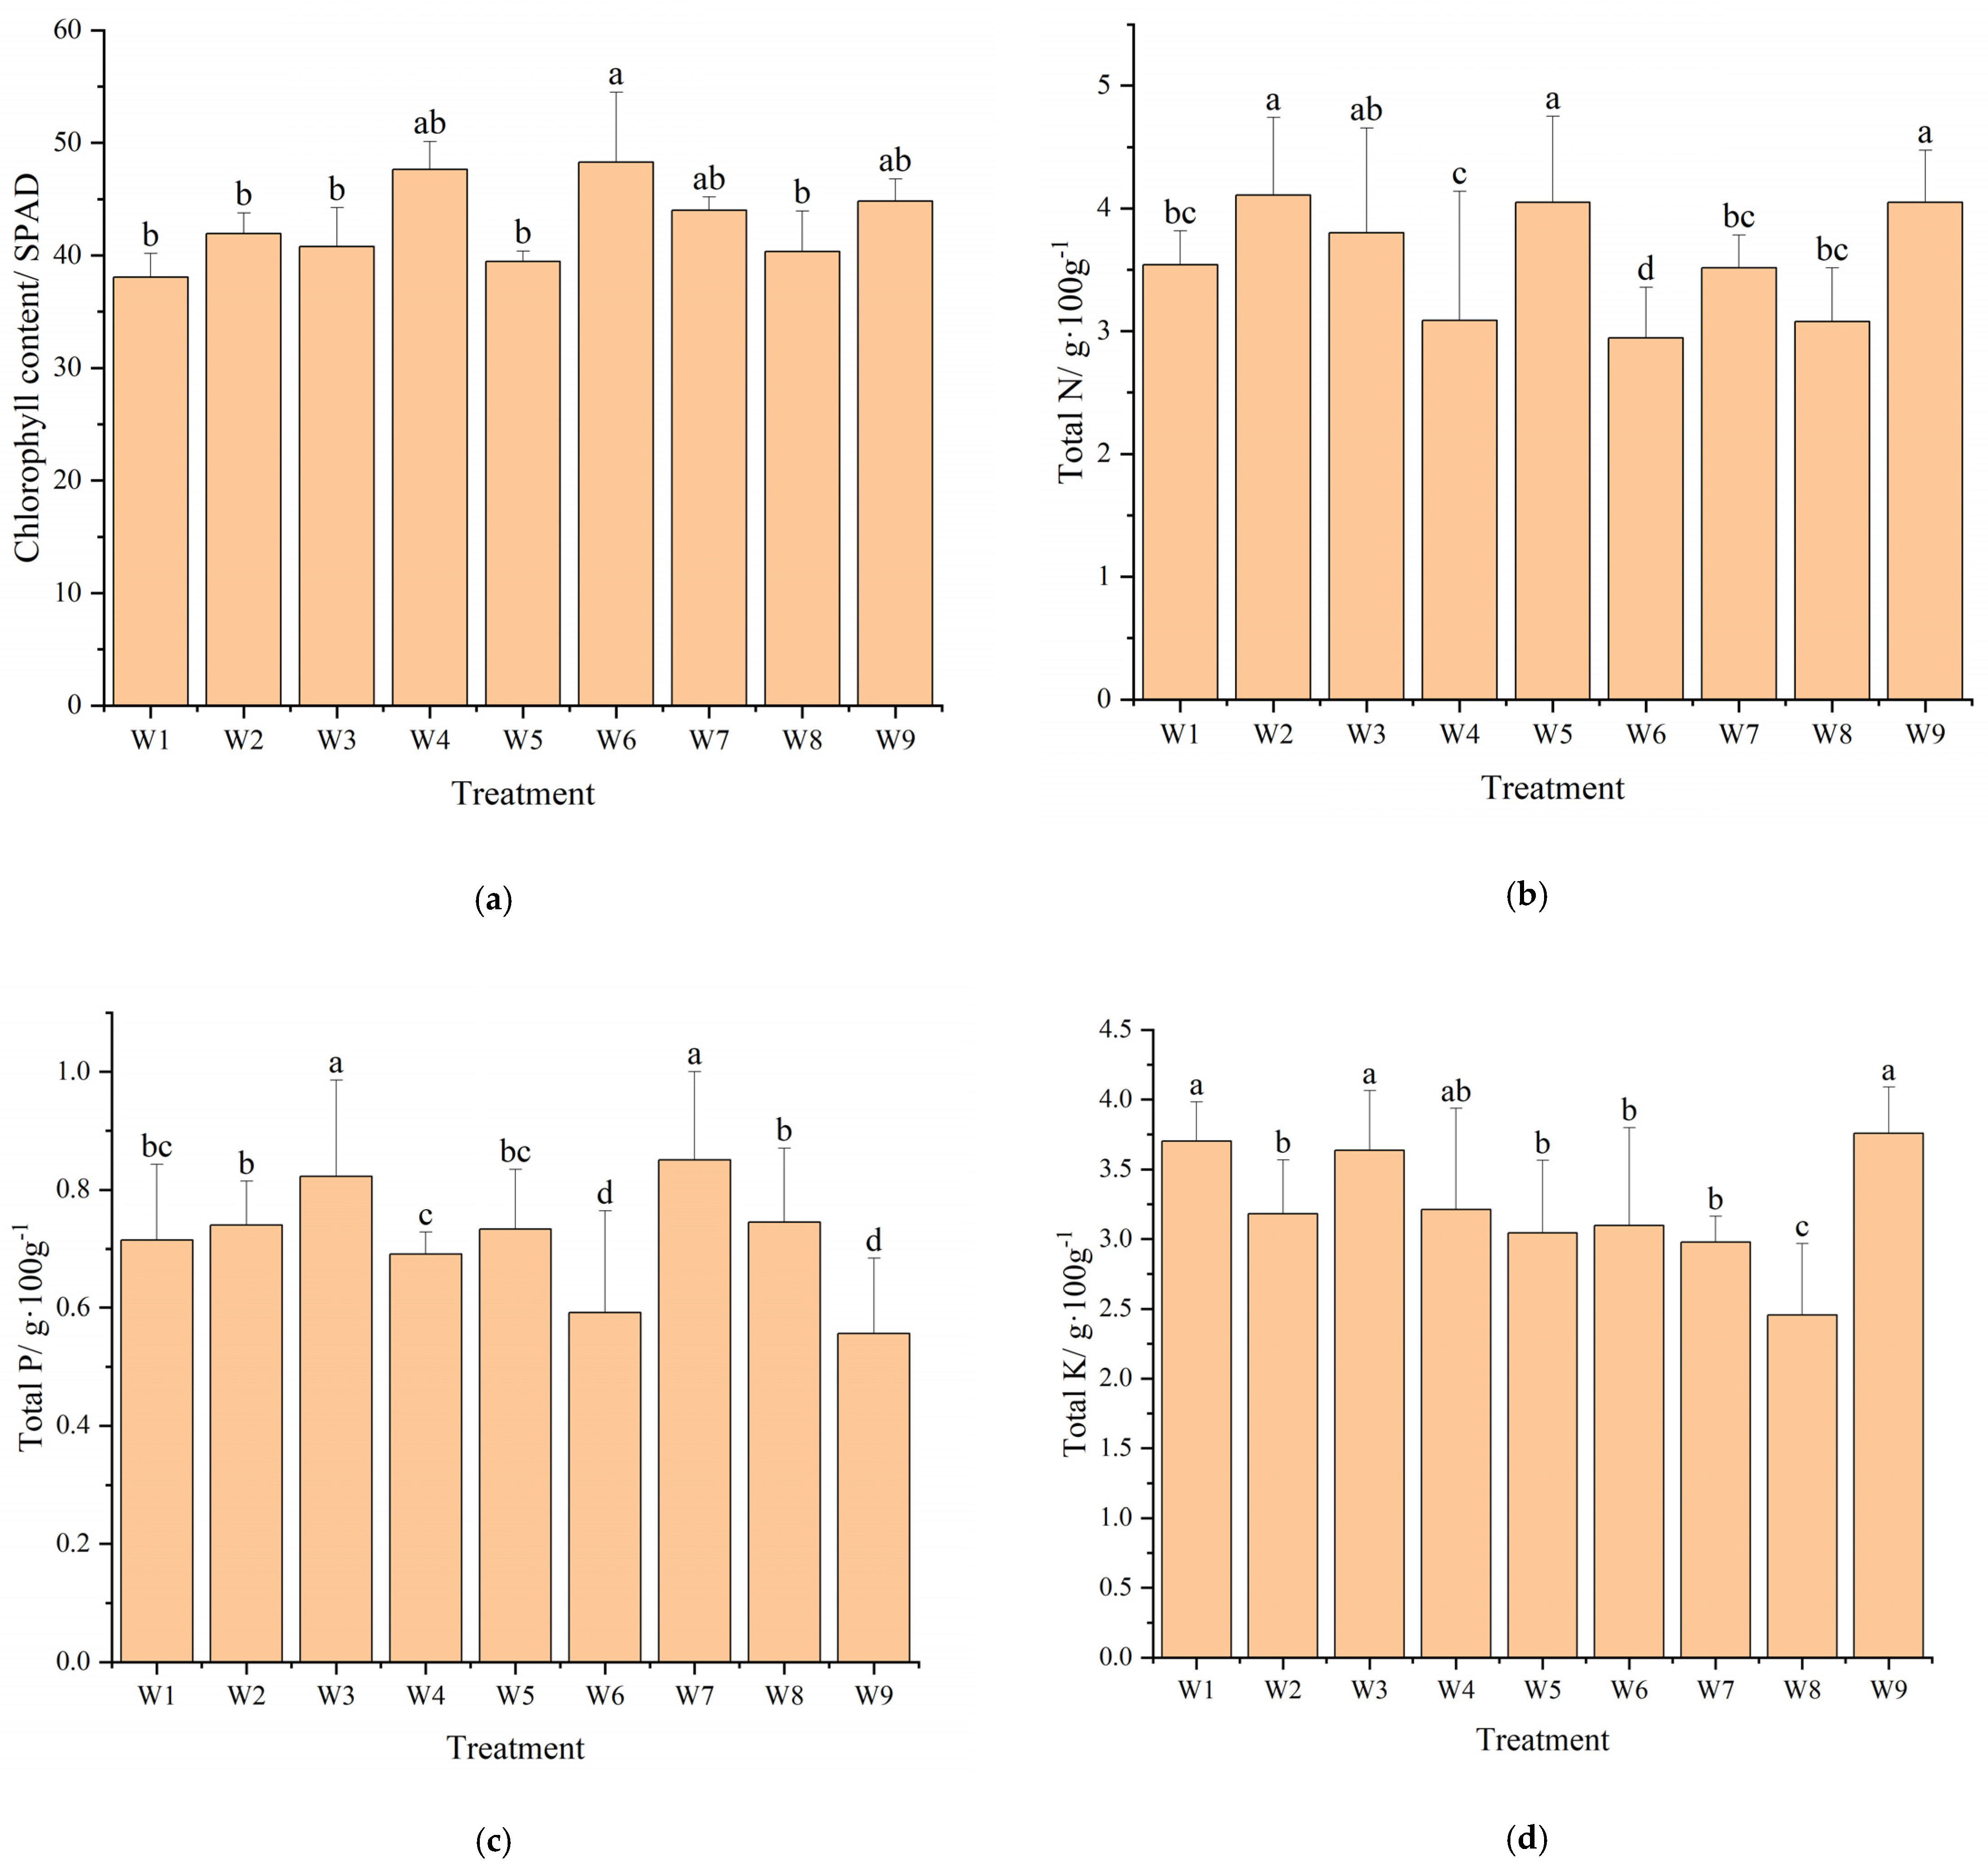
Figure 11.
Effect of substrate, water, and fertilizer on the total chlorophyll content and N/P/K of potted chrysanthemums: (a) Total chlorophyll content (SPAD); (b) Total N (g/100 g); (c) Total P (g/100 g); (d) Total K (g/100 g). The horizontal coordinates represent the 9 treatment groups (W1–W9). Data are mean ± standard error (n = 5). Different lowercase letters indicate significant differ-ences (p < 0.05), as determined by Duncan’s multiple range test.
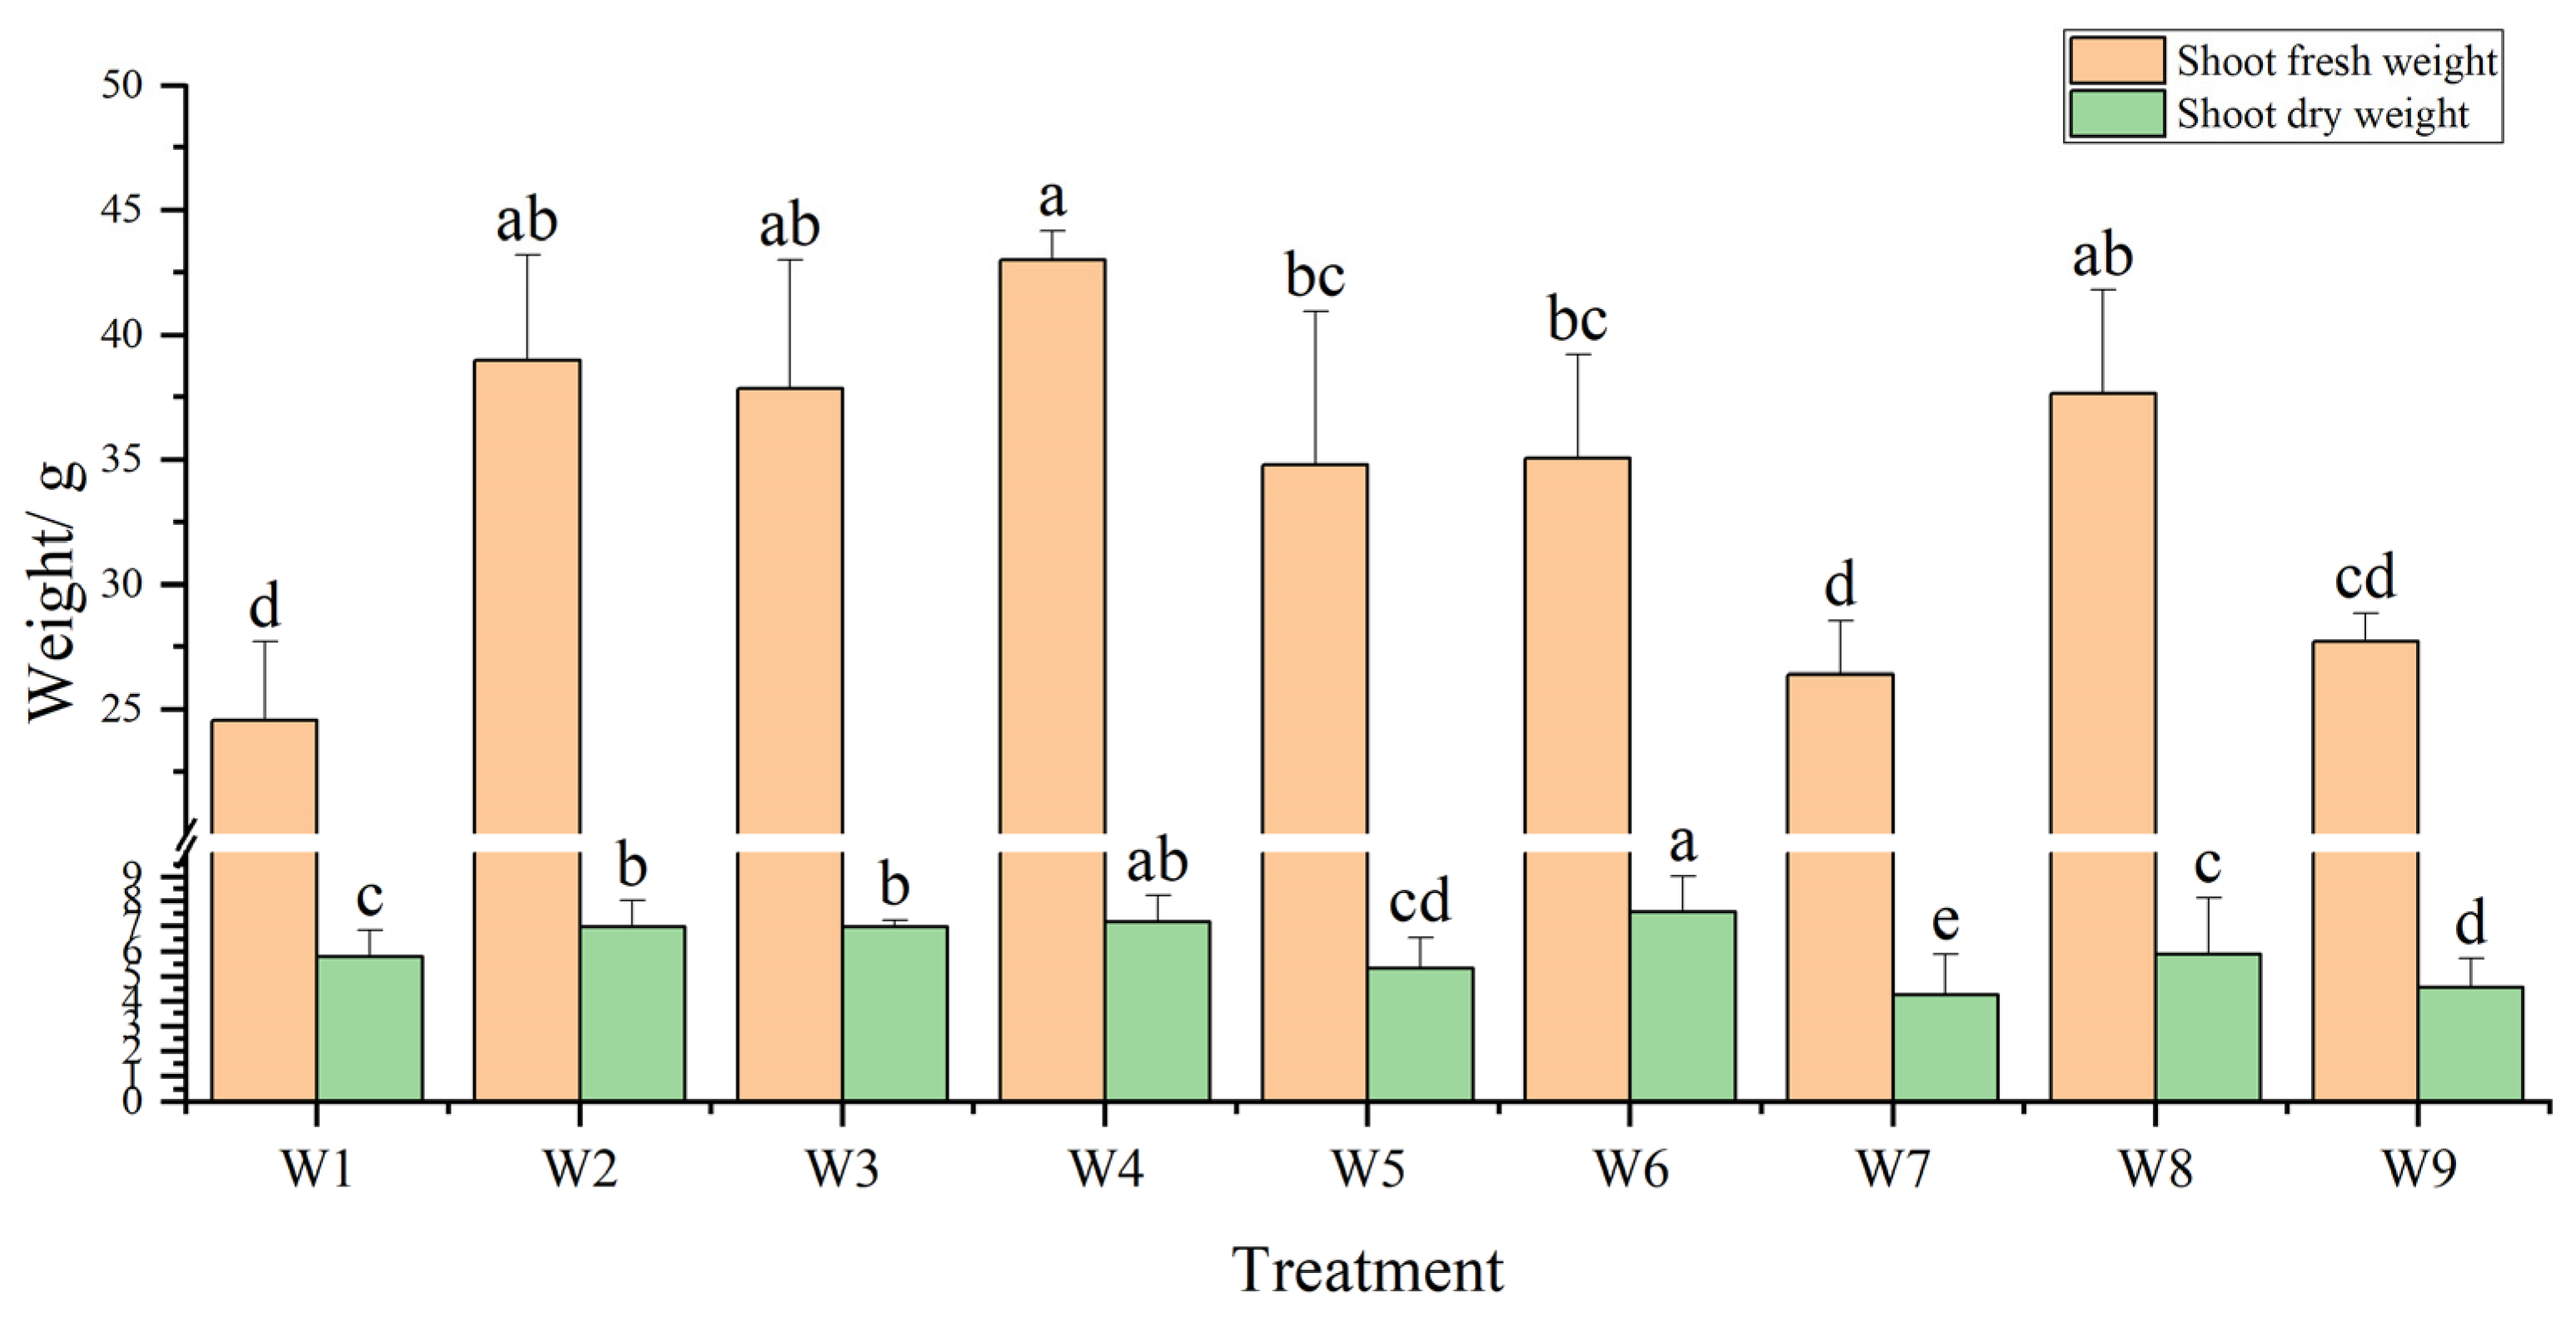
Figure 12.
Effect of substrate, water, and fertilizer on the biomass of potted chrysanthemums. The horizontal coordinate represents the 9 treatment groups (W1–W9). Data are mean ± standard error (n = 3). Different lowercase letters indicate significant differences (p < 0.05), as determined by Duncan’s multiple range test.
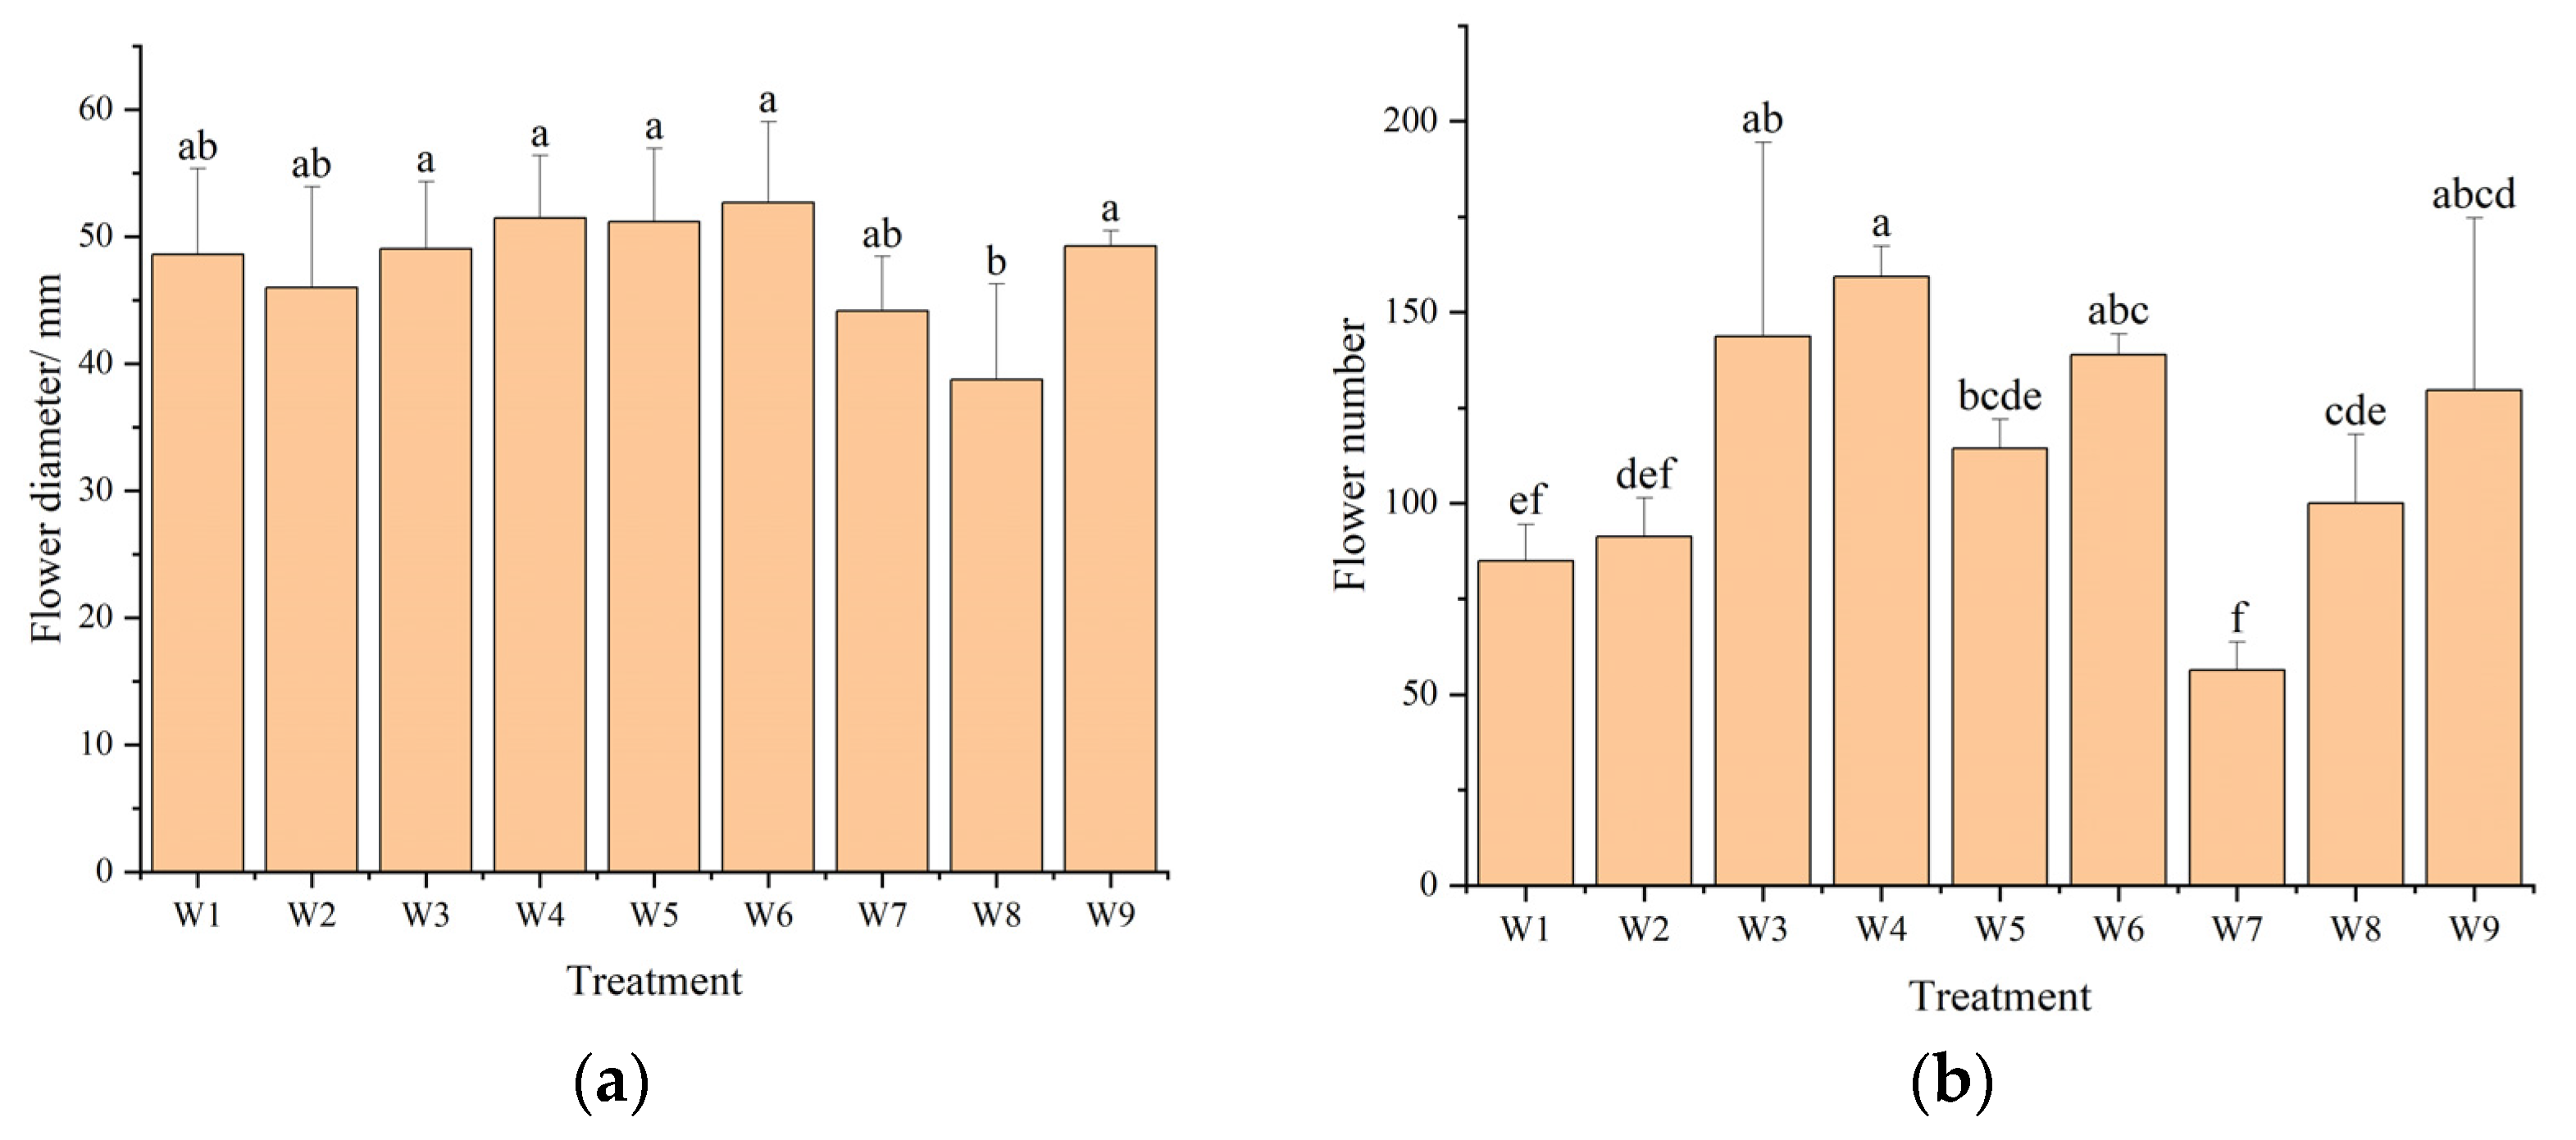
Figure 13.
Effect of substrate, water, and fertilizer on the flower diameter and number of potted chrysanthemums: (a) Flower diameter (mm); (b) Flower number. The horizontal coordinates repre-sent the 9 treatment groups (W1–W9). Data are mean ± standard error (n = 3). Different lowercase letters indicate significant differences (p < 0.05), as determined by Duncan’s multiple range test.
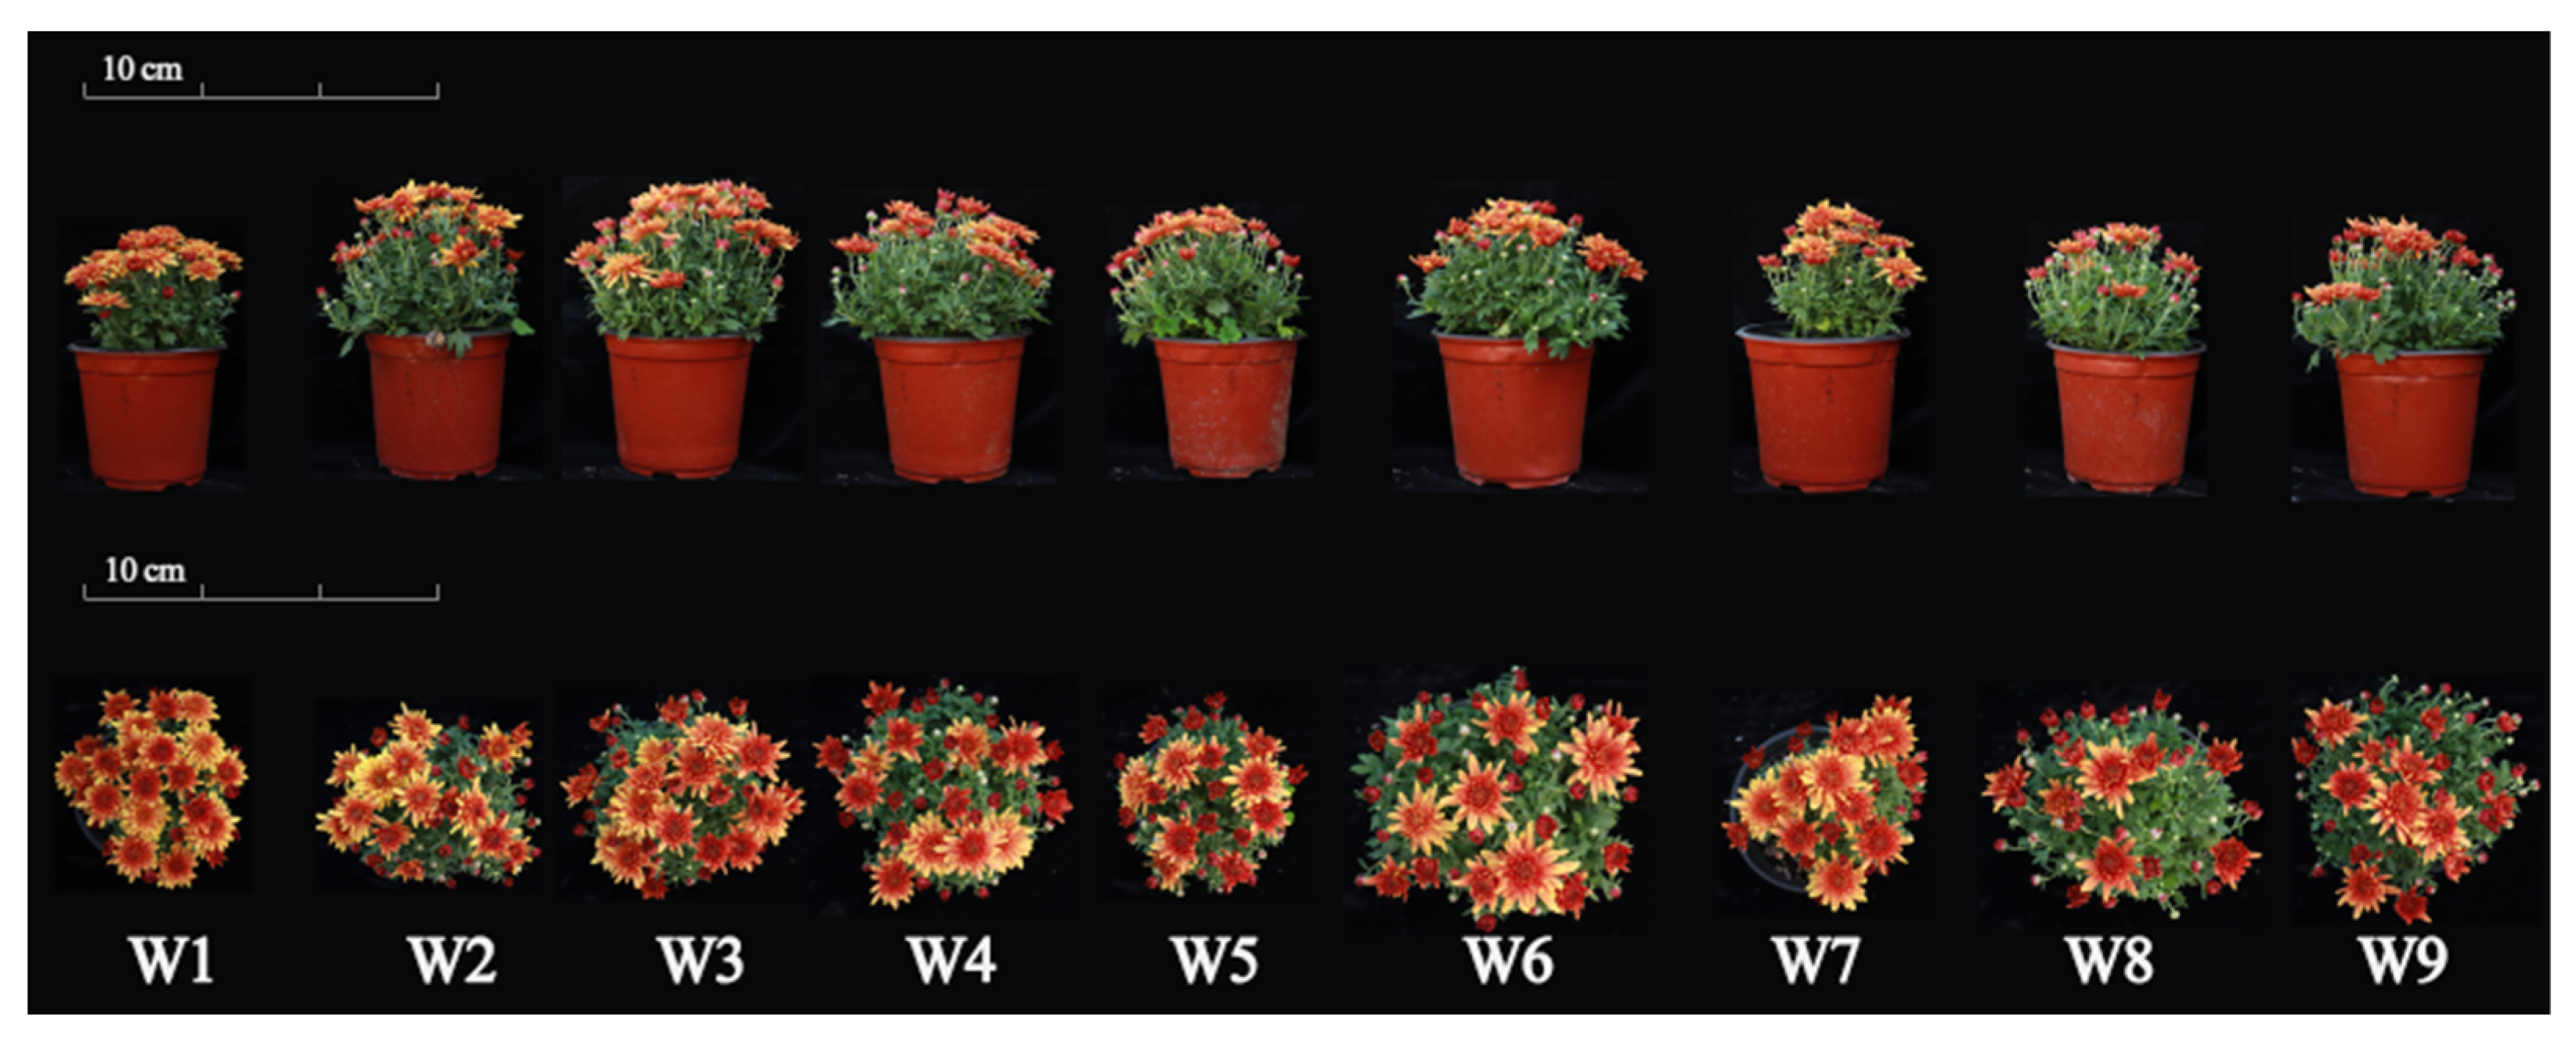
Figure 14.
Effect of substrate, water, and fertilizer on the flower quality and number of potted chrysanthemums.
Figure 14.
Effect of substrate, water, and fertilizer on the flower quality and number of potted chrysanthemums.
Figure 15.
Principal component analysis for substrate and water fertilization.
Figure 15.
Principal component analysis for substrate and water fertilization.
Table 1.
Cultivation experiment plan with different substrates.
Table 1.
Cultivation experiment plan with different substrates.
| Treatment | Component of Substrate (v/v) | The Proportion of Moss Peat (v/v%) |
|---|
| CK | Moss peat: Perlite: Pine Needle Soil = 6:2:2 | 60 |
| T1 | Peanut Shells: Moss peat: Perlite: Pine Needle Soil = 2:4:2:2 | 40 |
| T2 | Peanut Shells: Moss peat: Perlite: Pine Needle Soil = 4:2:2:2 | 20 |
| T3 | Peanut Shells: Perlite: Pine Needle Soil = 6:2:2 | 0 |
| T4 | Coir: Moss peat: Perlite: Pine Needle Soil = 2:4:2:2 | 40 |
| T5 | Coir: Moss peat: Perlite: Pine Needle Soil = 4:2:2:2 | 20 |
| T6 | Coir: Perlite: Pine Needle Soil = 6:2:2 | 0 |
| T7 | Bark: Moss peat: Perlite: Pine Needle Soil = 2:4:2:2 | 40 |
| T8 | Bark: Moss peat: Perlite: Pine Needle Soil = 4:2:2:2 | 20 |
| T9 | Bark: Perlite: Pine Needle Soil = 6:2:2 | 0 |
| T10 | Rice Husk: Moss peat: Perlite: Pine Needle Soil = 2:4:2:2 | 40 |
| T11 | Rice Husk: Moss peat: Perlite: Pine Needle Soil = 4:2:2:2 | 20 |
| T12 | Rice Husk: Perlite: Pine Needle Soil = 6:2:2 | 0 |
| T13 | Fungal Residue: Moss peat: Perlite: Pine Needle Soil = 2:4:2:2 | 40 |
| T14 | Fungal Residue: Moss peat: Perlite: Pine Needle Soil = 4:2:2:2 | 20 |
| T15 | Fungal Residue: Perlite: Pine Needle Soil = 6:2:2 | 0 |
| T16 | Recovered substrate (heap rot for one year) | 100 |
| T17 | Recovered substrate (heap rot for two years) | 100 |
Table 2.
Fertilization plan.
Table 2.
Fertilization plan.
| Treatment | N (mmol·L−1) | P (mmol·L−1) | K (mmol·L−1) |
|---|
| LR * | 3 | 1.5 | 3 |
| CK * | 0 | 0 | 0 |
| F1 | N1 (8) | P1 (1) | K1 (3.5) |
| F2 | N1 (8) | P2 (2) | K2 (7.0) |
| F3 | N1 (8) | P3 (3) | K3 (10.5) |
| F4 | N2 (16) | P1 (1) | K2 (7.0) |
| F5 | N2 (16) | P2 (2) | K3 (10.5) |
| F6 | N2 (16) | P3 (3) | K1 (3.5) |
| F7 | N3 (24) | P1 (1) | K3 (10.5) |
| F8 | N3 (24) | P2 (2) | K1 (3.5) |
| F9 | N3 (24) | P3 (3) | K2 (7.0) |
Table 3.
Substrate and water fertilizer combination test plan.
Table 3.
Substrate and water fertilizer combination test plan.
| Treatment | Water Capacity | Fertilizer Concentration | Substrate (v/v) |
|---|
| X1 | 40% | 0.5 | Coir: Perlite: Pine Needle Soil = 6:2:2 |
| X2 | 40% | 1.0 | Moss peat: Perlite: Pine Needle Soil = 6:2:2 |
| X3 | 40% | 1.5 | Coir: Moss peat: Perlite: Pine Needle Soil
= 2:4:2:2 |
| X4 | 60% | 0.5 | Moss peat: Perlite: Pine Needle Soil =6:2:2 |
| X5 | 60% | 1.0 | Coir: Moss peat: Perlite: Pine Needle Soil
= 2:4:2:2 |
| X6 | 60% | 1.5 | Coir: Perlite: Pine Needle Soil = 6:2:2 |
| X7 | 80% | 0.5 | Coir: Moss peat: Perlite: Pine Needle Soil
= 2:4:2:2 |
| X8 | 80% | 1.0 | Coir: Perlite: Pine Needle Soil = 6:2:2 |
| X9 | 80% | 1.5 | Moss peat: Perlite: Pine Needle Soil = 6:2:2 |
Table 4.
Physicochemical properties of different substrates.
Table 4.
Physicochemical properties of different substrates.
| Treatment | Bulk Density (g/cm3) | Total Porosity(%) | EC(mS/cm) | pH | Total N
(g/100 g) | Total P
(g/100 g) | Total K
(g/kg) |
|---|
| CK | 0.25 | 70.3 | 0.45 | 7.11 | 1.84 | 0.19 | 11.28 |
| T1 | 0.24 | 73.2 | 0.74 | 7.68 | 1.79 | 0.24 | 11.88 |
| T2 | 0.22 | 77.6 | 0.94 | 7.76 | 1.53 | 0.20 | 7.95 |
| T3 | 0.18 | 81.4 | 1.04 | 7.85 | 1.52 | 0.50 | 20.18 |
| T4 | 0.21 | 77.4 | 0.51 | 7.21 | 1.39 | 0.14 | 13.70 |
| T5 | 0.18 | 79.1 | 0.65 | 7.35 | 1.33 | 0.21 | 14.83 |
| T6 | 0.15 | 82.6 | 1.21 | 7.68 | 0.72 | 0.17 | 20.46 |
| T7 | 0.26 | 68.9 | 0.52 | 7.27 | 1.26 | 0.15 | 11.88 |
| T8 | 0.29 | 65.3 | 0.71 | 7.33 | 0.96 | 0.13 | 10.79 |
| T9 | 0.43 | 60.7 | 0.97 | 7.57 | 0.76 | 0.16 | 8.02 |
| T10 | 0.27 | 53.7 | 0.76 | 6.73 | 1.69 | 0.48 | 16.82 |
| T11 | 0.35 | 64.9 | 1.21 | 6.81 | 1.64 | 0.46 | 17.71 |
| T12 | 0.52 | 60.3 | 1.42 | 6.85 | 1.39 | 0.56 | 16.55 |
| T13 | 0.38 | 61.3 | 0.93 | 7.39 | 1.31 | 0.33 | 14.53 |
| T14 | 0.43 | 66.7 | 1.14 | 7.42 | 1.12 | 0.28 | 13.28 |
| T15 | 0.63 | 70.4 | 1.52 | 7.53 | 1.00 | 0.48 | 16.39 |
| T16 | 0.72 | 40.1 | 0.37 | 7.71 | / | / | / |
| T17 | 0.78 | 48.3 | 0.21 | 8.12 | / | / | / |
Table 5.
Effects of substitute substrates on the height and crown diameter of potted chrysanthemum.
Table 5.
Effects of substitute substrates on the height and crown diameter of potted chrysanthemum.
| No. | Height (cm) | Crown Diameter (cm) |
|---|
| 20 d | 40 d | 60 d | 80 d | 20 d | 40 d | 60 d | 80 d |
|---|
| CK | 4.8 ± 1.0 bcdef * | 9.4 ± 0.8 abc | 12.9 ± 1.1 abc | 16.5 ± 1.0 cd | 7.0 ± 1.1 ab | 17.9 ± 1.9 a | 24.7 ± 1.9 a | 26.5 ± 1.3 abc |
| T1 | 5.6 ± 0.5 abc | 9.6 ± 1.5 abc | 13.0 ± 0.8 abc | 15.9 ± 0.8 cde | 5.7 ± 1.0 cdefghi | 16.3 ± 1.1 abc | 22.2 ± 0.9 bc | 27.5 ± 1.5 a |
| T2 | 5.2 ± 0.9 abcde | 9.7 ± 0.5 abc | 11.7 ± 1.1 cde | 14.3 ± 0.3 g | 4.7 ± 0.5 ij | 14.9 ± 1.1 cde | 21.0 ± 0.5 cd | 22.8 ± 0.3 d |
| T3 | 4.4 ± 0.3 ef | 8.5 ± 0.1 cd | 10.8 ± 1.2 ef | 13.3 ± 0.3 h | 5.3 ± 0.9 abcde | 10.9 ± 1.3 gh | 17.0 ± 0.6 f | 17.8 ± 0.8 fg |
| T4 | 5.7 ± 0.4 ab | 10.5 ± 1.8 a | 14.2 ± 1.1 a | 18.9 ± 0.7 a | 6.5 ± 0.5 abcdef | 14.8 ± 1.8 cde | 20.9 ± 1.1 cd | 27.7 ± 0.9 a |
| T5 | 5.7 ± 0.9 abc | 9.7 ± 1.2 abc | 12.1 ± 0.7 bcde | 15.3 ± 1.1 efg | 6.6 ± 0.4 abcde | 15.6 ± 1.0 bcd | 23.0 ± 0.5 ab | 25.1 ± 1.1 c |
| T6 | 4.7 ± 0.4 cdef | 8.3 ± 0.4 cd | 9.7 ± 0.8 f | 11.3 ± 1.4 j | 5.1 ± 0.2 hij | 12.5 ± 0.7 fg | 15.2 ± 0.8 g | 17.8 ± 0.8 fg |
| T7 | 4.9 ± 0.8 abcdef | 8.9 ± 0.3 bcd | 12.2 ± 1.2 bcde | 15.3 ± 0.4 efg | 6.3 ± 0.6 abcdefg | 16.0 ± 1.3 abcd | 19.8 ± 2.9 de | 25.1 ± 0.8 c |
| T8 | 5.5 ± 0.6 abcd | 10.5 ± 0.6 a | 12.6 ± 0.3 bc | 16.7 ± 0.3 bc | 6.8 ± 0.9 abc | 16.4 ± 1.1 abc | 21.7 ± 1.9 bc | 26.8 ± 0.8 ab |
| T9 | 5.9 ± 0.4 a | 9.4 ± 1.0 abc | 12.8 ± 1.7 abc | 15.0 ± 0.4 efg | 5.8 ± 0.3 cdefgh | 17.3 ± 0.8 ab | 20.8 ± 0.7 cd | 22.5 ± 1.3 d |
| T10 | 5.4 ± 0.5 abcd | 9.1 ± 0.6 bcd | 12.8 ± 1.2 abc | 17.5 ± 0.5 b | 6.7 ± 0.4 abcd | 17.7 ± 1.0 ab | 20.6 ± 1.0 cd | 26.0 ± 0.5 bc |
| T11 | 5.8 ± 1.0 ab | 10.1 ± 0.9 ab | 12.3 ± 0.3 bcd | 16.3 ± 0.6 cd | 7.4 ± 1.4 a | 16.4 ± 1.2 abc | 20.9 ± 0.6 cd | 25.3 ± 0.6 c |
| T12 | 4.5 ± 0.2 def | 7.9 ± 0.4 de | 11.6 ± 0.7 cde | 15.0 ± 0.3 efg | 5.4 ± 0.5 fghi | 12.9 ± 1.0 efg | 17.3 ± 0.3 f | 19.5 ± 0.9 e |
| T13 | 5.4 ± 0.5 abcd | 9.0 ± 1.0 bcd | 13.5 ± 0.6 ab | 15.7 ± 0.4 def | 6.2 ± 0.1 abcdefgh | 15.9 ± 0.7 abcd | 21.0 ± 1.2 cd | 22.3 ± 1.3 d |
| T14 | 2.9 ± 0.2 g | 7.8 ± 0.4 de | 11.1 ± 1.4 def | 14.8 ± 0.2 fg | 4.1 ± 0.4 j | 14.2 ± 2.0 cdef | 18.4 ± 1.1 ef | 22.2 ± 0.3 d |
| T15 | 4.1 ± 1.0 f | 8.0 ± 0.4 de | 10.9 ± 0.7 def | 15.0 ± 0.2 efg | 5.6 ± 0.7 defghi | 14.0 ± 0.8 def | 18.2 ± 0.7 ef | 18.2 ± 1.1 ef |
| T16 | 4.2 ± 0.4 ef | 6.9 ± 0.7 e | 8.0 ± 0.5 g | 12.7 ± 0.6 hi | 6.0 ± 0.5 bcdefgh | 10.1 ± 0.8 h | 12.3 ± 0.6 h | 19.0 ± 0.9 ef |
| T17 | 4.4 ± 0.1 def | 5.0 ± 0.6 f | 7.4 ± 0.1 g | 12.0 ± 1.0 ig | 5.5 ± 0.6 efghi | 7.6 ± 1.0 i | 10.0 ± 1.1 i | 16.7 ± 1.5 g |
Table 6.
Final score formula for the three principal components of substitute substrates.
Table 6.
Final score formula for the three principal components of substitute substrates.
| Principal Component | Score Formula |
|---|
| 1 | |
| 2 | |
| 3 | |
Table 7.
Comprehensive evaluation of substitute substrates.
Table 7.
Comprehensive evaluation of substitute substrates.
| No. | F 1 | F 2 | F 3 | F | Rank |
|---|
| CK | 0.428 | 0.107 | −1.004 | 0.228 | 7 |
| T1 | 0.623 | 0.616 | 0.622 | 0.621 | 3 |
| T2 | 0.290 | 1.355 | −0.547 | 0.587 | 4 |
| T3 | −0.934 | −0.348 | −0.225 | −0.694 | 16 |
| T4 | 1.094 | 1.870 | −0.164 | 1.269 | 1 |
| T5 | 1.364 | 0.949 | 0.923 | 1.198 | 2 |
| T6 | −2.055 | 1.995 | −0.416 | −0.608 | 15 |
| T7 | 0.532 | −0.599 | 1.506 | 0.222 | 8 |
| T8 | 0.422 | 0.078 | 0.227 | 0.295 | 6 |
| T9 | −0.319 | −1.290 | 0.462 | −0.589 | 14 |
| T10 | 0.739 | −1.091 | 1.178 | 0.163 | 9 |
| T11 | 0.352 | −0.401 | −0.070 | 0.075 | 10 |
| T12 | 0.203 | −1.045 | −2.621 | −0.395 | 12 |
| T13 | 0.684 | 0.050 | −0.285 | 0.411 | 5 |
| T14 | 0.271 | −0.861 | −0.392 | −0.146 | 11 |
| T15 | −0.175 | −0.937 | −0.999 | −0.481 | 13 |
| T16 | −1.479 | −0.424 | 1.424 | −0.940 | 17 |
| T17 | −2.038 | −0.026 | 0.381 | −1.214 | 18 |
Table 8.
Effects of nitrogen, phosphorus, and potassium ratios on the growth indices of potted chrysanthemum.
Table 8.
Effects of nitrogen, phosphorus, and potassium ratios on the growth indices of potted chrysanthemum.
| No. | Height (cm) | Crown Diameter (cm) | Stem Diameter (mm) |
|---|
| 20 d | 40 d | 60 d | 80 d | 20 d | 40 d | 60 d | 80 d | 20 d | 40 d | 60 d | 80 d |
|---|
| LR * | 8.5 ± 0.2 a * | 12.8 ± 0.3 a | 14.3 ± 0.56 a | 20.5 ± 1.6 a | 13.7 ± 0.7 ab | 16.0 ± 2.3 a | 20.0 ± 0.9 a | 22.8 ± 0.2 a | 4.9 ± 0.2 a | 5.1 ± 0.2 a | 5.3 ± 0.8 a | 5.9 ± 0.7 bcd |
| CK | 8.5 ± 0.9 a | 12.2 ± 0.4 a | 12.4 ± 0.6 bc | 14.0 ± 0.4 e | 15.7 ± 0.6 a | 15.3 ± 1.2 ab | 16.4 ± 1.5 bc | 15.4 ± 1.0 e | 4.1 ± 0.1 b | 4.3 ± 0.4 b | 4.6 ± 0.5 ab | 5.0 ± 0.7 d |
| F1 | 8.8 ± 0.7 a | 11.8 ± 0.4 b | 12.4 ± 0.6 b | 14.5 ± 0.3 e | 11.1 ± 1.0 c | 14.0 ± 0.8 ab | 15.8 ± 0.6 bc | 17.1 ± 0.8 d | 3.0 ± 0.3 c | 3.4 ± 0.4 c | 4.0 ± 0.5 bc | 5.9 ± 1.1 bcd |
| F2 | 7.9 ± 0.6 b | 12.5 ± 1.4 a | 13.3 ± 0.5 ab | 15.8 ± 0.6 bcd | 10.5 ± 1.8 c | 11.8 ± 1.5 b | 15.8 ± 1.2 bc | 19.5 ± 0.3 bc | 3.6 ± 0.1 b | 3.8 ± 0.3 c | 4.2 ± 0.9 bc | 4.9 ± 0.5 d |
| F3 | 8.3 ± 0.9 ab | 13.7 ± 0.7 a | 13.3 ± 0.4 ab | 17.3 ± 0.5 b | 11.9 ± 0.5 bc | 14.3 ± 0.8 ab | 16.4 ± 0.6 bc | 20.0 ± 0.3 b | 4.0 ± 0.1 b | 4.3 ± 0.3 bc | 4.0 ± 0.3 abc | 6.6 ± 0.9 abcd |
| F4 | 8.0 ± 0.6 b | 11.9 ± 0.4 ab | 13.3 ± 0.6 ab | 16.6 ± 0.2 bc | 11.6 ± 0.8 bc | 14.0 ± 0.7 ab | 15.9 ± 0.4 bc | 18.5 ± 0.3 cd | 3.9 ± 0.1 b | 4.3 ± 0.4 bc | 4.6 ± 0.6 abc | 6.6 ± 0.4 abcd |
| F5 | 8.6 ± 0.5 a | 13.0 ± 0.5 a | 12.9 ± 0.2 abc | 15.6 ± 0.2 bcd | 12.7 ± 1.0 b | 16.1 ± 1.5 a | 17.1 ± 1.1 bc | 18.9 ± 0.2 c | 3.0 ± 0.1 c | 3.4 ± 0.4 c | 3.7 ± 0.3 c | 5.7 ± 0.4 bcd |
| F6 | 8.5 ± 1.1 a | 12.5 ± 0.8 a | 13.6 ± 0.7 ab | 17.3 ± 0.4 b | 11.8 ± 1.0 bc | 14.1 ± 1.0 ab | 17.0 ± 0.4 bc | 19.6 ± 0.6 bc | 3.9 ± 0.2 b | 4.4 ± 0.3 b | 4.5 ± 0.9 abc | 5.4 ± 0.9 cd |
| F7 | 8.4 ± 1.1 a | 12.5 ± 0.7 a | 12.4 ± 0.7 bc | 15.8 ± 0.5 c | 11.5 ± 1.0 bc | 13.6 ± 0.9 ab | 16.5 ± 0.9 bc | 18.3 ± 0.6 cd | 4.0 ± 0.1 b | 4.4 ± 0.4 b | 4.7 ± 1.4 ab | 6.0 ± 0.3 bcd |
| F8 | 8.6 ± 0.6 a | 12.5 ± 0.4 a | 12.3 ± 0.3 bc | 14.6 ± 0.2 d | 11.2 ± 0.4 c | 13.6 ± 1.0 ab | 14.5 ± 0.3 c | 17.8 ± 0.3 d | 3.8 ± 0.1 b | 4.1 ± 0.4 bc | 4.2 ± 0.8 bc | 5.6 ± 0.5 cd |
| F9 | 8.0 ± 0.9 ab | 13.2 ± 0.6 a | 11.5 ± 0.2 c | 16.8 ± 0.6 bc | 11.9 ± 0.9 bc | 17.1 ± 1.5 a | 17.9 ± 1.4 ab | 21.6 ± 0.6 a | 3.7 ± 0.1 b | 4.3 ± 0.4 b | 4.2 ± 0.7 bc | 7.1 ± 1.0 a |
Table 9.
Final score formula for the three principal components of nitrogen, phosphorus, and po-tassium fertilizer rationing.
Table 9.
Final score formula for the three principal components of nitrogen, phosphorus, and po-tassium fertilizer rationing.
| Principal Component | Score Formula |
|---|
| 1 | |
| 2 | |
| 3 | |
| 4 | |
Table 10.
Comprehensive evaluation of nitrogen, phosphorus, and potassium fertilizer rationing.
Table 10.
Comprehensive evaluation of nitrogen, phosphorus, and potassium fertilizer rationing.
| No. | F 1 | F 2 | F 3 | F 4 | F | Rank |
|---|
| LR | 0.79608 | 1.17602 | −2.23594 | 0.36924 | 0.721133 | 2 |
| CK | −2.62065 | −0.11042 | −0.49501 | 0.96326 | 0.188883 | 11 |
| X1 | −0.50485 | −0.77516 | 0.30873 | 0.17846 | 0.476229 | 10 |
| X2 | −0.05415 | −0.46167 | −0.81387 | −1.38358 | 0.492573 | 9 |
| X3 | −0.10074 | 1.36793 | 0.39266 | −0.29265 | 0.679201 | 4 |
| X4 | −0.22755 | 1.82108 | 1.36269 | −0.62273 | 0.719399 | 3 |
| X5 | 0.51626 | −0.83428 | 0.78928 | −0.55996 | 0.628747 | 6 |
| X6 | 0.55854 | −0.62173 | −0.6976 | −0.7094 | 0.593011 | 7 |
| X7 | 0.39555 | −0.20306 | 0.77807 | −0.22384 | 0.660954 | 5 |
| X8 | 0.04062 | −1.2068 | 0.09926 | −0.09379 | 0.515717 | 8 |
| X9 | 1.20088 | −0.15191 | 0.51173 | 2.37498 | 0.832422 | 1 |
Table 11.
Effects of substrate, water, and fertilizer on the growth indices of potted chrysanthemum.
Table 11.
Effects of substrate, water, and fertilizer on the growth indices of potted chrysanthemum.
| No. | Height (cm) | Crown Diameter (cm) | Stem Diameter (mm) |
|---|
| 20 d | 40 d | 60 d | 80 d | 20 d | 40 d | 60 d | 80 d | 20 d | 40 d | 60 d | 80 d |
|---|
| W1 | 7.3 ± 0.5 a * | 10.4 ± 1.6 ab | 10.5 ± 1.5 ab | 17.3 ± 0.3 a | 8.3 ± 0.6 ab | 9.4 ± 2.1 b | 11.2 ± 0.4 b | 18.1 ± 1.4 abc | 3.9 ± 0.1 ab | 5.1 ± 0.1 b | 5.4 ± 0.2 ab | 5.5 ± 1.2 abc |
| W2 | 5.6 ± 1.0 bc | 10.2 ± 0.9 ab | 10.8 ± 2.0 ab | 14.7 ± 2.1 ab | 7.4 ± 0.7 abc | 10.3 ± 2.0 ab | 12.8 ± 2.5 ab | 18.4 ± 2.8 abc | 4.0 ± 0.2 a | 5.1 ± 0.2 a | 5.2 ± 1.0 abc | 6.1 ± 0.8 a |
| W3 | 6.9 ± 0.8 ab | 11.5 ± 1.6 a | 11.6 ± 0.9 ab | 16.0 ± 1.6 ab | 7.3 ± 0.4 bc | 10.2 ± 1.2 ab | 13.8 ± 0.5 ab | 18.5 ± 1.4 abc | 4.0 ± 0.1 a | 4.5 ± 0.1 c | 4.7 ± 0.2 cd | 5.0 ± 0.4 abc |
| W4 | 5.4 ± 0.2 bc | 10.8 ± 1.2 ab | 10.4 ± 1.3 ab | 15.7 ± 1.8 ab | 7.2 ± 1.3 bc | 11.9 ± 1.5 a | 15.1 ± 1.4 a | 19.3 ± 1.2 ab | 3.9 ± 0.1 ab | 5.4 ± 0.2 a | 5.8 ± 0.2 a | 5.8 ± 0.4 ab |
| W5 | 7.3 ± 0.8 a | 12.1 ± 2.6 a | 11.9 ± 2.0 a | 17.0 ± 1.1 a | 7.6 ± 1.2 abc | 11.7 ± 1.0 ab | 13.2 ± 0.6 ab | 18.1 ± 0.7 abc | 3.9 ± 0.2 ab | 4.5 ± 0.2 c | 4.7 ± 0.1 bcd | 5.1 ± 0.4 abc |
| W6 | 5.4 ± 1.0 bc | 10.3 ± 1.0 ab | 10.3 ± 0.3 ab | 16.2 ± 1.0 ab | 9.1 ± 1.5 a | 12.3 ± 0.2 a | 15.3 ± 2.1 a | 21.2 ± 1.1 a | 4.0 ± 0.2 ab | 5.1 ± 0.2 b | 5.3 ± 0.2 ab | 5.5 ± 0.5 abc |
| W7 | 6.4 ± 1.0 ab | 11.0 ± 0.9 ab | 10.7 ± 0.3 ab | 14.6 ± 1.3 ab | 7.1 ± 0.7 bc | 10.5 ± 0.2 ab | 11.2 ± 1.0 b | 15.2 ± 0.1 c | 3.7 ± 0.2 b | 3.7 ± 0.2 d | 4.1 ± 0.4 d | 4.3 ± 0.5 c |
| W8 | 5.8 ± 0.8 abc | 10.8 ± 1.0 ab | 9.8 ± 1.5 ab | 15.2 ± 1.0 ab | 7.8 ± 0.3 abc | 10.5 ± 0.7 ab | 12.9 ± 0.4 ab | 18.1 ± 1.4 abc | 3.9 ± 0.2 ab | 4.6 ± 0.1 c | 4.7 ± 0.2 bcd | 5.1 ± 0.8 abc |
| W9 | 4.4 ± 1.7 c | 8.5 ± 2.7 b | 9.1 ± 2.4 b | 13.5 ± 4.2 b | 6.2 ± 1.7 c | 9.3 ± 2.5 b | 11.2 ± 4.1 b | 17.8 ± 4.0 bc | 3.8 ± 0.2 ab | 3.9 ± 0.2 d | 4.1 ± 0.1 d | 4.7 ± 1.2 bc |
Table 12.
Final score formula for the four principal components of substrate and water fertiliza-tion.
Table 12.
Final score formula for the four principal components of substrate and water fertiliza-tion.
| Principal Component | Score Formula |
|---|
| 1 | |
| 2 | |
| 3 | |
| 4 | |
Table 13.
Comprehensive evaluation of substrate and water fertilization.
Table 13.
Comprehensive evaluation of substrate and water fertilization.
| No. | F 1 | F 2 | F 3 | F 4 | F | Rank |
|---|
| W1 | −0.26155 | 0.70391 | 0.45811 | 1.75321 | 0.613235 | 4 |
| W2 | 0.08254 | −0.43436 | 1.17124 | −1.00389 | 0.530772 | 6 |
| W3 | 0.19618 | 0.20796 | 1.15125 | −0.01159 | 0.621736 | 3 |
| W4 | 1.14453 | −0.37846 | 0.42559 | −0.52124 | 0.657696 | 2 |
| W5 | −0.15548 | 0.28797 | 0.71599 | 0.65183 | 0.576752 | 5 |
| W6 | 1.70391 | 0.04471 | −1.6102 | 0.66549 | 0.688633 | 1 |
| W7 | −1.79657 | −0.40817 | −0.82109 | 0.47642 | 0.209011 | 9 |
| W8 | −0.41279 | −1.86618 | −0.64326 | −0.48966 | 0.287113 | 8 |
| W9 | −0.50078 | 1.84261 | −0.84763 | −1.52057 | 0.455252 | 7 |

 ,
, 


