Article

Physicochemical Marker for Determination of Value-Adding Component in Over-Ripe Thai Mango Peels

1
Plant Bioactive Compound Laboratory (BAC Lab), Faculty of Agriculture, Chiang Mai University, Chiang Mai 50200, Thailand
2
Department of Plant and Soil Sciences, Faculty of Agriculture, Chiang Mai University, Chiang Mai 50200, Thailand
3
Center of Excellence in Agro Bio-Circular-Green Industry (Agro BCG), Faculty of Agro-Industry, Chiang Mai University, Chiang Mai 50100, Thailand
4
Faculty of Agro-Industry, Chiang Mai University, Chiang Mai 50100, Thailand
5
Department of Pharmaceutical Sciences, Faculty of Pharmacy, Chiang Mai University, Chiang Mai 50200, Thailand
6
College of Animal Science & Technology, Nanjing Agricultural University, Nanjing 210095, China
7
Department of Horticulture, National Ilan University, Yilan City 260, Taiwan
8
School of Natural and Environmental Sciences, Newcastle University, Newcastle upon Tyne NE1 7RU, UK
9
Multidisciplinary Research Institute, Chiang Mai University, Chiang Mai 50200, Thailand
*
Authors to whom correspondence should be addressed.
Horticulturae 2024, 10(10), 1036; https://doi.org/10.3390/horticulturae10101036
Submission received: 29 July 2024 / Revised: 19 September 2024 / Accepted: 24 September 2024 / Published: 29 September 2024

Abstract

:
Thailand is a prominent global producer of mangoes, providing a wide range of mango cultivars and dealing with the challenge of managing biomass. Thus, biorefining mango peel to extract valuable components has the potential to reduce organic waste and create a new revenue source for the mango processing sector. This study aims to examine the physiology, physiochemical, and chemical characteristics in peel of nine Thai mango cultivars, along with the relationship between their characteristics. The Thai mango cultivars Mahachanok, Chok anan, and Rad exhibited a yellow appearance, while the other six cultivars appeared yellow-green. However, the firmness of the fruit was directly correlated with the firmness of the pulp. A proximate composition study revealed that the predominant constituent of mango peel was carbohydrates, comprising up to 75% of its composition. This was followed by fibre, which accounted for up to 13%. The Nga mango had the highest levels of total phenolic content (220 mgGAE/g) and total flavonoid content (5.5 mgCE/g). The primary phenolic acids identified in Thai mango peel were epicatechin, caffeic acid, catechin, and gallic acid. The Mahachanok cultivar exhibited the highest antioxidant activity, as determined by the ABTS and DPPH assays, with values of 85.67% and 85.78%, respectively. This study demonstrated the connections between the physiochemical characteristics of mangoes and their chemical compositions in different cultivars, indicating the possibility of choosing particular cultivars for extracting targeted bioactive compounds. The multivariate analyses revealed that there was no correlation between the physiochemical and chemical profiles of mangoes. This study highlights the significance of mango peel as a valuable by-product that has significant environmental and economic ramifications for the mango processing industry.

1. Introduction

Mango is a globally significant fruit crop produced in tropical and subtropical areas, most notably China, Thailand, Indonesia and the Philippines [1,2]. As a climacteric fruit, it can be ripened after harvest due to the significant increase in respiration and ethylene production that occurs after detachment [3]. Mango fruit is recognised for its unique flavour, sweet delicious taste, and rich nutritional content, although the chemical components of its pulp vary based on factors including geographical production area, cultivar, and level of maturity [4]. Thailand is one of the world’s major producers of mangoes, producing more than 1.25 million tonnes annually. The recognised cultivars grown here include Kaew, Ok Rong, Chok Anan, and Nam Dokmai [5], which is either consumed fresh (either green and ripe) or harvested for processing [6,7]. While processing helps overcome the challenges of short shelf life and seasonal limitations of fresh fruit [6,7]. Large quantities of seed and peel are produced as by-products, which account for up to 60% of fruit weight [8]. Typically, these by-products are considered waste and are often used as animal feed or discarded into the environment to avoid the high cost of disposal [9,10].
Despite being considered a waste product, mango peel contains nutrients and nutraceutical compounds that can be used as natural sources of pharmaceutical products as well as for food and feed additives [11]. The peel contains both dietary fibre and various bioactive compounds, including polyphenols, carotenoids, flavonoids, anthocyanins, and vitamins [12,13,14]. The dietary fibre, particularly pectin, ranges from 7 to 30% depending on the cultivar and maturity stage of the fruit. Furthermore, the levels of phenolic acids and flavonoids in the peel are greater than those found in mango pulp, with gallic acid, syringic acid, mangiferin and quercetin being the primary components observed [15,16]. Various factors can affect the chemical composition of the peel, including cultivar and ripeness, which can be characterised by their physiological and physical attributes [17,18]. Nonetheless, to date, no studies have been conducted on the correlation between the physiological and physicochemical characteristics of fruits and the phytochemical characteristics of mango peel. With the above in mind, the primary aim of the current study is to evaluate the physiological, physiochemical, and chemical characteristics of different mango cultivars, and to investigate correlations between these characteristics. To achieve this aim, this work seeks to provide predictive criteria for selecting materials for extracting bioactive components from mango peel.

2. Materials and Methods

2.1. Mango Samples

Nine replicate fruits of each of nine Thai mango cultivars, including Mam Kam Dang (MA), Rad (RD), Nga (NG), Kam (KO), Morrakot (MR), Chok Anan (CH), Maha Chanok (MH), Ok Rong (AK) and Talab Nak (TL), Mangoes were acquired from a local market in Chiang Mai, Thailand, at a commercial ripening stage, thereafter washed, and allowed to overripen for 2–10 days at 28 ± 5 °C until their appearance exhibited wrinkled skin with brown or black spots on the surface [19].
The length (L) and width (W) of each mango were then measured using a digital vernier caliper with an accuracy of 0.01 mm, as described by Wongkaew, Tinpovong [9]. Mango firmness was measured using a penetrometer (FHR-5, N.O.W., Tokyo, Japan) equipped with a pointed cone probe (base diameter: 12 mm, height: 10 mm), and data were expressed in newtons (N) from three positions along the equatorial axis of both peeled and unpeeled fruit [20].
Over-ripe mangoes were peeled, cut into small pieces, and then washed with tap water. The pieces were blanched in hot water at 95 °C for 1 min, drained, and left to cool to room temperature. Afterwards, they were dried in a hot-air oven (Drawell, Chongqing, China) at 60 ± 1 °C for 48 h. The dried mango peels were finely ground using a high-speed food processor and passed through a sieve (0.6 mm); mango powder was stored at −4 °C until further analysis [21,22].

2.2. Proximate Analysis

Proximate analysis of mango peel began by determining the moisture content by drying mango peels at 105 °C for 6 h in a hot-air oven (Memmert oven ULE500, Memmert, West Gerna, Germany) and calculating the weight loss percentage. After drying, crude protein, ash, crude fat, and crude fibre were analysed using the methodology presented by the Association of Official Analytical Chemists [21,23]. The total carbohydrate content, according to Ihekoronye and Ngoddy [24], was determined using the following equation:
%Carbohydrate = 100 − (%Moisture content + %Crude protein + %Crude Ash + %Crude fibre)

2.3. Physiolchemical Properties of the Peels

2.3.1. Colour Measurement

Colour measurement was performed three times at different positions on the intact fruit peel using a portable colour spectrophotometer (NS800, 3nh, Guangzhou, China). The evaluation was conducted using the CIELAB colour space, where L* represents lightness, a* represents red or green, and b* represents yellow or blue [21]. The mango peel was then cut into pieces, washed, and immediately boiled in hot water to prevent browning or oxidation. The material was drained, cooled, and subsequently dried at 60 °C in a hot-air oven until the moisture content reached 4–6%. The dehydrated peel was ground into a fine powder using a high-speed food processor and sifted using a 0.6 mm diameter sieve [21].

2.3.2. pH

The mango peel powder (10 g) was blended with 10 mL of distilled water and then filtered through filter paper (Whatman No. 1). The pH of the supernatant was measured using a pH metre (Mettler-Toledo, Greifensee, Switzerland).

2.3.3. Near-Infrared Spectra (NIR)

The near-infrared (NIR) spectra of the mango peel powder were measured using an FT-NIR spectrometer (BRUKER OPTIK GmbH, Baden-Württemberg, Germany) with a fibre optic probe used for the scanning process [20]. The data were collected over a 4000 to 12,500 cm− 1 (800 to 2500 nm) wavelength range with a resolution of 16 cm−1, and the spectrometer conducted a total of 64 scans per sample. Background measurements were conducted for calibration using the FT-NIR spectrometer to evaluate the internal gold-coated diffuse reflector.

2.4. Chemical Analysis

2.4.1. Sample Extraction

The mango peel powder was added to a 95% methanol solution at a 1:5 ratio and macerated for 12 h, after which the solution was separated through filter paper. This extraction process was repeated three times per sample, and the supernatants for each were combined. The supernatant was then concentrated to one quarter of its initial volume using a rotary evaporator (RC600, KNF, Balterswil, Switzerland). The resulting liquid (200 µL) was then transferred to an Eppendorf tube and evaporated to full dryness. Subsequently, the volume and yield of the extracts were determined. The crude extract was stored at −4 °C, and, prior to chemical analyses, 10 mg of crude extract was dissolved in 1 mL of 95% methanol solution.

2.4.2. The Analysis of Total Reducing Sugar

The quantification of reducing sugar was determined by employing glucose as a reference standard, utilising the methodology established by Sunanta, Kontogiorgos [25]. Glucose was used as a reference standard. Mango peel extract was initially mixed with DNS reagent (1:1 v/v) and incubated at a temperature of 80 °C for a duration of 30 min, after which a spectrophotometer (SPECTROstar Nano; BMG LABTECH, Offenburg, Germany) was used to detect the absorbance at a wavelength of 575 nm.

2.4.3. Total Phenolic and Total Flavonoid Content

The total phenolic content was assessed using gallic acid as the reference standard, following the method of Sunanta and Pankasemsuk [26]. In short, 30 µL of sample extract was mixed with 150 µL of 10% Folin-Ciocalteu reagent, and then 120 µL of 6% NaCO3 solution was added. The reaction mixture was then incubated for 60 min in the dark. The spectrophotometer evaluated the absorbance at 765 nm to determine the total phenolic content, which was calculated as milligrammes of gallic acid equivalents (GAE) per gramme of dry mango peel (mgGAE/g).
The flavonoid content of mango peel was determined using catechin as the standard, following the method outlined by Sunanta, Rachtanapun [27]. The solution was diluted with 125 µL of distilled water, and then 7.5 µL of 5% NaNO2 solution was added and incubated at room temperature for 5 min. Next, 15 µL of a 10% AlCl3·6H2O solution, 50 µL of a 1M NaOH solution, and 27.5 µL of distilled water were added. Finally, the absorbance of the mixture was measured at 510 nm using a spectrophotometer (SPECTROstar Nano; BMG LABTECH, Offenburg, Germany). The total flavonoid content has been expressed in milligrammes of catechin equivalents (CE) per gramme of dry mango peel (mgCE/g).

2.4.4. The Identification of Phenolics and Flavonoids in Mango Peel

Quantitative analysis of phenolics and flavonoids in mango peel was conducted using an HPLC system (Scion LC6000, Livingston, UK) with two Scion LC6000 PU-6100 pumps and an external Scion LC6000 DA-6430 detector, utilising a C-18 reverse-phase column (250 × 4.6 mm i.d., particle size 5 mm, 5C18-AR-II, Munich, Germany) at 258 °C [28,29,30]. The methanolic extract (5 µL) was injected and the mobile phase consisted of 0.1% formic acid in water and acetonitrile (94.9% H2O:5% formic acid:0.1 acetonitrile v/v) at a flow rate of 1 mL/min. Gallic acid, catechin, epicatechin, caffeic acid, naringin, p-coumaric acid, rosmarinic acid, vanillin, o-coumaric acid, and quercetin were used as the external standards. The phenolic component contents were calculated as micrograms per gramme of dry mango peel.

2.5. In Vitro Antioxidant Capacity

2.5.1. ABTS Radical Scavenging Assay

The ABTS assay was carried out following the method described by Wongkaew, Sangta [19]. The working solution was obtained by combining the ABTS solution with potassium persulfate solution and allowing it to react in the dark at room temperature for 12–16 h. A 10 µL sample of mango peel extract was then combined with the working solution and incubated for 30 min. Absorbance was quantified at a wavelength of 734 nm via the spectrophotometer used previously. The ABTS scavenging ability of the extract was determined as the percentage of antiradical activity, using the following equation:
ABTS   radical   scavenging   activity   ( % ) = A c o n t r o l A s a m p l e A c o n t r o l × 100

2.5.2. DPPH Radical Scavenging Assay

The DPPH assay was similar to the analysis conducted by Sunanta, Chung [31], where the scavenging ability of the stable DPPH (2,2-diphenyl-1-picrylhydrazyl) free radical was assessed. The mango peel extract was mixed with the DPPH solution and incubated at room temperature in the dark for 30 min. The spectrophotometer evaluated the absorbance at 550 nm to determine the capability of the sample to scavenge the DPPH radical, which was calculated using the following equation:
DPPH   redical   scavenging   activity   ( % ) = A c o n t r o l A s a m p l e A c o n t r o l × 100

2.5.3. Ferric Reducing Antioxidant Power (FRAP) Assay

The FRAP working solutions used included 300 mM acetate buffer, 10 mM TPTZ solution in 40 mM HCl, and 20 mM FeCl3⋅6H2O solution, as outlined by Prasad, Veeresh [32]. The mango peel extract was combined with the working solution and allowed to react for 5 min at room temperature, and the absorbance was measured at a wavelength of 595 nm. The following formula was used to determine the FRAP scavenging capability of the sample as a percentage of antiradical activity using the following equation.
FRAP   value   ( % ) = A s a m p l e A c o n t r o l A s t a n d a r d A c o n t r o l × 2

2.6. Statistic Analysis

Principal component analysis (PCA) and cluster analysis (CA) were conducted using XLSTAT software version 2021.4.1 (Suite NY, New York, NY, USA), and a partial least squares (PLS) model was applied to the measured parameters using ADANCO (version 2.3.2, Kleve, Germany). The calibration models for NIR were evaluated by assessing their accuracy using the Root Mean Square Error of Calibration (RMSEC) and Prediction (RMSEP). Computations of PCA and PLS, as well as other associated statistical analyses of NIR, were performed in CAMO AS, version 10×, developed by Trondheim, Norway.

3. Results and Discussion

3.1. Physiochemical Characteristics of Thai Mangoes

3.1.1. Size and Firmness

The size parameters of the mango fruit, including width, length, and weight, were measured and are presented in Table 1. Among the mango cultivars, RD exhibited the greatest width, measuring 73.54 cm, whereas KO had the smallest width (44.9 mm. KO, along with MA, also had the shortest length at around 80 mm, whereas MH was the longest, at more than twice the length (i.e.,163 mm). The ratio of length to width, determining the shape of mango fruits, ranged from 1.27 to 2.48, where a ratio of 1 aligns to spherical shapes, while higher values indicate elongated fruit. These data demonstrate that NG and MH had notably longer shapes than those of other cultivars. Weight measurements revealed that TL mangoes were the heaviest at 380 g, while KO mangoes were the lightest at 87 g. It can thus be concluded that MH was the largest cultivar in terms of overall size, while KO was the smallest compared to the other cultivars. Genetic variation in mango cultivars is a crucial factor in determining the size of the fruit [33,34]. Consequently, variation in the size of mangoes can be attributed to a multifaceted interaction of genetic variables, environmental conditions, and agronomic approaches.
The texture of mangoes varies according to the variations in many factors, including the stage of ripening, genetic, fibre and pectin content, sugar and acid balance, and environmental influences. As mangoes ripen, their firmness gradually decreases due to alterations in the cell wall structure, primarily driven by the activity of enzymes [35]. The firmness of the mango fruit and pulp was evaluated in this study and is presented in Table 1. Notably, TL and MR exhibited significantly higher fruit firmness values of 3.05 and 2.93 N, respectively, while KO gave the lowest value for flesh firmness at 0.35 N. The firmness of mango fruit and flesh varied greatly according to the cultivar, similar to the findings of Baloch and Bibi [36]. However, these diverse textural profiles may be associated with the internal chemical composition [37].

3.1.2. Colour

The current study thoroughly investigated the physiological and physicochemical characteristics of over-ripe Thai mango cultivars, as presented in Table 1. The CIELab method has been utilised to assess the maturity index and ripening process of mangoes, as demonstrated by Wongkaew, Kittiwachana [21]. The L* revealed that CH and MH exhibited the highest values of 63.87 and 69.07, respectively, whereas MR had the lowest lightness value of 40.30. For the a* value MA gave the highest reading of 14.76, representing an orange peel colour, whereas AK had the lowest value at −10.12, indicating a high level of greenness. When considering blueness/yellowness, MA displayed the highest b* value at 51.63, followed by CH and MH with values of 51.50 and 48.72, respectively. Conversely, MR exhibited the lowest b* value of 18.62. The peel colour may range from green to yellow or dark orange throughout ripening, or it may remain green depending on the variety [38,39]. The colouration of mango peel is influenced by various variables, including flavonoid production, anthocyanin synthesis, and chlorophyll degradation [40,41]. Additionally, external factors, including temperature, light exposure, and humidity, can modulate the colour development process in mangoes, further adding to the complexity of their ripening physiology [42].

3.1.3. pH of the Peel

Mango pulp typically exhibits a pH range of 3.4–4.5 in unripe and 4.5–5.2 in ripe peel, with pH varying based on factors including cultivar, ripeness, and growth conditions [43]. This study found that MR peel had a pH value of 4.84, which was the highest among all the mangoes examined. In contrast, KO peel had the lowest pH value of 4.3. Mangoes are categorised as acidic fruits, whereas unripe mangoes are characterised by a higher acidity level, resulting in a lower pH [44]. This acidity is primarily due to the presence of organic acids such as citric acid, malic acid, and tartaric acid in the fruit. As mangoes ripen, the levels of organic acids gradually decrease, and this reduction in acidity is accompanied by an increase in the sugar content of the fruit [45].

3.2. Near-Infrared (NIR) Spectroscopy Analysis

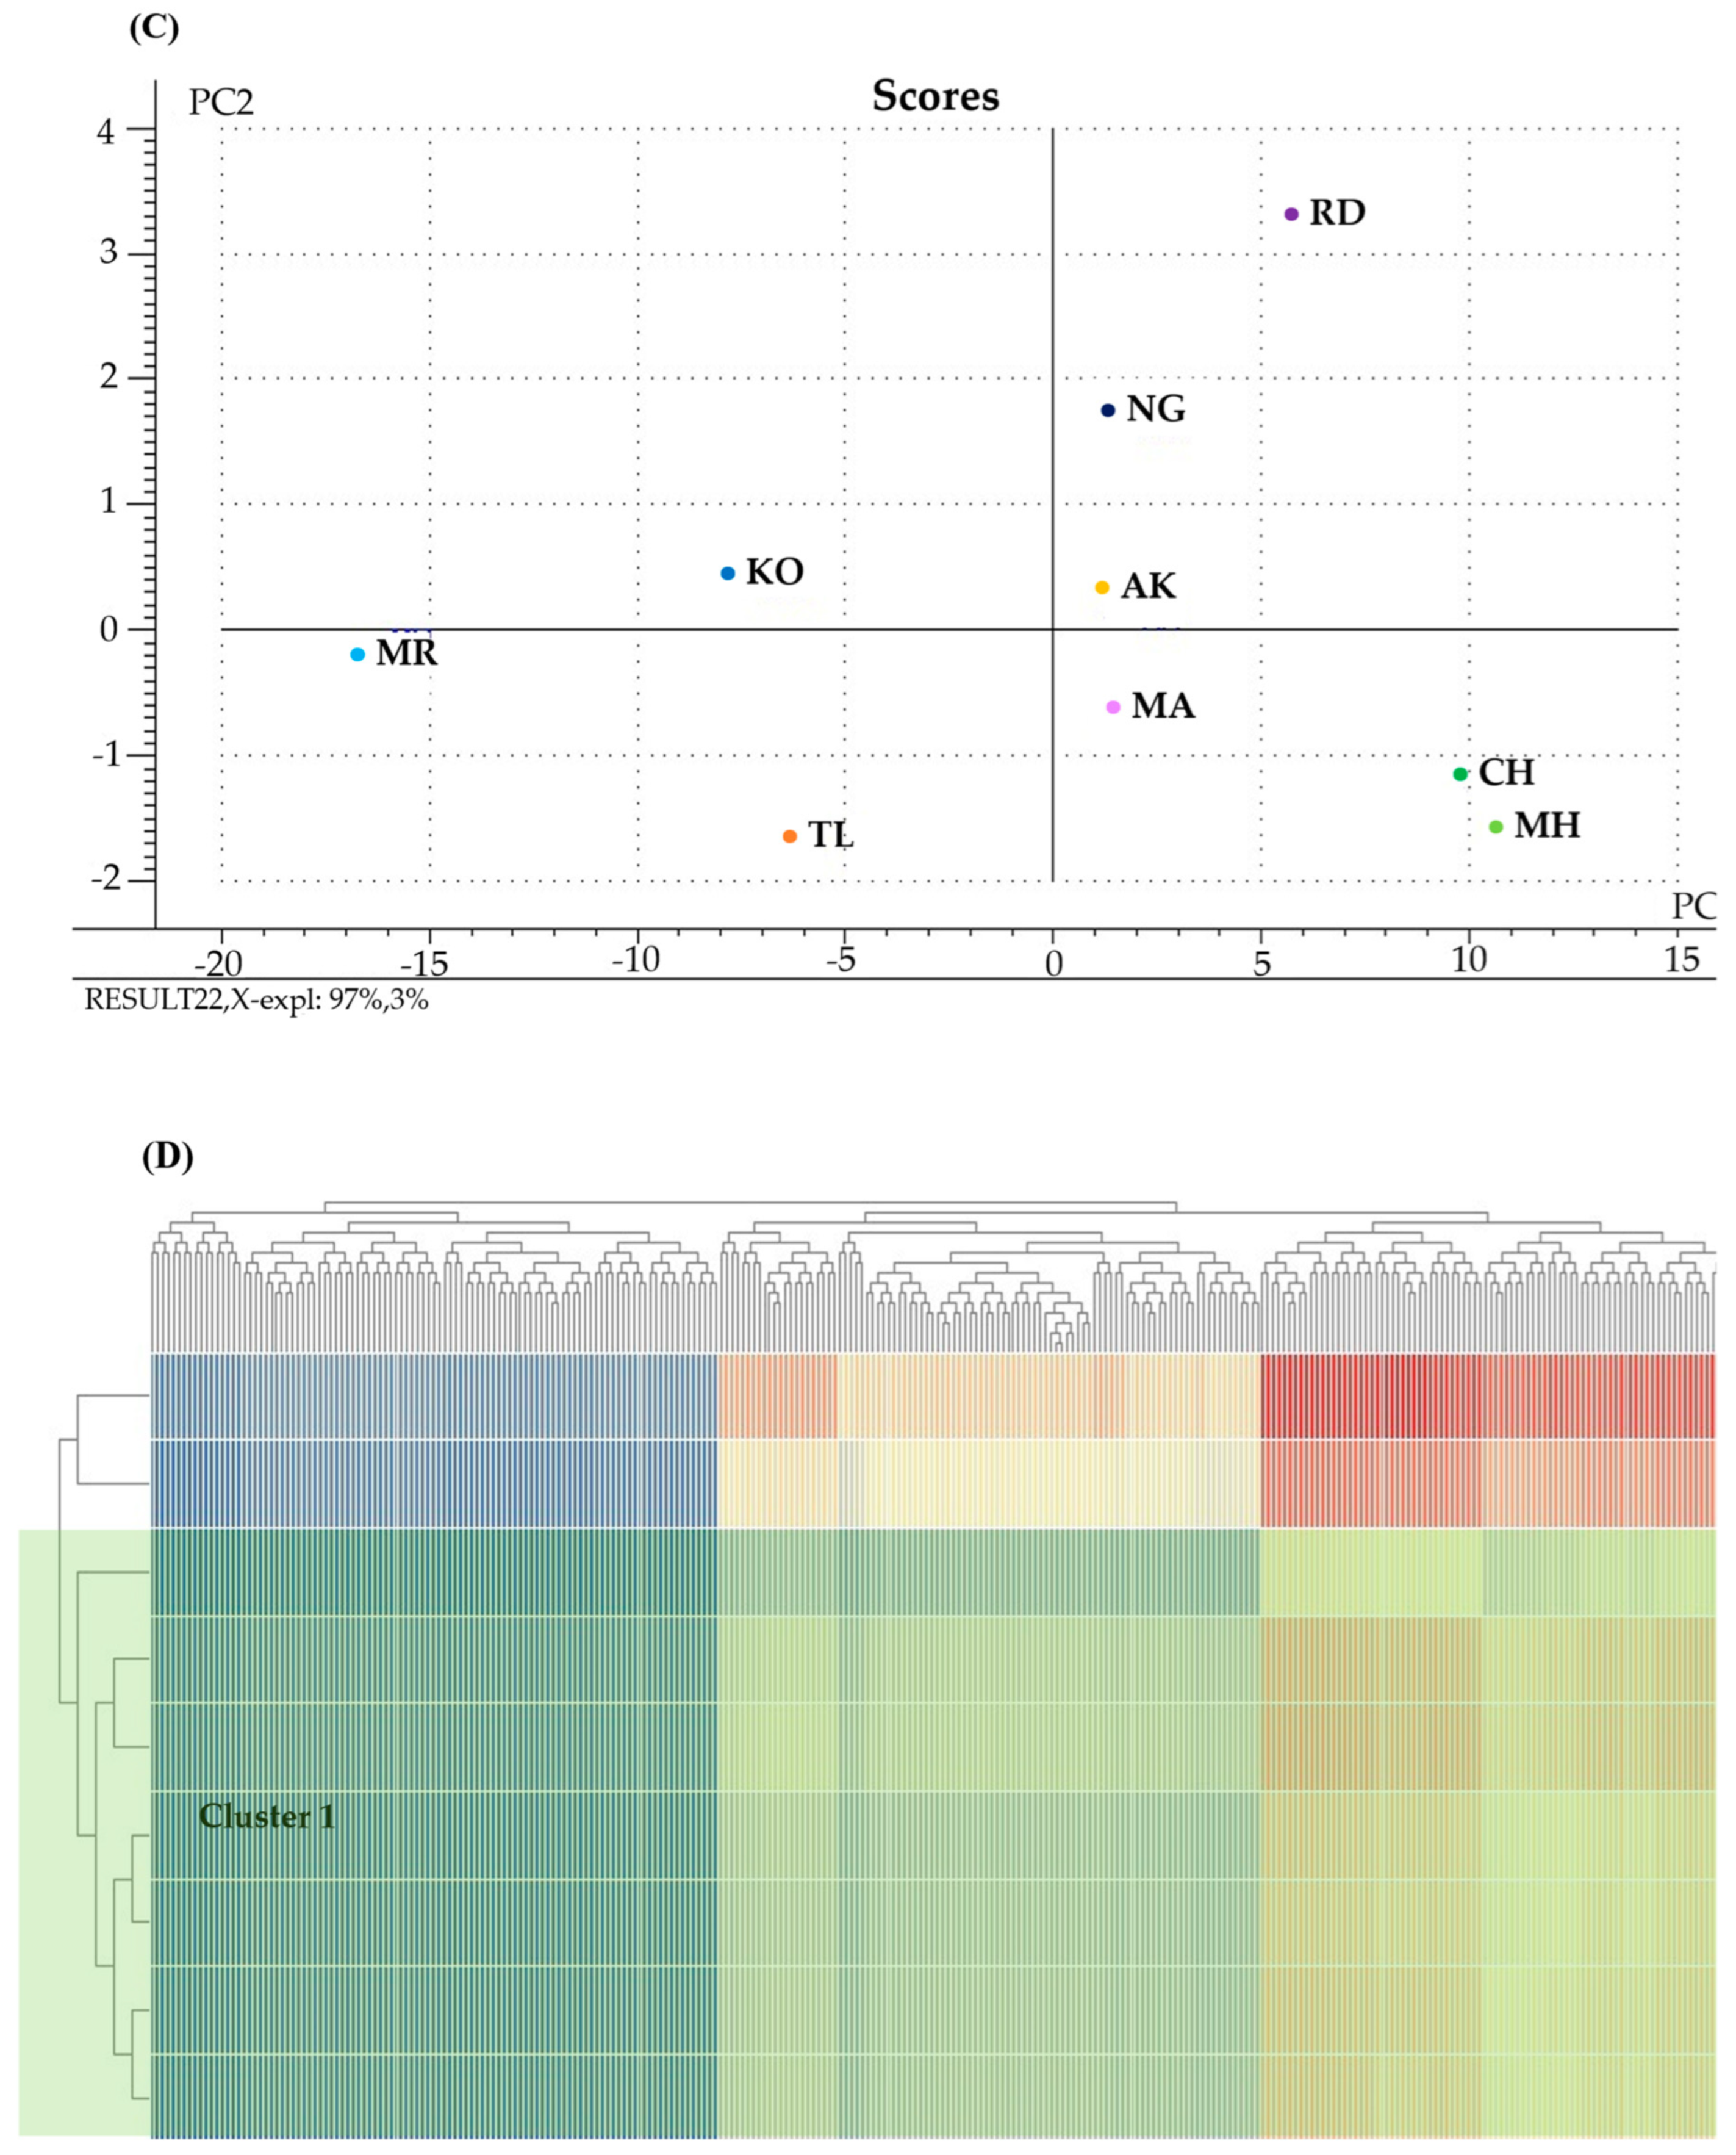
NIR spectroscopy analysis of mango fruit peel powder is illustrated in Figure 1. The absorption bands related to the C–H–O bonds, indicative of the soluble solid concentration, were observed between 1149 and 1265 nm and 1679 and 1830 nm. It is postulated that other qualitative traits pertaining to C–H–O molecular configurations also resonate within these particular wavelength ranges, which are connected to the lipid-related second overtone of the C–H stretch. The initial overtone of O–H stretching was linked to the moisture content at wavelengths between 1416 and 1471 nm. The absorbance in the wavelength range of 1587 to 1920 nm was attributed to the first overtone of O–H stretching and was correlated with starch compounds, which are the major compounds in mango peel powder. The peak at 1762 nm corresponds to the first overtone of C–H stretching and is linked to lipids. The absorbance peaks shown at wavelengths ranging from 2040 to 2222 nm were attributed to the stretching vibrations of C–H, N–H, and O–H bonds, and were indicative of the presence of proteins [46].

3.3. Chemical Properties

3.3.1. Proximate Compositions

The proximate composition of Thai mango peel from the various cultivars studied is detailed in Table 2. Mango peel is recognised as a valuable source of essential nutrients, particularly carbohydrates, proteins, fats, and dietary fibre. Given its high dietary fibre content, mango peel has the potential to be utilised as an ingredient in food products, particularly for those seeking to enhance the dietary fibre content [47]. Among the cultivars analysed, KO exhibited the highest moisture content in its peel at 11.70%, while MH displayed the lowest moisture content at 5.97%. The protein content was the lowest in RD at 3.67% and the highest in AK at 6.13%. MR exhibited the highest carbohydrate content at 75.04% compared to AK, which had the lowest carbohydrate content at 67.81%. The lowest ash content was also found in AK at 2.82%, while MA and TL had the highest ash values of 4.07% and 3.29%, respectively. This finding is similar to those of previous studies for the Paparanda, Julie, and Peter cultivars, which exhibited protein content between 1.93–2.48% and carbohydrate content of 64.83–68.69% in their peels [48]. The crude fat content ranged from 0.12% to 0.29%, with AK exhibiting the highest level, while RD and MR cultivars displayed the lowest. The observed results align with the reported fat concentrations in mango cultivars, which range from 1% to 5% [47,49]. Statistical analysis indicated no significant variation in the crude fibre content among the mango cultivars.
Based on these results, the main compositions of mango peels were dietary fibre and carbohydrates [50]. Carbohydrates and fibre represent the primary components of mango peel, as they offer fundamental structural and protective. Carbohydrates constitute the principal components of the cell walls in peel. Complex carbohydrates provide structural integrity and rigidity to the peel, protecting the fruit against physical injury and environmental stressors. Fibre functions as a mechanical barrier, shielding the fruit from external threats like pests, diseases, and physical harm [51]. Mango peel has relatively minor quantities of proteins in comparison to carbohydrates and fibre. It contains minimal quantities of storage proteins, while the majority comprises defence-related proteins, enzymes, and structural proteins [52]. Genetic diversity significantly influences the chemical and nutritional characteristics of mango peel among various types. Each variety possesses distinct metabolic pathways, leading to variations in nutrient synthesis and accumulation [15]. Understanding these nutritional variations can aid processors in selecting cultivars suited to specific markets or uses; for example, by choosing peels from cultivars with higher fibre content for dietary fibre supplementation in food products, contributing to more profitable utilisation of mango by-products [12,53].

3.3.2. Total Reducing Sugar

The maturation of fruits involves a series of chemical and physical changes that occur as the fruit develops to full development [11]. The breakdown of starch in the peel cells influences the formation of reduced sugars in mango peels during ripening. The enzyme amylase breaks down starch into sugars [54]. Additionally, sucrose hydrolysis, in which sucrose is hydrolysed by the enzyme sucrase or invertase, results in sucrose being broken down into glucose and fructose [55]. Table 2 reveals that NG cultivar had the highest total reducing sugar content at 0.57 mg/g, while MA had the lowest content at 0.24 mg/g. On a dry weight basis. The distinct genetic characteristics of mango cultivars affect the metabolism and storage of sugars in peel [52]. The synthesis of sugars in mango peel is a dynamic process, in which higher sucrose accumulation correlates with higher levels of glucose and fructose due to starch-to-sugar conversion. Nonetheless, the enzymatic activities of amylase and invertase can vary significantly among cultivars.

3.3.3. Total Phenolic and Total Flavonoid Content

Phenolic compounds are secondary metabolites synthesised through the shikimic acid pathway, which initiates the conversion of glucose to phosphoenolpyruvate and erythrose 4-phosphate through glycolysis [56]. Regarding phenolic content, the NG cultivar exhibited the highest level at 213.36 mg GAE/g, while the AK showed the lowest at 19.39 mg GAE/g (Table 2). This result is consistent with findings from the peel of the Tommy cultivar, as documented by Berardini, Knödler [57]. However, it is noteworthy that these values are notably lower than those reported for the ripe peel of Indian Raspuri and Badami mango cultivars, which range from 50 to 100 mg GAE/g [58]. Previous experiments by Kim, Moon [13] have shown that the ripe mango peel of Irwin cultivar growth in Korea has a total phenolic content of 70.1 ± 4.61 mg GAE/g. Flavonoids, a subclass of phenolic compounds commonly found in fruits and vegetables, are recognised for their significant antioxidant properties [59,60]. Our investigation also found that the NG cultivar exhibited the highest flavonoid content, measuring 5.43 mg CE/g, while the HM cultivar had the lowest, measuring 2.66 mg CE/g. Previous research has documented a total flavonoid range of 11.29 to 23.46 mg CE/g [61]. The total flavonoid content in the mango cultivars Langra and Chausa was measured to be 90.89 and 92.55 mg CE/g DM, respectively [62]. Notably, mango peel polyphenol levels surpass those found in the pulp and are influenced by various factors such as climatic conditions, agronomic practices, and varietal differences [48,63]. The variation in phenolic content in mango peel among various varieties is primarily driven by genetic variables that considerably regulate the biosynthesis and accumulation of phenolic compounds, which play crucial roles in plant defence systems [52]. Thicker peels may possess elevated concentrations of phenolics, as they are associated with enhanced physical defence and greater environmental exposure. Due to the phenolic hydroxyl groups in phenolics and flavonoids, they have the ability to scavenge reactive oxygen species, which makes them powerful antioxidants. In addition, they also show a number of other biological effects, including efficacy against viruses, cancer, ulcers, inflammation, hepatotoxicity, and ulcers [2].

3.3.4. Phenolics and Flavonoids in Mango Peel

High-performance liquid chromatography (HPLC) analysis of methanolic extracts from Thai mango peels revealed diverse flavonoid profiles (Table 2). All samples contained gallic acid, with concentrations ranging from 4.94 mg/g in the MH cultivar to 16.10 mg/g in NG. Similarly, catechin, epicatechin, and caffeic acid were present in all cultivars, with the highest concentrations again found in NG (12.22 mg/g, 23.49 mg/g and 15.82 mg/g, respectively). P-coumaric acid was also detected in all cultivars, ranging between 5 and 9 mg/g, although naringin was detected in the CH cultivar at 7.88 mg/g. With the exception of RD, all cultivars tested also contained rosmarinic acid, with the MH cultivar exhibiting the highest concentration at 12.16 mg/g. Only the MA, KO, CH, and TL cultivars contained vanillin at concentrations of 5.85, 7.31, 8.92 and 6.12 mg/g, respectively. However, only the MA and TL cultivars contained o-coumaric acid, at levels of 4.92 and 5.16 mg/g. Further research by Pinsirodom and Taprap [64] also documented the presence of gallic acid, caffeic acid, p-coumaric acid, cinnamic acid, and ferulic acid in samples from both raw and ripe peels taken from six different Thai mango cultivars. Marcillo-Parra, Anaguano [30] detailed the concentrations of gallic acid, rutin, mangiferin, epicatechin, and quercetin in mango peel from Tommy Atkins, Haden, and Kent cultivars, noting both varietal differences and similarities. The epicatechin content, for example, was 9.24 mg/100 g in Tommy Atkins and 9.01 mg/100 g in Haden mangoes. Lastly, Liu, Fu [65] explored the distinct physical, chemical, and antioxidant properties of four mango cultivars, highlighting the genetic diversity in their antioxidant capacity, phenolic content, and flavonoid content. The variability in flavonoid profiles and phenolic content observed in Thai mango peel extracts is consistent with the genetic diversity of the crop and the varying environmental factors experienced where it is grown, which can influence phenolic biosynthesis. The presence of gallic acid across all samples aligns with its recognised role as a fundamental phenolic acid in mango and a key constituent that contributes to the crop’s antioxidant properties [66]. The detected flavonoids, including catechin, caffeic acid, and epicatechin, are also known to provide health benefits, including anti-inflammatory activity and cardioprotective effects [67].

3.3.5. Antioxidant Activity

Phenolics and flavonoids play a significant role in their antioxidant properties [68]. The study discovered a favourable correlation between both free radical scavenging capabilities and total phenolic content in mango peel [69]. As the phenolic concentration increased, the compound’s ability to reduce generally increased [70]. Significant antioxidants in plants are frequently polyphenols, which are essential for interacting with radicals like ABTS•+ [71]. The antioxidant capacity of Thai mango peel extracts, as measured by the ABTS radical cation-scavenging activity, showed considerable variation across different cultivars. Notably, the MA cultivar outperformed the other cultivars, with the highest ABTS scavenging activity recorded at 85.67%, whereas the MH cultivar displayed the lowest activity at 14.44% at a concentration of 1 mg/mL. These ABTS scavenging activities were lower than those reported by Rojas, Contreras-Esquivel [72], who observed that water extracts from the peel of the Ataulfo mango cultivar inhibited 91.46% of ABTS radicals at a concentration of 0.75 mg/mL. Complementary to this, Kuganesan, Thiripuranathar [73] benchmarked the ABTS radical cation-scavenging efficiency against Trolox, revealing IC50 values for peel from Willard and Karuthacolomban mango cultivars ranging from 121 to 186 µg/mL. Taken together, these results support the considerable antioxidant potential inherent to mango peels.
2,2-diphenyl-1-picrylhydrazyl (DPPH•) is a stable free radical that is used as a model chemical to evaluate the antioxidant abilities of various compounds [74,75]. Antioxidants function by donating electrons or protons to stabilise DPPH• and diminish the concentration of free radicals in the solution [76]. Antioxidants interact with DPPH• by contributing electrons or protons, transforming DPPH• into DPPH-H [77]. The degree of colour decrease can be quantified as the percentage of inhibition, which indicates the antioxidant capacity of the substance in reducing the amount of DPPH• [78]. Regarding DPPH radical scavenging activity in the current work, the data showed similar variability among the Thai mango cultivars. The MR cultivar presented the lowest DPPH scavenging activity at 27.30%, in contrast to the MA, NG, KO, and AK cultivars, which exhibited more than 85% activity at a concentration of 1 mg/mL, demonstrating the diversity in antioxidant capacity across mango cultivars. Supporting these observations, Rojas, Contreras-Esquivel [72] documented a 70.31% inhibition of DPPH radicals by the peel of Ataulfo mango at 0.75 mg/mL, with Kuganesan, Thiripuranathar [73] highlighting notable differences in the DPPH scavenging activities of 80% acetone extracts from Rasapuri and Badami mango peels.
The calculation using the FRAP assay indicates the reducing power of antioxidants in donating electrons to convert ferric ions (Fe3+) into ferrous ions (Fe2+) [79]. This indicates that the material may be able to stop oxidative damage, which is one of the primary processes that leads to cell destruction. An indicator of a substance’s antioxidant potential, which can help stop or slow down oxidative reactions, is its capacity to donate electrons or function as a reducing agent [80]. The NG and MR cultivars had the highest FRAP activity, with values of 46.28 and 54 mg TE/g, respectively, while the MA, MR, MH, and TL cultivars had the lowest values at 10–16 mg TE/g. A study conducted by Castañeda-Valbuena, Ayora-Talavera [81] it was discovered that the antioxidant activity of dried mango peel powder from the Haden cultivar, as measured by the FRAP assay, ranged from 7.11 to 100.89 mg TE/g. Khammuang and Sarnthima [82] suggested that the antioxidant activities of multiple mango cultivars varied according to multiple factors, including geographical origin and cultivation practices, with mango cultivars substantially influencing phenolic content and, consequently, antioxidant capacities.

3.4. Physiological and Physiochemical Property Relation among Peel of Thai Mango Cultivars

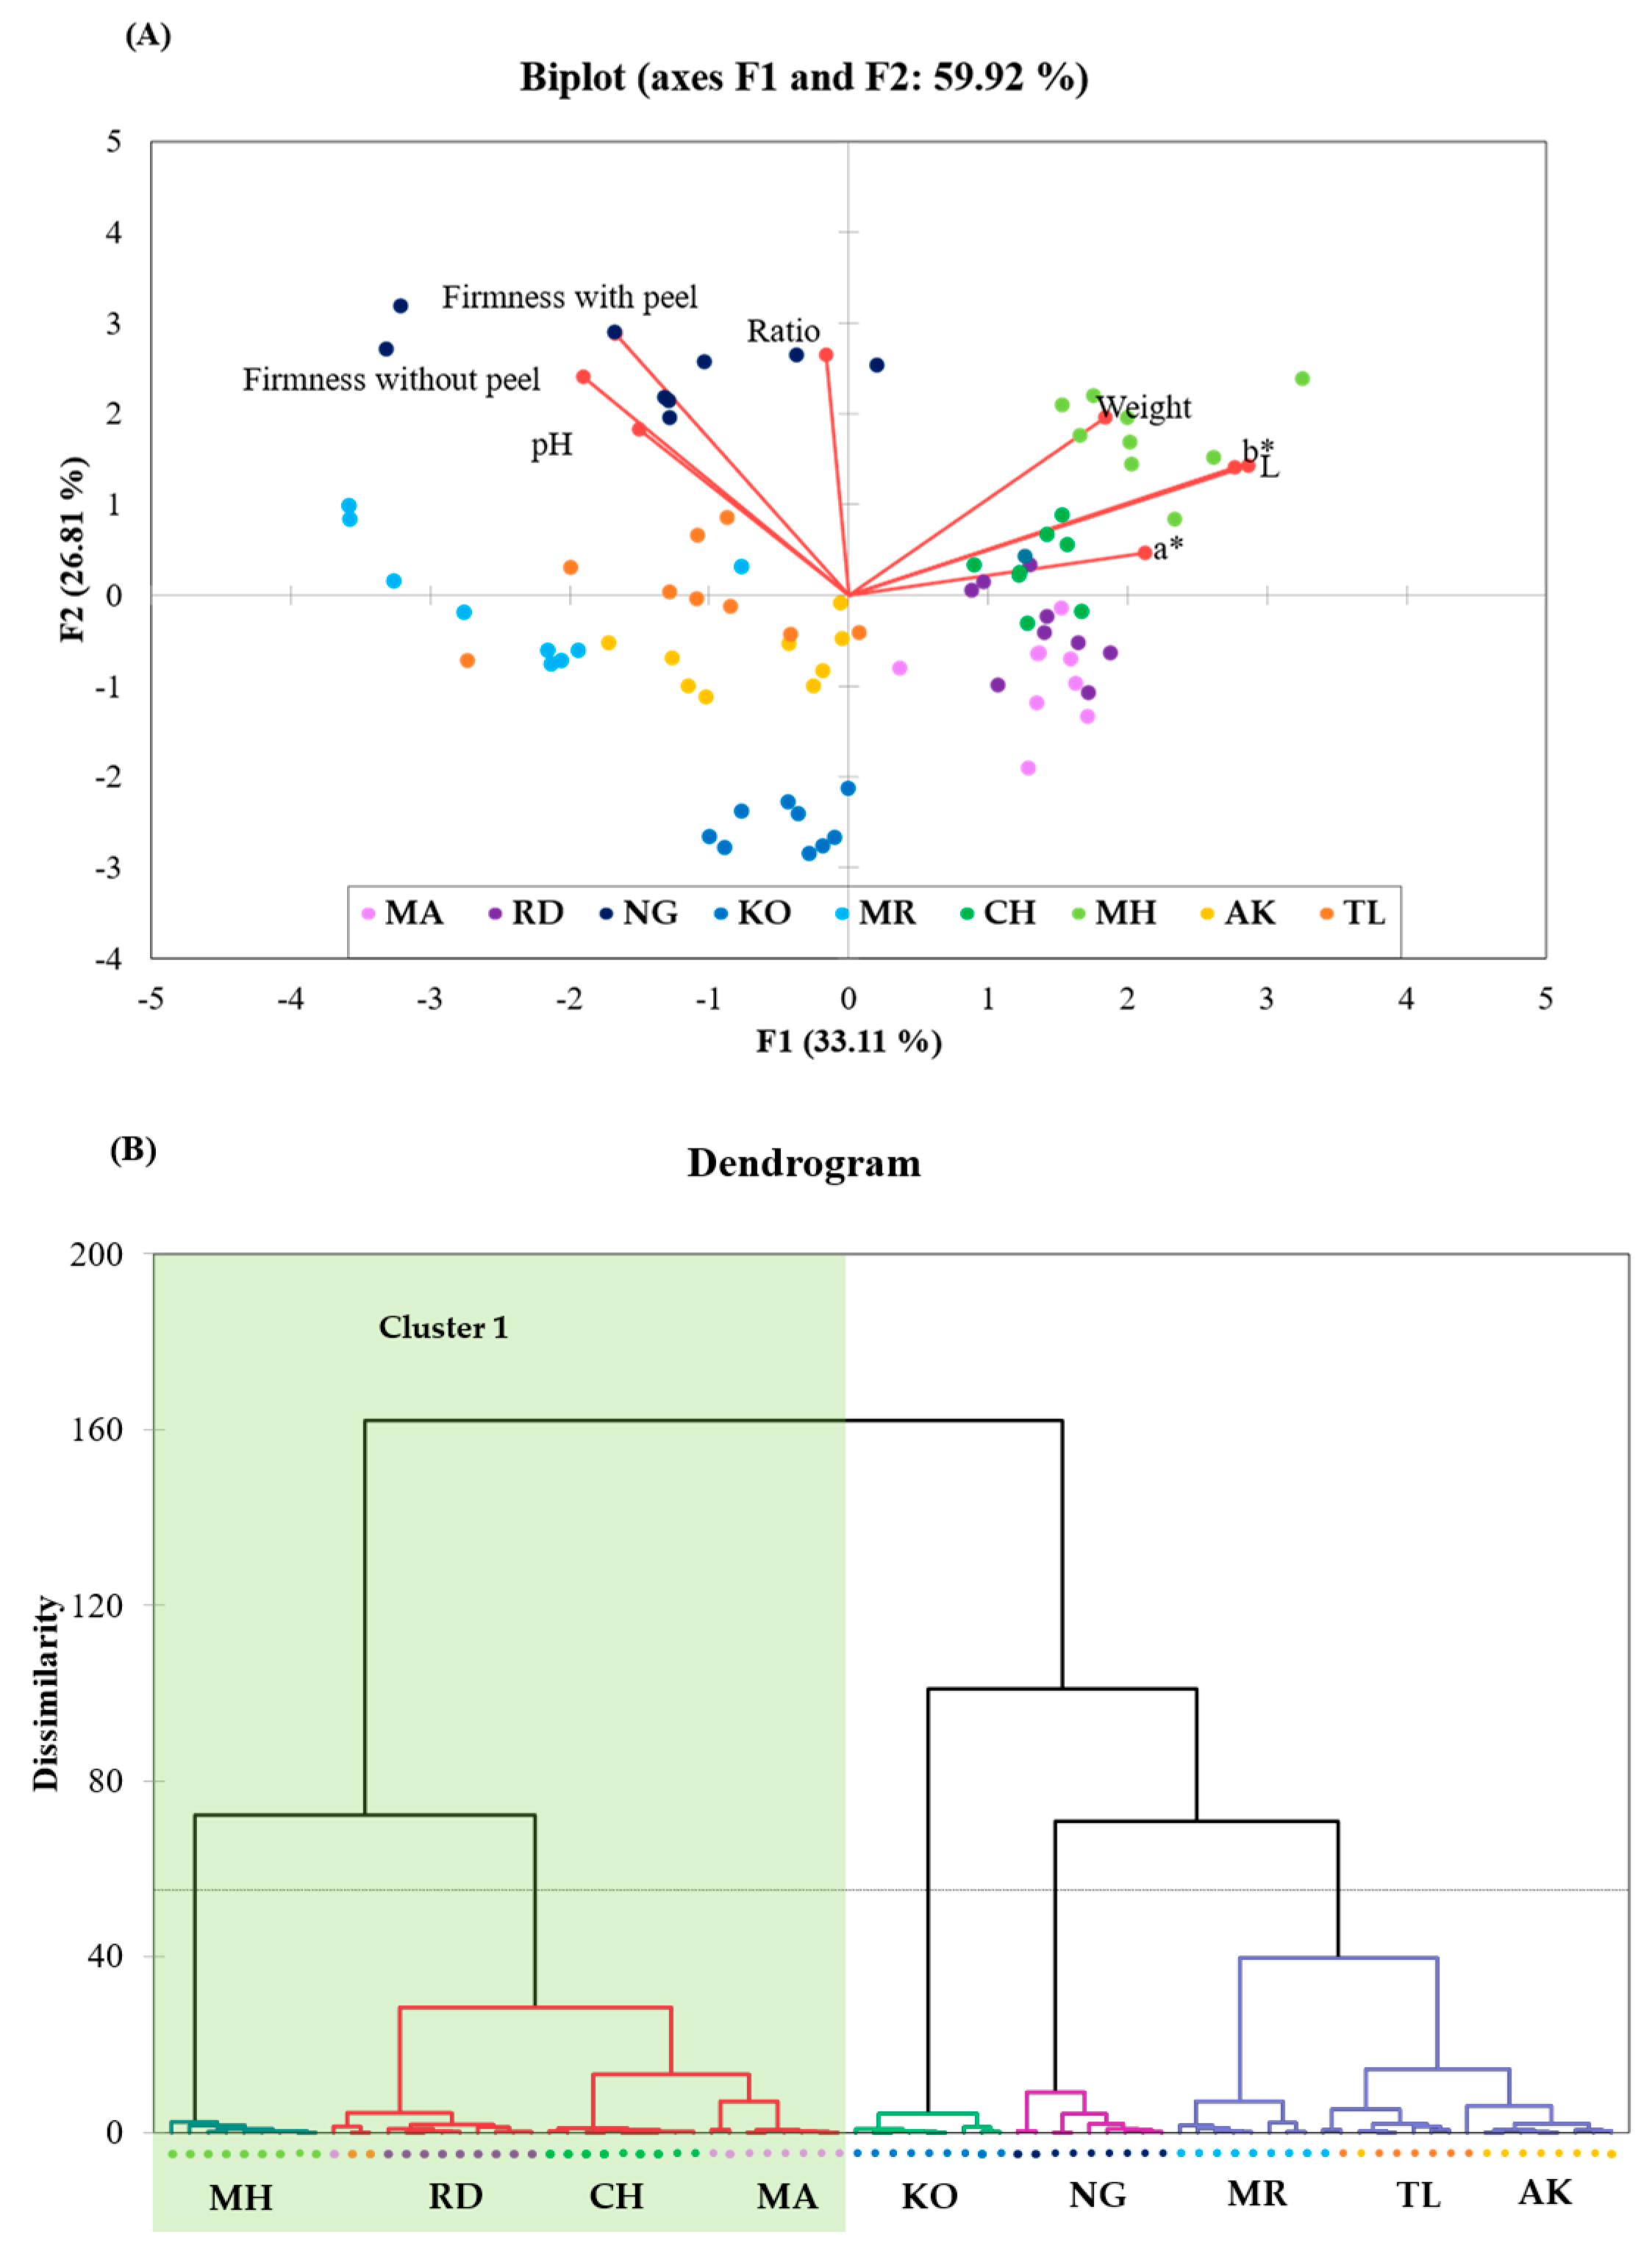
An analysis of the physiochemical properties of Thai mango peels through Principal Component Analysis (PCA) facilitated a reduction in the dimensionality of the sample data set, as depicted in Figure 2A. The PCA biplot of the two dimensions collectively accounted for 59.92% (PC1 = 33.11% and PC2 = 26.81%) of the variability, indicating that Thai mango cultivars can be separated based on their physiochemical properties. The biplot suggested a favourable correlation between fruit firmness, flesh firmness, and pH levels. However, the weight of the mango fruit was unexpectedly associated with the hue of its peel. Notably, the weight of the mangoes was prominently featured, with MH, CH, MA, and RD cultivars indicating large fruits. The four cultivars exhibited higher values of L*, a*, and b*, with the L* value indicating brightness and a positive b* value suggesting a vibrant yellow hue [21]. In contrast, the MR, AK, and TL cultivars showed lower a* values, indicating green colouration. However, the physiological and physicochemical properties are mostly based on genetic variability, as described by Singh, Tyagi [83], Ahmed and Mohamed [84]. Cluster analysis segregated the mango cultivars into two primary groups based on their physiochemical characteristics, as shown in Figure 2B. The first group comprised of MA, CH, RD, and MH, mirroring the distribution observed in the PCA biplot. It was apparent that the first group was separated from the second due to its high weight and yellow colour.

3.5. Chemical Property Relation among Peel of Thai Mango Cultivars

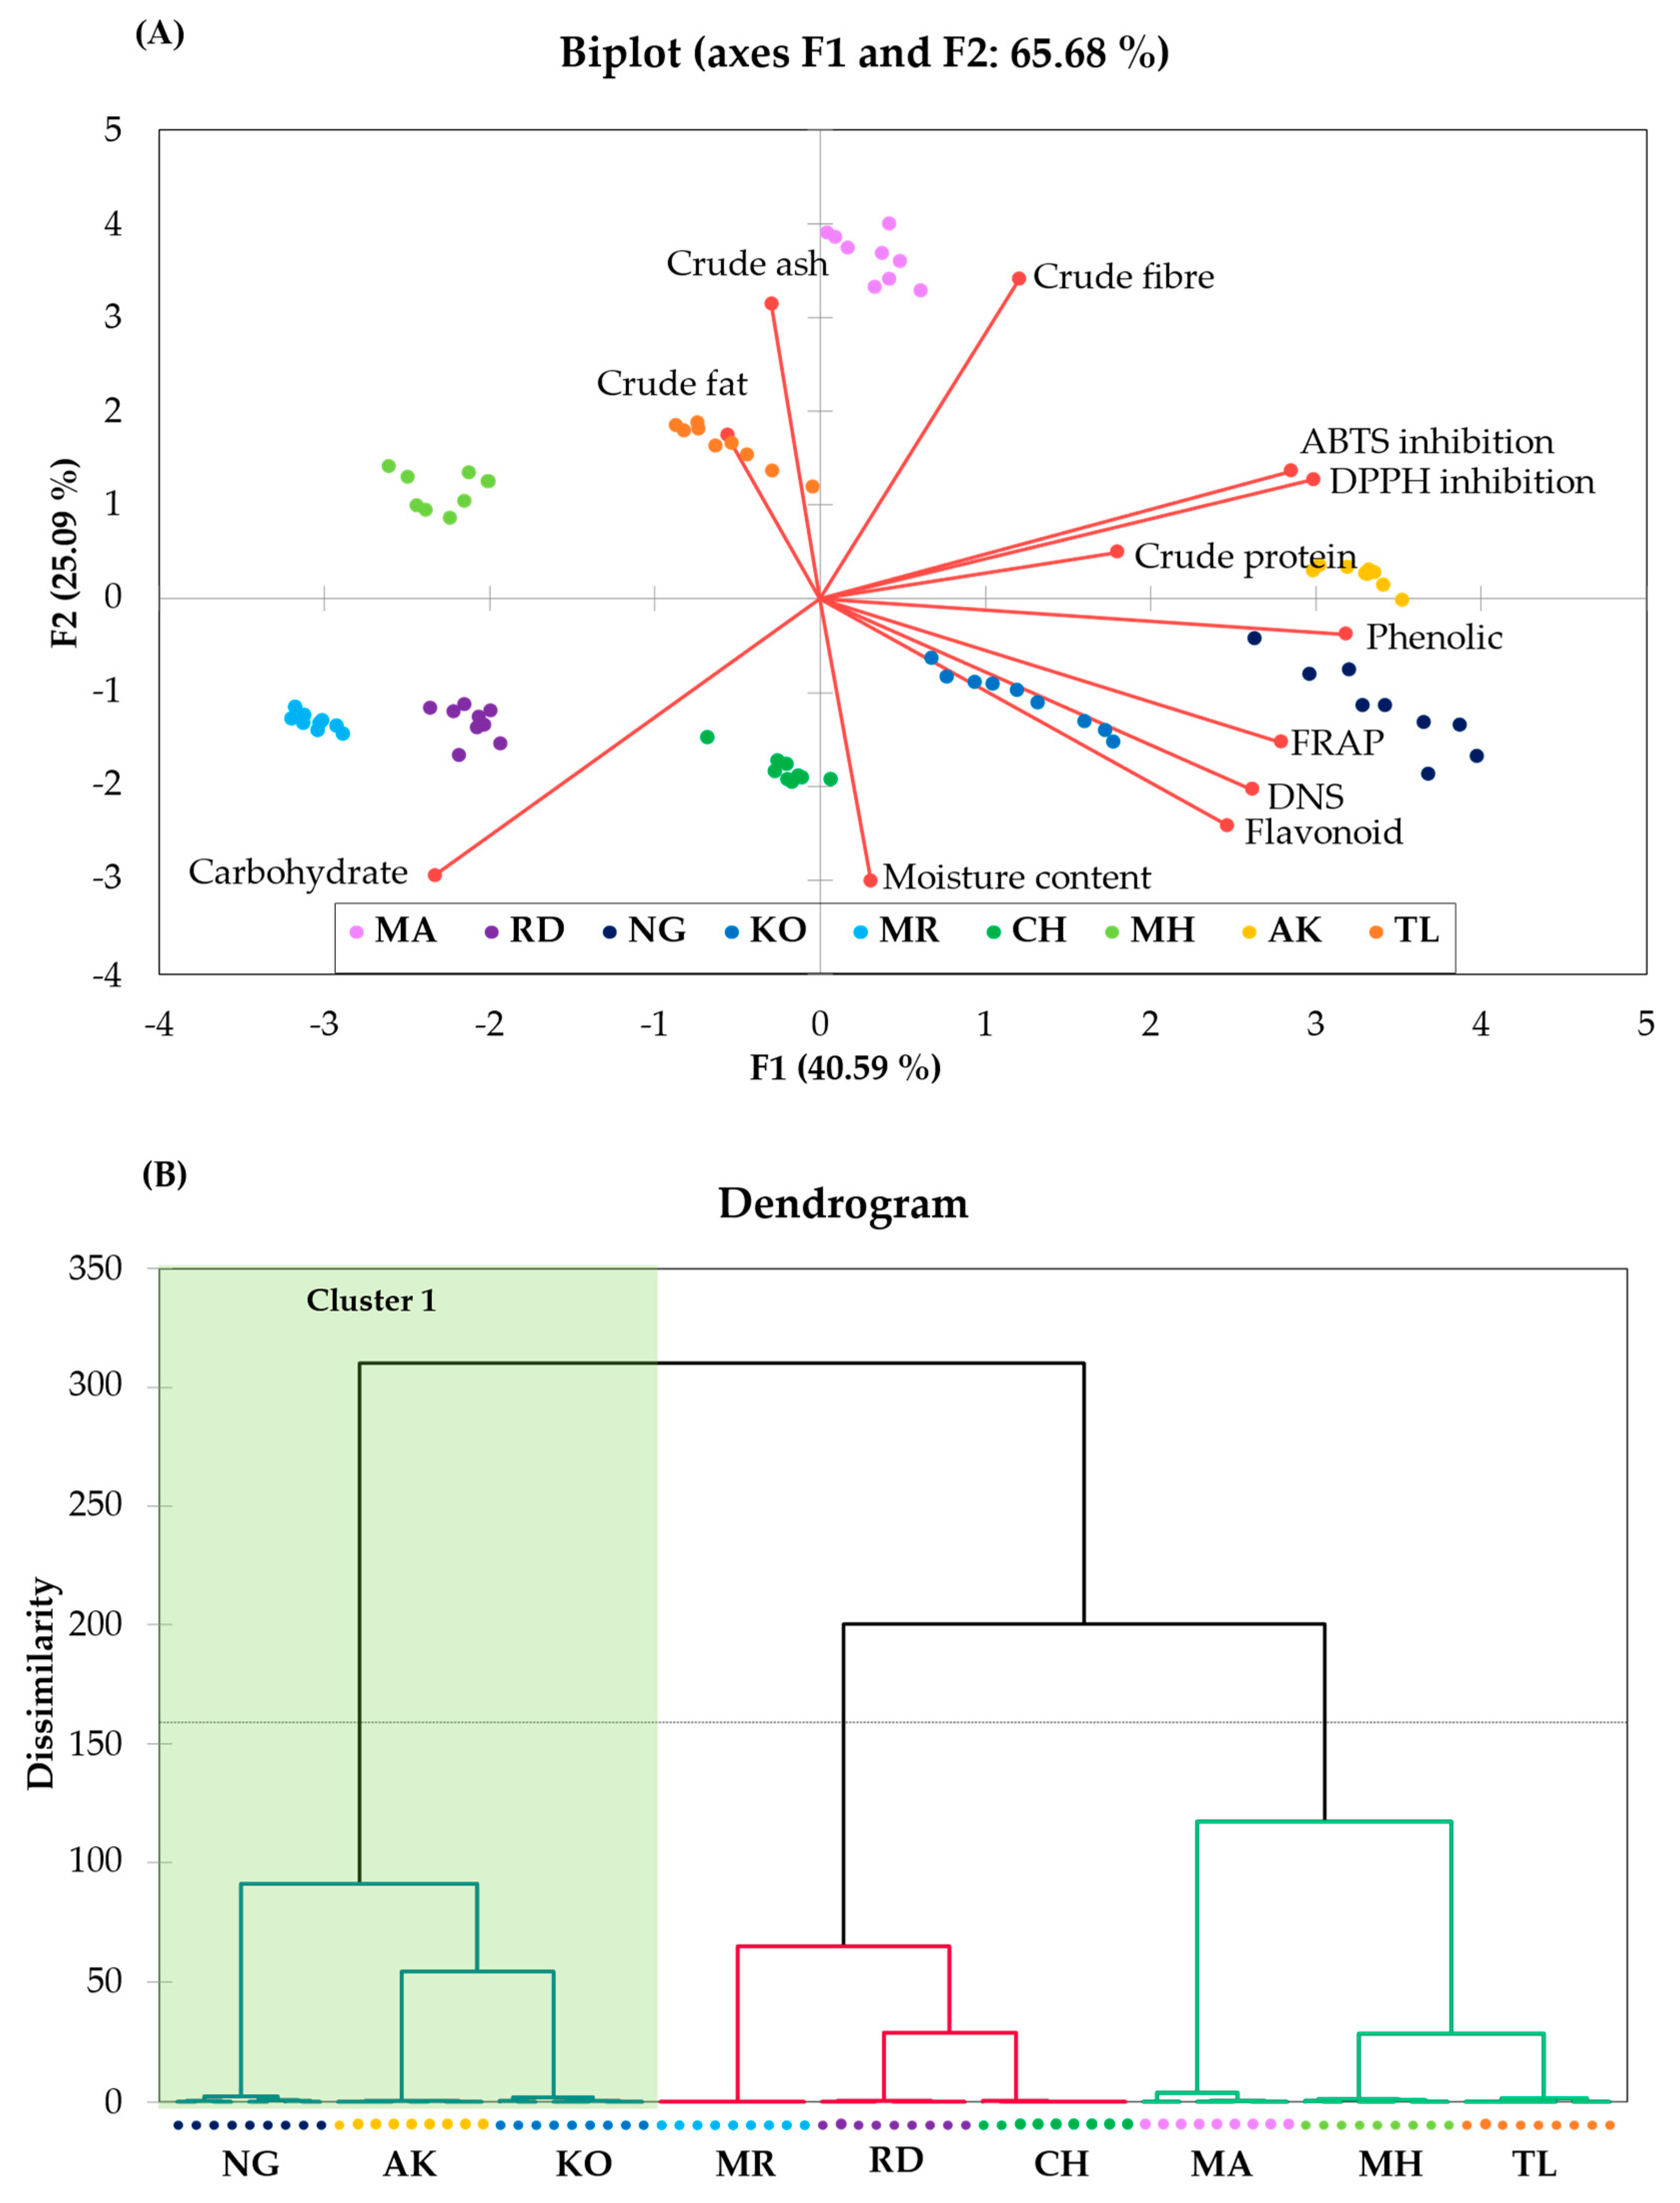
The PCA biplot shown in Figure 3 distinctly separates mango cultivars based on their chemical characteristics, accounting for 65.68% of the total variation. The biplot suggested that total phenolic and flavonoid content in mango peel correlated with their antioxidant activity. Phenolics comprise a diverse category of secondary metabolites, including flavonoids, phenolic acids, and tannins, which are principally responsible for the antioxidant activities of fruits and vegetables. The antioxidant capacity of phenolic substances is associated with their chemical structure, specifically the presence of hydroxyl groups bonded to their aromatic rings [85]. The NG, AK, and KO cultivars were separately categorised based on their predominant antioxidant activity as well as their phenolic and flavonoid contents. In addition, the TL and MA cultivars were predominantly associated with fat and ash, and the MR and RD cultivars demonstrated clustering according to their levels of carbohydrates. Subsequently, cluster analysis of the chemical profiles categorised the mango cultivars into two primary groups, as illustrated in Figure 3B, with the first group consisting of NG, AK, and KO, comparable to PCA, which indicated significant antioxidant activity.
The NIR spectroscopy study of mango fruit peel powder, illustrated in the PCA score plot in Figure 3C, demonstrates separated clustering among cultivars, with the CH and MH cultivars closely together. Meanwhile, the heat map analysis in Figure 3D clustered the RD and NG cultivars into the same group. NIR is a method that analyzes and distinguishes various compounds based on their molecular absorption characteristics using light in the near-infrared region. The oscillation of chemical bonds within molecules influences the amount of light they absorb. Nonetheless, the cluster analysis of NIR exhibited no correlation with the chemical compositions examined in mango peel. The results suggested that NIR can identify a wider range of compounds in mango peel compared to nutritional components, phenolics, and flavonoids, making it impossible to draw conclusions regarding the related chemical substances analysed in this study.

3.6. Partial Least Squares Analysis

To elucidate the connections between physical mango traits and their phytochemical compositions, further examination using partial least squares (PLS) modelling was undertaken. PLS analysis is a multivariate statistical method employed to model the interactions between independent variables (predictors) and dependent variables (responses) by identifying the directions that optimise the covariance between them [86]. Figure 4 displays a correlation matrix that elucidates the relationships between physiological and physicochemical characteristics, and chemical composition across various Thai mango cultivars. The weight, ratio of mango fruit, and firmness of the fruit exhibited no correlation with the chemical composition of its peel with R2 < 0.50, as illustrated in Figure 4A–C. Notably, as also shown in Figure 4D, the flesh firmness exhibited a positive correlation with the total phenolic content (R2 = 0.54), total flavonoid content (R2 = 0.58), gallic acid (R2 = 0.59), catechin (R2 = 0.59), epicatechin (R2 = 0.53), caffeic acid (R2 = 0.59), p-coumaric acid (R2 = 0.59) and rosmarinnic (R2 = 0.50). However, the pH, L*, a*, and b* values did not correlate with any of the chemical attributes (Figure 4E–H). In firm mangoes, the peel exhibits higher quantities of chemicals, serving as a defence mechanism against environmental stressors and pests. As the fruit ripens and softens, certain chemicals are either degraded or metabolised, resulting in decreased amounts in the peel. Consequently, softer mangoes generally possess lower phenolic content than firmer mangoes [87,88]. Recent research indicates that mango peel possesses significantly higher concentrations of antioxidants, phenolics, and flavonoids than pulp, suggesting its potential advantages for the food and pharmaceutical industries.
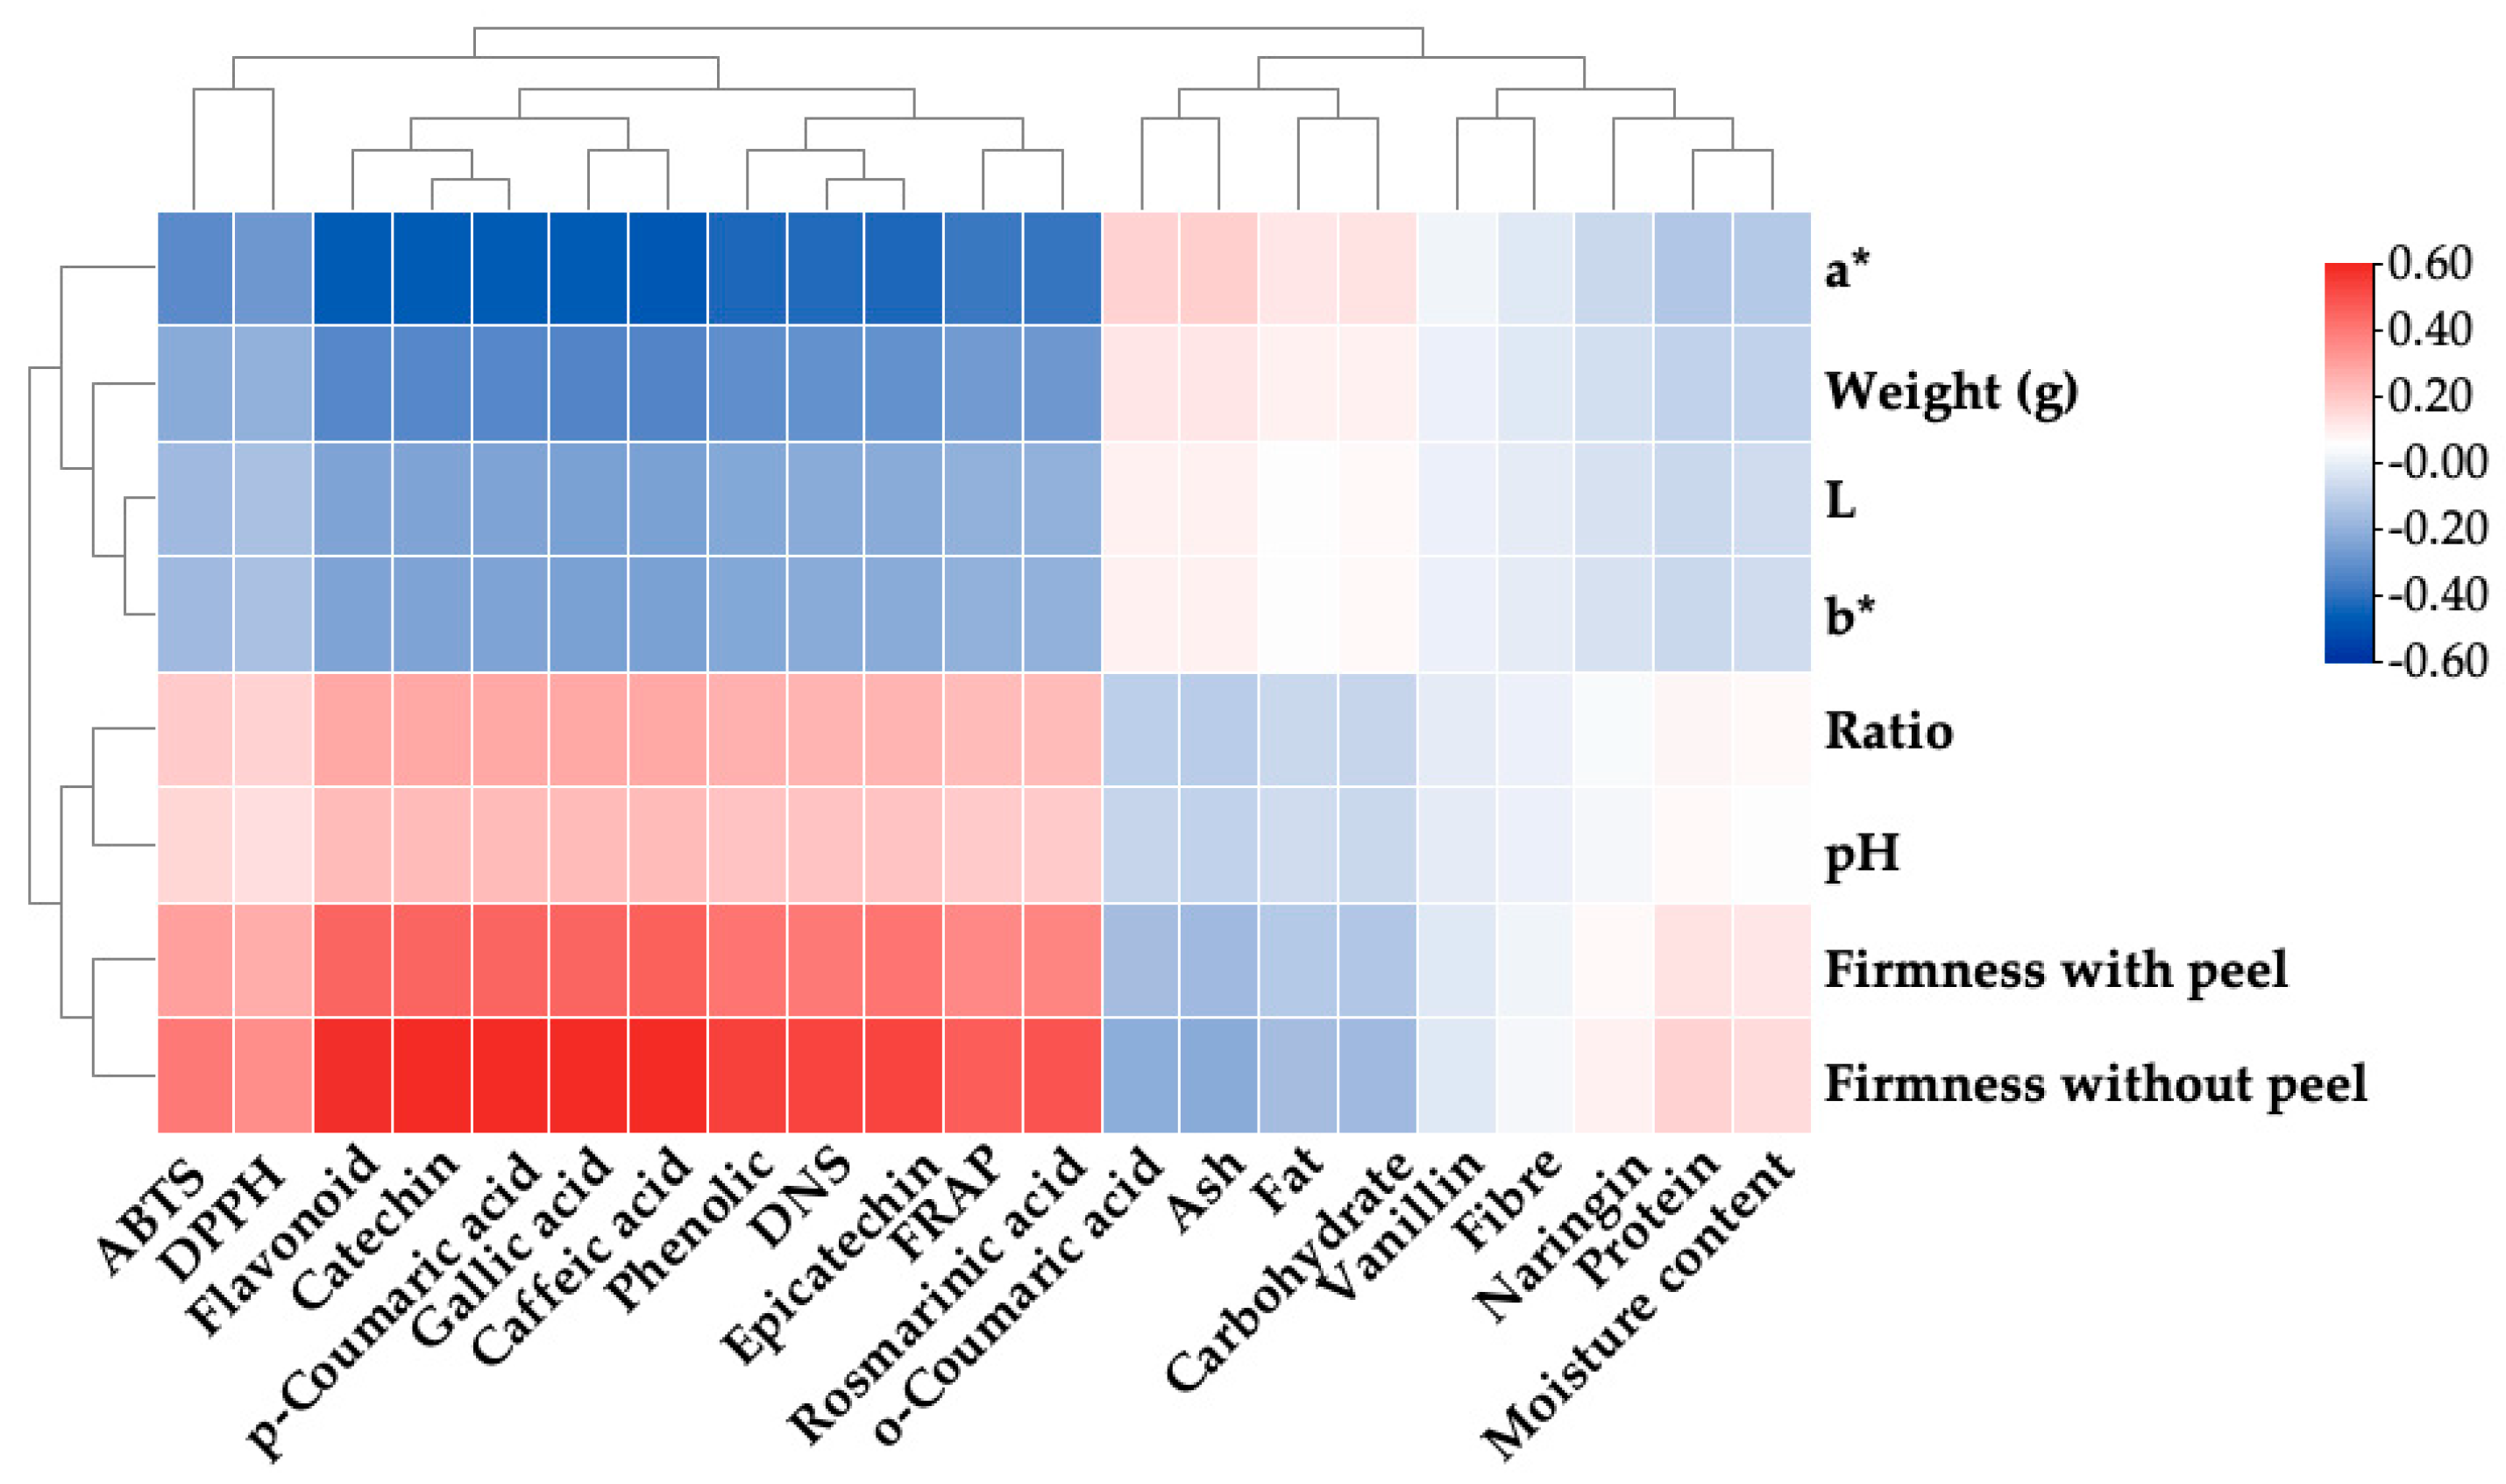
To comprehend the relationship between these traits, heat map analysis was used, as illustrated in Figure 5, where R2 values below 6.0 were considered to be weak [89]. This analysis showed that firmness of fruit and flesh was positively correlated with phenolic content, antioxidant activity, and reducing sugar content. Conversely, colour and fruit weight showed a strong negative correlation with phenolic content and reducing sugars. Singh, Singh [7] proposed that the firmness of mangoes is intricately linked to the ripening process, which considerably influences the chemical composition of the skin. Hard mangoes generally exhibit higher levels of phenolics, fibres, and chlorophyll, resulting in a distinct nutrient composition compared to softer, mature mangoes, which display increased concentrations of carotenoids, sugars, and moisture content.

4. Conclusions

This study highlighted the physiological and physicochemical characteristics, including size, firmness, and colour of various mango cultivars at the over-ripe stage, as well as their chemical profiles. A correlation was established between the physiological, physicochemical, and chemical profiles. The findings indicated that mango peel possesses significant carbohydrate and dietary fibre contents, as well as elevated levels of bioactive compounds, including phenolics and flavonoids, which were shown to correlate with antioxidant potential, as evidenced by ABTS, DPPH, and FRAP assays. These chemicals can also be used in nutritional supplements, cosmetics, and medications, which provide diverse health advantages. Furthermore, a partial least squares (PLS) model revealed that the flesh firmness exhibited a positive correlation with the total phenolic content, total flavonoid content, gallic acid, catechin, epicatechin, caffeic acid, p-coumaric acid and rosmarinnic acid. In line with the heatmap analysis, the firmness of fruit and flesh was positively correlated with phenolic content, antioxidant activity, and reducing sugar content. Consequently, this study provides a foundation for understanding physiological markers that could enable rapid assessment of recovery of valuable added components in the biorefinery process of the mango industry. Mango peel may serve as a substantial source of bioactive chemicals. This new source has the potential to serve as a functional food or a value-added product.

Author Contributions

Conceptualisation, S.R.S. and P.S.; validation, S.R.S. and P.S.; formal analysis, P.S. and P.C.; writing—original draft preparation, P.S. and P.C.; writing—review and editing, S.R.S., P.S., L.L., P.R., W.R., Y.P., C.L., H.-H.C., T.T., D.S. and D.G.; visualisation, S.R.S. and P.S.; supervision, S.R.S. and P.S.; and project administration, S.R.S. and P.S. All authors have read and agreed to the published version of the manuscript.

Funding

This research project was partially supported by Chiang Mai University.

Data Availability Statement

The original contributions presented in the study are included in the article, further inquiries can be directed to the corresponding authors.

Acknowledgments

P.C., S.R.S. and P.S. thank Chiang Mai University, Thailand, for the support and infrastructure provided for the conduct of this research. This research project was partially supported by Chiang Mai University. In addition, this research was partially supported by the Program Management Unit for Competitiveness (PMUC), NXPO. This research work was also partially supported by the Thailand Research Fund (TRF) Research Team Promotion Grant, RTA, Senior Research Scholar (N42A671052).

Conflicts of Interest

The authors declare no conflicts of interest. The funders had no role in the design of the study, in the collection, analyses, or interpretation of data, in the writing of the manuscript, or in the decision to publish the results.

References

  1. FAO. Major Tropical Fruits—Preliminary Results 2022; Food and Agriculture Organization of the United Nations: Rome, Italy, 2022. [Google Scholar]
  2. Madalageri, D.; Bharati, P.; Orsat, V.; Raghavan, V.; Kage, U. Antioxidant activity in pulp and peel of three mango varieties. J. Hortic. Sci. 2015, 10, 199–209. [Google Scholar] [CrossRef]
  3. Rahman, M.S. Handbook of Food Preservation; CRC Press: Boca Raton, FL, USA, 2020. [Google Scholar]
  4. Sagar, V.; Khurdiya, D.; Balakrishnan, K. Quality of dehydrated ripe mango slices as affected by packaging material and mode of packaging. J. Food Sci. Technol. 1999, 36, 67–70. [Google Scholar]
  5. Pott, I.; Konrad, S.; Scherer, R.; Wiriyacharee, P.; Mühlbauer, W. Quality of five Thai mango cultivars (Mangifera indica L.) using a solar drying system. CMU J. 2004, 3, 189–198. [Google Scholar]
  6. Litz Richard, E. (Ed.) The Mango: Botany, Production and Uses; Cabi: Preston, UK, 2009. [Google Scholar]
  7. Singh, Z.; Singh, R.K.; Sane, V.A.; Nath, P. Mango-postharvest biology and biotechnology. Crit. Rev. Plant Sci. 2013, 32, 217–236. [Google Scholar] [CrossRef]
  8. Spreer, W.; Ongprasert, S.; Hegele, M.; Wünsche, J.N.; Müller, J. Yield and fruit development in mango (Mangifera indica L. cv. Chok Anan) under different irrigation regimes. Agric. Water Manag. 2009, 96, 574–584. [Google Scholar] [CrossRef]
  9. Wongkaew, M.; Tinpovong, B.; Sringarm, K.; Leksawasdi, N.; Jantanasakulwong, K.; Rachtanapun, P.; Hanmoungjai, P.; Sommano, S.R. Crude pectic oligosaccharide recovery from Thai Chok Anan mango peel using pectinolytic enzyme hydrolysis. Foods 2021, 10, 627. [Google Scholar] [CrossRef]
  10. Kaur, M.; Singh, N.; Sandhu, K.S.; Guraya, H.S. Physicochemical, morphological, thermal and rheological properties of starches separated from kernels of some Indian mango cultivars (Mangifera indica L.). Food Chem. 2004, 85, 131–140. [Google Scholar] [CrossRef]
  11. Maldonado-Celis, M.E.; Yahia, E.M.; Bedoya, R.; Landázuri, P.; Loango, N.; Aguillón, J.; Restrepo, B.; Guerrero Ospina, J.C. Chemical composition of mango (Mangifera indica L.) fruit: Nutritional and phytochemical compounds. Front. Plant Sci. 2019, 10, 1073. [Google Scholar] [CrossRef]
  12. Serna-Cock, L.; García-Gonzales, E.; Torres-León, C. Agro-industrial potential of the mango peel based on its nutritional and functional properties. Food Rev. Int. 2016, 32, 364–376. [Google Scholar] [CrossRef]
  13. Rumainum, I.M.; Worarad, K.; Srilaong, V.; Yamane, K. Fruit quality and antioxidant capacity of six Thai mango cultivars. Agric. Nat. Resour. 2018, 52, 208–214. [Google Scholar] [CrossRef]
  14. Hussain, S.; Jõudu, I.; Bhat, R. Dietary fiber from underutilized plant resources—A positive approach for valorization of fruit and vegetable wastes. Sustainability 2020, 12, 5401. [Google Scholar] [CrossRef]
  15. Ajila, C.; Aalami, M.; Leelavathi, K.; Rao, U.P. Mango peel powder: A potential source of antioxidant and dietary fiber in macaroni preparations. Innov. Food Sci. Emerg. Technol. 2010, 11, 219–224. [Google Scholar] [CrossRef]
  16. Kim, H.; Moon, J.Y.; Kim, H.; Lee, D.-S.; Cho, M.; Choi, H.-K.; Kim, Y.S.; Mosaddik, A.; Cho, S.K. Antioxidant and antiproliferative activities of mango (Mangifera indica L.) flesh and peel. Food Chem. 2010, 121, 429–436. [Google Scholar] [CrossRef]
  17. Ali, S.; Hossain, M.; Zakaria, M.; Haque, M.; Ahiduzzaman, M. Physio-chemical Characteristics of Seven Cultivars Mango (Mangifera indica L.) in Bangladesh. Int. J. Bus. Soc. Sci. Res 2019, 7, 01–08. [Google Scholar]
  18. Bora, L.; Singh, A.; Singh, C. Characterization of mango (Mangifera indica L.) genotypes based on physio-chemical quality attributes. J. Appl. Nat. Sci. 2017, 9, 2199–2204. [Google Scholar] [CrossRef]
  19. Wongkaew, M.; Sangta, J.; Chansakaow, S.; Jantanasakulwong, K.; Rachtanapun, P.; Sommano, S.R. Volatile profiles from over-ripe purée of Thai mango varieties and their physiochemical properties during heat processing. PLoS ONE 2021, 16, e0248657. [Google Scholar] [CrossRef]
  20. Tangpao, T.; Phuangsaujai, N.; Kittiwachana, S.; George, D.R.; Krutmuang, P.; Chuttong, B.; Sommano, S.R. Evaluation of Markers Associated with Physiological and Biochemical Traits during Storage of ‘Nam Dok Mai Si Thong’ Mango Fruits. Agriculture 2022, 12, 1407. [Google Scholar] [CrossRef]
  21. Wongkaew, M.; Kittiwachana, S.; Phuangsaijai, N.; Tinpovong, B.; Tiyayon, C.; Pusadee, T.; Chuttong, B.; Sringarm, K.; Bhat, F.M.; Sommano, S.R. Fruit characteristics, peel nutritional compositions, and their relationships with mango peel pectin quality. Plants 2021, 10, 1148. [Google Scholar] [CrossRef]
  22. Larrauri, J.A.; Rupérez, P.; Saura-Calixto, F. Mango peel fibres with antioxidant activity. Z. Für Leb. Und-Forsch. A 1997, 205, 39–42. [Google Scholar] [CrossRef]
  23. International, A. Official Methods of Analysis of the Association of Official Analytical Chemists; Association of Official Analytical Chemists: Rockville, MD, USA, 1970. [Google Scholar]
  24. Ihekoronye, A.I.; Ngoddy, P.O. Integrated Food Science and Technology for the Tropics; Macmillan: London, UK, 1985. [Google Scholar]
  25. Sunanta, P.; Kontogiorgos, V.; Leksawasdi, N.; Phimolsiripol, Y.; Wangtueai, S.; Wongkaew, M.; Sommano, S.R. Loss Assessment during Postharvest and Handling of Thai Garlic Used for Processing. Horticulturae 2023, 9, 482. [Google Scholar] [CrossRef]
  26. Sunanta, P.; Pankasemsuk, T.; Jantanasakulwong, K.; Chaiyaso, T.; Leksawasdi, N.; Phimolsiripol, Y.; Rachtanapun, P.; Seesuriyachan, P.; Sommano, S.R. Does Curing Moisture Content Affect Black Garlic Physiochemical Quality? Horticulturae 2021, 7, 535. [Google Scholar] [CrossRef]
  27. Sunanta, P.; Rachtanapun, P.; Jantanasakulwong, K.; Sommano, S. Antioxidant potential and quality traits of black garlic from microwave heating and hot steam incubation. In Proceedings of the V Asia Symposium on Quality Management in Postharvest Systems 1336, Bangkok, Thailand, 1 December 2021. [Google Scholar]
  28. Deineka, V.; Oleinits, E.Y.; Kul’chenko, Y.Y.; Blinova, I.; Deineka, L. Control of the Selectivity of Separation and the Determination of Anthocyanins of Fruits of Vaccinium Family Plants Using Acetonitrile–Formic Acid–Water Eluents. J. Anal. Chem. 2020, 75, 1443–1450. [Google Scholar] [CrossRef]
  29. Ramirez, J.E.; Zambrano, R.; Sepúlveda, B.; Simirgiotis, M.J. Antioxidant properties and hyphenated HPLC-PDA-MS profiling of Chilean Pica mango fruits (Mangifera indica L. Cv. piqueño). Molecules 2013, 19, 438–458. [Google Scholar] [CrossRef] [PubMed]
  30. Marcillo-Parra, V.; Anaguano, M.; Molina, M.; Tupuna-Yerovi, D.S.; Ruales, J. Characterization and quantification of bioactive compounds and antioxidant activity in three different varieties of mango (Mangifera indica L.) peel from the Ecuadorian region using HPLC-UV/VIS and UPLC-PDA. NFS J. 2021, 23, 1–7. [Google Scholar] [CrossRef]
  31. Sunanta, P.; Chung, H.H.; Kunasakdakul, K.; Ruksiriwanich, W.; Jantrawut, P.; Hongsibsong, S.; Sommano, S.R. Genomic relationship and physiochemical properties among raw materials used for Thai black garlic processing. Food Sci. Nutr. 2020, 8, 4534–4545. [Google Scholar] [CrossRef]
  32. Prasad, S.K.; Veeresh, P.M.; Ramesh, P.S.; Natraj, S.M.; Madhunapantula, S.V.; Devegowda, D. Phytochemical fractions from Annona muricata seeds and fruit pulp inhibited the growth of breast cancer cells through cell cycle arrest at G0/G1 phase. J. Cancer Res. Ther. 2020, 16, 1235–1249. [Google Scholar]
  33. Gillaspy, G.; Ben-David, H.; Gruissem, W. Fruits: A developmental perspective. Plant Cell 1993, 5, 1439. [Google Scholar] [CrossRef]
  34. Harper, J.L.; Lovell, P.; Moore, K. The shapes and sizes of seeds. Annu. Rev. Ecol. Syst. 1970, 1, 327–356. [Google Scholar] [CrossRef]
  35. Negi, P.S.; Handa, A.K. Structural deterioration of the produce: The breakdown of cell wall components. Postharvest Biol. Technol. Fruits Veg. Flowers 2008, 978, 0-8138. [Google Scholar]
  36. Baloch, M.; Bibi, F. Effect of harvesting and storage conditions on the post harvest quality and shelf life of mango (Mangifera indica L.) fruit. S. Afr. J. Bot. 2012, 83, 109–116. [Google Scholar] [CrossRef]
  37. Mannan, M.; Khan, S.; Islam, M.; Islam, M.S.; Siddiqa, A. A study on the physico-chemical characteristics of some mango varieties in Khulna region. Pak. J. Biol. Sci. 2003, 6, 2034–2039. [Google Scholar] [CrossRef]
  38. Padda, M.S.; do Amarante, C.V.; Garcia, R.M.; Slaughter, D.C.; Mitcham, E.J. Methods to analyze physico-chemical changes during mango ripening: A multivariate approach. Postharvest Biol. Technol. 2011, 62, 267–274. [Google Scholar] [CrossRef]
  39. Mitcham, E.J.; McDonald, R.E. Cell wall modification during ripening of ‘Keitt’ and ‘Tommy Atkins’ mango fruit. J. Am. Soc. Hortic. Sci. 1992, 117, 919–924. [Google Scholar] [CrossRef]
  40. Kullaj, E. New insights on postharvest ecophysiology of fresh horticultural crops. In Eco-Friendly Technology for Postharvest Produce Quality; Elsevier: Amsterdam, The Netherlands, 2016; pp. 1–38. [Google Scholar]
  41. Karanjalker, G.; Ravishankar, K.; Shivashankara, K.; Dinesh, M.; Roy, T.; Sudhakar Rao, D. A study on the expression of genes involved in carotenoids and anthocyanins during ripening in fruit peel of green, yellow, and red colored mango cultivars. Appl. Biochem. Biotechnol. 2018, 184, 140–154. [Google Scholar] [CrossRef]
  42. Liu, B.; Xin, Q.; Zhang, M.; Chen, J.; Lu, Q.; Zhou, X.; Li, X.; Zhang, W.; Feng, W.; Pei, H. Research progress on mango post-harvest ripening physiology and the regulatory technologies. Foods 2022, 12, 173. [Google Scholar] [CrossRef]
  43. Geerkens, C.H.; Nagel, A.; Just, K.M.; Miller-Rostek, P.; Kammerer, D.R.; Schweiggert, R.M.; Carle, R. Mango pectin quality as influenced by cultivar, ripeness, peel particle size, blanching, drying, and irradiation. Food Hydrocoll. 2015, 51, 241–251. [Google Scholar] [CrossRef]
  44. Ali, S.; Zahid, N.; Nawaz, A.; Naz, S.; Ejaz, S.; Ullah, S.; Siddiq, B. Tragacanth gum coating suppresses the disassembly of cell wall polysaccharides and delays softening of harvested mango (Mangifera indica L.) fruit. Int. J. Biol. Macromol. 2022, 222, 521–532. [Google Scholar] [CrossRef] [PubMed]
  45. Tharanathan, R.; Yashoda, H.; Prabha, T. Mango (Mangifera indica L.), “The king of fruits”—An overview. Food Rev. Int. 2006, 22, 95–123. [Google Scholar] [CrossRef]
  46. De Girolamo, A.; Cortese, M.; Cervellieri, S.; Lippolis, V.; Pascale, M.; Logrieco, A.F.; Suman, M. Tracing the Geographical Origin of Durum Wheat by FT-NIR Spectroscopy. Foods 2019, 8, 450. [Google Scholar] [CrossRef] [PubMed]
  47. Sánchez-Camargo, A.d.P.; Gutiérrez, L.-F.; Vargas, S.M.; Martinez-Correa, H.A.; Parada-Alfonso, F.; Narváez-Cuenca, C.-E. Valorisation of mango peel: Proximate composition, supercritical fluid extraction of carotenoids, and application as an antioxidant additive for an edible oil. J. Supercrit. Fluids 2019, 152, 104574. [Google Scholar] [CrossRef]
  48. Onuh, J.O.; Momoh, G.; Egwujeh, S.; Onuh, F. Evaluation of the nutritional, phytochemical and antioxidant properties of the peels of some selected mango varieties. Am. J. Food Sci. Technol. 2017, 5, 176–181. [Google Scholar] [CrossRef]
  49. Giraldo, L.M.; Correa, H.M.; Gutiérrez, J.B.; Castano, C.C. Aprovechamiento del residuo agroindustrial del mango común (Mangifera indica L.) en la obtención de azúcares fermentables. Ing. Y Cienc. 2007, 3, 41–62. [Google Scholar]
  50. Dar, M.S.; Oak, P.; Chidley, H.; Deshpande, A.; Giri, A.; Gupta, V. Nutrient and flavor content of mango (Mangifera indica L.) cultivars: An appurtenance to the list of staple foods. In Nutritional Composition of Fruit Cultivars; Elsevier: Amsterdam, The Netherlands, 2016; pp. 445–467. [Google Scholar]
  51. Yahia, E.M. Postharvest Biology and Technology of Tropical and Subtropical Fruits: Fundamental Issues; Elsevier: Amsterdam, The Netherlands, 2011. [Google Scholar]
  52. Baddi, J.; Vijayalakshmi, D.; Durgannavar, N.A.; Chandru, R. Mango peel: A potential source of natural bioactive phyto-nutrients in functional food. Asian J. Dairy Food Res. 2015, 34, 75–77. [Google Scholar] [CrossRef]
  53. de Lourdes García-Magaña, M.; García, H.S.; Bello-Pérez, L.A.; Sáyago-Ayerdi, S.G.; de Oca, M.M.-M. Functional properties and dietary fiber characterization of mango processing by-products (Mangifera indica L., cv Ataulfo and Tommy Atkins). Plant Foods Hum. Nutr. 2013, 68, 254–258. [Google Scholar] [CrossRef]
  54. Kumar, I.; Yadav, P.; Gautam, M.; Panwar, H. Impact of Heat on Naturally Present Digestive Enzymes in Food. Int. J. Food Nutr. Diet 2022, 10, 57–63. [Google Scholar]
  55. Singh, R.; Singh, P.; Pathak, N.; Singh, V.; Dwivedi, U.N. Modulation of mango ripening by chemicals: Physiological and biochemical aspects. Plant Growth Regul. 2007, 53, 137–145. [Google Scholar] [CrossRef]
  56. Grauzdytė, D. Phytochemical Composition and In Vitro Bioactivity of Low Investigated Phyllanthus phillyreifolius and Aphloia theiformis Plant Species Indigenous to Reunion Island. Ph.D. Thesis, Kauno Technologijos Universitetas, Kaunas, Lithuania, 2020. [Google Scholar]
  57. Berardini, N.; Knödler, M.; Schieber, A.; Carle, R. Utilization of mango peels as a source of pectin and polyphenolics. Innov. Food Sci. Emerg. Technol. 2005, 6, 442–452. [Google Scholar] [CrossRef]
  58. Ajila, C.; Naidu, K.; Bhat, S.; Rao, U.P. Bioactive compounds and antioxidant potential of mango peel extract. Food Chem. 2007, 105, 982–988. [Google Scholar] [CrossRef]
  59. Kamtekar, S.; Keer, V.; Patil, V. Estimation of phenolic content, flavonoid content, antioxidant and alpha amylase inhibitory activity of marketed polyherbal formulation. J. Appl. Pharm. Sci. 2014, 4, 061–065. [Google Scholar]
  60. Kothalawala, S.; Yatiwella, L. Analysis of antioxidant activities in Mango Peel among different Sri Lankan Cultivars. J. Pharmacogn. Phytochem. 2018, 7, 1668–1671. [Google Scholar]
  61. Vélez-Erazo, E.M.; Pasquel-Reátegui, J.L.; Dorronsoro-Guerrero, O.H.; Martínez-Correa, H.A. Phenolics and carotenoids recovery from agroindustrial mango waste using microwave-assisted extraction: Extraction and modeling. J. Food Process Eng. 2021, 44, e13774. [Google Scholar] [CrossRef]
  62. Sultana, B.; Hussain, Z.; Asif, M.; Munir, A. Investigation on the antioxidant activity of leaves, peels, stems bark, and kernel of mango (Mangifera indica L.). J. Food Sci. 2012, 77, C849–C852. [Google Scholar] [CrossRef]
  63. Anal, A.K. Food processing by-products. In Handbook of Plant Food Phytochemicals: Sources, Stability and Extraction; John Wiley & Sons, Ltd.: Hoboken, NJ, USA, 2013; pp. 180–197. [Google Scholar]
  64. Pinsirodom, P.; Taprap, R.; Parinyapatthanaboot, T. Antioxidant activity and phenolic acid composition in different parts of selected cultivars of mangoes in Thailand. Int. Food Res. J. 2018, 25, 1435–1443. [Google Scholar]
  65. Liu, F.-X.; Fu, S.-F.; Bi, X.-F.; Chen, F.; Liao, X.-J.; Hu, X.-S.; Wu, J.-H. Physico-chemical and antioxidant properties of four mango (Mangifera indica L.) cultivars in China. Food Chem. 2013, 138, 396–405. [Google Scholar] [CrossRef] [PubMed]
  66. Schieber, A.; Ullrich, W.; Carle, R. Characterization of polyphenols in mango puree concentrate by HPLC with diode array and mass spectrometric detection. Innov. Food Sci. Emerg. Technol. 2000, 1, 161–166. [Google Scholar] [CrossRef]
  67. Lebaka, V.R.; Wee, Y.-J.; Ye, W.; Korivi, M. Nutritional composition and bioactive compounds in three different parts of mango fruit. Int. J. Environ. Res. Public Health 2021, 18, 741. [Google Scholar] [CrossRef] [PubMed]
  68. Abbasi, A.M.; Guo, X.; Fu, X.; Zhou, L.; Chen, Y.; Zhu, Y.; Yan, H.; Liu, R.H. Comparative assessment of phenolic content and in vitro antioxidant capacity in the pulp and peel of mango cultivars. Int. J. Mol. Sci. 2015, 16, 13507–13527. [Google Scholar] [CrossRef]
  69. Ma, X.; Wu, H.; Liu, L.; Yao, Q.; Wang, S.; Zhan, R.; Xing, S.; Zhou, Y. Polyphenolic compounds and antioxidant properties in mango fruits. Sci. Hortic. 2011, 129, 102–107. [Google Scholar] [CrossRef]
  70. Rice-Evans, C.; Miller, N.; Paganga, G. Antioxidant properties of phenolic compounds. Trends Plant Sci. 1997, 2, 152–159. [Google Scholar] [CrossRef]
  71. Dangles, O. Antioxidant activity of plant phenols: Chemical mechanisms and biological significance. Curr. Org. Chem. 2012, 16, 692–714. [Google Scholar] [CrossRef]
  72. Rojas, R.; Contreras-Esquivel, J.C.; Orozco-Esquivel, M.T.; Muñoz, C.; Aguirre-Joya, J.A.; Aguilar, C.N. Mango peel as source of antioxidants and pectin: Microwave assisted extraction. Waste Biomass Valorization 2015, 6, 1095–1102. [Google Scholar] [CrossRef]
  73. Kuganesan, A.; Thiripuranathar, G.; Navaratne, A.; Paranagama, P. Antioxidant and anti-inflammatory activities of peels, pulps and seed kernels of three common mango (Mangifera indical L.) varieties in Sri Lanka. Int. J. Pharm. Sci. Res. 2017, 8, 70. [Google Scholar]
  74. Xie, J.; Schaich, K. Re-evaluation of the 2, 2-diphenyl-1-picrylhydrazyl free radical (DPPH) assay for antioxidant activity. J. Agric. Food Chem. 2014, 62, 4251–4260. [Google Scholar] [CrossRef] [PubMed]
  75. Jiménez-Escrig, A.; Jiménez-Jiménez, I.; Sánchez-Moreno, C.; Saura-Calixto, F. Evaluation of free radical scavenging of dietary carotenoids by the stable radical 2, 2-diphenyl-1-picrylhydrazyl. J. Sci. Food Agric. 2000, 80, 1686–1690. [Google Scholar] [CrossRef]
  76. Parcheta, M.; Świsłocka, R.; Orzechowska, S.; Akimowicz, M.; Choińska, R.; Lewandowski, W. Recent developments in effective antioxidants: The structure and antioxidant properties. Materials 2021, 14, 1984. [Google Scholar] [CrossRef]
  77. Gulcin, İ.; Alwasel, S.H. DPPH radical scavenging assay. Processes 2023, 11, 2248. [Google Scholar] [CrossRef]
  78. Foti, M.C. Use and Abuse of the DPPH• Radical. J. Agric. Food Chem. 2015, 63, 8765–8776. [Google Scholar] [CrossRef]
  79. Charles, D.J. Antioxidant Properties of Spices, Herbs and Other Sources; Springer Science & Business Media: Berlin/Heidelberg, Germany, 2012. [Google Scholar]
  80. Dudonne, S.; Vitrac, X.; Coutiere, P.; Woillez, M.; Mérillon, J.-M. Comparative study of antioxidant properties and total phenolic content of 30 plant extracts of industrial interest using DPPH, ABTS, FRAP, SOD, and ORAC assays. J. Agric. Food Chem. 2009, 57, 1768–1774. [Google Scholar] [CrossRef]
  81. Castañeda-Valbuena, D.; Ayora-Talavera, T.; Luján-Hidalgo, C.; Álvarez-Gutiérrez, P.; Martínez-Galero, N.; Meza-Gordillo, R. Ultrasound extraction conditions effect on antioxidant capacity of mango by-product extracts. Food Bioprod. Process. 2021, 127, 212–224. [Google Scholar] [CrossRef]
  82. Khammuang, S.; Sarnthima, R. Antioxidant and antibacterial activities of selected varieties of Thai mango seed extract. Pak. J. Pharm. Sci. 2011, 24, 37–42. [Google Scholar]
  83. Singh, A.; Tyagi, M.; Singh, C. Studies on morphology and physical attributes of mango varieties. Int. J. Curr. Microbiol. Appl. Sci 2017, 6, 2324–2330. [Google Scholar] [CrossRef]
  84. Ahmed, T.H.M.; Mohamed, Z.M.A. Diversity of Mango (Mangifera indica L.) cultivars in Shendi area: Morphological fruit characterization. Int. J. Res. Agric. Sci. 2015, 2, 2348–3997. [Google Scholar]
  85. Tsao, R. Chemistry and biochemistry of dietary polyphenols. Nutrients 2010, 2, 1231–1246. [Google Scholar] [CrossRef] [PubMed]
  86. Wong, K.K.-K. Partial least squares structural equation modeling (PLS-SEM) techniques using SmartPLS. Mark. Bull. 2013, 24, 1–32. [Google Scholar]
  87. Jahurul, M.; Zaidul, I.; Ghafoor, K.; Al-Juhaimi, F.Y.; Nyam, K.-L.; Norulaini, N.; Sahena, F.; Omar, A.M. Mango (Mangifera indica L.) by-products and their valuable components: A review. Food Chem. 2015, 183, 173–180. [Google Scholar] [CrossRef] [PubMed]
  88. Muralidhara, B.; Veena, G.; Bhattacherjee, A.; Rajan, S. Antioxidants in ripe peel and pulp of twelve mango (Mangifera indica) cultivars. Indian J. Agric. Sci. 2019, 89, 1580–1584. [Google Scholar] [CrossRef]
  89. Doughty, C.E.; Asner, G.P.; Martin, R.E. Predicting tropical plant physiology from leaf and canopy spectroscopy. Oecologia 2011, 165, 289–299. [Google Scholar] [CrossRef]
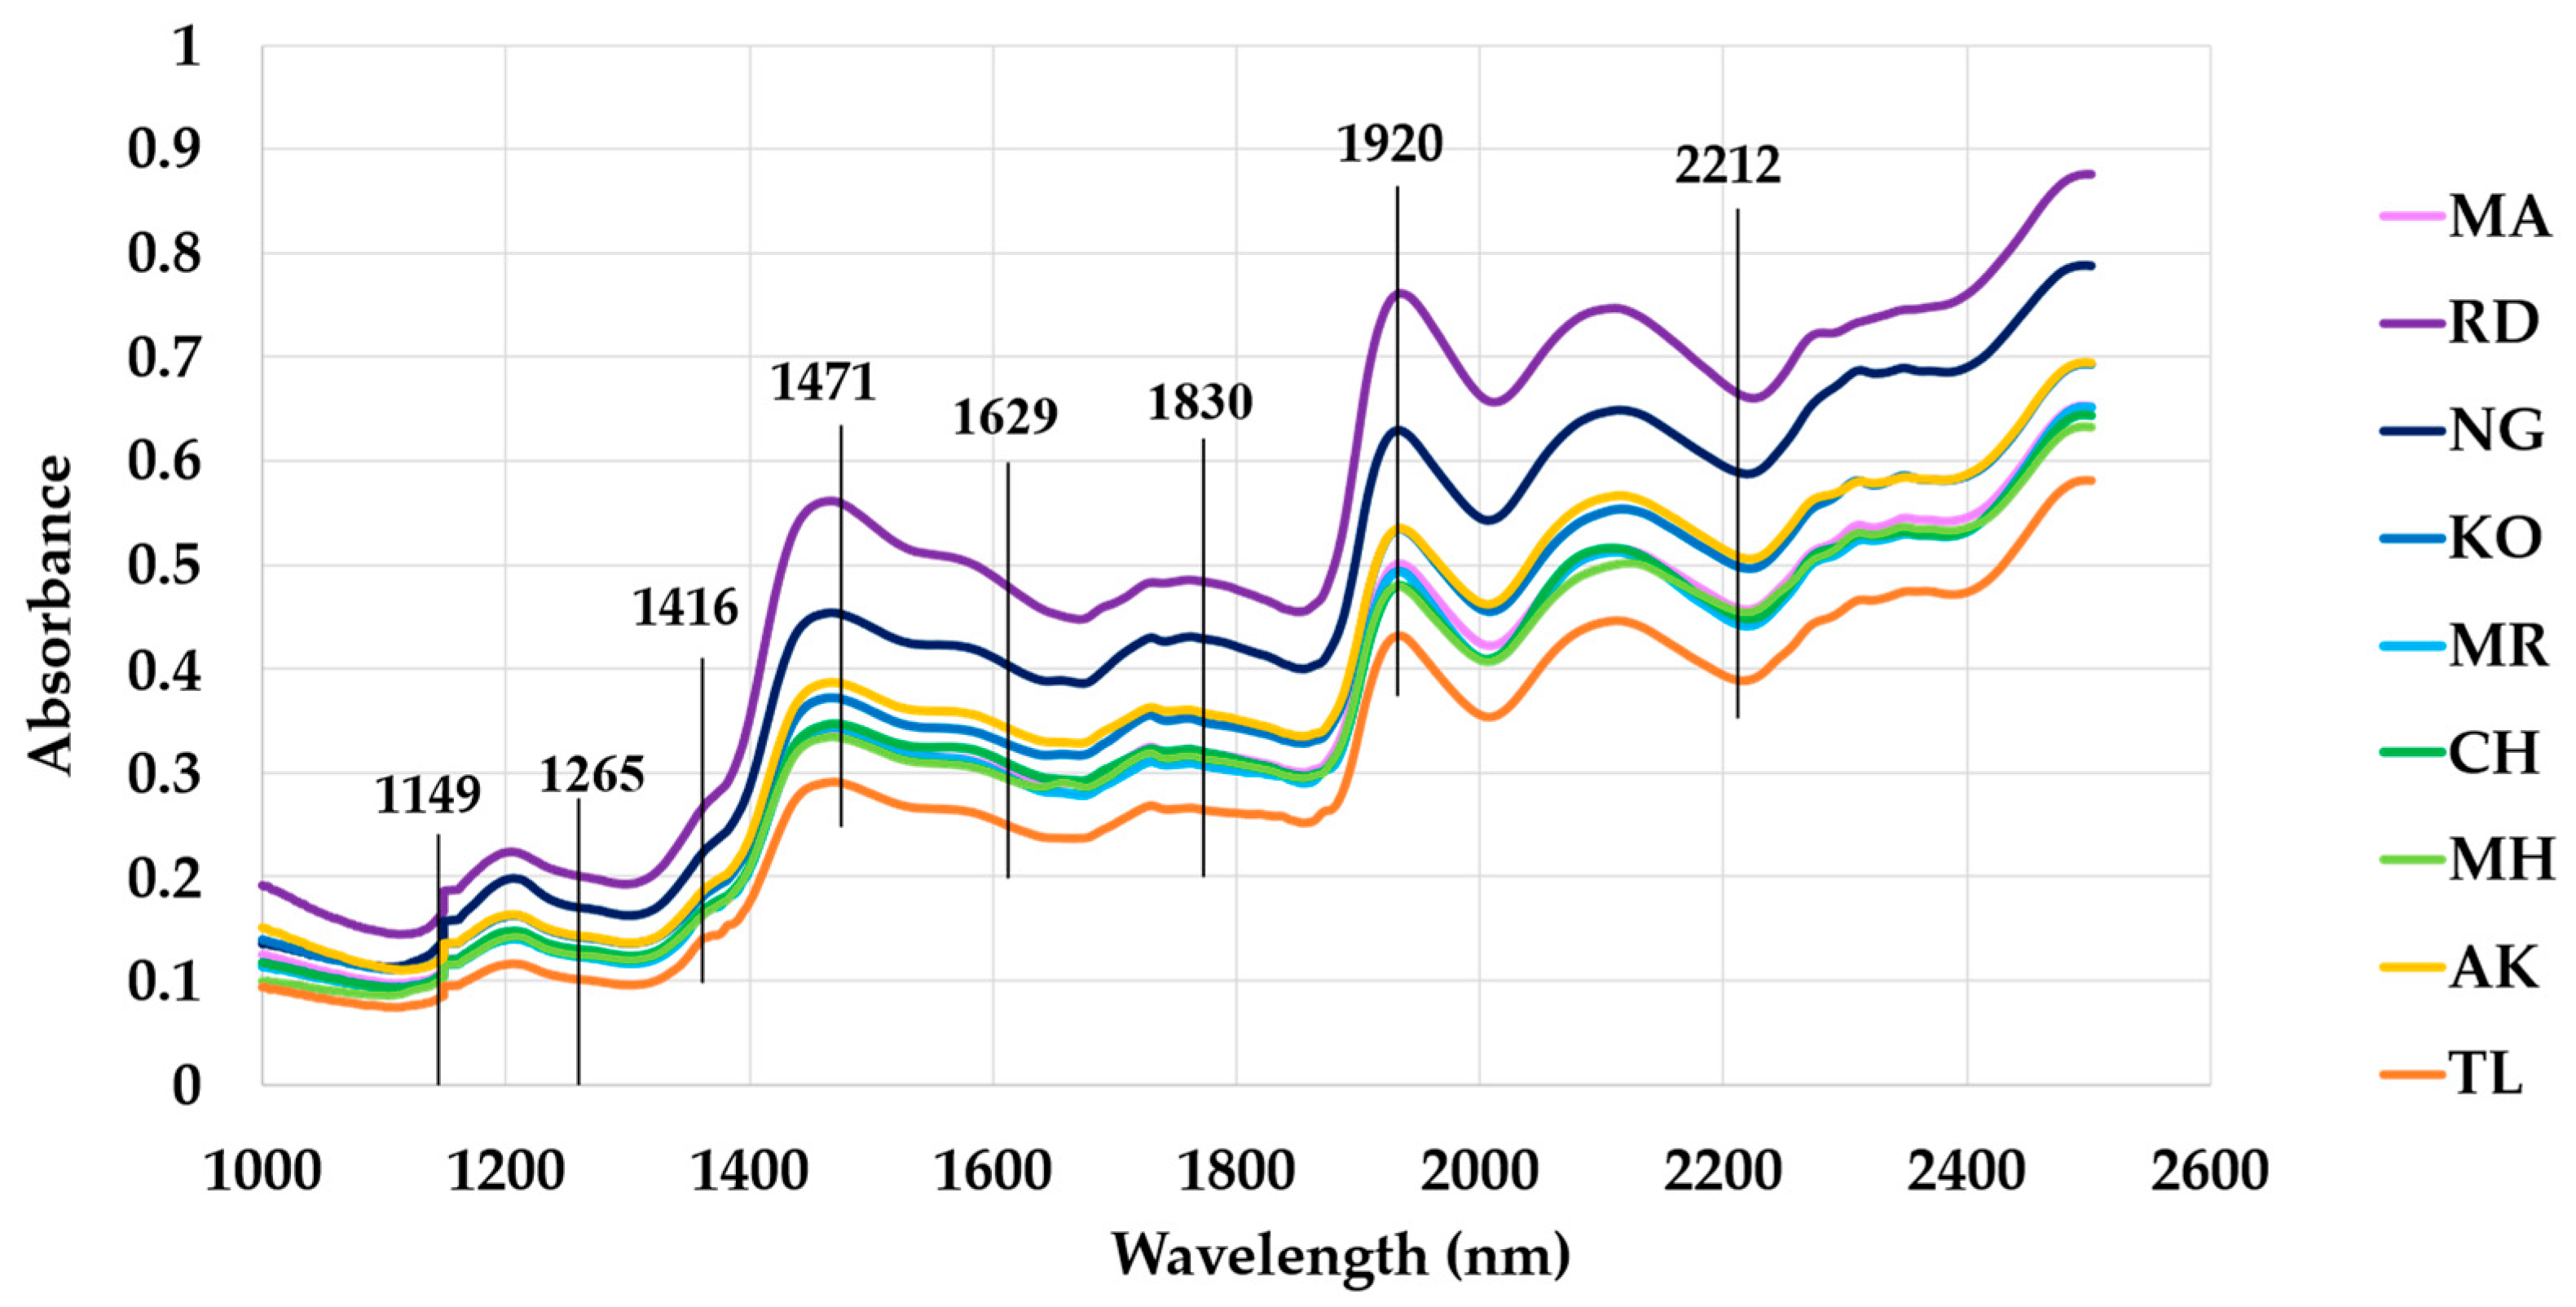
Figure 1. Diffuse reflectance spectra by NIR of different mango cultivars. (MA = Mam kamdang, RD = Rad, NG = Nga, KO = Kam, MR = Morrakot, CH = Chok anan, MH = Mahachanok, AK = Ok rong, and TL = Talab nak).
Horticulturae 10 01036 g001
Figure 2. The chemometric PAC biplot based on Thai mango cultivars and chemical characteristics of Thai mango cultivars (A) and their dendrogram analysis (B); MA = Mam kamdang, RD = Rad, NG = Nga, KO = Kam, MR = Morrakot, CH = Chok anan, MH = Mahachanok, AK = Ok rong, and TL = Talab nak.
Horticulturae 10 01036 g002
Figure 3. The chemometric PAC biplot based on Thai mango cultivars and the chemical characteristics of Thai mango cultivars (A) and their dendrogram analysis (B); the score plot clustering between the NIR spectrum of mango peel powder (C) and heatmap analysis of the NIR patterns (D). MA = Mam kamdang, RD = Rad, NG = Nga, KO = Kam, MR = Morrakot, CH = Chok anan, MH = Mahachanok, AK = Ok rong, and TL = Talab nak.
Horticulturae 10 01036 g003aHorticulturae 10 01036 g003b
Figure 4. Empirical correlation matrix of the physical and chemical parameters of mangoes. (AH) indicate the correlations among weight (A), fruit ratio (B), fruit hardness (C), flesh firmness (D), pH (E), L value (F), a* value (G), and b* value (H) of mango fruit with their chemical components. 1 = DNS; 2 = total phenolic content; 3 = total flavonoid content; 4 = ABTS; 5 = DPPH; 6 = FRAP; 7 = gallic acid; 8 = catechin; 9 = epicatechin; 10 = caffeic acid; 11 = naringin; 12 = p-coumeric acid; 13 = rosmarinnic acid; 14 = vanillin acid; 15 = o-coumeric acid; 16 = crude protein; 17 = moisture content; 18 = crude fat; 19 = crude fibre; 20 = crude ash; 21 = carbohydrate.
Horticulturae 10 01036 g004
Figure 5. Heatmap analysis of the correlation coefficient between physicochemical and chemical composition of mango peels.
Horticulturae 10 01036 g005
Table 1. Physiological and physicochemical characteristics of different Thai mango cultivars.
ParameterMARDNGKOMRCHMHAKTL
Horticulturae 10 01036 i001Horticulturae 10 01036 i002Horticulturae 10 01036 i003Horticulturae 10 01036 i004Horticulturae 10 01036 i005Horticulturae 10 01036 i006Horticulturae 10 01036 i007Horticulturae 10 01036 i008Horticulturae 10 01036 i009
Physiological characteristics
Width (cm)62.99 ± 1.69 d73.54 ± 1.16 e53.06 ± 3.14 b44.90 ± 0.69 a58.02 ± 0.38 c65.61 ± 0.88 d65.63 ± 0.19 d57.43 ± 1.63 c61.20 ± 0.91 cd
Length (cm)79.94 ± 2.38 a119.35 ± 1.82 d129.31 ± 5.90 e80.69 ± 1.64 a101.79 ± 2.66 bc105.83 ± 2.17 c162.58 ± 4.26 f96.25 ± 2.23 b102.06 ± 1.63 c
Length to width ratio1.27 ± 0.03 a1.63 ± 0.03 b2.44 ± 0.07 f1.80 ± 0.03 d1.76 ± 0.05 cd1.61 ± 0.02 b2.48 ± 0.04 f1.68 ± 0.02 bc1.67 ± 0.02 bc
Weight (g)171.65 ± 9.95 b166.22 ± 13.60 b301.44 ± 8.74 e87.22 ± 4.46 a176.11 ± 6.26 bc206.78 ± 9.47 c379.33 ± 17.38 f176.44 ± 10.04 bc246.00 ± 13.61 d
Fruit firmness (N)2.24 ± 0.03 b1.90 ± 0.07 a3.50 ± 0.11 e1.89 ± 0.05 a2.93 ± 0.04 d2.55 ± 0.07 c2.70 ± 0.06 c2.10 ± 0.08 b3.05 ± 0.09 d
Flesh firmness (N)0.45C0.04 ab0.43 ± 0.03 ab1.45 ± 0.08 d0.35 ± 0.02 a0.90 ± 0.13 c0.82 ± 0.03 c0.54 ± 0.05 b0.81 ± 0.05 c0.61 ± 0.06 b
Physicochemical characteristics
L*59.69 ± 0.77 c63.87 ± 0.62 d59.61 ± 0.96 c50.54 ± 1.18 b40.30 ± 0.88 a68.26 ± 0.57 e69.07 ± 1.12 e59.61 ± 1.71 c52.62 ± 0.65 b
a*14.76 ± 1.25 e2.03 ± 0.69 c−6.00 ± 1.36 b−5.86 ± 1.44 b4.69 ± 1.66 c8.71 ± 0.46 d10.93 ± 0.57 d−10.12 ± 1.31 a−6.67 ± 1.35 b
b*51.63 ± 1.49 e44.77 ± 0.89 d46.01 ± 2.53 d29.66 ± 1.40 b18.65 ± 1.28 a51.50 ± 0.67 e48.72 ± 1.01 de33.40 ± 1.38 bc34.94 ± 0.91 c
pH4.65 ± 0.07 c4.66 ± 0.03 c4.78 ± 0.01 de4.30 ± 0.01 a4.84 ± 0.03 e4.56 ± 0.02 b4.52 ± 0.01 b4.67 ± 0.02 c4.72 ± 0.01 cd
L* = lightness, a* = red–green value, b* = blue–yellow value, Cultivars of Mango peel including MA = Mam kamdang, RD = Rad, NG = Nga, KO = Kam, MR = Morrakot, CH = Chok anan, MH = Mahachanok, AK = Ok rong, and TL = Talab nak. Values are means (n = 9) ± standard error, and the various superscript letters are significantly different in each row according to Duncan’s multiple range test (p < 0.05).
Table 2. Chemical characteristics of mango peel.
Chemical CharacteristicsMARDNGKOMRCHMHAKTL
Proximal contents (%w/w)
Moisture content 8.24 ± 0.01 c10.68 ± 0.02 g8.81 ± 0.02 d11.70 ± 0.01 i10.27 ± 0.01 f10.93 ± 0.11 h5.93 ± 0.02 a9.22 ± 0.01 e7.83 ± 0.01 b
Crude fat 0.29 ± 0.02 f0.12 ± 0.00 a0.13 ± 0.00 a0.24 ± 0.00 d0.27 ± 0.00 e0.16 ± 0.00 b0.18 ± 0.01 c0.18 ± 0.00 c0.16 ± 0.01 b
Crude protein 4.56 ± 0.01 e3.68 ± 0.00 a4.13 ± 0.03 c6.01 ± 0.02 f4.39 ± 0.02 d3.98 ± 0.02 b4.44 ± 0.04 d6.13 ± 0.03 g4.43 ± 0.00 d
Crude fibre13.78 ± 0.00 g7.71 ± 0.00 c12.17 ± 0.00 ef7.06 ± 0.00 a7.16 ± 0.00 b7.77 ± 0.00 d13.75 ± 0.00 f13.84 ± 0.00 h13.77 ± 0.00 fg
Crude ash 4.07 ± 0.00 g3.24 ± 0.02 e2.95 ± 0.02 c2.92 ± 0.01 c2.88 ± 0.00 b3.03 ± 0.00 d2.89 ± 0.00 b2.82 ± 0.00 a3.29 ± 0.01 f
Carbohydrate 69.05 ± 0.02 b74.58 ± 0.02 h71.80 ± 0.01 d72.06 ± 0.02 e75.04 ± 0.02 i74.12 ± 0.12 g72.82 ± 0.05 f67.81 ± 0.03 a70.53 ± 0.01 c
Sugar content
Total reducing sugar (mg/g)0.47 ± 0.02 a0.53 ± 0.02 ab1.14 ± 0.06 e0.87 ± 0.06 cd0.60 ± 0.03 b0.83 ± 0.04 c0.61 ± 0.03 b0.99 ± 0.04 d0.62 ± 0.05 b
Bioactive compounds
TPC (mgGAE/g dry weight)113.09 ± 1.74 e41.28 ± 0.52 b213.36 ± 5.93 h149.43 ± 2.51 g21.99 ± 0.15 a87.61 ± 1.91 d19.39 ± 0.44 a129.95 ± 2.28 f63.25 ± 1.24 c
TFC (mgCE/g dry weight)2.86 ± 0.01 b3.11 ± 0.01 d5.43 ± 0.02 h3.54 ± 0.00 f3.48 ± 0.01 e4.33 ± 0.01 g2.66 ± 0.01 a4.31 ± 0.02 g2.97 ± 0.01 c
HPLC (mg/g dry bias)
Gallic acid8.45 ± 0.04 e6.39 ± 0.00 b16.10 ± 0.02 h11.05 ± 0.01 g6.84 ± 0.03 c10.46 ± 0.03 f4.94 ± 0.00 a10.52 ± 0.02 f7.33 ± 0.01 d
Cataechin 6.65 ± 0.14 b6.79 ± 0.01 b12.22 ± 0.19 f8.26 ± 0.18 d7.31 ± 0.08 c9.64 ± 0.17 e5.64 ± 0.01 a9.46 ± 0.03 e7.33 ± 0.01 c
Epicatechin11.06 ± 0.01 e6.77 ± 0.00 b23.49 ± 0.05 h13.64 ± 0.01 g9.46 ± 0.13 d 12.59 ± 0.04 f5.57 ± 0.01 a9.09 ± 0.00 c6.75 ± 0.03 b
Caffeic acid9.12 ± 0.00 e6.17 ± 0.05 b15.82 ± 0.03 i9.99 ± 0.01 f7.66 ± 0.01 d10.25 ± 0.09 g5.02 ± 0.00 a11.48 ± 0.02 h7.36 ± 0.01 c
Naringin n/dn/dn/dn/dn/d7.88 ± 0.00 an/dn/dn/d
p-Coumeric acid 5.22 ± 0.00 b5.64 ± 0.01 d9.83 ± 0.00 i6.66 ± 0.00 f6.37 ± 0.00 e7.96 ± 0.00 h5.11 ± 0.00 a7.85 ± 0.02 g5.41 ± 0.02 c
Rosmarinnic acid 6.47 ± 0.00 cn/d12.16 ± 0.00 i8.02 ± 0.00 f7.82 ± 0.00 e9.80 ± 0.002 h5.97 ± 0.01 b9.78 ± 0.01 g6.71 ± 0.01 d
Vanillin acid 5.85 ± 0.00 bn/dn/d7.31 ± 0.00 dn/d8.92 ± 0.00 en/dn/d6.12 ± 0.00 c
o-Coumeric acid4.92 ± 0.00 bn/dn/dn/dn/dn/dn/dn/d5.16 ± 0.00 c
Quercetinn/dn/dn/dn/dn/dn/dn/dn/dn/d
Antioxidant potential
FRAP (% FRAP value)16.71 ± 1.31 b29.46 ± 1.34 c46.28 ± 3.90 d29.32 ± 3.54 c10.09 ± 0.34 a27.71 ± 0.63 c10.05 ± 0.17 a53.64 ± 2.46 e13.79 ± 0.55 ab
ABTS (% scavenging activity )85.67 ± 0.39 f24.93 ± 0.61 b85.56 ± 1.75 f56.40 ± 0.29 c24.53 ± 0.38 b57.30 ± 0.57 c14.44 ± 1.26 a71.35 ± 0.40 e63.56 ± 1.52 d
DPPH (% scavenging activity)85.78 ± 0.08 d56.22 ± 1.85 b87.86 ± 0.08 d87.04 ± 0.16 d27.30 ± 0.47 a62.56 ± 0.31 c57.62 ± 2.71 b86.42 ± 0.17 d64.54 ± 0.88 c
DNS = reducing sugar, TPC = total phenolic content, TFC =. total flavonoid content, FRAP = ferric reducing antioxidant power, ABTS = ABTS scavenging ability, DPPH = 2,2-diphenyl-1-picrylhydrazyl scavenging activity, Cultivars of Mango peel; MA = Mam kamdang, RD = Rad, NG = Nga, KO = Kam, MR = Morrakot, CH = Chok anan, MH = Mahachanok, AK = Ok rong, and TL = Talab nak; Values are means (n = 9) ± standard error, and values with various superscript letters are significantly different in each row according to Duncan’s multiple range test (p < 0.05). n/d = non-detectable, GAE = gallic acid equivalent, CE = catechin equivalent, AC = ascorbic acid equivalent.
Disclaimer/Publisher’s Note: The statements, opinions and data contained in all publications are solely those of the individual author(s) and contributor(s) and not of MDPI and/or the editor(s). MDPI and/or the editor(s) disclaim responsibility for any injury to people or property resulting from any ideas, methods, instructions or products referred to in the content.