Article

Juglans regia as Urban Trees: Genetic Diversity and Walnut Kernel Quality Assessment

by
Alina-Maria Tenche-Constantinescu
1,
Dacian Virgil Lalescu
2,
Sorina Popescu
3,
Ioan Sarac
3,
Cerasela Petolescu
3,
Dorin Camen
3,
Adina Horablaga
4,
Cosmin Alin Popescu
4,
Mihai Valentin Herbei
4,
Lucian Dragomir
4,
George Popescu
4,
Olimpia Alina Iordănescu
1,
Alexandra Becherescu
1 and
Emilian Onisan
3,*
1
Department of Horticulture, Faculty of Engineering and Applied Technologies, University of Life Sciences “King Mihai I” from Timisoara, 119 Calea Aradului Street, 300645 Timisoara, Romania
2
Department of Food Science, Faculty of Food Engineering, University of Life Sciences “King Mihai I” from Timisoara, 119 Calea Aradului Street, 300645 Timisoara, Romania
3
Genetic Department, Faculty of Engineering and Applied Technologies, University of Life Sciences “King Mihai I” from Timisoara, 119 Calea Aradului Street, 300645 Timisoara, Romania
4
Department of Sustainable Development and Environmental Engineering, Faculty of Agriculture, University of Life Sciences “King Mihai I” from Timisoara, 119 Calea Aradului Street, 300645 Timisoara, Romania
*
Author to whom correspondence should be addressed.
Horticulturae 2024, 10(10), 1027; https://doi.org/10.3390/horticulturae10101027
Submission received: 10 August 2024 / Revised: 15 September 2024 / Accepted: 16 September 2024 / Published: 27 September 2024

Abstract

:
Juglans regia L. is an edible fruit tree cultivated worldwide for its fruits and wood and as an urban tree. Globally, there is growing concern for preserving the genetic diversity of trees with high economic and ecological value. This study investigates the genetic diversity of J. regia in urban landscapes and assesses the quality of its walnut kernels as a local food product. An inventory of 150 trees from five populations in public green spaces in Lugoj, Caransebeș and Jupa, as well as two semi-natural hilly ecosystems in the Banat Region, was conducted. Molecular analyses showed that Directed Amplification of Minisatellite-region DNA (DAMD) markers were more effective than Start Codon Targeted (SCoT) markers, with a higher average polymorphism of 56.26%, compared to 49.44%. DAMD07 achieved 100% polymorphism and DAMD05 showed a strong balance between P.I.C. (0.35) and polymorphism (54.54%). Chemical analysis revealed the following contents in walnut kernels: protein (12.81% to 16.80%), lipids (60.39% to 69.08%), total polyphenols (5484.66 to 10,788.4 mg GAE/kg), copper (3.655 to 8.532 mg/kg), manganese (14.408 to 28.618 mg/kg), zinc (19.813 to 46.583 mg/kg), lead (1.204 to 2.27 mg/kg) and cadmium (0.03451 to 0.08065 mg/kg). These findings are critical for conservation efforts, urban forestry management and ensuring the quality and safety of walnut products derived from J. regia.

1. Introduction

Global food insecurity, intensified by climate change and ongoing conflicts, underscores the urgent need for alternative food sources. Despite this, urban environments are filled with diverse ecosystems that provide a wealth of benefits, including food, cultural enrichment, social cohesion, psychological well-being, ornamental value, economic opportunities and ecological services [1]. The edible fruit tree Juglans regia L., when integrated into urban green infrastructures, forms part of these valuable ecosystems [2]. J. regia L. is a monoecious, diploid and highly heterozygous tree species that exhibits heterodichogamy and is primarily pollinated by the wind [3]. According to Khan et al. (2023), J. regia originated in Central Asia and around the Himalayan Mountains. The regions with the highest genetic diversity of J. regia are Southern Asia, Western Asia, Western Europe and China [4]. Today, J. regia is cultivated worldwide for its fruit and wood and as an urban tree in more than 60 countries, with China being the leading world producer, accounting for 31% of the total harvest [5,6]. The Global Report on Food Crises (GRFC) indicates that an estimated 281.6 million individuals faced acute food insecurity in 2023 [7,8]. This alarming figure reflects the compounded effects of climate change, persistent economic downturns and ongoing conflicts, all of which have intensified the vulnerability of food systems worldwide. Extreme weather events directly and negatively affected agricultural yields and market prices. Between 2000 and 2021, the cropland area per person decreased by 7% (equivalent to 0.39 hectares), while only 5.1% of Europe’s employed population was working in agriculture by 2021 [9]. In these conditions, identifying alternative sources of food has become a priority, including within urban landscapes, where there are unexplored opportunities to integrate tree species with food production potential, such as the common walnut.
As societies grew and interacted, humans spread J. regia across different regions through cultural expansion and trade, leading to its distribution beyond its native habitat in Central Asia [4,10,11]. J. regia has been an economically and culturally important crop for millennia in various civilizations. The evolutionary history of the walnut is closely linked to human history, making it a permanent feature of Asia and Europe’s economic and universal cultural heritage as a natural resource and spiritual symbol [12,13].
In the Banat Region, Juglans regia L. provides aesthetic beauty to the urban landscapes and is considered the most beautiful and imposing fruit tree, being appreciated for its port, broad crown, solid branches and dense foliage [14]. As an urban tree, J. regia generates numerous ecosystem services associated with the size of the individuals and their vitality. J. regia L. improves human thermal comfort locally by reducing Urban Heat Island effects, removing air pollution and sequestering carbon, enhancing interception and increasing infiltration into the ground, thereby reducing overland water flow, providing shelter and food for insects and birds, and supporting the health and wellbeing of locals [15,16]. Also, it provides nuts for people visiting urban green spaces who are curious to taste local fruits.
Many studies revealed the benefits of walnut kernel consumption, which is one of the most concentrated foods with its high energy value and is considered a functional food [17,18]. The walnut kernel is a source of nutrients such as essential minerals, carbohydrates, phenolic compounds, vitamins, polyunsaturated fatty acids and vegetable proteins (14% dry matter) [19]. Research has revealed that minor components of walnuts, like phytic acid and pyrophosphate, are inhibitors of urolithiasis [20].
Valuable minerals such as P, K, Na, Mg and Zn found in the walnut kernel are crucial for both nutritional and toxicological aspects [21]. In small amounts, some heavy metals such as Mn, Cu, Zn and Mo are essential in vital processes, having bio-importance as trace elements, but the bio-toxic effects of many of them in human biochemistry are of great concern [22].
Manganese is essential for the growth and reproduction of plants and functions as a cofactor for various human enzymes [23]. A safe level of intake of 8 mg/day was established for adults ≥ 18 years (including pregnant and lactating women) and ranged between 2 and 7 mg/day for other population groups [24].
Copper is essential for organisms’ growth and development and maintaining homeostasis, but it acts as an enzyme inhibitor in high concentrations and limits metabolic activity. Although zinc is essential in developing plant and human organisms, it has been shown that in high concentrations, it causes chromosomal aberrations [25,26]. Conversely, the low concentration and content of ZnSO4 in the edible parts of plants diminishes their nutritional quality [27].
Heavy metals are persistent and non-degradable, belonging to metals or metalloids with a density > 5 g cm−3 and a high atomic weight [28]. The most frequently encountered heavy metals in soils and underground waters are Cd, Cr, Cu, Hg, Ni, Pb, Se and Zn, of which the most harmful are Hg, Pb, Se, Co and Cd, being considered as priority toxic pollutants [29]. Cadmium and lead exposure occurs mainly through the food chain and has significant adverse effects on plant and human health [30]. Studies have shown that soil significantly impacts the nutritional quality of food, with micro-elements such as Fe, Cu and Zn having the most significant influence on fruit quality [20]. The bioavailability of heavy metals depends on many factors, namely pH, chemical and mineralogical composition, soil organic matter, root exudates and rhizospheric microbial communities, but the chemical desorption mechanism might be the primary factor controlling heavy metal release [31,32,33]. Keeping contaminants at toxicologically acceptable levels is essential to protect human health, which is severely affected by the propagation of heavy metals throughout the food chain [34]. People should also know what they are eating and pay more attention to the sources of their food and its quality. Young children also consume foods intended for the general population, so they should be considered a potentially sensitive consumer group [24].
Walnut kernel quality has been shown to depend on genotype, biotope and technological factors [12].
The germplasm characterization of walnuts was initially based on morphological characteristics, but these are often influenced by environmental conditions and different developmental stages. The increasing concern for preserving the genetic diversity of economically and ecologically valuable trees highlights the necessity of conducting molecular analyses to more efficiently assess their diversity [4,10,11].
Molecular markers, such as Simple Sequence Repeat (SSR) [35,36,37], Inter Simple Sequence Repeat (ISSR) [38,39,40,41], Start Codon Targeted (SCoT) [42] and Directed Amplification of Minisatellite-region DNA (DAMD), have been used by numerous researchers to assess the genetic diversity of J. regia. DAMD and SCoT markers were used together because they offer a robust method for revealing genetic diversity, elucidating population structure and supporting breeding programs. The complementary nature of these markers allows for a comprehensive and detailed genetic analysis, effectively capturing variations in both the coding and non-coding regions of the genome. SCoT markers target conserved regions around the start codon (A.T.G.) of genes, focusing on gene-coding regions, being valuable for identifying functional genetic diversity in the case of many plant species [43]. DAMD markers target minisatellite regions (repetitive DNA sequences) in the genome, which are often highly polymorphic, helping detect variations in non-coding regions [44,45]. In recent years, SCoT markers have been successfully used to evaluate the genetic diversity of J. regia. Thus, the study of Tabasi et al. (2020) pointed out the effectiveness of SCoT markers in distinguishing between different walnut populations and provided valuable insights for conservation and breeding efforts [43]. The DAMD markers were used for the evaluation of Phoenix dactylifera L. [46] and Musa cavendishii [47]. Zeb et al. (2020) identified sixteen divergence hotspot regions in the Pinus plastid genomes, which could serve as useful molecular markers for future population genetics studies [48].
Assessing and conserving the genetic resources of J. regia is a top priority in Europe, which accounted for 14.4% of global walnut production in 2023 [6]. J. regia protection and expansion are favored by the legislative framework in Romania [49], which was ranked as the world’s eighth-largest walnut producer in 2021, with a production of 53,320 metric tons (mt), and by 2023, had become the leading producer in Europe. Based on current production estimates, walnut production is expected to increase [50].
In order to fulfill the legislation regarding the regulation and administration of urban green infrastructures in many localities of Romania, including Lugoj and Caransebeș, the Local Register of Green Spaces (LRGS) is in progress. The LRGS is a geographic information system (G.I.S.) containing a G.I.S. database and a particular interface for operating data, reports and maps. G.I.S. is a reliable tool for urban management, used in urban sustainable development planning for collecting, storing, managing, calculating, analyzing, displaying and describing geographical information [51,52,53].
In the present study, we aimed to (i) highlight the presence of J. regia in the urban landscapes of Lugoj, Caransebeș and the rural area of Jupa using G.I.S. and GNSS technologies, (ii) reveal the enormous potential of walnut diversity by analyzing the genetic diversity of J. regia individuals from urban and rural green infrastructures and spontaneously grown genotypes using DAMD and SCoT markers and (iii) analyze if the walnut kernel provided by the J. regia urban trees is edible and recommended to be consumed as “a local food product”.

2. Materials and Methods

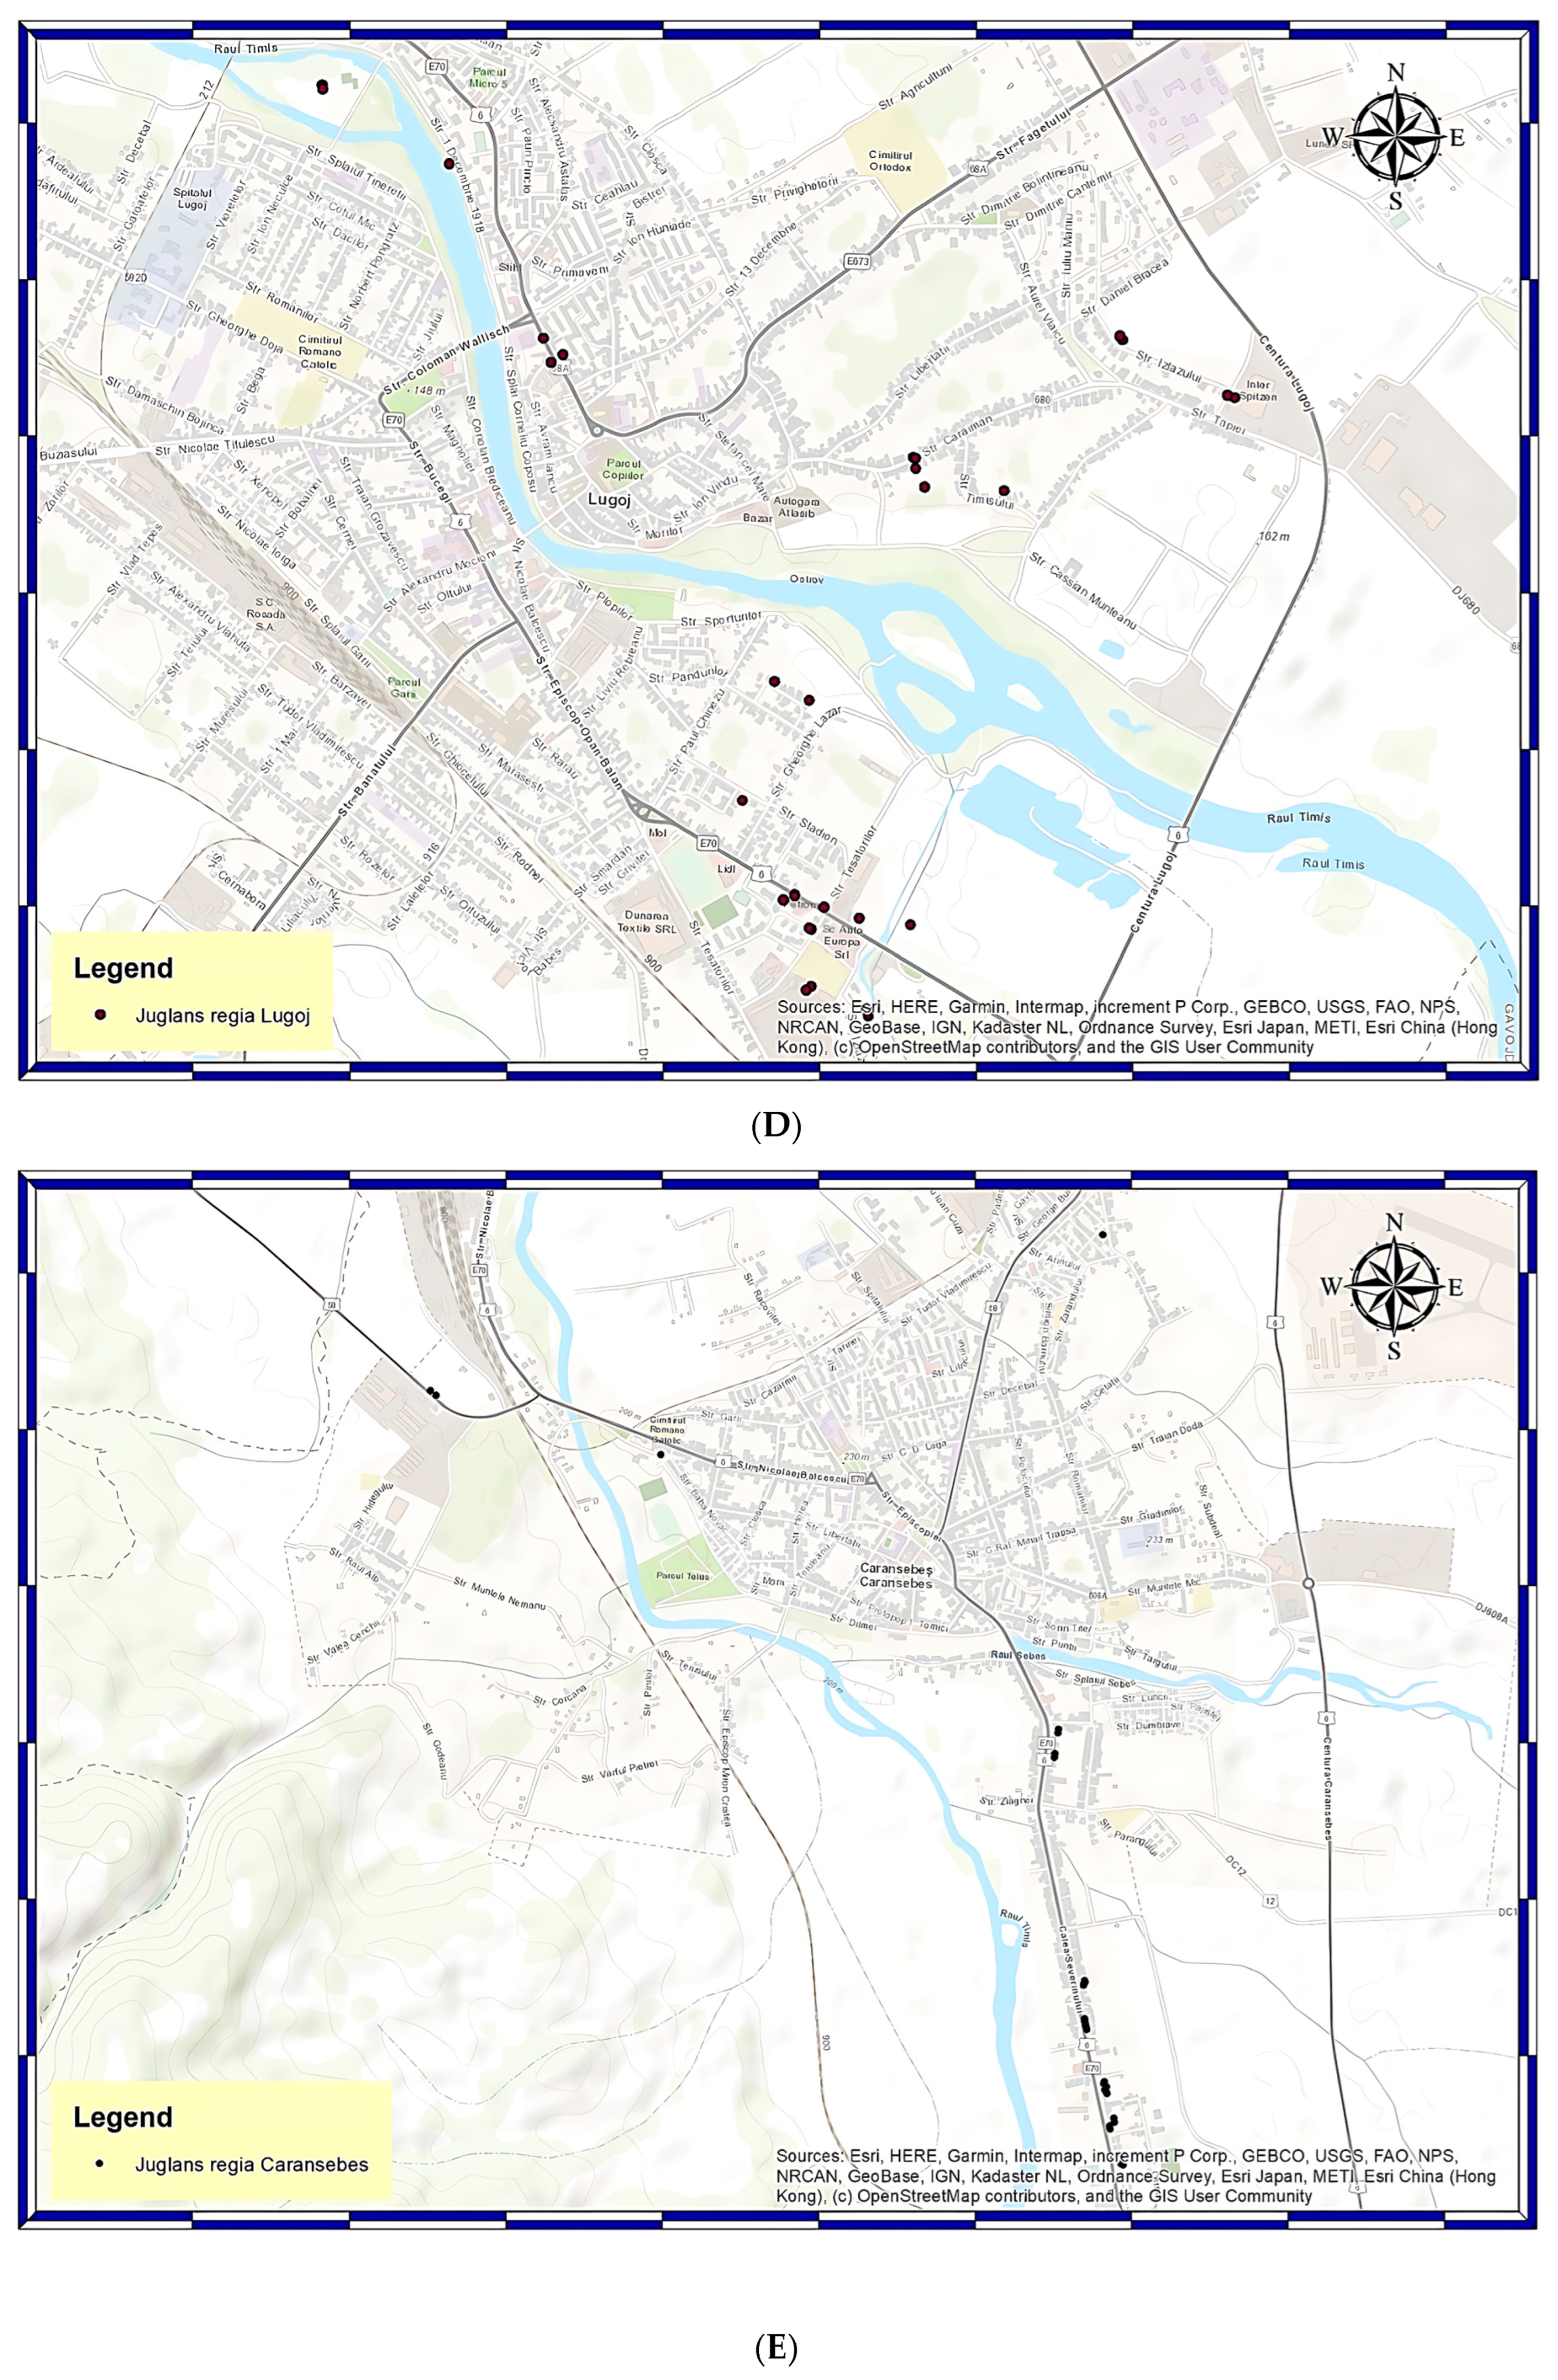
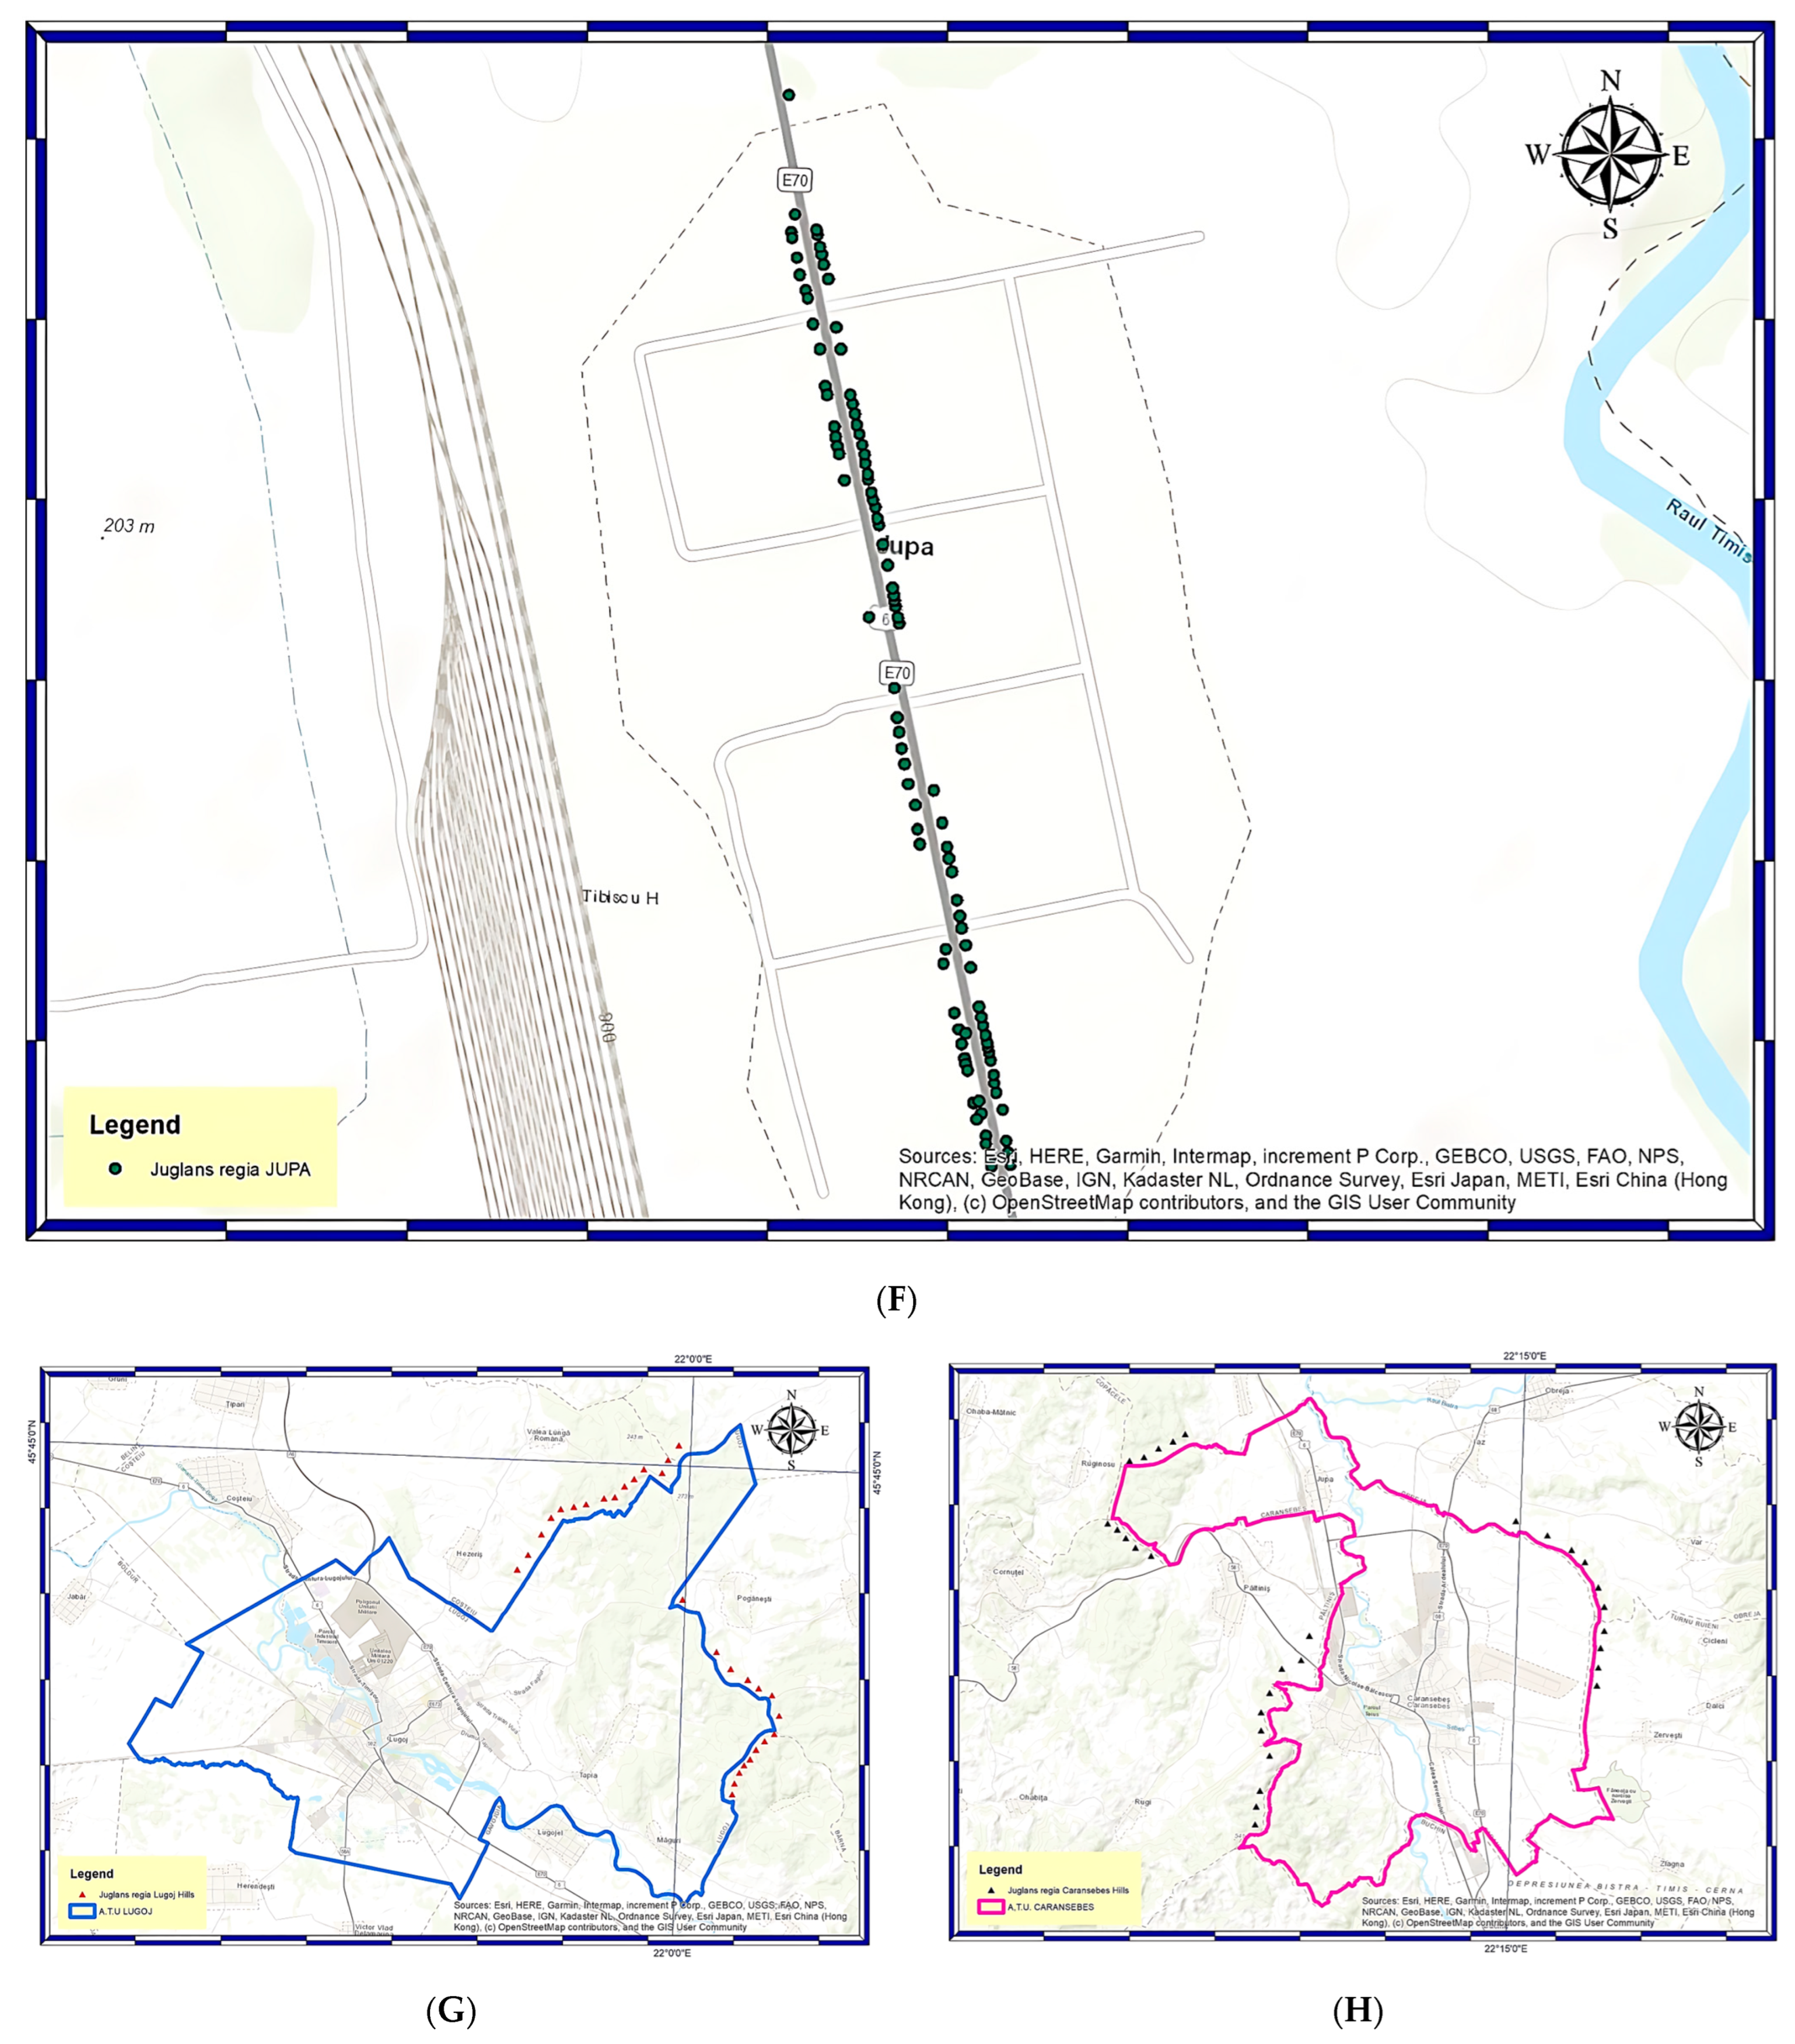
2.1. Site Description and Data Collection

Field studies took place over several years (2016–2023) and included an inventory of J. regia tree individuals from Banat Region, Western Romania, as follows: two urban sites, Lugoj and Caransebeș, one rural area, Jupa village, and two hilly regions, one near Lugoj and one near Caransebeș (Figure 1A,B). For the present paper, results from the 2023 growing season were considered.
Lugoj (45.68861 °N; 21.90306 °E) is a city in Timiș County, between the Lugoj Plain and the Lugoj Hills, an important regional urban center. It has a surface of 9.803 ha, of which 143 ha is green spaces. The number of citizens is 44.928, with 31.83 sqm of green space/inhabitant [54].
The Lugoj Hills make the transition to the Poiana Ruscă Mountains and have a radial hydrographic network that comes from the mountainous area and goes to the main collectors: Bega (in the North) and Timiș (in the South west) [54].
Caransebeș (45.41667 °N; 22.21667 °E) has a particular geographical position at a point where meadows, hills and high mountains meet at the confluence of the Sebeș and Timiş rivers [55]. It is the second largest city in Caras-Severin County, with a surface of 7358.41 ha, of which 56.55 ha is green spaces [56,57] The number of citizens is 21,714 [58], with 26.04 sqm of green space/inhabitant.
Caransebeș hills Dealu Mare (639 m) altitude and Corcana (489 m) altitude make he transition to the high and massive mountains in the South and East of Caransebeș [59].
Jupa village is situated 6 km North of Caransebeș and is administrated by the Caransebeș municipality [60].
Both the Lugoj (31.83 sqm) and Caransebeș (26.04 sqm) green infrastructure surfaces are below the World Health Organization (WHO) recommendation of 50 sqm/inhabitant [2].
From a climate perspective, the Banat Region falls within the moderate temperate climate with Mediterranean influences. Average annual precipitation amounts are relatively high, ranging from 600 mm/year in plains to 700 mm/year in hilly regions. The average annual air temperature is 10–12 °C [61]. Climate change has led to a 1.2 °C increase in Banat’s average annual temperature over the last 50 years, resulting in more frequent extreme events such as droughts, storms and heat waves [62,63]. The Banat Region’s climate favors the growth, development and spread of J. regia due to its photosynthetic plasticity to light. Still, the risk of summer drought is likely to increase, so walnuts may be disadvantaged due to their susceptibility to water deficits. It was also proven that biotypes possess valuable stress-resistance genes that help them cope with drought [64].
We chose the sites as the study areas due to J. regia’s significant presence in their green infrastructures, mainly in the street alignments of residential neighborhoods. A public green space trees and shrubs survey based on G.I.S. technologies during 2016–2023 revealed a total of 2174 J. regia L. individuals as follows: 1537 walnuts among the 23,762 trees and shrubs individuals identified in Lugoj (6.5%) and 637 walnuts among the 6955 trees and shrubs individuals identified in Caransebeș (including Jupa) (9.2%) (Figure 1C). Also, J. regia genotypes were analyzed and identified in the hilly regions near Lugoj and Caransebeș. Since these were solitary specimens, we assumed they grew spontaneously in these semi-natural hilly ecosystems near urban environments (Figure 1B).
Among all these trees, only 30 individuals of J. regia were analyzed from each urban, rural and hilly semi-natural region; 150 tree individuals in total formed five different populations of J. regia, situated in five different locations of Banat Region, as follows:
Population J1L J. regia: 30 trees (J1L 1-30)—Lugoj green infrastructures (Figure 1D);
Population J2C J. regia: 30 trees (J2C 1-30)—Caransebeș green infrastructures (Figure 1E);
Population J3J J. regia: 30 trees (J3J 1-30)—Jupa Main Street alignment (Figure 1F);
Population J4LH J. regia: 30 trees (J4LH 1-30)—Lugoj Hills, located near Lugoj (Figure 1G);
Population J5CH J. regia: 30 trees (J5CH 1-30)—Caransebeș Hills, located near Caransebeș (Figure 1H).
The selected trees are planted in different green infrastructures of Lugoj, Caransebeș and Jupa, parks, squares and street alignments, and there are also spontaneously grown tree individuals in the semi-natural hilly areas nearby to the studied urban environments.

2.2. Geographical Information System (G.I.S.) and Global Navigation Satellite System (GNSS) Technologies

In order to make a direct observation, field visits were made to the urban (Lugoj and Caransebeș), rural (Jupa village) and semi-natural hilly landscapes (nearby Lugoj and nearby Caransebeș). A total of 1537 tree individuals of J. regia from Lugoj and 637 from Caransebeș (inclusive Jupa) were inventoried using geomatic technologies. Leica TS03 and Leica Zeno 20 were used to perform the measurements. The gathered data were stored in spatial databases, integrating Cartesian coordinates and specific characteristic features for each measurement, such as the height of the trees and trunk diameters at 1.30 m. These data were processed with specific geomatics programs: AutoCAD and ArcGIS. The design of the data was carried out in three stages: (1) identification of geographic objects and attributes and their organization on layers, (2) defining the attributes and (3) ensuring registration of coordinates between layers [52].

2.3. Dendrometric Measurements

The dendrometric measurements made for each of the 150 tree individuals consist of the following:
(1) measurement of two diameters at breast height (1.3 m) (DBH1, DBH2) at 1800 intervals, using Haglöf Sweden AB aluminum tree caliper with a precision of 1 mm;
(2) measurement of tree height (H) using SUUNTO hypsometer with an accuracy of +/− 0.5 m (2.5%) or a Nedo MessFix 8m Telescopic Pole for trees under 8 m height.
The average diameter at breast height (DBHm) was calculated.

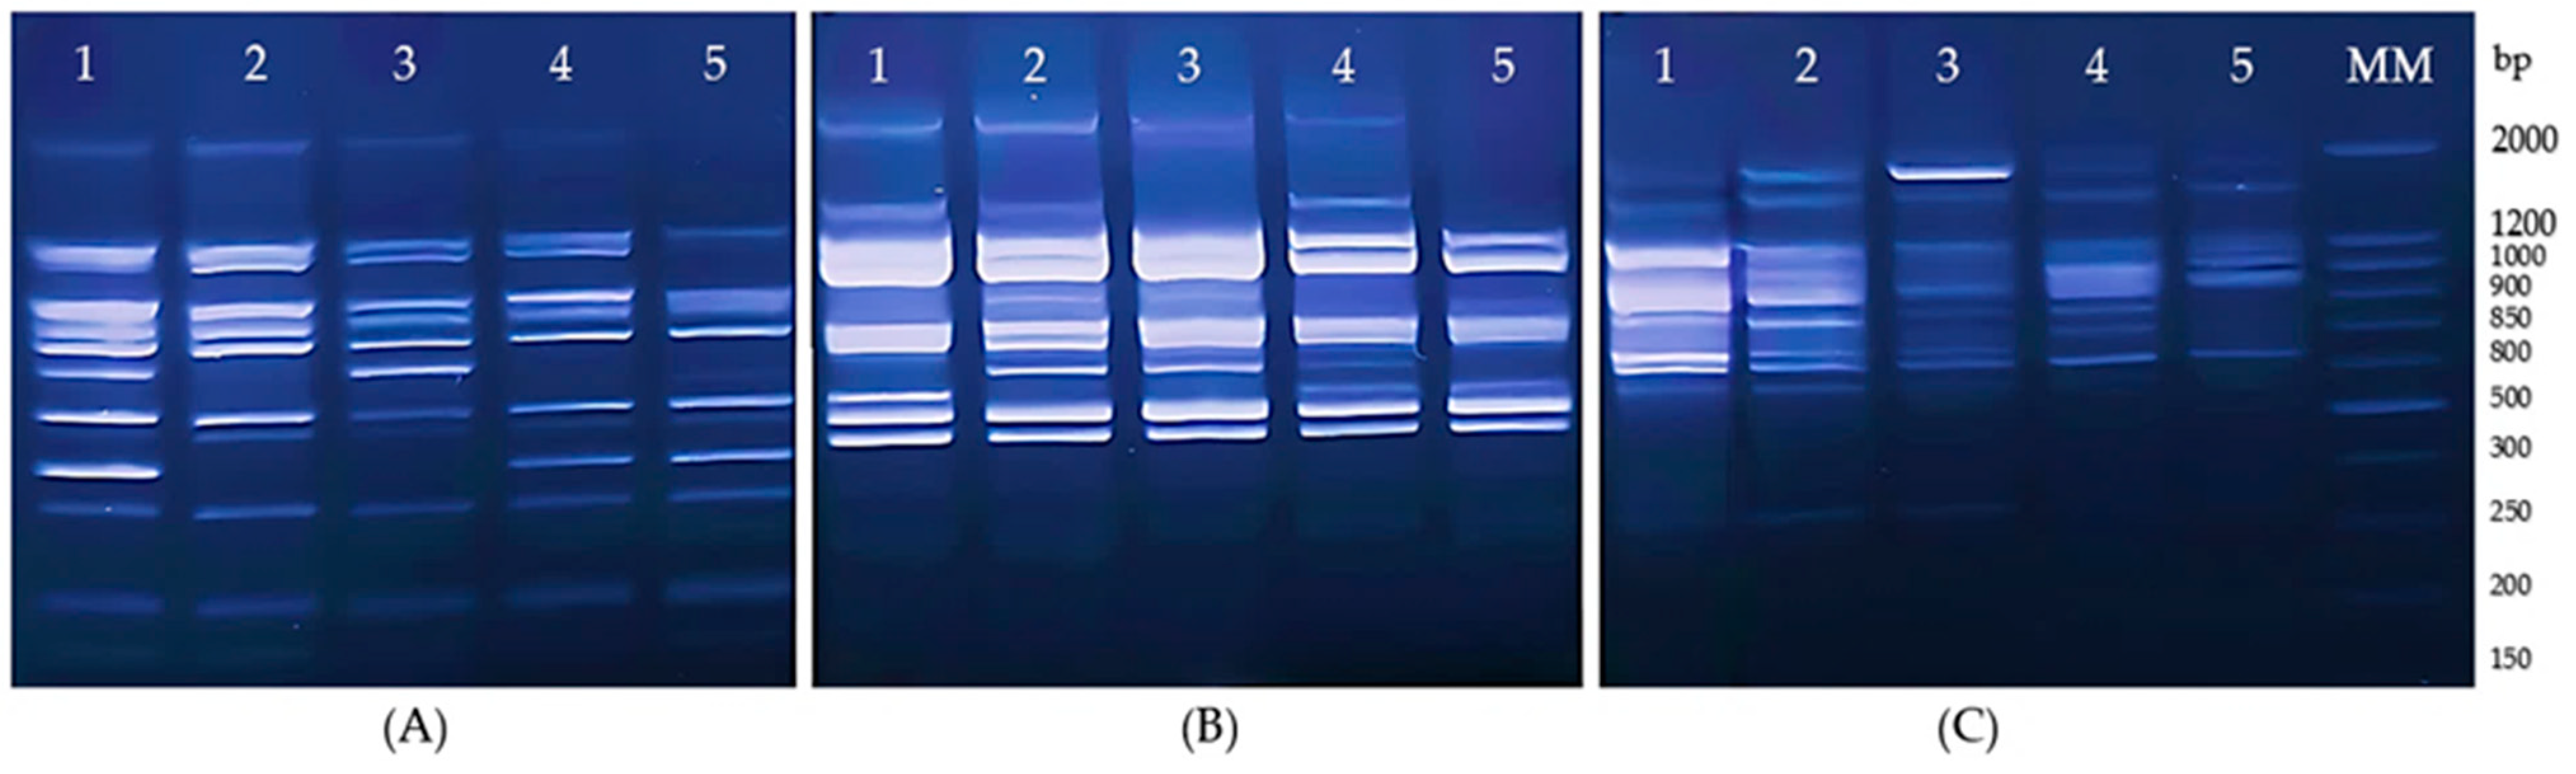
2.4. Molecular Analysis of Genetic Diversity

In order to reveal the enormous potential of J. regia genetic diversity, molecular analyses were performed in the Molecular Biology Laboratory, U.S.V. “King Mihai I” from Timișoara. Genetic diversity was determined through molecular tools such as Directed Amplification of Minisatellite DNA (DAMD) markers and Start Codon Targeted (SCoT) markers.
For each population, a bulk sample was obtained from 30 different trees and the DNA was extracted from young leaves in early spring based on the Doyle and Doyle method. DNA concentration and quality were evaluated with the Nanodrop 8000 (ThermoFisher Scientific, Waltham, Massachusetts, USA). The concentration was very high; therefore, the samples were diluted to 100 ng/µL. Then, the DNA samples were amplified using DAMD and SCoT primers (Table 1) [65].
The amplification mixture contained DNA 100 ng/µL, GoTaq® Green Master Mix (Promega, Madison, WI, USA) 2x—12.5 µL, primer 20 µM—1 µL, MgCl2 10 µM—1 µL and sterile distilled water up to 25 µL. The amplification products were separated by electrophoresis on a 1.8% agarose gel and visualized under U.V. radiation in the presence of ethidium bromide. The size of the amplified fragments was evaluated relative to the BenchTop 100 bp DNA ladder. Then, band scoring was performed, with presence denoted as 1 and absence as 0. The obtained results were statistically interpreted.

2.5. Determination of Kernel Chemical Composition

Five populations, each formed by 30 trees (J1L 1-30; J2C 1-30; J3J 1-30; J4LH 1-30; J5CH 1-30), were sampled, resulting in a total of 5 samples, one for each population.
To evaluate the chemical composition of the kernels, the in-shell nuts that fell to the ground after tree-shaking were collected at harvest time, when 90% of the nut hulls had split. The collections were carried out in 2023 between the end of September and the beginning of October.
The chemical composition of the walnut kernels was analyzed using standardized methods for determining mineral content [66]; for protein determination [67]; for total lipids determination [68]; the Folin–Ciocalteu method for total polyphenols determination [69]; and atomic absorption spectrometry (A.A.S.) after calcination [70], for the determination of trace elements and heavy metals. Analyss was performed at the Interdisciplinary Platform of U.S.V. “King Mihai I of Romania” from Timisoara.

2.5.1. Determination of the Content of Mineral Substances Was Made According to SREN ISO 749:1999

The 3 g sample was weighed in a porcelain capsule, incinerated in a calcination furnace equipped with a thermoregulator and heated to 550 °C. The operation lasted 6–8 h. The capsule was then allowed to cool in a desiccator and weighed as soon as it reached room temperature.
The ash content was calculated with the following relation:
Ash = [(m2 − m0)/(m1 − mo)] × 100 [%]
where mo—nacelle mass, g; m1—mass of the nacelle with the sample taken for determination, g; m2—the nacelle mass together with the ash, g.

2.5.2. Protein Determination Using the Kjeldahl Method Was Made According to SREN ISO 20483:2014

The sample (2 g) was placed in the Kjeldahl flask, followed by the addition of 10 g of catalyst mixture, a few pieces of paraffin, a 6–7 mm glass ball and 25 cm3 of sulfuric acid with a density of 1.83–1.84 g/cm3.
A small glass funnel was placed in the neck of the flask and heated moderately to avoid the formation of abundant foam. The mixture was boiled for two hours after the liquid became clear and did not change color. After cooling, the contents of the flask were dissolved in water, stirring vigorously and, if necessary, heating until dissolved. It was transferred quantitatively, through repeated washings, into a 250 cm3 graduated flask, and after cooling, the volume of the solution in the graduated flask was filled with water up to the mark, and then the flask was vigorously shaken. Indirect distillation was used for 25 and 100 cm3 mineralized samples. To the sample, 0.5 cm3 of phenolphthalein solution was added and a few granules of porous porcelain were used to mount the flask to the distillation apparatus. Depending on the portion used, 15–50 cm3 of 32% sodium hydroxide solution was added to the distillation flask. A total of 20 cm3 of sulfuric or hydrochloric acid 0.1 n was introduced beforehand into the collecting vessel, diluted with approx. 25–100 cm3 of water and 2–5 drops of mixed indicator. After distillation, the excess acid from the collecting vessel was titrated with a 0.1 n sodium hydroxide solution.
The crude protein (P) content, expressed as a percentage, was calculated with Formula (1):
Crude   protein   ( P ) = V 1 f 1 V 2 f 2   r × m 1 × F m × 100
in which
V1—the volume of sulfuric or hydrochloric acid 0.1 n introduced into the collecting vessel, in cm3;
f1—factor of sulfuric or hydrochloric acid 0.1 n;
V2—the volume of the 0.1 n sodium hydroxide solution used in the titration, in cm3;
f2—factor of the 0.1 n sodium hydroxide solution;
m1—the amount of nitrogen, in grams, corresponding to 1 cm3 of sulfuric or hydrochloric acid; this amount is 0.0014008 for the 0.1 n acid;
r—dilution ratio (in the case of using 100 cm3 of mineralized solution, r = 2.5);
F—conventional transformation factor = the amount of crude protein, in grams, corresponding to 1 g of nitrogen;
m—mass of the sample taken for determination in grams.

2.5.3. Determination of Total Lipids Was Conducted According to SREN ISO 659:2009

According to Duca et al. (2019) [71], lipids were extracted in petroleum ether using Soxtest Raypa SX-6 MP equipment. A 3 g sample was introduced into the cartridges. For the extraction of lipids, 50 mL of petroleum ether was used for each sample. The parameters were set as follows: temperature: 75 min, time of extraction: 50 min. Samples were dried to constant weight. Total fat was expressed as a percentage from the raw kernel (% w/w). This method was successfully used by Rinovetz et al. (2018) [72].

2.5.4. Determination of Total Polyphenols Was Conducted Using the Folin–Ciocalteu Method

First, 0.5 mL of alcoholic extract was treated with 1.25 mL of Folin–Ciocalteu reagent diluted 1:10 with water. The sample was incubated for 5 min at room temperature and 1 mL of 60 g/L Na2CO3 was added. After 30 min of incubation at 50 °C, the absorbance of the samples was measured at 750 nm using a UV-VIS spectrophotometer (Analytic Jena Specord 205, Jena, Germany). The calibration curve was obtained using gallic acid, G.A., as standard (concentration range 5–250 μg/mL) [73,74].

2.5.5. Determination of Microelements and Heavy Metals

Analysis of microelements and heavy metals was performed by atomic absorption spectrometry (A.A.A.) after calcination, according to the standard SR EN 14082:2003—Food products.
A volume of 3 g of ash was obtained after calcination, as is described in the method of determination of total mineral substances extracted in 20% HCl, and the content of elements was measured using Varian 220 FAA equipment.
A mix standard solution (I.C.P. Multi-Element Standard solution IV CertiPUR) was used for the calibration curve. The results were expressed in parts per million (ppm) (mg/kg). All determinations were made in triplicate.
The metal content (E), expressed in ppm, was calculated with Formula (2):
Metal   content   ( E ) = C × V × 1000 M × 1000 *
in which
E = name of the element;
C = quantity taken from the standard curve in micrograms;
V = total volume of sample solution (mL);
M = quantity in grams of working sample;
1000 = content ratio factor per 1000 g (1 kg);
1000* = microgram transformation factor.

2.6. Statistical Analysis

All statistical analyses were performed using R Statistical Software (v4.4.1; R Core Team 2024) [75]. Non-parametric Kruskal–Wallis tests were employed to assess significant differences in the mean values of chemical contents across J. regia populations (J1L, J2C, J3J, J4LH and J5CH). Dunn’s post hoc test was used for pairwise comparisons in cases where the Kruskal–Wallis test indicated significant overall differences.
In order to highlight the linear relationships between the variables under study, Pearson’s linear correlation matrix was calculated and, in the case of statistically significantly high correlated variables, the linear regression equations between them were determined. Based on Pearson’s linear correlation matrix, a principal components analysis and then a cluster analysis was carried out.
A binary presence/absence matrix reflecting polymorphic band patterns was generated for the five populations. This matrix was then employed to construct a dendrogram depicting genetic similarity among populations.

3. Results

3.1. Statistical Analysis of J. regia Dendrometric Indices

Descriptive statistics of dendrometric measurements provide insights into the physical characteristics of the five J. regia populations. As illustrated in Figure 2A,B, these measurements include trunk diameter at breast height (DBHm) and total tree height (Ht).
The Lugoj population (J1L), shown in Figure 1D, consists of 30 walnut trees planted in urban green spaces. These trees exhibit an average trunk diameter of 34.46 cm with a standard deviation of 11.31 cm. This means that while the average diameter is 34.46 cm, individual tree diameters can vary significantly, ranging from as small as 18 cm to as large as 65 cm. Similarly, the average height of the Lugoj trees is 8.04 m, with a standard deviation of 0.78 m. This indicates that the trees in this population are generally tall, but there is some variation in height, with the shortest being 6.3 m and the tallest reaching 9 m.
The Caransebeș population (J2C), depicted in Figure 1E, comprises 30 J. regia tree individuals situated within the city’s green infrastructure. These trees exhibit an average trunk diameter at breast height of 32.33 cm, with a standard deviation of 7.72 cm. This implies that while the average diameter is 32.33 cm, individual tree diameters can range from a minimum of 16 cm to a maximum of 50 cm. Additionally, the average total height of the Caransebeș trees is 8.6 m, with a standard deviation of 0.77 m. This indicates that the trees in this population are generally tall, but there is some variation in height, with the shortest being 7 m and the tallest reaching 10 m.
The Jupa population (J3J), shown in Figure 1F, comprises 30 walnut trees aligned along Jupa’s Main Street. These trees exhibit an average trunk diameter of 27 cm with a standard deviation of 9.84 cm. This indicates that while the average diameter is 27 cm, individual tree diameters can vary considerably, ranging from as small as 16 cm to as large as 46 cm. Similarly, the average height of the Jupa trees is 7.5 m, with a standard deviation of 1.22 m. This suggests that the trees in this population are generally tall, but there is some variation in height, with the shortest being 5.5 m and the tallest reaching 9.5 m.
The Lugoj Hills population (J4LH), depicted in Figure 1G, situated on Lugoj Hills, near Lugoj, comprises 30 J. regia trees. These trees exhibit an average trunk diameter at breast height of 35.73 cm, with a standard deviation of 5.27 cm. This indicates that while the average diameter is 35.73 cm, individual tree diameters can vary from 28 cm to 50 cm. The average total tree height is 8.7 m, with a standard deviation of 0.65 m. This suggests that the trees in this population are generally tall, but there is some variation in height, ranging from 8 m to 10 m.
The Caransebeș Hills population (J5CH), pictured in Figure 1H, comprises 30 walnut trees. These trees have an average trunk diameter of 36.23 cm, with a standard deviation of 4.76 cm. This means that while the average diameter is 36.23 cm, individual tree diameters can range from 29 cm to 50 cm. Additionally, the average height of the Caransebeș Hills trees is 8.8 m, with a standard deviation of 0.76 m. This indicates that the trees in this population are generally tall, but there is some variation in height, with the shortest being 8 m and the tallest reaching 10 m.

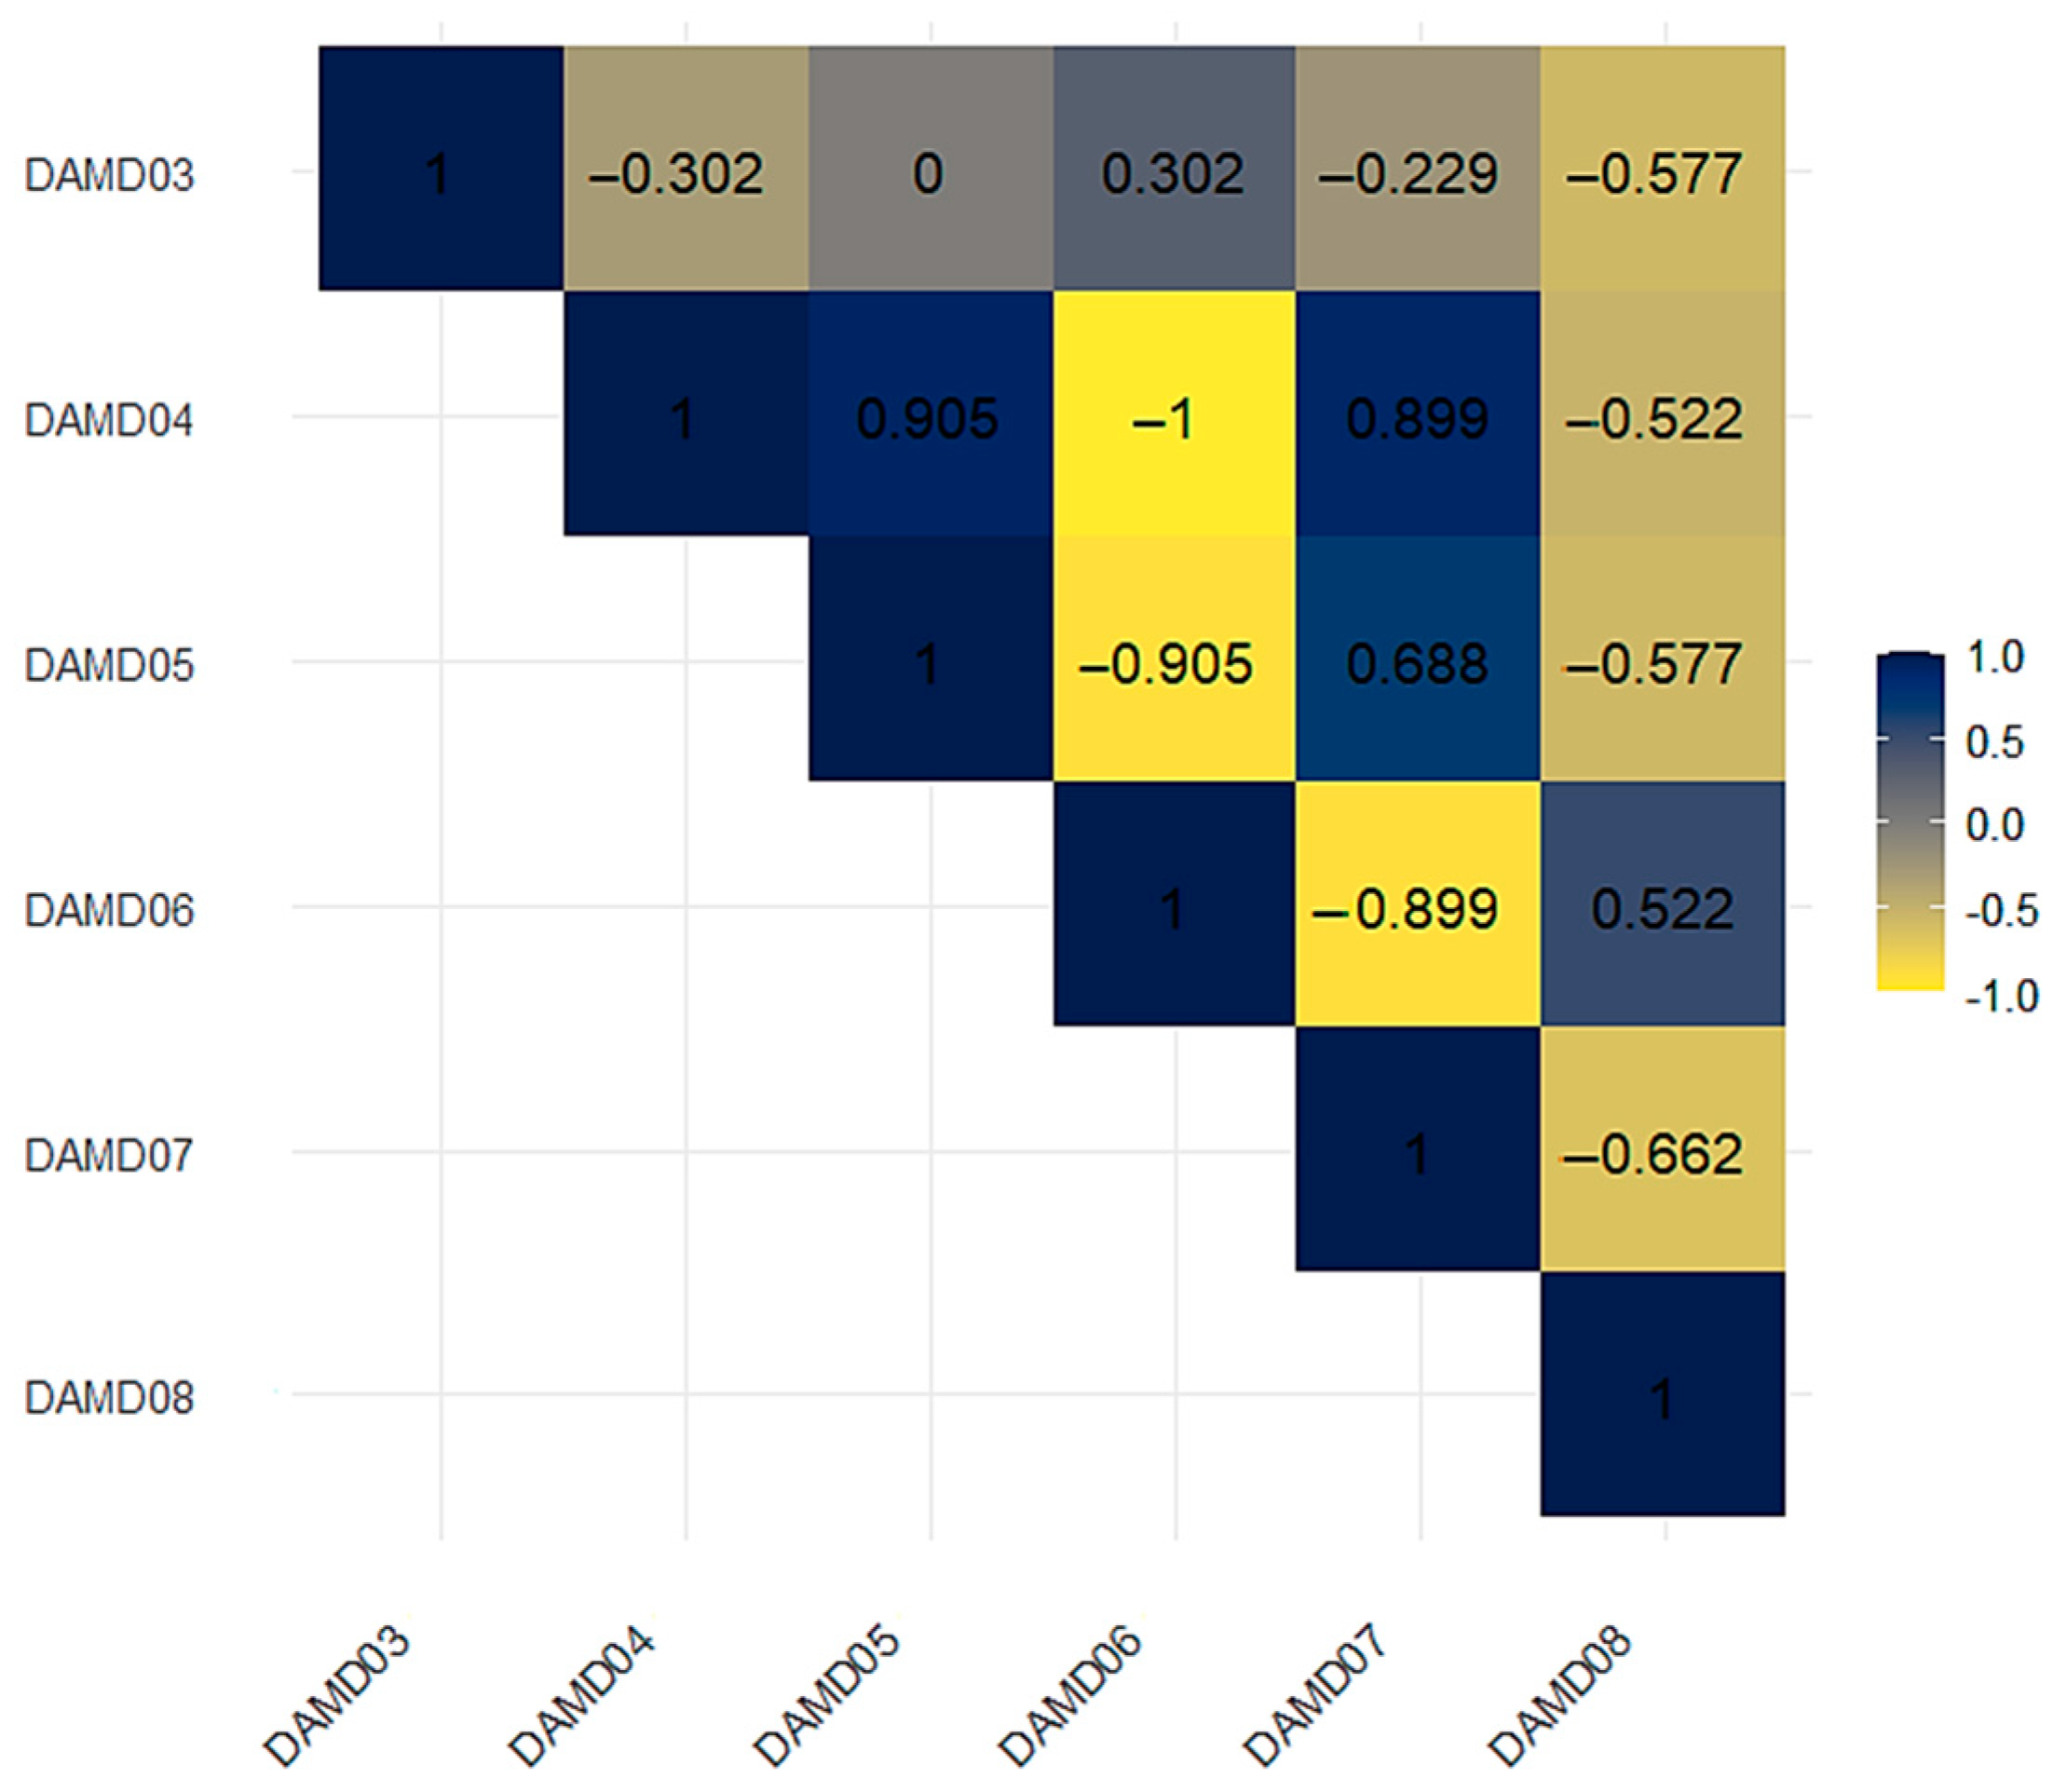
3.2. Results of the Genetic Variability of J. regia Using DAMD and SCoT Markers

3.2.1. Assessment of Genetic Diversity of J. regia Population Using DAMD Primers

The genetic primer analysis reveals notable variability and effectiveness among the studied primers. Primers DAMD05 and DAMD06 have a polymorphism percentage of 54.54% and 66.66%, respectively, while DAMD07 exhibits complete polymorphism at 100%, indicating full genetic diversity within the analyzed samples (Table 2).
Regarding Polymorphic Information Content (P.I.C.), DAMD05 and DAMD06 showed values of 0.35 and 0.31, respectively, significantly higher than the other primers, suggesting superior genetic information content. DAMD05 also had the highest Marker Index (MI) of 2.09, reflecting a greater capacity for genotype discrimination (Figure 3 and Figure 4).
The resolving power (Rp) ranges from 1.92 to 5.44, with DAMD05 and DAMD06 primers demonstrating the highest values, indicating a better ability to differentiate polymorphic bands. The average P.I.C. and MI values and their standard deviations suggest moderate consistency among primers, with DAMD05 and DAMD06 providing the most effective results in genetic polymorphism analysis.
Primers DAMD04 and DAMD05 have a high correlation coefficient (0.905), indicating they target the same genomic regions. DAMD05 has a strong negative correlation with DAMD06 (−0.905), suggesting distinct genomic regions. DAMD06 shows a moderate positive correlation with DAMD08 (0.522) and a strong negative correlation with DAMD07 (−0.899), indicating complementary usage. DAMD03 exhibits low and negative correlations with the other primers, making it useful for genomic diversity (Figure 4).

3.2.2. Assessment of Genetic Diversity of J. regia Population Using SCoT Primers

The analysis of genetic primers provides insights into their polymorphism and discriminatory power.
Primer SCoT11 demonstrates the highest polymorphism at 80%, with four out of five bands being polymorphic, and exhibits a Polymorphic Information Content (P.I.C.) of 0.31.
SCoT1 shows a high polymorphism of 75%, with six out of eight bands being polymorphic and a P.I.C. of 0.31, reflecting significant genetic diversity (Table 3).
Primers SCoT3 and SCoT6 each present a 50% polymorphism rate with P.I.C. values of 0.34, indicating moderate genetic variability (Table 3). Primer SCoT36, despite a low polymorphism rate of 25%, has a P.I.C. of 0.36, the highest among the primers, but a limited band count reduces its overall impact. Primer SCoT24 has no polymorphic bands, resulting in a P.I.C. and Marker Index (MI) of 0.00 (Figure 5).
The average values across primers show an average polymorphism of 49.44%, with a mean P.I.C. of 0.34 and an MI of 1.12. The resolving power (Rp) ranges from 0.96 to 4.80, with SCoT1 showing the highest Rp, reflecting its capacity to differentiate among polymorphic bands effectively. Overall, primers like SCoT1 and SCoT11 are notably effective in capturing genetic diversity, whereas SCoT24’s performance is limited due to its lack of polymorphic bands (Figure 6).
The correlation matrix displays relationships between various SCoT primers (SCoT1, SCoT3, SCoT6, SCoT11 and SCoT36), with values ranging from −1 to 1, where 1 signifies a perfect positive correlation, −1 signifies a perfect negative correlation and 0 signifies no correlation.
SCoT1 shows a moderate negative correlation with SCoT3 (−0.39), a slight positive correlation with SCoT6 (0.152), a slight positive correlation with SCoT11 (0.11) and a strong positive correlation with SCoT36 (0.834). SCoT3 has a very slight positive correlation with SCoT6 (0.073), a strong negative correlation with SCoT11 (−0.62) and a strong negative correlation with SCoT36 (−0.687). SCoT6 exhibits a moderate positive correlation with SCoT11 (0.577) and a slight negative correlation with SCoT36 (−0.361). SCoT11 shows a slight positive correlation with SCoT36 (0.415) (Figure 6).
The high correlation between SCoT1 and SCoT36 (0.834) indicates redundancy, while the strong negative correlation between SCoT3 and SCoT11 (−0.62) suggests they target different genomic regions, providing complementary information. Moderate correlations among other pairs reflect a mix of redundancy and complementarity. This matrix helps in selecting effective primers for genetic studies by highlighting both overlapping and unique genomic regions targeted by the primers, thereby facilitating comprehensive and efficient genomic analysis.

3.2.3. Cluster Analysis of J. regia Populations Using DAMD and SCoT Primers

In order to identify genetic similarities and differences among the five studied J. regia populations, a cluster analysis of J. regia populations using DAMD and SCoT primers was conducted (Figure 7). The dendrogram analysis indicates the existence of two main genetic groups in the studied J. regia populations: a homogeneous group represented by populations J1L and J2C, with low genetic diversity, and a second more diverse group, where populations J5CH and J3J are very similar to each other and J4LH shows moderate genetic diversity compared to them (Figure 7).
These results are relevant for genetic studies of J. regia, providing a detailed understanding of these populations’ diversity and genetic structures. The obtained information can facilitate the conservation and efficient management of the genetic resources of this species, contributing to conservation and genetic improvement strategies.

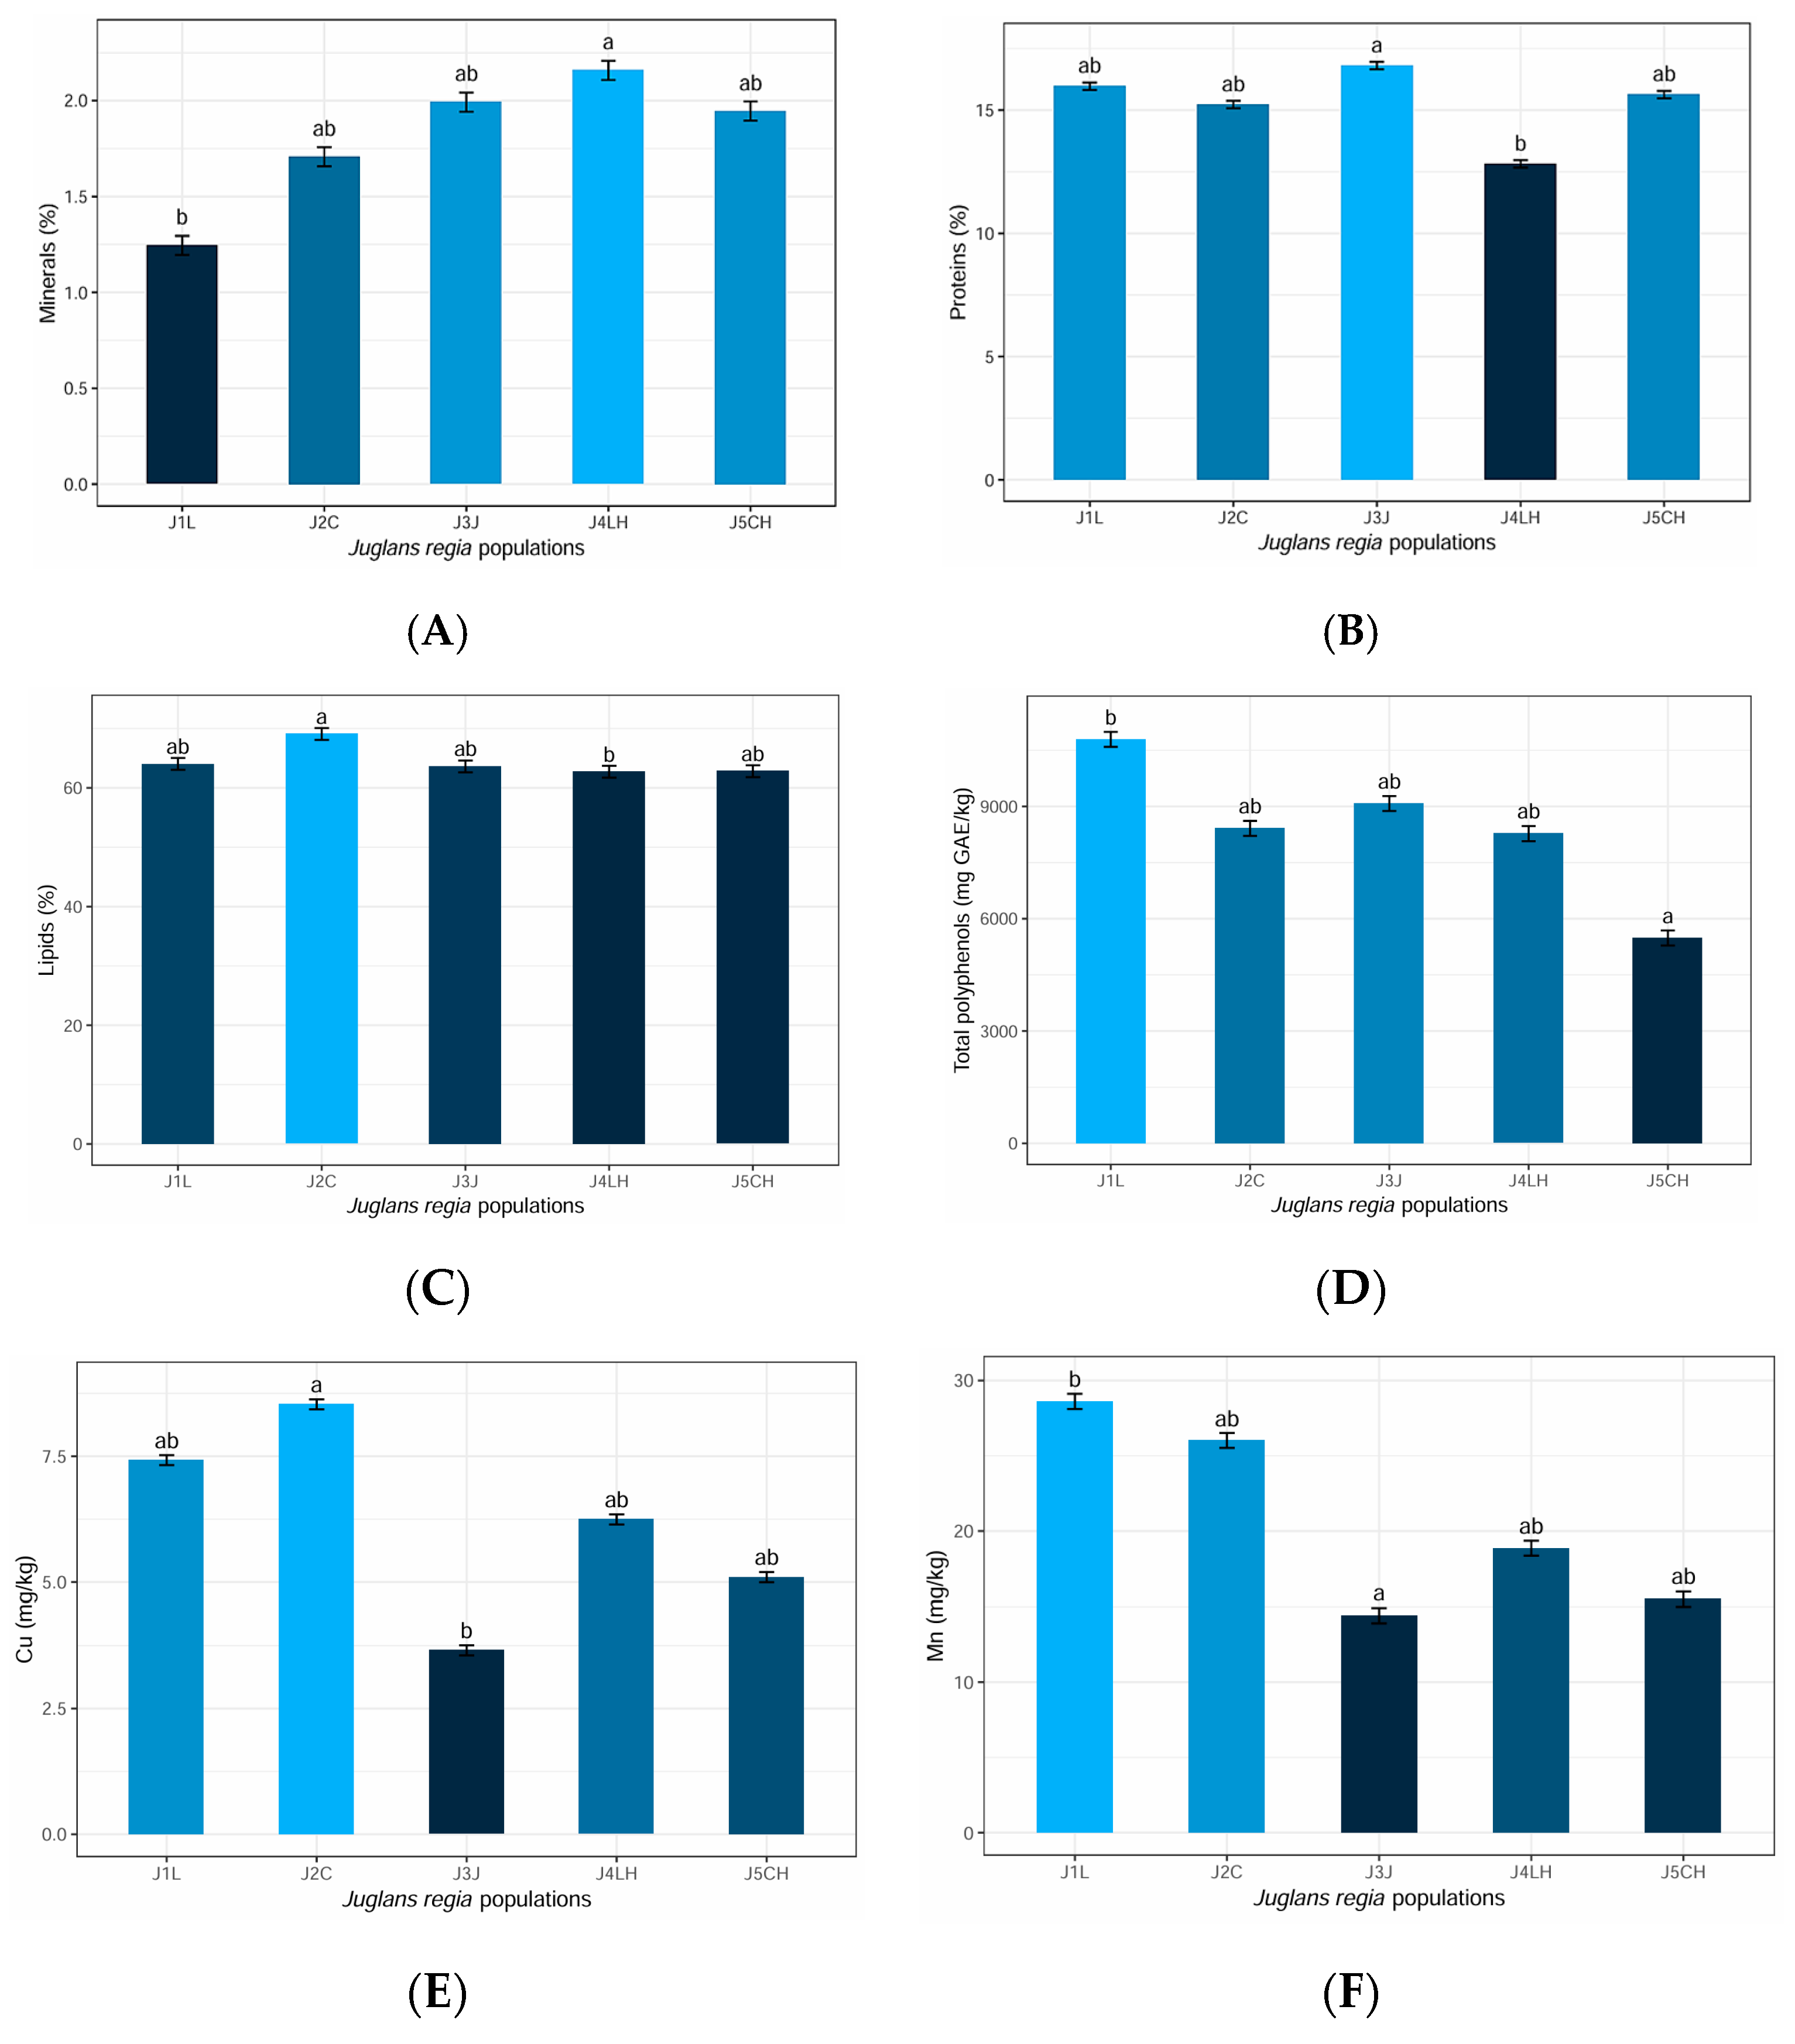
3.3. Statistical Analyses Made on Chemical Parameters of Walnut Kernels

Walnut kernels contain approximately 62–68% lipids, 15–24% protein, 12–16% carbohydrates, 1.5–2.0% dietary fiber, 1.7–2.0% minerals and 100 to 200 mg of total polyphenols per 100 g [20].

3.3.1. Descriptive Statistics of Chemical Parameters

Based on the descriptive statistical analyses conducted on the chemical parameters present in the walnut kernels of the five studied J. regia populations, the following is evident:
  • the kernels of population J1L contain the following averages and standard deviations:
    -
    The average mineral content is 1.24461% with a standard deviation of 0.16085%.
    -
    The mean protein content is 15.97514% with a standard deviation of 0.23905%.
    -
    The mean lipid content is 64.02981% with a standard deviation of 0.01913%.
    -
    The mean of total polyphenols is 10788.4 (mg G.A.E./kg) with a standard deviation of 0 (mg G.A.E./kg);
    -
    The average Cu content is 7.423 (mg/kg) with a standard deviation of 0.018 (mg/kg);
    -
    The average Mn content is 28.618 (mg/kg) with a standard deviation of 0.021(mg/kg);
    -
    The average Zn content is 19.813 (mg/kg) with a standard deviation of 0.017(mg/kg);
  • the kernels of population J2C contain the following averages and standard deviations:
    -
    The average mineral content is 1.70758% with a standard deviation of 0.19267%.
    -
    The mean protein content is 15.23205% with a standard deviation of 0.17361%.
    -
    The mean lipid content is 69.08254% with a standard deviation of 0.22905%.
    -
    The mean of total polyphenols is 8412.45 (mg G.A.E./kg) with a standard deviation of 6.639 (mg G.A.E./kg);
    -
    The average Cu content is 8.532 (mg/kg) with a standard deviation of 0.0208 (mg/kg);
    -
    The average Mn content is 26.024 (mg/kg) with a standard deviation of 0.020 (mg/kg);
    -
    The average Zn content is 46.583 (mg/kg) with a standard deviation of 0.020 (mg/kg);
  • the kernels of population J3J contain the following averages and standard deviations:
    -
    The average mineral content is 1.99238% with a standard deviation of 0.21141%.
    -
    The mean protein content is 16.80667% with a standard deviation of 0.13813%.
    -
    The mean lipid content is 63.60393% with a standard deviation of 0.25422%.
    -
    The mean of total polyphenols is 9075.42 (mg G.A.E./kg) with a standard deviation of 5.75 (mg G.A.E./kg);
    -
    The average Cu content is 3.655 (mg/kg) with a standard deviation of 0.019 (mg/kg);
    -
    The average Mn content is 14.408 (mg/kg) with a standard deviation of 0.019 (mg/kg);
    -
    The average Zn content is 20.474 (mg/kg) with a standard deviation of 0.019 (mg/kg);
    -
    The average Pb content is 2.27 (mg/kg) with a standard deviation of 0.018 (mg/kg);
    -
    The average Cd content is 0.034 (mg/kg) with a standard deviation of 0.00207 (mg/kg);
  • the kernels of population J4LH contain the following averages and standard deviations:
    -
    The average mineral content is 2.15819% with a standard deviation of 0.13958%.
    -
    The mean protein content is 12.81847% with a standard deviation of 0.15009%.
    -
    The mean lipid content is 62.71121% with a standard deviation of 0.15463%.
    -
    The mean of total polyphenols is 8272.57 (mg G.A.E./kg) with a standard deviation of 3.319 (mg G.A.E./kg);
    -
    The average Cu content is 6.245 (mg/kg) with a standard deviation of 0.018 (mg/kg);
    -
    The average Mn content is 18.867 (mg/kg) with a standard deviation of 0.019 (mg/kg);
    -
    The average Zn content is 20.836 (mg/kg) with a standard deviation of 0.021 (mg/kg);
    -
    The average Pb content is 1.661 (mg/kg) with a standard deviation of 0.021 (mg/kg).
    -
    The average Cd content is 0.08065 (mg/kg) with a standard deviation of 0.01152 (mg/kg).
  • the kernels of population J5CH contain the following averages and standard deviations:
    -
    The average mineral content is 1.94603% with a standard deviation of 0.19136%.
    -
    The mean protein content is 15.63188% with a standard deviation of 0.25873%.
    -
    The mean lipid content is 62.81324% with a standard deviation of 0.14332%.
    -
    The mean of total polyphenols is 5484.66 (mg G.A.E./kg) with a standard deviation of 3.319 (mg G.A.E./kg);
    -
    The average Cu content is 5.098 (mg/kg) with a standard deviation of 0.017 (mg/kg);
    -
    The average Mn content is 15.496 (mg/kg) with a standard deviation of 0.018 (mg/kg);
    -
    The average Zn content is 21.547 (mg/kg) with a standard deviation of 0.022 (mg/kg);
    -
    The average Pb content is 1.204 (mg/kg) with a standard deviation of 0.019 (mg/kg);
    -
    The average Cd content is (mg/kg) with a standard deviation of (mg/kg);

3.3.2. Comparisons between Chemical Parameters

Comparisons between the Average Mineral Contents

Cosmulescu et al. (2009) identified the following mineral elements in the kernels of nine walnut cultivars from Romania. Na, K, Ca, Mg, Fe, Mn, Cu, Se, Al, Cr and Zn. Of these, K, Mg and Ca showed the highest concentrations [21].
In our samples, the ash content of walnut kernels ranged from 1.24% (J1L) to 2.16% (J4LH) of the total dry weight, indicating a notable presence of mineral substances. These values are comparable to those reported by Iordănescu et al. (2021), which ranged from 1.31% to 2.49% [12].
The average mineral content for the five studied J. regia populations falls within the expected range for high-quality nuts.
Significant differences (p < 0.05) were observed between the mineral contents of samples J1L (1.24461%) and J4LH (2.15819%), which can be attributed to differences in soil composition.
In contrast, there are no significant differences (p > 0.05) between the mineral content of the following samples: J1L—1.24461% and J2C—1.70758%; J1L—1.24461% and J3J—1.99238%; J1L—1.24461% and J5CH—1.94603%; J2C—1.70758% and J3J—1.99238%; J2C—1.70758% and J4LH—2.15819%; J2C—1.70758% and J5CH—1.94603%; J3J—1.99238% and J4LH—2.15819%; J3J—1.99238% and J5CH—1.94603%; J4LH—2.15819% and J5CH—1.94603% (Figure 8A).

Comparisons between the Means of Protein Content

The walnut, rich in essential amino acids, is a significant source of plant-based protein for human nutrition [15].
The specific percentage of protein content in walnut kernels depends on factors such as walnut variety and growing conditions, but it generally falls within the range of approximately 15–24% of the kernel’s weight. In our samples, the protein content ranged from 12.82% (J4LH) to 16.81% (J3J). These values are consistent with those reported by Pereira et al. (2008) [18], which ranged from 14.38% to 18.03%, and by Iordănescu et al. (2021) [12], which reported a range of 12.73% to 20.41%.
There are significant differences (p < 0.05) between the protein content of samples J3J—16.80667% and J4LH—12.81847%.
In contrast, there are no significant differences (p > 0.05) between the protein content of the following samples: J1L—15.97514% and J2C—15.23205%; J1L—15.97514% and J3J—16.80667%; J1L—15.97514% and J5CH—15.63188%; J2C—15.23205% and J3J—16.80667%; J2C—15.23205% and J4LH—12.81847%; J2C—15.23205% and J5CH—15.63188%; J3J—16.80667% and J5CH—15.63188%; J4LH—12.81847% and J5CH—15.63188% (Figure 8B).

Comparisons between the Means of Lipid Content

The health benefits of consuming walnut kernels are associated with their lipid composition. Complex lipids’ properties and nutritional value are closely related to their aliphatic monocarboxylic acid composition. Exceptional levels of fatty acids in walnut kernels, such as myristic acid (14:0) up to 14.4%, linoleic acid (18:2n-6) up to 69.0% and alpha-linolenic acid (18:3n-3) up to 15.6%, contribute to its status as an extraordinary functional food [17,18]. Abbattista R et al. (2024) was the first to describe the deep lipid profile of the walnut pellicle, identifying multiple classes of unusual fatty acids, including oxylipins, dicarboxylic fatty acids (DC-FAs) and fatty acid amides (F.A.A.s), which are bioactive lipids [76,77].
In our samples, total lipid content ranges from 60.39% (J3J) to 69.08% (J2C), aligning with reported values for walnut kernels, which typically exhibit high lipid content between 64% and 72% [12,78].
There are significant differences (p < 0.05) between the lipid content of samples J2C—69.08254% and J4LH—62.71121%.
In contrast, there are no significant differences (p > 0.05) between the lipid content of the following samples: J1L—64.02981% and J2C—69.08254%; J1L—64.02981% and J3J—63.60393%; J1L—64.02981% and J4LH—62.71121%; J1L—64.02981% and J5CH—62.81324%; J2C—69.08254% and J3J—63.60393%; J2C—69.08254% and J5CH—62.81324%; J3J—63.60393% and J4LH—62.71121%; J3J—63.60393% and J5CH—62.81324%; J4LH—62.71121% and J5CH—62.81324% (Figure 8C).

Comparisons between the Means of Total Polyphenols

Phenolics act synergistically with lipids to provide the health benefits associated with walnut consumption [19,77,79]. In our samples, the total phenolic content ranged from 5484.66 mg G.A.E./kg (J5CH) to 10,788.40 mg G.A.E./kg (J1L), which is consistent with previous studies that reported an average total phenolic content in walnuts ranging from 750.67 to 1245.64 mg G.A.E. ml−1 [80].
There are significant differences (p < 0.05) between the total polyphenol content of samples J1L—10,788.4 (mg G.A.E./kg) and J5CH—5484.66 (mg G.A.E./kg).
In contrast, there are no significant differences (p > 0.05) between the total polyphenol content of the following samples: J1L—10,788.4 (mg GAE/kg) and J2C—8412.45 (mg GAE/kg); J1L—10,788.4 (mg GAE/kg) and J3J—9075.42 (mg GAE/kg); J1L—10,788.4 (mg GAE/kg) and J4LH—8272.57 (mg GAE/kg); J2C—8412.45 (mg GAE/kg) and J3J—9075.42 (mg GAE/kg); J2C—8412.45 (mg GAE/kg) and J4LH—8272.57 (mg GAE/kg); J2C—8412.45 (mg GAE/kg) and J5CH—5484.66 (mg GAE/kg); J3J—9075.42 (mg GAE/kg) and J4LH—8272.57 (mg GAE/kg); J3J—9075.42 (mg GAE/kg) and J5CH—5484.66 (mg GAE/kg); J4LH—8272.57 (mg GAE/kg) and J5CH—5484.66 (mg GAE/kg) (Figure 8D).

Comparisons between the Means of Trace Elements and Heavy Metals

Plants absorb heavy metals from the environment and transport them to their fruits, which may be transferred through the food chain (Table 4).
Therefore, exposure to toxic elements could result from walnut kernels. In this context, an assessment of the toxicological aspects and information to consumers on both their nutritional characteristics and potential health risks should be provided for walnuts.
Thus, we compared our results with the literature values (Table 4) and the maximum limit allowed in food for the analyzed heavy metals.

Comparisons between the Average Cu Contents

The recommended dietary intake of copper for adults is approximately 0.9 mg/day [81].
Except for sample J3J—3.655 mg/kg, all samples (J5CH, J4LH, J1L, J2C) exceed the maximum permissible limit in food for Cu (5.0 mg/kg) [82].
There are significant differences (p < 0.05) between the Cu content of samples J2C—8.532 (mg/kg) and J3J—3.655 (mg/kg).
In contrast, there are no significant differences (p > 0.05) between the Cu content of the following samples: J1L—7.423 (mg/kg) and J2C—8.532 (mg/kg); J1L—7.423 (mg/kg) and J3J—3.655 (mg/kg); J1L—7.423 (mg/kg) and J4LH 6.245 (mg/kg); J1L—7.423 (mg/kg) and J5CH 5.098 (mg/kg); J2C—8.532 (mg/kg) and J4LH 6.245 (mg/kg); J2C—8.532 (mg/kg) and J5CH 5.098 (mg/kg); J3J—3.655 (mg/kg) and J4LH 6.245 (mg/kg); J3J—3.655 (mg/kg) and J5CH 5.098 (mg/kg); J4LH 6.245 (mg/kg) and J5CH 5.098 (mg/kg) (Figure 8E).
The highest values were determined in sample J2C—8.532 (mg/kg), lower than the values reported by Cosmulescu et al. [21], Yin et al. [81] and Moreda–Piñeiro et al. [82] (Table 4).

Comparisons between the Average Mn Contents

Manganese’s appropriate dose for adults is 2–2.3 (mg/day) (dietary reference intake) and the maximum admitted limit in food for Mn is 10 (mg/kg) [83,84].
There are significant differences (p < 0.05) between the Mn content of samples J1 L—28.618 (mg/kg) and J3J—14.408 (mg/kg).
In contrast, there are no significant differences (p > 0.05) between the Mn content of the following samples: J1L—28.618 (mg/kg) and J2C—26.024 (mg/kg); J1L—28.618 (mg/kg) and J4LH—18.867 (mg/kg); J1L—28.618 (mg/kg) and J5CH—15.496 (mg/kg); J2C—26.024 (mg/kg) and J3J—14.408 (mg/kg); J2C—26.024 (mg/kg) and J4LH—18.867 (mg/kg); J2C—26.024 (mg/kg) and J5CH—15.496 (mg/kg); J3J—14.408 (mg/kg) and J4LH—18.867 (mg/kg); J3J—14.408 (mg/kg) and J5CH—15.496 (mg/kg) (Figure 8F and Table 4). The average Mn content determined in samples J1L, J2C, J3J, J4LH and J5CH was in the range 14.408–28.618 (mg/kg); the highest values were recorded in sample J1L—28.618 (mg/kg), taken from Lugoj. These values are like those reported by Moreda–Piñeiro et al. [82] but lower than those reported by Cosmulescu et al. [21] and higher than those reported by Yin et al. [81].
The lowest values were recorded in sample J3J—14.408 (mg/kg), taken from Jupa.

Comparisons between the Averages of Zn Content

Ingestion is the only way to obtain zinc, an essential trace element for the human body. The maximum admissible Zn dose is 300 µg·kg−1 b w day−1 and the maximum admitted limit in food for Zn is 5–20 mg/kg [83,84].
There are significant differences (p < 0.05) between the Zn content of samples J1L—19.813 (mg/kg) and J2C—46.583 (mg/kg)
In contrast, there are no significant differences (p > 0.05) between the Zn content of the following samples: J1L—19.813 (mg/kg) and J3J—20.474 (mg/kg); J1L—19.813 (mg/kg) and J4LH—20.836 (mg/kg); J1L—19.813 (mg/kg) and J5CH—21.547 (mg/kg); J3J—20.474 (mg/kg) and J4LH—20.836 (mg/kg); J3J—20.474 (mg/kg) and J5CH—21.547 (mg/kg); J3J—20.474 (mg/kg) and J2C—46.583 (mg/kg); J4LH—20.836 (mg/kg) and J5CH—21.547 (mg/kg); J4LH—20.836 (mg/kg) and J2C—46.583 (mg/kg); J5CH—21.547 (mg/kg) and J2C—46.583 (mg/kg) (Figure 8G).
The Zn content in the walnut kernels was in the range of 19.813–46.583 (mg/kg). These values are like those reported by other researchers. The highest value, 46.583 (mg/kg)—J2C, is higher than those reported by Cosmulescu et al. [21] and Yin et al. [81] and lower than those reported by Moreda–Piñeiro et al. [82] (Table 4).

Comparisons between the Averages of Pb Content

Lead (Pb) is highly toxic and could affect almost every organ in the human body.
According to Regulation (EU) 2023/915, the maximum allowable lead content for fruits, vegetables and fungi ranges from 0.1 mg/kg to 0.8 mg/kg [85]. The prolonged intake of even the maximum daily intake of lead (0.1 mg/kg) is dangerous for humans [86].
Pb was not detected in walnut kernels sampled from J1L and J2C. The lowest values were recorded in sample J5CH—1.204 (mg/kg) and the highest was recorded in sample J3J—2.27 (mg/kg). Including J4LH—1.661 (mg/kg), these three values exceed the maximum admitted limit in food for Pb (0.1 mg/kg) [85]. There are significant differences (p < 0.05) between the Pb content of samples J3J—2.27 (mg/kg) and J5CH—1.204 (mg/kg).
There are no significant differences (p > 0.05) between the Pb content of the following samples: J3J—2.27 (mg/kg) and J4LH—1.661 (mg/kg); J5CH—1.204 (mg/kg) and J4LH—1.661 (mg/kg) (Figure 8H).

Comparisons between the Averages of Cd Content

Cadmium and exposure to the compound are related to the development of several cancers. The maximum admitted limit in food for Cd is 0.05 mg/kg and the maximum monthly uptake is 0.025 mg/kg bw [84]. According to Regulation (EU) 2023/915, the maximum allowable cadmium content for fruits, vegetables and fungi ranges from 0.02 mg/kg to 0.5 mg/kg [85].
Cd was not detected in walnut kernels sampled from J1L, J2C and J5CH. Traces of Cd—0.03451 (mg/kg) < 0.05 (mg/kg) were found in the J3J walnut kernel. High cadmium levels of 0.08065 mg/kg, which exceed the maximum allowable limit of 0.05 mg/kg for fruits [84], were detected only in walnut kernels from J4LH (Figure 8I). Both values obtained for Cd are higher than those reported by Yin et al. [81] (Table 4).

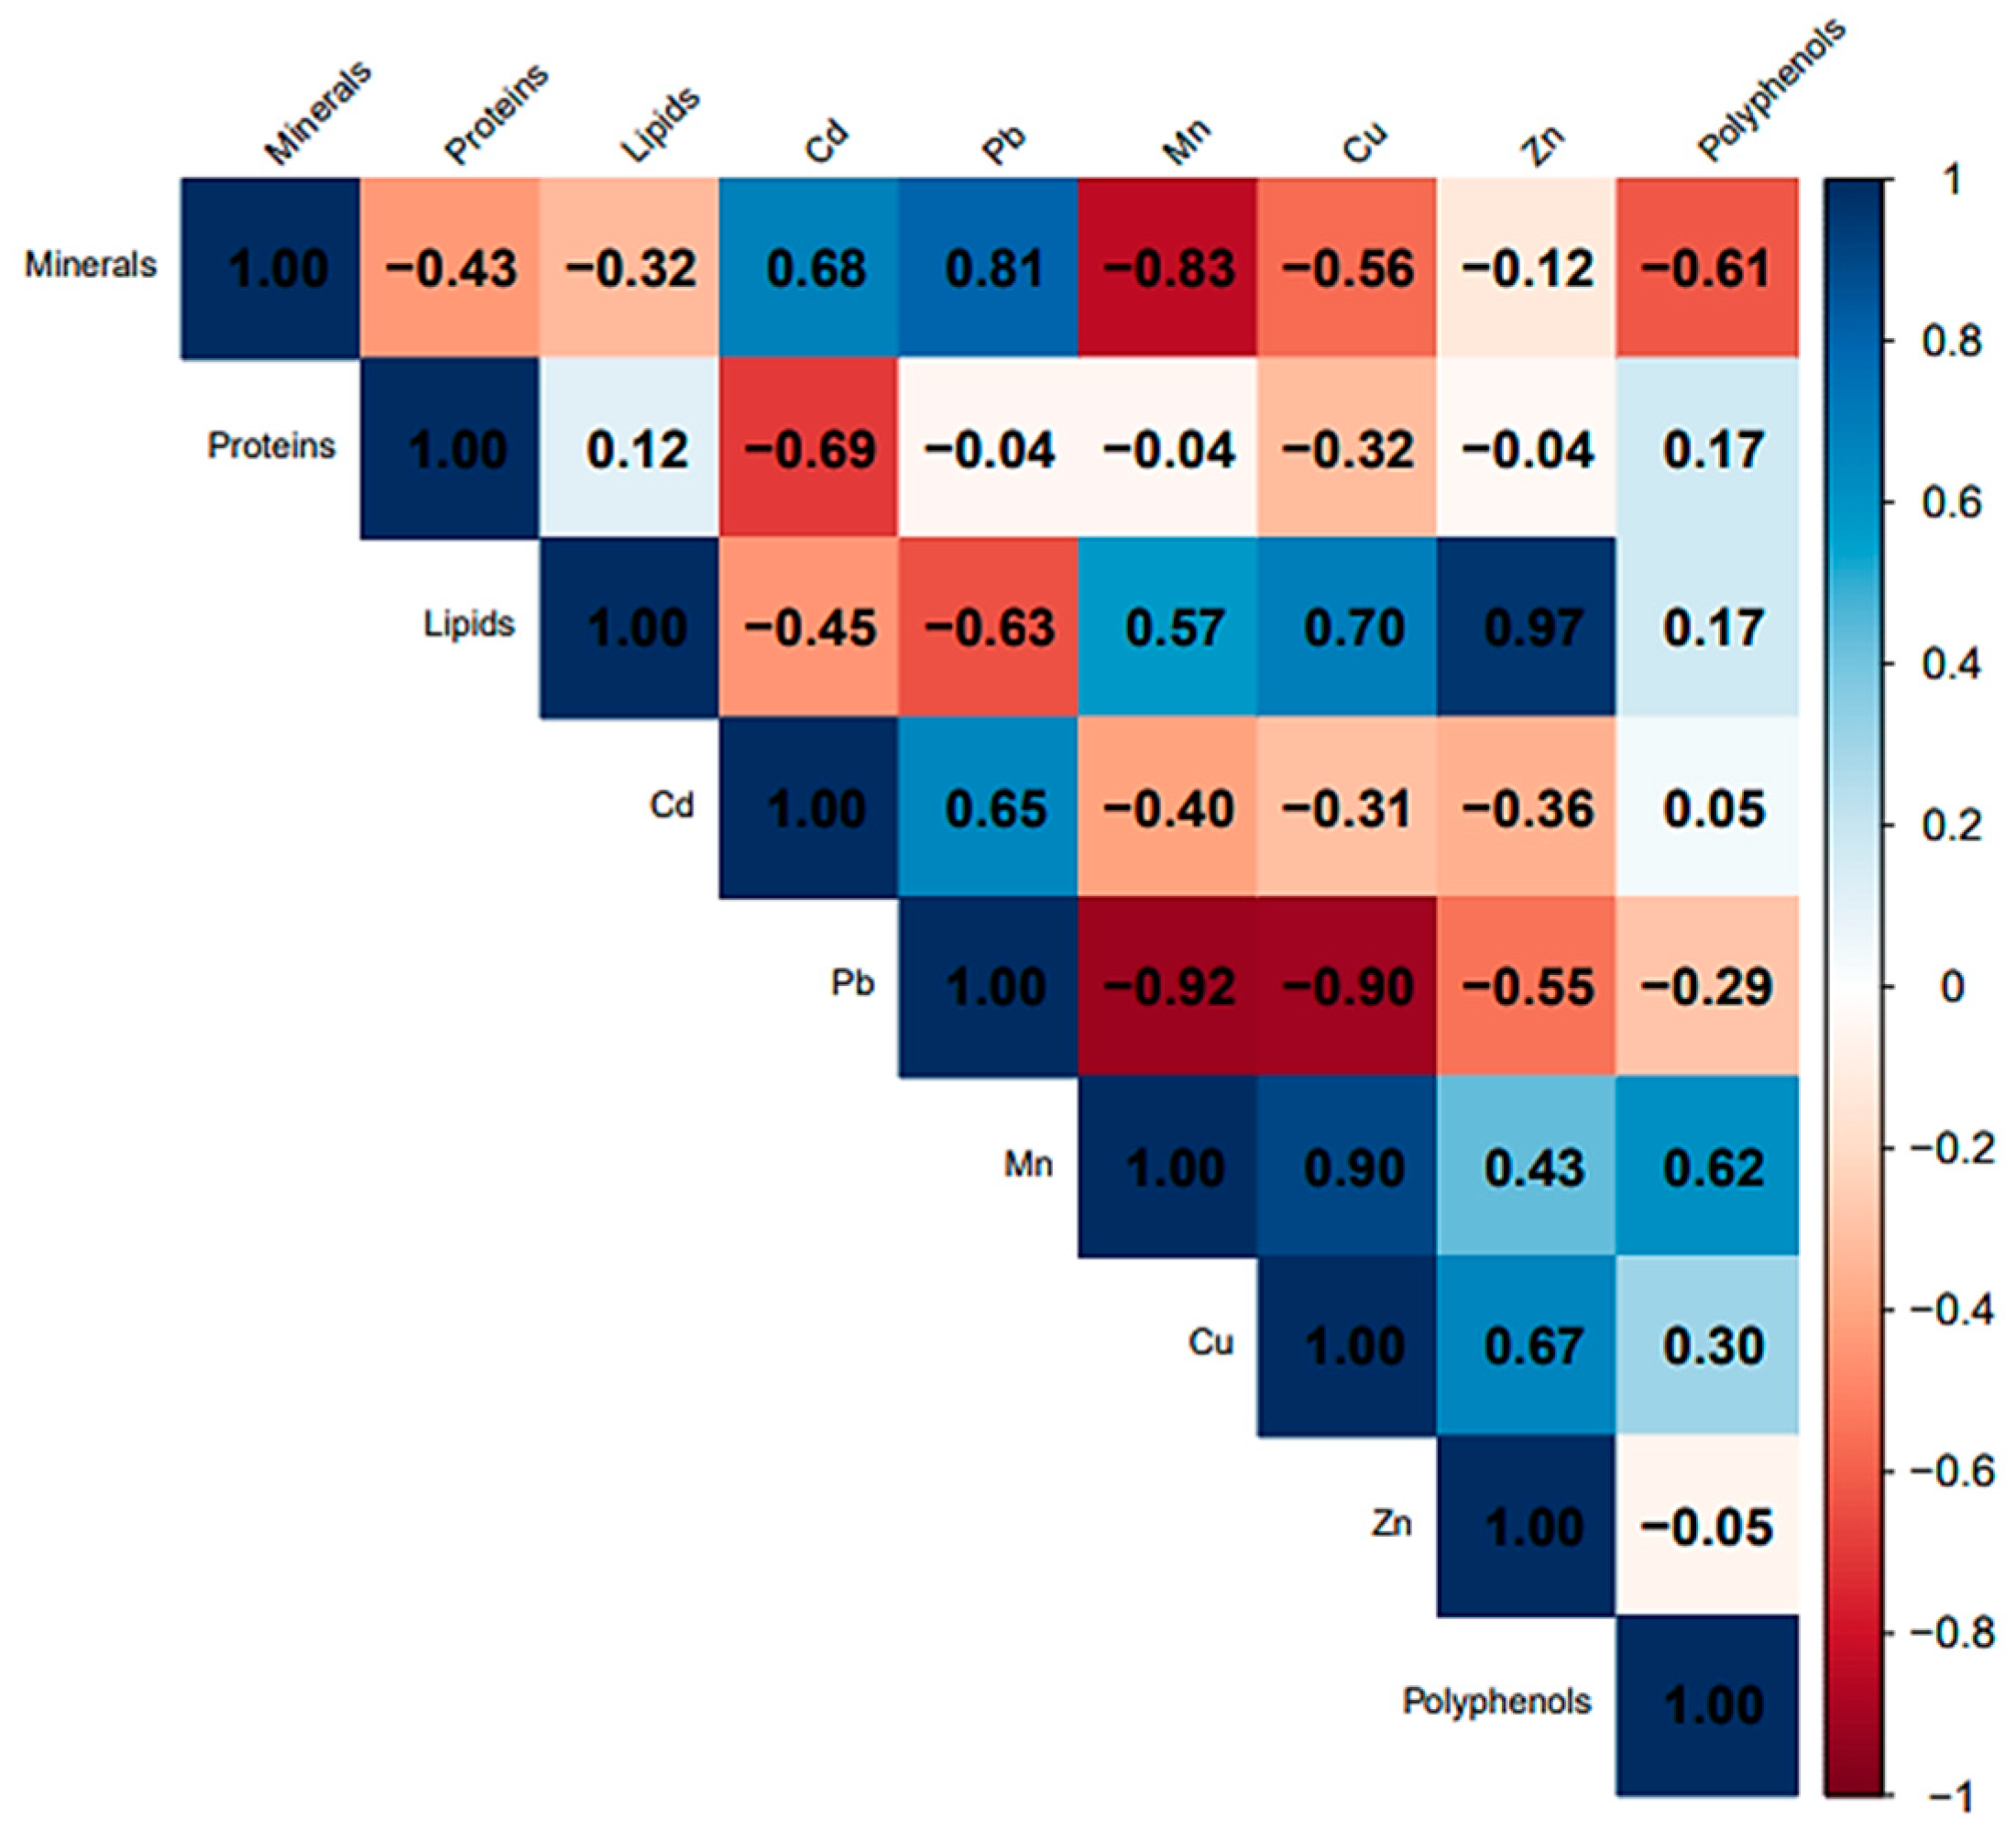
3.3.3. Correlations and Linear Regressions between Chemical Parameters

Pearson correlation coefficients (Figure 9) and simple linear regressions (Figure 10), computed to assess the linear relationships between the chemical parameters, showed the following:
-
There are >0.8 statistically significant high positive correlations between the following:
-
minerals and Pb r (3) = 0.81, p < 0.05;
-
Zn and lipids (r (3) = 0.97, p = 0.0072 < 0.05, Zn = −250 + 4.2 lipids) (Figure 10A);
-
Cu and Mn (r (3) = 0.90, p = 0.036 < 0.05, Cu = 0.57 + 0.27 Mn) (Figure 10B).
-
There are <−0.8 statistically significant high negative correlations between the following:
-
minerals and Mn r (3) = −0.83, p < 0.05;
-
Pb and Mn (r (3) = −0.92, p = 0.029 < 0.05, Pb = 4 − 0.15 Mn) (Figure 10C);
-
Pb and Cu (r (3) = −0.90, p = 0.036 < 0.05, Pb = 4 − 0.48 Cu) (Figure 10D).

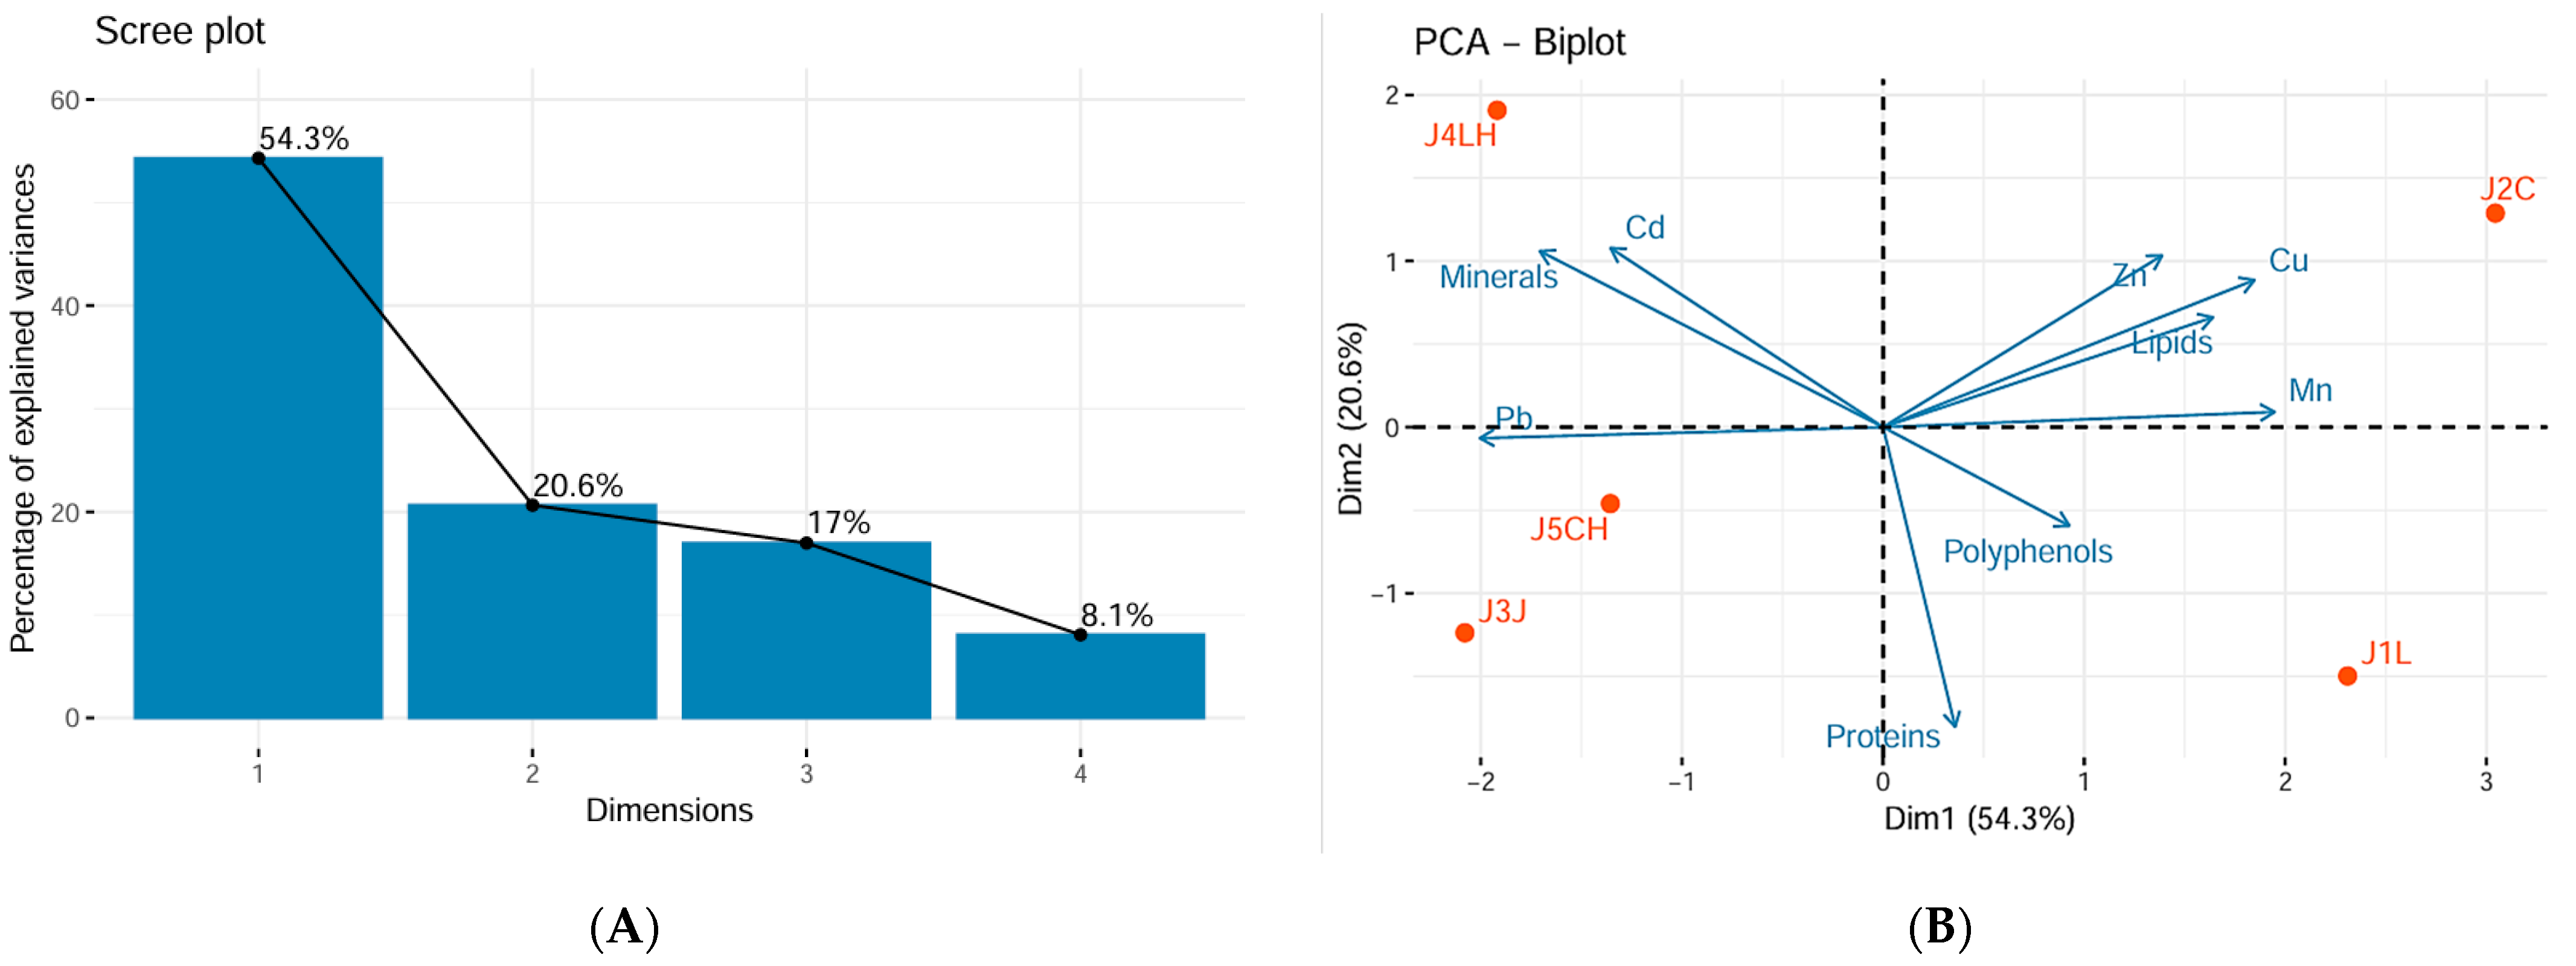
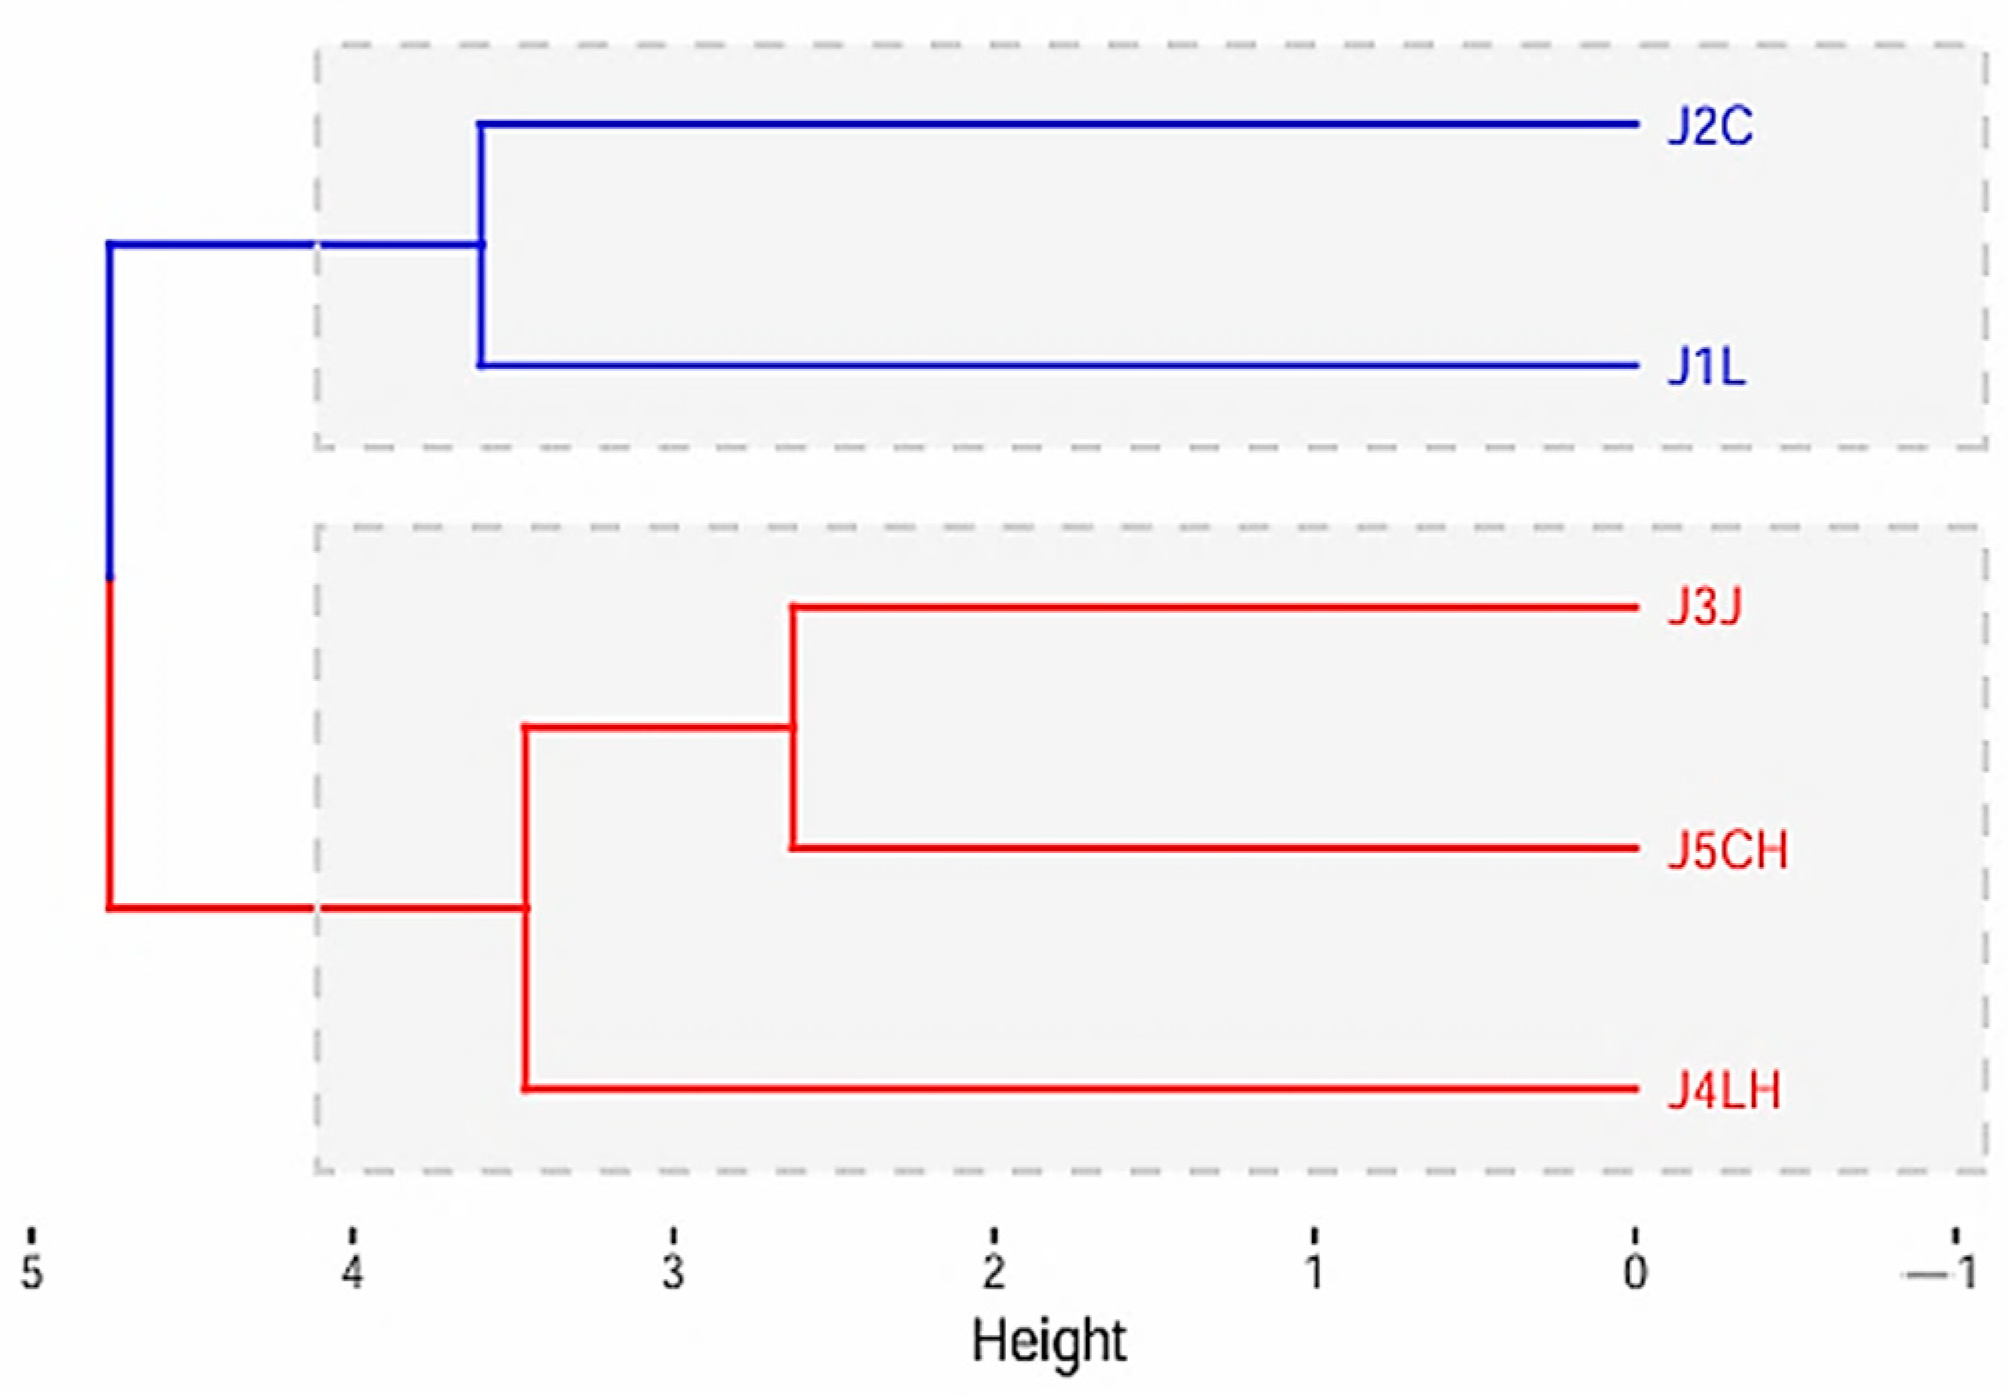
3.3.4. Principal Component Analysis and Cluster Analysis

The inertia of the first principal components shows if there are strong relationships between variables and suggests the number of components that should be studied. The first two principal components of analysis express 74.9% of the total dataset inertia; that means that 74.9% of the individual’s cloud’s total variability is explained by the plane spanned by the first two principal components (Figure 11A).
This percentage is very high; thus, the first plane represents data variability very well. This value is greater than the reference value (50.39%); the variability explained by this plane is thus highly significant (the reference value is the 0.95-quantile of the inertia percentage distribution obtained by simulating 6543 data tables of equivalent size based on a standard distribution).
The first principal component factor is significant; it expresses itself in 54.4% of the data variability (Figure 11B). Note that in such a case, the variability related to the other components might be meaningless despite a high percentage. This axis presents an amount of inertia more significant than those obtained by the 0.95-quantile of random distributions (54.3% against 20.6%) (Figure 11A,B).
This observation suggests that this axis carries excellent information. The most important contribution for this component comes from the following variables: Pb, Mn, Cu, mineral and lipid content (which are all highly correlated) (Figure 11C).
The second principal component expresses 20.6% of the data variability (Figure 11A,B). The most important contribution of this component comes from the variables of proteins, Cd and Zn (which are all highly correlated) (Figure 11D).
Cluster analysis, the dendrogram for all J. regia populations studied, is presented in Figure 12. This highlights the clustering of the studied J. regia populations according to the analyzed chemical parameters
The dendrogram analysis indicates the existence of two main groups in the studied J. regia populations: a homogeneous group represented by populations J1L and J2C and a second, more diverse group, where populations J5CH and J3J are very similar to each other and to J4LH. This dendrogram once again shows the similarities regarding chemical parameters between the members of the same group, highlighted by the statistical analysis from our chemical analysis section.
This research on walnut trees (J. regia) grown in urban areas is important for understanding the nutritional value and potential risks of eating their raw kernels. The findings provide detailed information about the quality of the walnuts produced in these city environments, which is crucial for human health.

4. Discussion

Using G.I.S. and GNSS solutions to enhance decision-making processes in the planning and efficient management of urban green infrastructures is currently a well-established practice [87,88]. According to our survey of the studied public green spaces using G.I.S. and GNSS technologies (2016–2023), a total of 2174 J. regia individuals were identified: 1537 among 23,762 trees and shrubs in Lugoj (6.5%) and 637 among 6955 trees and shrubs in Caransebeș (including Jupa) (9.2%). These findings highlight that, due to its fruits’ nutritional richness and its ecological, social, cultural and aesthetic contributions to urban landscapes, J. regia is a significant presence in the studied green infrastructures, particularly in the street alignments of residential neighborhoods. This is consistent with the observations of Janku et al. (2017) regarding the presence of J. regia in various elements of the urban landscape, such as municipal forests, parks and wastelands, with a predominant occurrence in linear plantings [89]. Paź-Dyderska et al. (2021) revealed that due to the impact of climate change, J. regia may face threats in Southern Europe and could become invasive in northern areas [90]. Although J. regia generates numerous ecosystem services, Pataki et al. (2021) argue that urban trees are more promising for climate change and pollution adaptation strategies rather than mitigation strategies [15].
Our dendrometric measurements conducted on 150 J. regia tree individuals, forming five populations within the Banat Region, provided significant insights into their growth patterns and overall health. By measuring dendrometric indices such as total tree height (Ht) and diameter at breast height (DBH), we gained a comprehensive understanding of the structural attributes of the walnut trees studied. These dendrometric measurements indicated that the average medium trunk diameter at breast height (DBHm) of J. regia populations ranged from 27 cm to 36.32 cm, while the mean total tree height (Ht) ranged from 7.5 m to 8.8 m. According to naked-eye observations, all trees exhibited good vitality, strongly adapting to local biotic and abiotic factors. Through robust statistical methods, we identified trends and relationships within the data, highlighting the factors that influence the growth dynamics of J. regia under different environmental conditions. This detailed examination enhances our understanding of these trees and contributes to the broader fields of landscape architecture and conservation biology, emphasizing the importance of maintaining healthy and sustainable urban ecosystems. In order to maintain and prolong their life, urban trees should be monitored periodically. Moreover, understanding the genetic structure and variability of J. regia is critical to developing effective conservation strategies for its long-term survival and resilience in urban landscapes.
The molecular analysis of genetic diversity in J. regia populations using DAMD and SCoT primers provides significant insights into the species’ genetic structure. High levels of polymorphism detected with the DAMD05 (54.54%) and DAMD06 (66.66%) primers indicate substantial genetic variability, which is crucial for the species’ adaptability and resilience. The DAMD05 and DAMD06 primers also demonstrated high Polymorphic Information Content (P.I.C.) values of 0.35 and 0.31, respectively, underscoring their effectiveness in genetic analysis. These high P.I.C. values suggest that these primers provide substantial genetic information, aiding in the differentiation of genotypes.
In contrast, SCoT primers displayed lower and more variable polymorphism, averaging 49.44%. While SCoT1 and SCoT11 were effective, SCoT24 showed no polymorphism, reducing its utility. Although SCoT36 had a high P.I.C., its low polymorphism limited its impact. Correlation analysis revealed that DAMD05 and DAMD06 target distinct genomic regions, offering complementary genetic information.
Cluster analysis identified two main genetic groups among the J. regia populations: one homogeneous group represented by populations J1L and J2C, characterized by low genetic diversity, and a second, more diverse group, where populations J5CH and J3J are very similar to each other, while J4LH exhibits moderate genetic diversity compared to them. These findings enhance the understanding of genetic similarities and differences, which is essential for conservation efforts.
According to Ye et al. (2024), the J. regia populations in Central Asia exhibit moderate genetic diversity, so they should be protected through both “in situ” and “ex situ” conservation measures [10]. Similarly, Shahi Shavvon et al. (2023) emphasized the necessity of genetic conservation resources for the future improvement in walnut breeding programs [9].
Therefore, by utilizing strategic molecular analysis methods, as demonstrated in this study, there is a significant opportunity to enhance efforts in the molecular conservation sector, particularly through the use of DAMD primers. Tabasi et al. (2020) demonstrated the effectiveness of SCoT molecular markers in genetic fingerprinting and evaluating genetic diversity in J. regia, revealing that most analyzed populations exhibit substantial genetic differentiation [42].
In our study, we additionally compared the effectiveness of SCoT with DAMD and demonstrated that DAMD primers are more efficient in determining genetic diversity. Khan et al. (2023) provided new insights into the phytogeographic history of J. regia L. by using the codominant Simple Sequence Repeat (SSR) markers, demonstrating their efficiency in determining genetic diversity and heterozygosity [4]. Thus, it is necessary to employ a molecular economic strategy to select the best primers by using statistical calculations similar to those performed in this study. This approach, combined with the use of dominant DAMD primers and, in the future, codominant SSR primers, as demonstrated by numerous authors [91,92], could lead to better results by utilizing both types of primers, thereby obtaining a more comprehensive phylogenetic and conservation perspective on J. regia.
Regarding the chemical composition of walnut kernels, the mineral content ranged from 1.24% to 2.15%, comparable to those reported by Iordănescu et al. (2021) [12], which ranged from 1.31% to 2.49%; the protein content values ranged from 12.81% to 16.80%, and are consistent with those reported by Pereira et al. (2008), which ranged from 14.38% to 18.03%, [18]; total lipid content ranged from 60.39% to 69.08%, aligning with reported values by Li et al. (2023) for walnut kernels, which typically exhibited a high lipid content between 64% and 72% [93]; and the total phenolic content ranged from 5484.66 mg G.A.E./kg to 10,788.40 mg G.A.E./kg, consistent with the findings of Okatan et al. (2022), who reported an average total phenolic content in walnuts ranging from 750.67 to 1245.64 mg G.A.E. ml−1 [80]. The analyzed walnuts are rich in lipids, particularly healthy fats, and contain a significant amount of protein. They are also an excellent source of polyphenols, known for their antioxidant properties.
Except for sample J3J (3.655 mg/kg), all the four samples (J5CH, J4LH, J1L, J2C) exceed the maximum permissible limit for Cu in food (5.0 mg/kg) [79]. Although the highest value found in sample J2C is 8.532 mg/kg, it is still lower than the values reported by Cosmulescu et al. [21], Yin et al. [81] and Moreda–Piñeiro et al. [82].
The appropriate manganese intake for adults is 2–2.3 mg/day (dietary reference intake), with the maximum allowable limit in food set at 10 mg/kg. The average Mn content in samples J1L, J2C, J3J, J4LH and J5CH ranged from 14.408 to 28.618 mg/kg, with the highest value recorded in sample J1L (28.618 mg/kg). These values are comparable to those reported by Moreda–Piñeiro et al. [82], but lower than those reported by Cosmulescu et al. [21] and higher than those reported by Yin et al. [81].
The maximum admissible Zn dose is 300 µg·kg−1 body weight per day, with a food limit of 5–20 mg/kg. Zn content in walnut kernels ranged from 19.813 to 46.583 mg/kg. These values are consistent with those reported by other researchers. The highest value, 46.583 mg/kg in sample J2C, is higher than those reported by Cosmulescu et al. [21] and Yin et al. [81]., but lower than Moreda–Piñeiro et al. [82].
Prolonged intake of even the maximum daily intake of lead (0.1 mg/kg) is dangerous for humans [89]. Pb was not detected in walnut kernels sampled from J1L and J2C. The lowest values were recorded in sample J5CH—1.204 (mg/kg) and the highest in sample J3J—2.27 (mg/kg). Including J4LH—1.661 (mg/kg), these three values exceed the maximum admitted limit in food for Pb (0.1 mg/kg).
Cadmium and exposure to the compound are related to the development of several cancers. The maximum admitted limit in food for Cd is 0.05 mg/kg and the maximum monthly uptake is 0.025 mg/kg bw [79]. Cd was not detected in walnut kernels from samples J1L, J2C and J5CH. Traces of Cd (0.03451 mg/kg) were found in the J3J sample, while higher levels (0.08065 mg/kg) were detected in the J4LH sample. Both values are above those reported by Yin et al. [81].
The levels of heavy metals such as copper, manganese, zinc, lead and cadmium were detected within a specific range. While elements like copper, manganese and zinc are essential in trace amounts, their presence in higher quantities could indicate environmental contamination or other factors influencing their levels in the kernels. Being toxic heavy metals, the presence of lead and cadmium, even in small quantities, is notable and could have implications for food safety. Although walnut kernels are highly recommended for their nutritional properties and polyphenols, their quality diminishes in polluted environments. Therefore, informing people who enjoy tasting local walnut products from urban green infrastructures about their quality is crucial.
This study acknowledges limitations that highlight areas for future research improvements. Environmental factors such as soil type, microclimate and urban pollution were not comprehensively controlled, potentially introducing variability, and influence kernel chemical composition and quality. Our work represents an initial phase in exploring the diversity of J. regia as urban trees in the Banat Region, focusing specifically on data from the 2023 growing season. However, it is essential to acknowledge that the composition of plant components can fluctuate significantly from year to year. Consequently, comprehensive data collection over multiple growing seasons is necessary to accurately assess and understand the variability and trends in J. regia diversity in urban environments. This long-term approach will enable researchers to account for annual environmental fluctuations, leading to more reliable and robust conclusions.
Despite these limitations, this study provides valuable insights into the adaptability of J. regia as an urban tree and introduces innovative methods for understanding and managing their genetic diversity and walnut kernel quality in urban green infrastructures.
The use of statistical analysis to evaluate the efficiency of molecular markers revealed that DAMD primers are more cost-effective compared to SCoT primers. Future studies are needed to better assess the efficacy of other categories of primers in determining the genetic diversity of J. regia.
Their multifaceted significance, encompassing the social services, ecological benefits, and ornamental and nutritive values of the walnut kernel as a local urban food product, positions J. regia as a considerable component of urban landscapes.

5. Conclusions

The understanding of tree diversity in studied urban areas has been significantly enhanced through the application of tree surveys conducted using G.I.S. and GNSS technologies.
Adding genetic profiles of trees to inventories is an interesting and useful tool for identifying where clones are planted in the same street and for evaluating potential disease risks. This integration of technologies supports better decision-making for urban forestry management and contributes to the development of greener, more sustainable urban landscapes. The 150 analyzed trees have a high ornamental and ecological value, being adapted to local biotope conditions.
DAMD primers, especially DAMD05 which had the highest polymorphism detections, were more effective than SCoT primers in detecting genetic diversity in J. regia, showing higher polymorphism rates and better performance in genotype differentiation. These findings highlight the importance of DAMD primers for conservation and genetic improvement, emphasizing the need to preserve genetic diversity for species adaptability and ecosystem stability.
The redundancy between DAMD07 and DAMD04, as well as between SCoT1 and SCoT3, through molecular statistical analysis suggests the potential for eliminating these primers to improve cost efficiency.
The nutritional value and polyphenolic content of walnut kernels are high, making these fruits suitable for consumption as a “local food product.” However, traces of heavy metals such as cadmium (Cd) and lead (Pb) have been detected in some samples, highlighting the impact of environmental pollution on J. regia populations. Their comprehensive chemical profile highlights the nutritional benefits of walnuts while also bringing attention to the potential risks associated with heavy metal contamination. This underscores the need for increased public awareness about the effects of pollution on food safety and health.

Author Contributions

Conceptualization: A.-M.T.-C., D.V.L., S.P., E.O. and M.V.H.; methodology: A.-M.T.-C., S.P., D.V.L., I.S., D.C., A.H., C.A.P., M.V.H., G.P., L.D., C.P., O.A.I. and A.B.; formal analysis: A.-M.T.-C., D.V.L., E.O., C.A.P., L.D., G.P. and O.A.I.; fund acquisition: A.H., D.C., C.A.P. and O.A.I.; investigation: A.-M.T.-C., I.S., E.O. and S.P.; project administration: A.-M.T.-C., D.V.L. and E.O.; writing—original version: A.-M.T.-C., D.V.L., E.O., S.P. and M.V.H. All authors have read and agreed to the published version of the manuscript.

Funding

The payment for the article was made from the research funds of the University of Life Sciences “King Mihai I” from Timișoara.

Institutional Review Board Statement

The research conducted in this article did not involve animals or humans.

Data Availability Statement

The original contributions presented in the study are included in the article, further inquiries can be directed to the corresponding author.

Acknowledgments

The authors are grateful to the University of Life Sciences “King Mihai I” from Timisoara for support with the publication fee.

Conflicts of Interest

The authors declare no conflicts of interest.

References

  1. Yaşlı, R.; Yücedağ, C.; Ayan, S.; Simovski, B. The Role of Urban Trees in Reducing Land Surface Temperature. SilvaWorld. 2023. Available online: https://repository.ukim.mk/handle/20.500.12188/26314 (accessed on 5 September 2024).
  2. World Health Organization Regional Office for Europe. Urban Green Spaces and Health; World Health Organization Regional Office for Europe: Copenhagen, Denmark, 2016. [Google Scholar]
  3. Dangl, G.S.; Woeste, K.; Aradhya, M.K.; Koehmstedt, A.; Simon, C.; Potter, D.; Leslie, C.A.; McGranahan, G. Characterization of 14 Microsatellite Markers for Genetic Analysis and Cultivar Identification of Walnut. J. Am. Soc. Hortic. Sci. 2005, 2005, 348–354. [Google Scholar] [CrossRef]
  4. Khan, H.; Ullah, I.; Woeste, K.; Fiaz, S.; Zeb, U.; Ghazy, A.I.; Azizullah, A.; Shad, S.; Malvolti, M.E.; Yue, M.; et al. Population genetics informs new insights into the phytogeographic history of Juglans regia L. Genet. Resour. Crop Evol. 2023, 70, 2263–2278. [Google Scholar] [CrossRef]
  5. FAO. Statistical Yearbook 2023-World Food and Agriculture-World|ReliefWeb. Available online: https://reliefweb.int/report/world/fao-statistical-yearbook-2023-world-food-and-agriculture (accessed on 6 September 2024).
  6. Italy, F.R. Crop and Livestock Products; Food and Agricultural Organisation of United Nations, Public FAO: Rome, Italy, 2023. [Google Scholar]
  7. Global Report on Food Crises (GRFC) 2024. Available online: https://www.fsinplatform.org/report/global-report-food-crises-2024/ (accessed on 10 August 2024).
  8. Homepage|Food Security Information Network (FSIN). Available online: https://www.fsinplatform.org/ (accessed on 18 September 2024).
  9. Employment Indicators (2000–2021). 2023. Statistics. Available online: https://www.fao.org/statistics/highlights-archive/highlights-detail/employment-indicators-(2000-2021).-july-2023-update/en (accessed on 10 August 2024).
  10. Ye, L.; Shavvon, R.S.; Qi, H.; Wu, H.; Fan, P.; Shalizi, M.N.; Khurram, S.; Davletbek, M.; Turuspekov, Y.; Liu, J. Population genetic insights into the conservation of common walnut (Juglans regia) in Central Asia. Plant Divers. 2024, 46, 600–610. [Google Scholar] [CrossRef]
  11. Shavvon, R.S.; Qi, H.-L.; Mafakheri, M.; Fan, P.-Z.; Wu, H.-Y.; Vahdati, F.B.; Al-Shmgani, H.S.; Wang, Y.-H.; Liu, J. Unravelling the genetic diversity and population structure of common walnut in the Iranian Plateau. BMC Plant Biol. 2023, 23, 201. [Google Scholar] [CrossRef]
  12. Iordănescu, O.A.; Radulov, I.; Buhan, I.P.; Cocan, I.; Berbecea, A.A.; Popescu, I.; Poșta, D.S.; Camen, D.; Lalescu, D. Physical, Nutritional and Functional Properties of Walnuts Genotypes (Juglans regia L.) from Romania. Agronomy 2021, 11, 1092. [Google Scholar] [CrossRef]
  13. Popa, R.-G.; Bălăcescu, A.; Popescu, L.G. Popescu, Organic Walnut Cultivation in Intensive and Super-Intensive System—Sustainable Investment. Case Study: Gorj County, Romania. Sustainability 2023, 15, 1244. [Google Scholar] [CrossRef]
  14. Pascota, C.; Tenche-Constantinescu, A.M.; Mircov, V.D.; Borlea, G.F. The walnut-a potential social broadleaved tree in western Romania. In Proceedings of the 3rd International Multidisciplinary Scientific Conference on Social Sciences and Arts SGEM 2016, Albena, Bulgaria, 24–30 August 2016; pp. 1155–1160. [Google Scholar]
  15. Pataki, D.E.; Alberti, M.; Cadenasso, M.L.; Felson, A.J.; McDonnell, M.J.; Pincetl, S.; Pouyat, R.V.; Setälä, H.; Whitlow, T.H. The Benefits and Limits of Urban Tree Planting for Environmental and Human Health. Front. Ecol. 2021, 9, 603757. [Google Scholar] [CrossRef]
  16. Jones, L.; Anderson, S.; Læssøe, J.; Banzhaf, E.; Jensen, A.; Bird, D.N.; Miller, J.; Hutchins, M.G.; Yang, J.; Garrett, J.; et al. A typology for urban Green Infrastructure to guide multifunctional planning of nature-based solutions. Nat. Based Solut. 2022, 2, 100041. [Google Scholar] [CrossRef]
  17. Hayes, D.; Angove, M.J.; Tucci, J.; Dennis, C. Walnuts (Juglans regia) Chemical Composition and Research in Human Health. Crit. Rev. Food Sci. Nutr. 2016, 56, 1231–1241. [Google Scholar] [CrossRef]
  18. Pereira, J.A.; Oliveira, I.; Sousa, A.; Ferreira, I.C.; Bento, A.; Estevinho, L. Bioactive properties and chemical composition of six walnut (Juglans regia L.). Cultivars. Food Chem. Toxicol. 2008, 46, 2103–2111. [Google Scholar] [CrossRef]
  19. Acquaviva, R.; D’Angeli, F.; Malfa, G.A.; Ronsisvalle, S.; Garozzo, A.; Stivala, A.; Ragusa, S.; Nicolosi, D.; Salmeri, M.; Genovese, C. Antibacterial and anti-biofilm activities of walnut pellicle extract (Juglans regia L.) against coagulase-negative staphylococci. Nat. Prod. Res. 2021, 35, 2076–2081. [Google Scholar] [CrossRef] [PubMed]
  20. Cui, M.; Li, Q.; Ni, Z.; Han, Y.; Zheng, Y.; Mo, R.; Shen, D.; Liu, Y. The Nutritional Qualities of Walnuts and Their Planted Soils from China—Level and Relationship. Forests 2023, 14, 1369. [Google Scholar] [CrossRef]
  21. Cosmulescu, S.N.; Baciu, A.; Achim, G.; Mihai, B.O.T.U.; Trandafir, I. Mineral composition of fruits in different walnut (Juglans regia L.) cultivars. Not. Bot. Horti Agrobot. Cluj-Napoca 2009, 37, 156–160. [Google Scholar]
  22. Ioan, S.; Irina, P.; Emilian, O.; Sorina, P.; Cerasela, P.; Adriana, C.; Dorin, C.; Alina-Maria, T.-C.; Dacian, L.; Ciprian, S.; et al. Application of the Drosophila melanogaster Research Model to Evaluate the Toxicity Levels between Lead and Copper. Appl. Sci. 2024, 14, 4190. [Google Scholar] [CrossRef]
  23. Alejandro, S.; Höller, S.; Meier, B.; Peiter, E. Manganese in plants: From acquisition to subcellular allocation. Front. Plant Sci. 2020, 11, 300. [Google Scholar] [CrossRef]
  24. EFSA Panel on Nutrition; Novel Foods and Food Allergens (NDA); Turck, D.; Bohn, T.; Castenmiller, J.; de Henauw, S.; Hirsch-Ernst, K.I.; Knutsen, H.K.; Maciuk, A.; Mangelsdorf, I.; et al. Scientific opinion on the tolerable upper intake level for manganese. EFSA J. 2023, 21, e8413. [Google Scholar]
  25. Ioan, S.; Irina, P.; Dumitru, C.D.; Emilian, O.; Ramona, M.A.; Mariana, G. Analyzes Regarding the Cytotoxicity of ZnSO4 Excess on Cell Division. Pharmacophore 2023, 14, 7–14. [Google Scholar] [CrossRef]
  26. Balafrej, H.; Bogusz, D.; Triqui, Z.-E.A.; Guedira, A.; Bendaou, N.; Smouni, A.; Fahr, M. Zinc hyperaccumulation in plants: A review. Plants 2020, 9, 562. [Google Scholar] [CrossRef]
  27. Shakeel, M.; Hafeez, F.; Malik, I.; Farid, A.; Ullah, H.; Ahmed, I.; Gul, H.; Mohibullah, M.; Yasin, M. Serratia marcescens strain FA-4 enhances zinc content in rice grains by activating the zinc translocating enzymes. J. Breed. Genet. 2023, 52, 495–507. [Google Scholar] [CrossRef]
  28. Kumar, D.; Dhankher, O.P.; Tripathi, R.D.; Seth, C.S. Titanium dioxide nanoparticles potentially regulate the mechanism(s) for photosynthetic attributes, genotoxicity, antioxidants defense machinery, and phytochelatins synthesis in relation to hexavalent chromium toxicity in Helianthus annuus L. J. Hazard. Mater. 2023, 454, 131418. [Google Scholar] [CrossRef]
  29. Zerizghi, T.; Guo, Q.; Tian, L.; Wei, R.; Zhao, C. An integrated approach to quantify ecological and human health risks of soil heavy metal contamination around coal mining area. Sci. Total Environ. 2021, 814, 152653. [Google Scholar] [CrossRef] [PubMed]
  30. GTóth, G.; Hermann, T.; Da Silva, M.R.; Montanarella, L.J.E.I. Heavy metals in agricultural soils of the European Union with implications for food safety. Environ. Int. 2016, 88, 299–309. [Google Scholar]
  31. Yang, Q.; Zhang, L.; Wang, H.; Martín, J.D. Bioavailability and health risk of toxic heavy metals (As, Hg, Pb and Cd) in urban soils: A Monte Carlo simulation approach. Environ. Res. 2022, 214, 113772. [Google Scholar] [CrossRef] [PubMed]
  32. Cheng, B.; Wang, Z.; Yan, X.; Yu, Y.; Liu, L.; Gao, Y.; Zhang, H.; Yang, X. Characteristics and pollution risks of Cu, Ni, Cd, Pb, Hg and As in farmland soil near coal mines. Soil Environ. Health 2023, 1, 100035. [Google Scholar] [CrossRef]
  33. Zhang, J.; Liu, Z.; Tian, B.; Li, J.; Luo, J.; Wang, X.; Ai, S.; Wang, X. Assessment of soil heavy metal pollution in provinces of China based on different soil types: From normalization to soil quality criteria and ecological risk assessment. J. Hazard. Mater. 2023, 441, 129891. [Google Scholar] [CrossRef]
  34. Commission Regulation (EC) No 1881/2006 of 19 December 2006 Setting Maximum Levels for Certain Contaminants in Foodstuffs (Text with EEA Relevance). 2006, Volume 364. Available online: http://data.europa.eu/eli/reg/2006/1881/oj/eng (accessed on 10 August 2024).
  35. Ikhsan, A.S.; Topçu, H.; Sütyemez, M.; Kafkas, S. Novel 307 Polymorphic SSR Markers from BAC-End Sequences in Walnut (Juglans regia L.): Effects of Motif Types and Repeat Lengths on Polymorphism and Genetic Diversity. Sci. Hortic. 2016, 213, 1–4. Available online: https://www.academia.edu/117172679/Novel_307_polymorphic_SSR_markers_from_BAC_end_sequences_in_walnut_Juglans_regia_L_Effects_of_motif_types_and_repeat_lengths_on_polymorphism_and_genetic_diversity (accessed on 6 September 2024). [CrossRef]
  36. Yildiz, E.; Pinar, H.; Uzun, A.; Yaman, M.; Sumbul, A.; Ercisli, S. Identification of genetic diversity among Juglans regia L. genotypes using molecular, morphological, and fatty acid data. Genet. Resour. Crop Evol. 2021, 68, 1425–1437. [Google Scholar] [CrossRef]
  37. EOrhan, E.; Eyduran, S.P.; Poljuha, D.; Akin, M.; Weber, T.; Ercisli, S. Genetic diversity detection of seed-propagated walnut (Juglans regia L.) germplasm from Eastern Anatolia using SSR markers. Folia Hortic. 2020, 32, 37–46. [Google Scholar] [CrossRef]
  38. Houmanat, K.; Abdellah, K.; Hssaini, L.; Razouk, R.; Hanine, H.; Jaafary, S.; Charafi, J. Molecular Diversity of Walnut (Juglans regia L.) among Two Major Areas in Morocco in Contrast with Foreign Varieties. Int. J. Fruit Sci. 2021, 21, 180–192. [Google Scholar] [CrossRef]
  39. Ghanbari, A.; Faraji, M.; Behnamian, M.; Estaji, A.; Pyrayesh, A.; Fahim, S. Genetic Diversity Evaluation of Some Walnut (Juglans regia L.) Genotypes in Meshkin-Shahr by ISSR Marker. J. Nuts 2019, 2, 1. [Google Scholar] [CrossRef]
  40. Tenche-Constantinescu, A.-M.; Lalescu, D.V.; Popescu, S.; Sarac, I.; Petrescu, I.; Petolescu, C.; Camen, D.; Horablaga, A.; Popescu, C.A.; Berar, C.; et al. Exploring the Genetic Landscape of Tilia Spp. with Molecular and Statistical Tools. Horticulturae 2024, 10, 596. [Google Scholar] [CrossRef]
  41. Zare-Rashnodi, N.; Erfani Moghadam, J.; Fazeli, A. The screening of Persian walnut genotypes based on the quantitative and qualitative characters and the investigation of genetic diversity among promising samples using ISSR marker. J. Plant Prod. (Agron. Breed. Hortic.) 2019, 42, 279–294. [Google Scholar]
  42. Tabasi, M.; Sheidai, M.; Hassani, D.; Koohdar, F. DNA fingerprinting and genetic diversity analysis with SCoT markers of Persian walnut populations (Juglans regia L.) in Iran. Genet. Resour. Crop Evol. 2020, 67, 1437–1447. [Google Scholar] [CrossRef]
  43. Rai, M.K. Start codon targeted (SCoT) polymorphism marker in plant genome analysis: Current status and prospects. Planta 2023, 257, 34. [Google Scholar] [CrossRef] [PubMed]
  44. Bidyananda, N.; Jamir, I.; Nowakowska, K.; Varte, V.; Vendrame, W.A.; Devi, R.S.; Nongdam, P. Plant Genetic Diversity Studies: Insights from DNA Marker Analyses. Int. J. Plant Biol. 2024, 15, 607–640. [Google Scholar] [CrossRef]
  45. Heath, D.D.; Lwama, G.K.; Devlin, R.H. PCR primed with VNTR core sequences yields species specific patterns and hypervariable probes. Nucleic Acids Res. 1993, 21, 5782–5785. [Google Scholar] [CrossRef]
  46. Ibrahimi, M.; Brhadda, N.; Ziri, R.; Fokar, M.; Amghar, I.; Gaboun, F.; Habach, A.; Meziani, R.; Elfadile, J.; Abdelwahd, R.; et al. Molecular Identification of Genetic Diversity and Population Structure in Moroccan Male Date Palm (Phoenix dactylifera L.) Using Inter-Simple Sequence Repeat, Direct Amplification of Minisatellite DNA, and Simple Sequence Repeat Markers. Horticulturae 2024, 10, 508. [Google Scholar] [CrossRef]
  47. Pinar, H.; Uzun, A.; Unlu, M.; Yaman, M. Genetic diversity in turkish banana (Musa cavendishii) genotypes with DAMD markers. Fresenius Environ. Bull. 2019, 28, 459–463. [Google Scholar]
  48. Zeb, U.; Dong, W.; Zhang, T.; Wang, R.; Shahzad, K.; Ma, X.; Li, Z. Comparative plastid genomics of Pinus species: Insights into sequence variations and phylogenetic relationships. J. Syst. Evol. 2020, 58, 118–132. [Google Scholar] [CrossRef]
  49. Law No. 24 of 15 January 2007 on the Regulation and Administration of Green Spaces in Urban Areas. FAOLEX. Available online: https://www.fao.org/faolex/results/details/en/c/LEX-FAOC197145/ (accessed on 10 August 2024).
  50. Bihuneti, C. and Iordănescu, O.A. Evolution of walnut production worldwide. Res. J. Agric. Sci. 2023, 55. [Google Scholar]
  51. Li, X.; Yue, J.; Wang, S.; Luo, Y.; Su, C.; Zhou, J.; Xu, D.; Lu, H. Development of Geographic Information System Architecture Feature Analysis and Evolution Trend Research. Sustainability 2024, 16, 137. [Google Scholar] [CrossRef]
  52. Badaluta-Minda, C.; Herbei, M.V. Assesment of water resources using landsat satellite imagery. Environ. Eng. Manag. J. 2021, 20, 301–308. [Google Scholar]
  53. Repetskaya, A.I.; Petlukova, K.A.; Tabunshchik, V.A.; Vishnevski, S.O.; Savushkina, I.G. October. Application of the Field-Map software and hardware complex for creating GIS of urban green spaces and Botanical gardens collections. In IOP Conference Series: Earth and Environmental Science; IOP Publishing: Bristol, UK, 2020; Volume 574, p. 012069. [Google Scholar]
  54. Jucu, I.S. Particularities of the functional profile and urban relations in post-socialist Lugoj Municipality. Rom. J. Geogr. 2010, 54, 39–49. [Google Scholar]
  55. Onea, D. Planificare urbană și organizarea spațiului geografic în Municipiul Caransebeș. Edit. Eurobit. Timișoara 2018, 322. ISBN 978-973-132-461-6. Available online: https://edituraeurobit.ro/2018-2/ (accessed on 25 September 2024).
  56. Ţenche-Constantinescu, A.M. Caransebeșul verde Concepție peisagistică și strategie de dezvoltare a sistemului de spații verzi. Edit. Eurobit. Timișoara 2017, 380. ISBN 978-973-132-408-1. Available online: https://edituraeurobit.ro/2017-2/ (accessed on 26 September 2024).
  57. Local Register of Green Spaces, Caransebeș Municipality. 2023. Available online: https://www.primaria-caransebes.ro/portal/CarasSeverin/Caransebes/portal.nsf/Index/100 (accessed on 25 September 2024).
  58. Census Results 2021: National Institute of Statistics, România, June 2023. Available online: https://ugeo.urbistat.com/AdminStat/en/ro/demografia/popolazione/municipiul-caransebes/20658433/4. (accessed on 25 September 2024).
  59. Rusu, R. Organizarea spaţiului geografic în Banat. Edit. Mirton Timişoara 2007, 607. ISBN 978-973-52-0201-9913(498.5). Available online: https://books.google.it/books/about/Organizarea_spa%C5%A3iului_geografic_%C3%AEn_Ban.html?id=yUbT_4Dn46QC&redir_esc=y (accessed on 26 September 2024).
  60. Tenche-Constantinescu, A.M.; Herbei, M.; Borlea, G.F. Restoration of Jupa Park-Landscape and Wood Species Analysis Using Gis Technology. Ann. Univ. Craiova-Agric. Mont. Cadastre Ser. 2018, 47, 428–437. [Google Scholar]
  61. Meteo Romania|Site-ul Administratiei Nationale de Meteorologie. Available online: https://www.meteoromania.ro/ (accessed on 10 August 2024).
  62. Şmuleac, L.; Rujescu, C.; Șmuleac, A.; Imbrea, F.; Radulov, I.; Manea, D.; Ienciu, A.; Adamov, T.; Pașcalău, R. Impact of Climate Change in the Banat Plain, Western Romania, on the Accessibility of Water for Crop Production in Agriculture. Agriculture 2020, 10, 437. [Google Scholar] [CrossRef]
  63. Suveti, P.F.; Batrîna, S.L.; Imbrea, F. Research regarding the influence of Banat climate conditions on rapeseed production. Res. J. Agric. Sci. 2020, 52. [Google Scholar]
  64. Vahdati, K. Walnut tolerance to abiotic stresses: Approaches and prospects. In Proceedings of the VII International Walnut Symposium, Shanxi, China, 20 July 2013; Volume 1050, pp. 399–406. [Google Scholar]
  65. Weising, K.; Nybom, H.; Pfenninger, M.; Wolff, K.; Kahl, G. DNA Fingerprinting in Plants: Principles, Methods, and Applications; CRC Press: Boca Raton, FL, USA, 2005. [Google Scholar]
  66. Poșta, D.S.; Radulov, I.; Cocan, I.; Berbecea, A.A.; Alexa, E.; Hotea, I.; Iordănescu, O.A.; Băla, M.; Cântar, I.C.; Rózsa, S.; et al. Hazelnuts (Corylus avellana L.) from Spontaneous Flora of the West Part of Romania: A Source of Nutrients for Locals. Agronomy 2022, 12, 214. [Google Scholar] [CrossRef]
  67. Sze-Tao, K.W.C.; Sathe, S.K. Walnuts (Juglans regia L): Proximate composition, protein solubility, protein amino acid composition and protein in vitro digestibility. J. Sci. Food Agric. 2000, 80, 1393–1401. [Google Scholar] [CrossRef]
  68. Gharby, S.; Harhar, H.; Bouzoubaa, Z.; Asdadi, A.; El Yadini, A.; Charrouf, Z. Chemical characterization and oxidative stability of seeds and oil of sesame grown in Morocco. J. Saudi Soc. Agric. Sci. 2017, 16, 105–111, ISSN 1658-077X. [Google Scholar] [CrossRef]
  69. Ainsworth, E.A.; Gillespie, K.M. Estimation of total phenolic content and other oxidation substrates in plant tissues using Folin–Ciocalteu reagent. Nat. Protoc. 2007, 2, 875–877. [Google Scholar] [CrossRef]
  70. Jorhem, L.; Engman, J. Determination of Lead, Cadmium, Zinc, Copper, and Iron in Foods by Atomic Absorption Spectrometry after Microwave Digestion: NMKL Collaborative Study. J. AOAC Int. 2000, 83, 1189–1203. [Google Scholar] [CrossRef]
  71. Duca, A.; Alexa, E.; Dehelean, C.A.; Soica, C.; Danciu, C.; Popescu, I.; Cocan, I.; Lalescu, D.; Muntean, D.M. Assessment of lipid profile of eight propolis samples from western Romania. Farmacia 2019, 67, 126–132. [Google Scholar] [CrossRef]
  72. Rinovetz, A.; Alexa, E.; Cocan, I.; Popescu, I.; Rădoi, B. Considerations On Physical Separation Of A Natural Lipid Mixture By Production Of Lipid Fractions Carpathian. J. Food Sci. Technol. 2018, 10. [Google Scholar]
  73. Memete, A.R.; Sărac, I.; Teusdea, A.C.; Budău, R.; Bei, M.; Vicas, S.I. Bioactive Compounds and Antioxidant Capacity of Several Blackberry (Rubus spp.) Fruits Cultivars Grown in Romania. Horticulturae 2023, 9, 556. [Google Scholar] [CrossRef]
  74. Lamuela-Raventós, R.M. Folin–Ciocalteu Method for the Measurement of Total Phenolic Content and Antioxidant Capacity. In Measurement of Antioxidant Activity & Capacity; John Wiley & Sons, Ltd.: Hoboken, NJ, USA, 2018; pp. 107–115. [Google Scholar] [CrossRef]
  75. Team, R.C. RA language and environment for statistical computing, R Foundation for Statistical. Computing 2020. [Google Scholar]
  76. Jardim, T.; Domingues, M.R.M.; Alves, E. An overview on lipids in nuts and oily fruits: Oil content, lipid composition, health effects, lipidomic fingerprinting and new biotechnological applications of their by-products. Crit. Rev. Food Sci. Nutr. 2023, 1–29. [Google Scholar] [CrossRef]
  77. Abbattista, R.; Feinberg, N.G.; Snodgrass, I.F.; Newman, J.W.; Dandekar, A.M. Unveiling the hidden quality” of the walnut pellicle: A precious source of bioactive lipids. Front. Plant Sci. 2024, 15, 1395543. [Google Scholar] [CrossRef]
  78. Fuentes-Soriano, P.; Bellido-Milla, D.; García-Guzmán, J.J.; Hernández-Artiga, M.P.; Gallardo-Bernal, J.J.; Palacios-Santander, J.M.; Espada-Bellido, E. A simple phosphorus determination in walnuts and assessment of the assimilable fraction. Talanta 2019, 204, 57–62. [Google Scholar] [CrossRef] [PubMed]
  79. Ni, Z.J.; Zhang, Y.G.; Chen, S.X.; Thakur, K.; Wang, S.; Zhang, J.G.; Shang, Y.F.; Wei, Z.J. Exploration of walnut components and their association with health effects. Crit. Rev. Food Sci. Nutr. 2022, 62, 5113–5129. [Google Scholar] [CrossRef] [PubMed]
  80. Okatan, V.; Gündeşli, M.A.; Kafkas, N.E.; Attar, Ş.H.; Kahramanoğlu, İ.; Usanmaz, S.; Aşkın, M.A. Phenolic compounds, antioxidant activity, fatty acids and volatile profiles of 18 different walnut (Juglans regia L.) cultivars and genotypes. Erwerbs-Obstbau 2022, 64, 247–260. [Google Scholar] [CrossRef]
  81. Yin, L.L.; Qing, T.; Zhang, S.X.; Yin, K.X.; Qin, J.I.Q. Determination of Trace Elements in Edible Nuts in the Beijing Market by ICP-MS. Biomed. Environ. Sci. 2015, 28, 449–454. [Google Scholar]
  82. Moreda–Piñeiro, J.; Herbello–Hermelo, P.; Domínguez-González, R.; Bermejo-Barrera, P.; Moreda-Piñeiro, A. Bioavailability Assessment of Essential and Toxic Metals in Edible Nuts and Seeds. Food Chem. 2016, 205, 146–154. [Google Scholar] [CrossRef]
  83. Institute of Medicine. Dietary Reference Intakes for Vitamin A, Vitamin K, Arsenic, Boron, Chromium, Copper, Iodine, Iron, Manganese, Molyb-Denum, Nickel, Silicon, Vanadium, and Zinc, Panel on Micronutrients; National Academies Press: Washington, DC, USA, 2001; ISBN 10:0-309-07279-4. [Google Scholar]
  84. EFSA|Science, Safe Food, Sustainability. Available online: https://www.efsa.europa.eu/en (accessed on 10 August 2024).
  85. Measurlabs, N.M. Food Contaminant Analysis by EU Regulations|Measurlabs. Available online: https://measurlabs.com/blog/eu-regulations-on-food-contaminants/#heavy-metals (accessed on 6 September 2024).
  86. Wani, A.L.; Ara, A.; Usmani, J.A. Lead toxicity: A review. Interdiscip. Toxicol. 2015, 8, 55–64. [Google Scholar] [CrossRef] [PubMed] [PubMed Central]
  87. Ross, C.W.; Hanan, N.P.; Prihodko, L.; Anchang, J.; Ji, W.; Yu, Q. Woody-biomass projections and drivers of change in sub-Saharan. Afr. Nat. Clim. Chang. 2021, 11, 449–455. [Google Scholar] [CrossRef]
  88. Skole, D.L.; Samek, J.H.; Dieng, M.; Mbow, C. The Contribution of Trees Outside of Forests to Landscape Carbon and Climate Change Mitigation in West Africa. Forests 2021, 12, 1652. [Google Scholar] [CrossRef]
  89. Janku, K.; Mana, M.; Arczyńska-Chudy, E. New locations of Persian walnut (Juglans regia L.). In Proceedings of the Urban Valleys of Watercourses in Poznań, Poznań, Poland, 13–19 May 2017. [Google Scholar]
  90. Paź-Dyderska, S.; Jagodziński, A.M.; Dyderski, M.K. Possible changes in spatial distribution of walnut (Juglans regia L.) in Europe under warming climate. Reg. Environ. Chang. 2021, 21, 18. [Google Scholar] [CrossRef]
  91. Çakir, E. Molecular Markers from Past to Present and Their Application Areas. Regen. Agric. 2023, 19. [Google Scholar]
  92. Hausdorf, B.; Hennig, C. Species Delimitation Using Dominant and Codominant Multilocus Markers. Syst. Biol. 2010, 59, 491–503. [Google Scholar] [CrossRef] [PubMed]
  93. Li, X.; Wang, X.; Cui, Z.; Shi, W.; Huang, J.; Wang, J. Development of Polymorphic Microsatellite Markers and Identification of Applications for Wild Walnut (Juglans regia L.) in Middle Asia. Diversity 2023, 15, 1073. [Google Scholar] [CrossRef]
Figure 1. Site description and the five J. regia populations: (A) Lugoj, Caransebeș and Jupa; (B) hilly regions nearby Lugoj and nearby Caransebeș; (C) J. regia in public green infrastructures of Lugoj, Caransebeș and Jupa; (D) Population J1L J. regia: 30 trees—Lugoj green infrastructures; (E) Population J2C J. regia: 30 trees—Caransebeș green infrastructures; (F) Population J3J J. regia: 30 trees—Jupa Main Street alignment; (G) Population J4LH J. regia: 30 trees—Lugoj Hills; (H) Population J5CH J. regia: 30 trees—Caransebeș Hills.
Horticulturae 10 01027 g001aHorticulturae 10 01027 g001bHorticulturae 10 01027 g001cHorticulturae 10 01027 g001d
Figure 2. Dendrometric measurements of the 150 J. regia tree individuals. (A) Medium trunk diameters at breast height (DBHm); (B) total tree heights (Ht).
Horticulturae 10 01027 g002
Figure 3. Analysis of polymorphic bands in J. regia using DAMD primers: (1)—J1L; (2)—J2C; (3)—J4LH; (4)—J5CH; (5)—J3J, MM—molecular primer; (A)—primer DAMD 3—URP6R; (B)—DAMD 4—URP9F; (C)—DAMD 5—33.
Horticulturae 10 01027 g003
Figure 4. Correlation between DAMD primers.
Horticulturae 10 01027 g004
Figure 5. Analysis of polymorphic bands in J. regia using SCoT primers: (1)—J1L; (2)—J2C; (3)—J4LH; (4)—J5CH; (5)—J3J; MM—molecular primer; (A)—SCoT 1, (B)—SCoT 3, (C)—SCoT 6.
Horticulturae 10 01027 g005
Figure 6. Correlation between SCoT primers.
Horticulturae 10 01027 g006
Figure 7. Cluster analysis of J. regia populations from Lugoj (J1L), Caransebes (J2C), Lugoj Hills (J4LH), Caransebeș Hills (J5CH) and Jupa (J3J) according to DAMD and SCoT primer results.
Horticulturae 10 01027 g007
Figure 8. Comparison between the averages of (A) mineral content; (B) protein content; (C) lipid content; (D) total polyphenols; (E) Cu content; (F) Mn content; (G) Zn content; (H) Pb content; (I) Cd content.
Horticulturae 10 01027 g008aHorticulturae 10 01027 g008b
Figure 9. Linear correlations between chemical parameters within J. regia populations.
Horticulturae 10 01027 g009
Figure 10. Linear regression equations of chemical parameters for J. regia populations: (A) Zn and lipids; (B) Cu and Mn; (C) Pb and Mn; (D) Pb and Cu.
Horticulturae 10 01027 g010
Figure 11. (A) Scree plot of P.C.A.; (B) biplot of P.C.A.; (C) contribution of variables to the first dimension of P.C.A.; (D) contribution of variables to the second dimension of P.C.A.
Horticulturae 10 01027 g011aHorticulturae 10 01027 g011b
Figure 12. Cluster dendrogram according to the analyzed chemical parameters.
Horticulturae 10 01027 g012
Table 1. Sequences of primers used for amplification.
MarkersPrimerPrimer Sequences 5′–3′
DAMDURP6RGGCAAGCTGGTGGGAGGTAC
URP 9FATGTGTGCGATCAGTTGCTG
33.6GGAGGTGGGCA
14 C2GGCAGGATTGAAGC
M 13GAGGGTGGCGGCTCT
HBV 3GGTGAAGCACAGGTG
SCoTSCoT 1CAACAATGGCTACCACCA
SCoT 3CAACAATGGCTACCACCG
SCoT 6CAACAATGGCTACCACGC
SCoT 11AAGCAATGGCTACCACCA
SCoT 24CACCATGGCTACCACCAT
SCoT 36GCAACAATGGCTACCACC
Table 2. Assessment of the efficiency of genetic diversity in the J. regia population using DAMD primers.
PrimerTotal Bands (n)Polymorphic Bands (np)Polymorphism (%)PICSD_PICMISD_MIRp
DAMD0311436.360.310.051.260.223.20
DAMD0410440.000.340.051.360.193.52
DAMD0511654.540.350.042.090.235.44
DAMD066466.660.310.051.270.223.20
DAMD0744100.000.310.051.270.223.20
DAMD085240.000.360.010.730.001.92
Average7.83456.260.330.041.330.183.41
Note: n: total number of bands; np: number of polymorphic bands; PIC: Polymorphic Information Content; MI: primer index (MI = EMR × PIC), EMR = np(np/n); Rp (resolving power) = i = 1 n p I b i, where np represents the number of polymorphic loci, Ibi is the band index for each band and SD is the standard deviation.
Table 3. Assessment of the efficiency of genetic diversity in the J. regia population using SCoT primers.
PrimerTotal Bands (n)Polymorphic Bands (np)Polymorphism (%)PICSD_PICMISD_MIRp
SCoT186750.310.051.900.314.80
SCoT384500.340.051.360.193.52
SCoT684500.340.051.360.193.52
SCoT1154800.310.061.260.223.20
SCoT242000.000.000.000.000.00
SCoT3641250.36NA0.36NA0.96
Average52.8349.440.340.041.120.182.40
Note: n: total number of bands; np: number of polymorphic bands; PIC: Polymorphic Information Content; MI: primer index (MI = EMR × PIC), EMR = np(np/n); Rp (resolving power) = i = 1 n p I b i, where np represents the number of polymorphic loci, Ibi is the band index for each band and SD is the standard deviation.
Table 4. The content of heavy metals in the walnut kernel as compared to the literature values (mg/kg).
ElementsOur Results: Mean Values of Heavy Metals in Walnut KernelsCosmulescu et al. [21]Yin et al. [81]Moreda–Piñeiro et al. [82]
Cu3.655–8.53214.1–32.28.8 ± 0.15109–3817
Mn14.408–28.61831.3–17610 ± 0.17.7–84
Zn19.813–46.58319.5–36.120 ± 1.112–63
Pb1.204–2.27---
Cd0.03451–0.08065-0.02-
Disclaimer/Publisher’s Note: The statements, opinions and data contained in all publications are solely those of the individual author(s) and contributor(s) and not of MDPI and/or the editor(s). MDPI and/or the editor(s) disclaim responsibility for any injury to people or property resulting from any ideas, methods, instructions or products referred to in the content.

