Article

Relative Salt Tolerance of Seven Strawberry Cultivars

1
Texas A&M AgriLife Research, El Paso Research and Extension Center, 1380 A&M Circle, El Paso, TX 79927, USA
2
Texas A&M AgriLife Extension, Lubbock Research and Extension Center, 1102 East FM 1294, Lubbock, TX 79403, USA
3
Texas A&M AgriLife Extension, Overton Research and Extension Center, 1710 FM 3053 N, Overton, TX 75684, USA
4
Department of Horticultural Sciences, Texas A&M AgriLife Extension, College Station, 2134 TAMU, TX 77843, USA
*
Author to whom correspondence should be addressed.
Horticulturae 2015, 1(1), 27-43; https://doi.org/10.3390/horticulturae1010027
Submission received: 26 August 2015 / Revised: 17 November 2015 / Accepted: 24 November 2015 / Published: 2 December 2015

Abstract

:
Strawberry (Fragaria × ananassa) cultivars (“Albion”, “Benicia”, “Camarosa”, “Camino Real”, “Chandler”, “Radiance”, and “San Andreas”) were evaluated for salt tolerance in a greenhouse environment. Plants were irrigated with a nutrient solution with an electrical conductivity (EC) of 1.1 dS·m−1 (control) or a nutrient solution with the addition of salts (salt solution) with ECs of 2.2, 3.3, or 4.4 dS·m−1 for four months. Salinity reduced plant growth and fruit yield of strawberry; however, the magnitude of reduction varied with cultivar. For example, at an EC of 4.4 dS·m−1, “Benicia” and “Chandler” had 39% and 44% less shoot dry weight (DW) respectively, compared with control plants. At ECs of 3.3 and 4.4 dS·m−1, “Camino Real” had equal shoot DW, which was about 50% lower than that of the control. The fruit yield of “Benicia” and “Camino Real” at 4.4 dS·m−1 was reduced by 56%, while the other salt treatments did not affect their shoot DW or fruit yield. To distinguish differences among the cultivars with respect to their tolerance to salinity, cluster analysis was performed based on growth parameters and visual quality. The results indicated that “Albion”, “Camarosa”, and “San Andreas” were more salt tolerant, while “Camino Real”, “Benicia”, “Chandler”, and “Radiance” were less salt tolerant.

1. Introduction

Strawberry (Fragaria × ananassa) is an economically important crop that covered an estimated 58,560 acres in the U.S. in 2013 [1]. The commercial production in California and Florida accounted for approximately 82% of total strawberry acreage [1]. Due to its economic importance and the demand for locally-grown berries, growers in other states are starting to produce more strawberries. In Texas, strawberry is still a minor crop with less than 150 acres representing 0.02 percent of national production [2,3]. With the large size of Texas, there is great potential for strawberry production to expand into traditionally non-producing regions. One of the key production constraints for strawberry is high salinity levels, which are often found in soils in arid and semi-arid regions and irrigation water. In recent years, strawberry growers in California have also faced decreased irrigation water quality and increased soil salinity, possibly due to the deterioration of coastal groundwater and low rainfall. Selecting salt-tolerant strawberry cultivars may be an effective approach for preventing yield and quality reductions.
Strawberry is categorized as one of the most salt-sensitive crops with varying degrees of tolerance among cultivars. Salinity causes leaf edge burn, necrosis, nutrient imbalance or specific ion toxicity, reduction in fruit quality and yield, and potential plant death if salinity stress persists or increases. In a two-year field study by Saied et al. [4], fruit yield was reduced up to 27% and 64% in the strawberry cultivars “Korona” and “Elsanta”, respectively, when the plants were exposed to NaCl salinity. Fruit quality, characterized as taste, aroma, and texture by a consumer-type panel, decreased by more than 24% in “Elsanta”, but differences in “Korona” were not significant. The reduction in shoot growth between these two strawberry cultivars was also different, up to 90% in “Elsanta” and 40% in “Korona”. Orsini et al. [5] compared the strawberry varieties “Elsanta” and “Elsinore” grown in the presence of 0, 10, 20, and 40 mM NaCl (electrical conductivities (ECs) of 0.45 to 3.9 dS·m−1). The shoot dry weight and leaf area of both cultivars decreased linearly as the EC of the irrigation solution increased. However, the reduction in growth was smaller in “Elsanta” (49%) than in “Elsinore” (90%). Many other studies have shown differences in salt tolerance among strawberry cultivars: “Korona” was more tolerant than “Elsanta” [6], “Toro” was more tolerant than “Douglas” [7], and “Yalova-104”, “Yalova-15”, “Yalova-416”, and “Arnavutkoy” were more tolerant than “Douglas”, “Dorit”, and “Aliso” [8]. Turhan and Eris [9] found that “Camarosa” was more tolerant than “Chandler” to NaCl at 8.5, 17.0, or 34.0 mM (equivalent to ECs of 0.8, 1.6, or 3.1 dS·m−1). In a field study, Ferreira et al. [10] reported that ‘Albion’ was relatively tolerant among five cultivars based on growth, yield, and the calculated salinity level (EC50) that would reduce fruit yield per hectare by 50%.
The above studies have indicated variation in salt tolerance among strawberry cultivars and the importance of cultivar selection when soil or water salinity is too high. The objective of this study was to determine the relative salt tolerance of seven commercial strawberry cultivars by irrigating plants with a nutrient solution or saline solution at selected levels of salinity. Gas exchange and leaf sodium (Na), potassium (K), calcium (Ca), and chloride (Cl) accumulation were also determined.

2. Experimental Section

2.1. Plant Materials

On 29 October 2013, plugs of seven strawberry cultivars (“Albion”, “Benicia”, “Camarosa”, “Camino Real”, “Chandler”, “Radiance”, and “San Andreas”) were obtained from the Goodson Farm and Nursery (Damascus, AR, USA). Plants (~5 leaves, ~15 cm wide) were transplanted into 3.8-L (15.8-cm diameter) black plastic containers filled with LM-40 high porosity growing mix (Canadian sphagnum peat moss 60%, horticultural perlite 40%, limestone, dolomite, wetting agent, micro & macronutrients; Lambert Peat Moss Inc., QC, Canada). All dead leaves, runners, flowers and/or fruits were trimmed off at transplanting. Plants were grown in a greenhouse with temperature maintained at 26.5 ± 6.1 °C (mean ± standard deviation) during the day and 19.5 ± 6.3 °C at night. The daily light integral (photosynthetically active radiation) was 1.1 ± 3.7 mol·m−2·d−1 and relative humidity was 30.3 ± 16.8%. Plants were watered with a nutrient solution until salt treatments were initiated. The nutrient solution with an EC of 1.1 ± 0.1 dS·m−1 was prepared by adding 1 g·L−1 of 15 N-2.2 P-12.5 K (Scotts Peters 15-5-15; Marysville, OH, USA) to reverse osmosis (RO) water.

2.2. Treatments

On 25 November 2013, treatments were initiated by irrigating plants with 1 L of nutrient solution (control) or salt solutions to maintain 10% to 20% leaching fraction. Plants were then irrigated once a week with the nutrient or salt solutions for a total of six times. On 10 January 2014, plants were flushed with 1 L RO water due to high salt accumulation in the root zone (Figure 1). From 17 January to 31 January, plants were watered with 1 L of nutrient solution. Plants were then irrigated once a week with the nutrient or salt solutions for another three times (nine times in total). Thereafter, the nutrient solution was applied until the end of the experiment on 11 March 2014. The nutrient solution at an EC of 1.1 ± 0.1 dS·m−1 (control, EC1.1) was prepared as described above. The salt solution was prepared by adding sodium chloride (NaCl) and calcium chloride (CaCl2) at a 2:1 ratio (molar ratio) to the nutrient solution. Although the composition of salts in salt-affected soil or poor irrigation water varies with location and source of water, NaCl is always dominant among other salts such as CaCl2. All solutions were prepared in 100-L tanks with confirmed ECs of 2.3 ± 0.3 dS·m−1 (EC2.2), 3.3 ± 0.5 dS·m−1 (EC3.3), and 4.5 ± 0.5 dS·m−1 (EC4.4). The leachate of the substrate EC was determined periodically using the pour-through method according to Wright [11].

2.3. Growth, Yield, and Visual Quality

Two perpendicular widths (cm), leaf count, and number of crowns of strawberry plants were recorded before initiating treatment (25 November 2013) and at the end of the experiment (11 March 2014). Mature berries were harvested starting on 7 January 2014, and their number and fresh weight (g) were recorded. The number of mature berries and fresh weight from each harvest were combined for total yield. To determine if salt treatments influenced the sugar content of strawberry fruit, Brix values of four berries were collected on 7 Mar. for plants in the control and EC4.4 treatments only, using a RF15 Brix refractometer (Extech Instruments Corporation, Nashua, NH, USA). Brix value is a measure of total soluble solids (TSS) in juice, including sugars such as sucrose, fructose, and glucose [12].
Figure 1. Leachate electrical conductivity (EC) from 13 Dec. 2013 to 7 Mar. 2014. EC1.1, EC2.2, EC3.3, and EC4.4 represent treatment solutions with ECs of 1.1 dS·m−1, 2.2 dS·m−1, 3.3 dS·m−1, and 4.4 dS·m−1, respectively. Error bars represent the standard error (SE) of five leachate samples. During the experimental period, treatment solutions were applied nine times. Treatments were initiated on 25 November 2013, and plants were then irrigated weekly with the nutrient or salt solutions for a total of six times. On 10 January, plants were flushed with reverse osmosis (RO) water due to high salt accumulation in the root zone. From 17 Jan. to 31 Jan., all plants were watered with the nutrient solution. From 7 February to 21 February, all plants were irrigated weekly with the nutrient or salt solutions for another three times. On 28 February and 7 March, plants were irrigated with the nutrient solution.
Horticulturae 01 00027 g001
At the end of the experiment, foliar salt damage (leaf edge burn, necrosis, and discoloration) was rated using a visual score of each plant from 0 to 5, where 0 = dead; 1 = over 90% foliar damage; 2 = moderate (50% to 90%) foliar damage; 3 = slight (less than 50%) foliar damage; 4 = good quality with minimal foliar damage; 5 = excellent without any foliar damage. All immature fruits were harvested, and their number and fresh weight (g) were recorded.
Upon termination, shoots were severed at the substrate surface. Leaf area (cm2) was determined using an LI-3100C area meter (LI-COR® Biosciences, Lincoln, NE, USA). Shoot dry weight (DW) was determined after shoots were oven-dried at 65 °C.

2.4. Gas Exchange and Leaf Greenness

Leaf transpiration rate (E), stomatal conductance (gs), and net photosynthesis (Pn) of four plants per treatment by cultivar were measured after the 6th salt treatment and one week before the harvest started (eight weeks after the 1st measurement) using a CIRAS-2 portable photosynthesis system (PP Systems, Amesbury, MA, USA) with an automatic universal PLC6 broad leaf cuvette. Fully expanded, healthy leaves were chosen for measurements. The environmental conditions in the cuvette were controlled at a leaf temperature = 25 °C, photosynthetic photon flux (PPF) = 1000 μmol·m−2·s−1, and CO2 concentration = 375 μmol·mol−1. Data were recorded when the environmental conditions and gas exchange parameters in the cuvette became stable. These measurements were taken on sunny days between 1000 HR and 1400 HR, and the plants were well-watered to avoid water stress.
Leaf greenness (or relative chlorophyll content) of all plants was measured using a hand-held SPAD chlorophyll meter (Minolta Camera Co., Osaka, Japan) one week before the harvest started. Three healthy, fully-expanded leaves were chosen from each plant.

2.5. Mineral Analysis

Four plants per treatment by cultivar were selected for mineral analyses. All dried leaves were ground to pass a 40-mesh screen with a stainless Wiley mill (Thomas Scientific, Swedesboro, NJ, USA). About 300 mg of plant leaf tissues were digested using the Environmental Protection Agency method 3051 with 1 mL nitric acid and 4 mL H2O2 using a microwave acceleration reaction system (CEM Corporation; Matthews, NC, USA) for determining alkaline earth metals (Na, K, Ca). The plant tissues were extracted with 2% acetic acid (EM Science, Gibbstown, HJ) for determining anions (Cl) using methods described in Gavlak et al. [13]. Na, K, and Ca in the digested samples were analyzed by inductively coupled plasma-optical emission spectrometry (Perkin-Elmer Optima 4300 DV, Shelton, CT, USA). Chloride was determined using a M926 chloride analyzer (Cole Parmer Instrument Company, Vernon Hills, IL, USA).

2.6. Experimental Design and Statistical Analysis

The experiment followed a split-plot design with salinity as the main plot and cultivar as subplot. Four or five plants were used as replications per salinity level by cultivar. All data were analyzed by two-way ANOVA using PROC GLM. Means separation among cultivars and treatments was conducted using Tukey’s honest significant difference (HSD) test. Relative shoot dry weight for each plant in the salt treatments was calculated as:
  Relative shoot dry weight  ( % ) =   Shoot dry weight in salt treatment  Averaged shoot dry weight in control   × 100 %
Similarly, relative percent of perpendicular width, leaf count, leaf area, number of crowns, and cumulative number and fresh weight of mature and immature fruits was calculated. These relative values were used as salt tolerance indexes for hierarchical cluster analysis [14]. A dendrogram of the seven strawberry cultivars was obtained based on the Ward linkage method and squared Euclidian distance of the means of the salt tolerance indexes for nine multivariate parameters including all relative growth data. All statistical analyses were performed using JMP (Version 12, SAS Institute Inc., Cary, NC, USA).

3. Results and Discussion
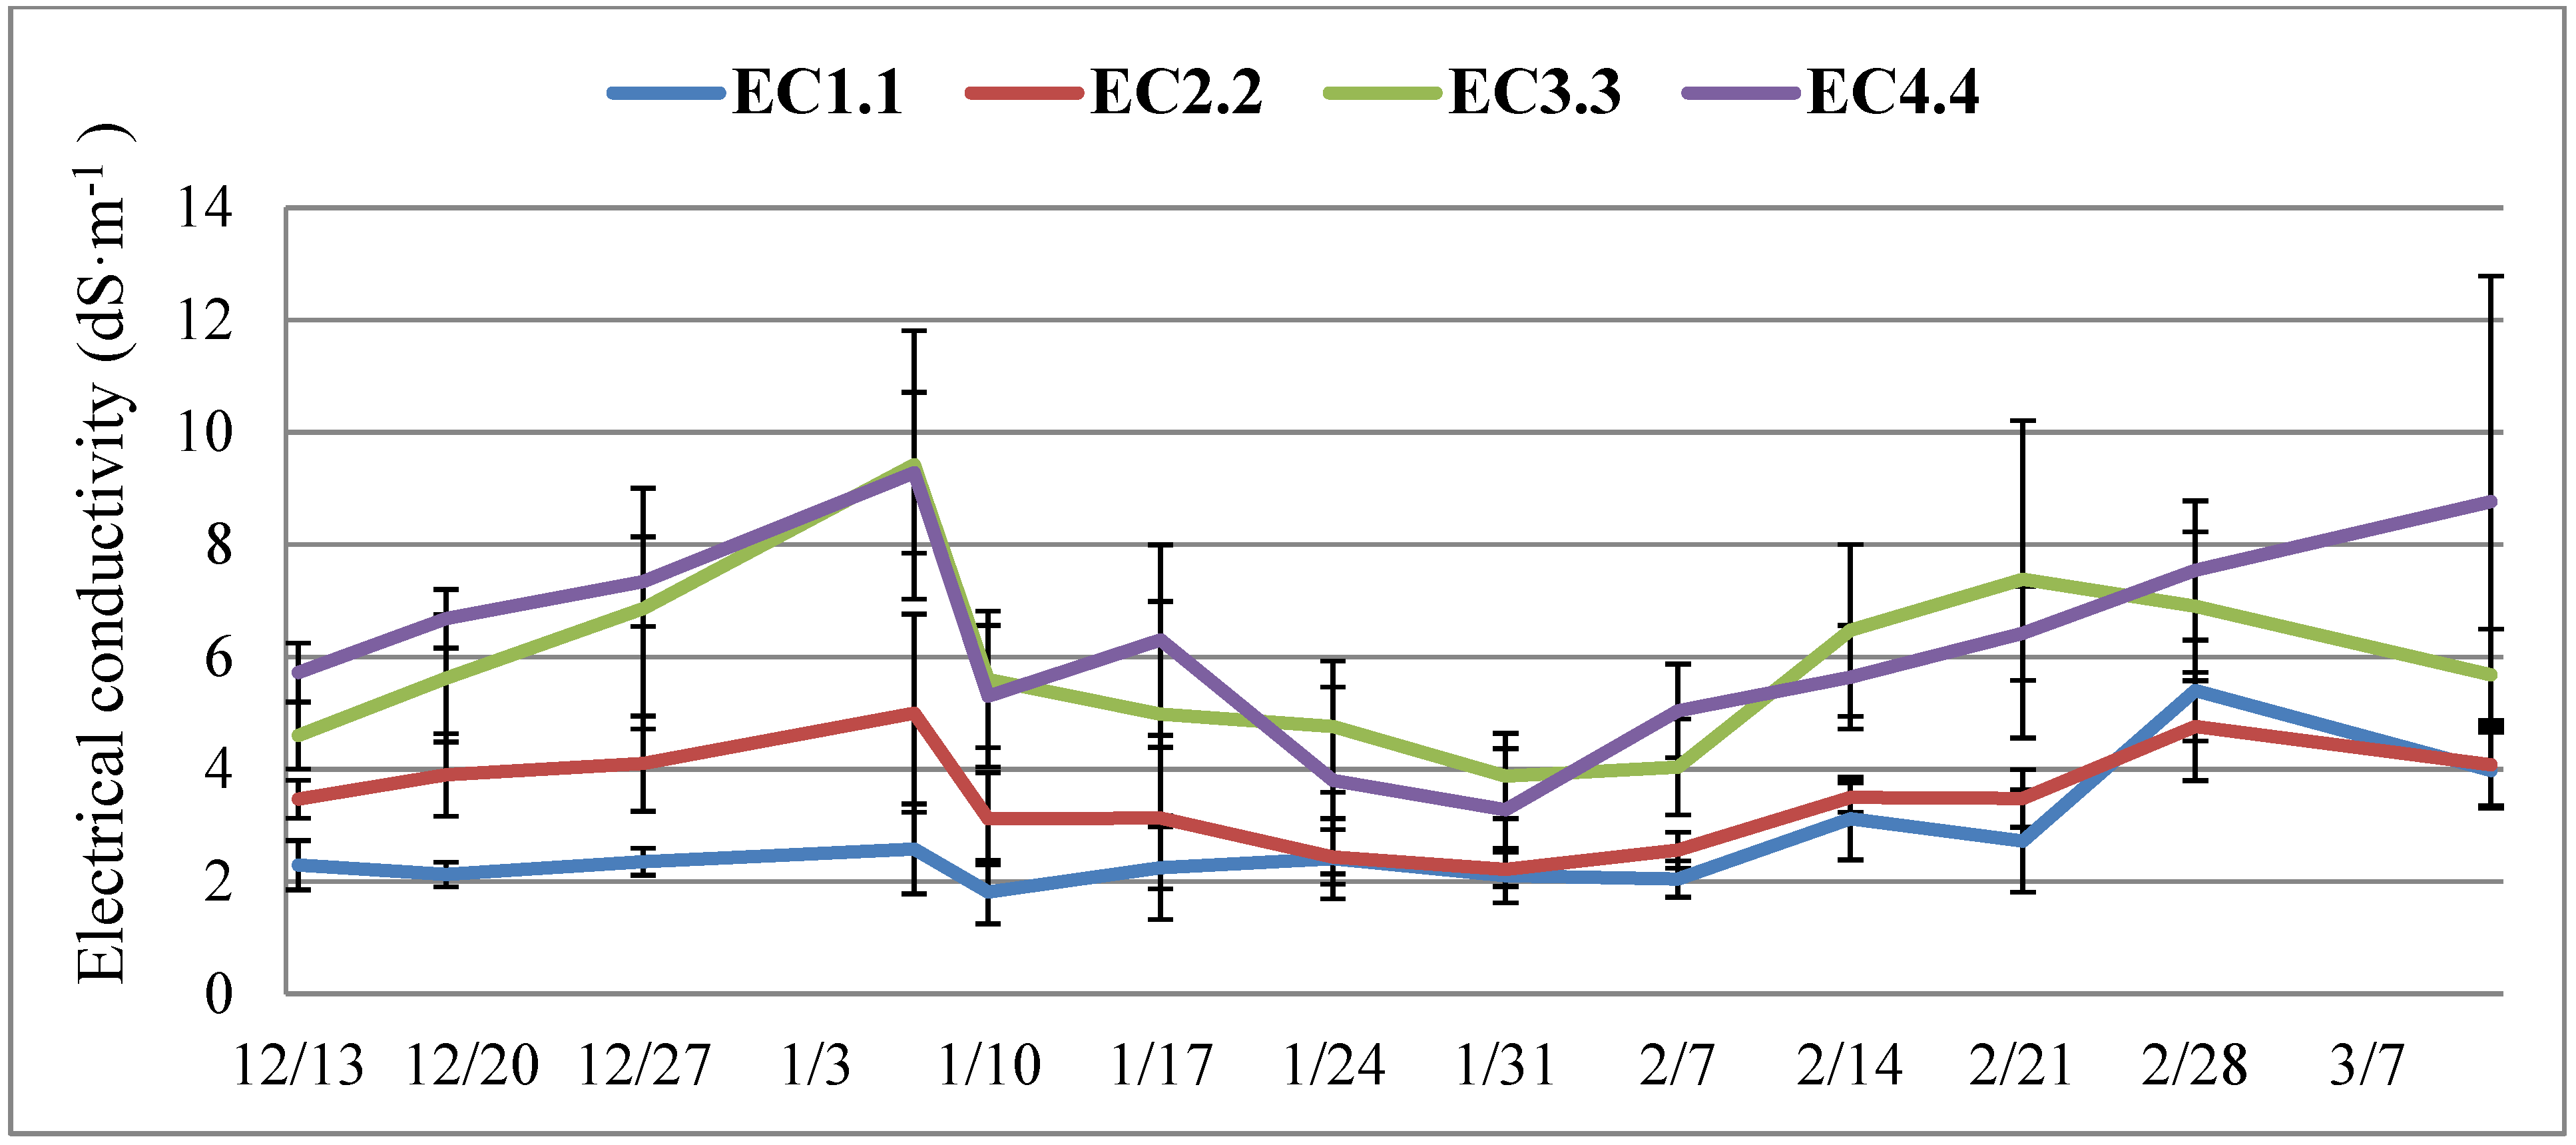
3.1. Leachate EC

The leachate EC data are shown in Figure 1. From 13 December 2013 to 7 January 2014, leachate EC increased from 2.3 to 2.6 dS·m−1 for plants irrigated with the nutrient solution (control, EC1.1) (Figure 1). When plants were watered with the saline solution at 2.2, 3.3, or 4.4 dS·m−1, the leachate EC increased from 3.8 to 5.0 dS·m−1, 4.6 to 9.4 dS·m−1, or 5.7 to 9.3 dS·m−1, respectively. From 7 February to 28 February, the leachate EC increased from 2.0 to 5.4 dS·m−1 for EC1.1, 2.6 to 4.8 dS·m−1 for EC2.2, 4.0 to 6.9 dS·m−1 for EC3.3, and 5.0 to 7.5 dS·m−1 for EC4.4, respectively. The final leachate ECs recorded on 12 March were 4.0, 4.1, 5.7, and 8.8 dS·m−1 for EC1.1, EC2.2, EC3.3, and EC4.4, respectively. Salinity in the root zone of a container varies with type of substrate, irrigation frequency (water use of the plants and evaporation), leaching fraction, and salinity of the irrigation water [15]. For most substrates containing materials such as peat, salt accumulation is inevitable. To prevent excessive salt accumulation, the salinity of leachate should be monitored periodically and leaching should be performed as needed.

3.2. Plant Growth and Visual Quality

Salt treatment reduced visual quality with variations among cultivars (Table 1). The cultivars “Albion” and “San Andreas” had similar visual quality scores (0 = dead; 5 = excellent) across treatments, and their visual scores were higher than “Camino Real” and “Radiance”. For “Benicia”, no differences in visual score were found among treatments, although all scores were below 4.0 even in the control. The lowest visual score (1.8) was observed for “Radiance” at EC4.4. “Benicia” at EC4.4, “Camino Real” at EC3.3 and EC4.4, and “Chandler” at EC4.4 also had visual quality scores lower than 3.0. Foliar salt damages including leaf edge burn, necrosis, and/or discoloration have been observed in other strawberry cultivars [7,8].
Elevated salinity reduces the growth of strawberry plants [4,6,8,9,16]. In our experiment, plant width, leaf count, leaf area, and shoot dry weight were significantly different between the salt treatments and among cultivars, but no interactions occurred (Table 1). Salt treatment did not affect the perpendicular width in most cultivars with the exception of “Camino Real” and “Chandler”. Compared with the control plants, EC4.4 reduced the perpendicular width of “Camino Real” and “Chandler” by 52% and 67%, respectively. All strawberry cultivars except “Camarosa” and “Camino Real” had similar numbers of leaves across treatments. “Camarosa” plants at EC3.3 and EC4.4 had 52% and 42% fewer leaves, respectively, than the control, while “Camino Real” plants had 65% and 64% fewer leaves, respectively. Salt treatment did not significantly reduce leaf area in individual cultivars except “Camino Real”, although leaf area was reduced at higher salinity levels. “Albion”, “Camarosa”, “Radiance”, and “San Andreas” produced similar shoot biomass in all treatments, but salt treatment at EC4.4 reduced shoot biomass of “Camino Real” and “Chandler” by 49% and 44%, respectively. In addition, when averaged across all cultivars, EC3.3 and EC4.4 decreased shoot biomass by 25% and 38%, respectively. Overall, salt treatment had no effect on the number of crowns (p = 0.27); however, “Chandler” and “San Andreas” developed more crowns than other cultivars (p < 0.0001) (data not shown).
Table 1. Visual score, plant perpendicular width, number (No.) of leaves, leaf area, and shoot dry weight (DW) of strawberry cultivars irrigated with the nutrient solution (electrical conductivity (EC) =1.1 dS·m−1) or salt solutions (EC = 2.2, 3.3, or 4.4 dS·m−1) in the greenhouse.
VarietyTreatment (dS·m−1)Visual ScoreWidth (cm)No. of LeavesLeaf Area (cm2)Shoot DW (g)
Albion1.14.1 a z10.8 a9 a663 a11.9 a
2.23.9 a11.2 a6 a565 a9.7 a
3.34.0 a11.5 a5 a526 a8.6 a
4.43.5 a8.3 a6 a444 a6.9 a
Mean3.9 A y10.5 AB7 C555 BC9.4 BC
Benicia1.13.6 a8.6 a8 a420 a6.8 ab
2.23.3 a8.2 a9 a404 a7.5 a
3.33.5 a9.0 a11 a357 a7.6 a
4.42.9 a3.0 a4 a230 a4.1 b
Mean3.3 ABC7.0 B8 BC349 D6.4 CD
Camarosa1.14.2 a12.4 a17 a756 a11.9 a
2.24.2 a12.8 a12 ab704 a10.2 a
3.33.6 ab11.7 a8 b646 a9.3 a
4.43.0 b10.0 a10 b608 a9.1 a
Mean3.8 AB11.8 A12 AB684 AB10.2 AB
Camino Real1.13.7 a12.9 a18 a779 a14.8 a
2.23.8 a11.1 ab11 ab673 ab11.4 ab
3.32.6 b12.2a6 b408 b7.5 b
4.42.7 b6.2 b6 b443 b7.2 b
Mean3.2 BC10.5 AB11 ABC580 BC10.3 AB
Chandler1.14.0 a11.4 a16 a854 a15.2 a
2.24.1 a11.9 a15 a861 a16.0 a
3.33.7 a9.1 ab17 a759 a11.3 ab
4.42.6 b3.8 b 10 a558 a8.5 b
Mean3.6 ABC9.2 AB15 A831 A12.8 A
Radiance1.13.3 ab7.5 a6 a433 a6.1 a
2.23.9 a11.2 a10 a507 a6.9 a
3.33.1 ab8.0 a7 a381 a5.1 a
4.41.8 b7.1 a5 a369 a5.3 a
Mean3.0 C8.6 AB7 BC428 CD5.9 D
San Andreas1.13.9 a11.6 a16 a814 a12.3 a
2.24.1 a12.3 a17 a774 a13.3 a
3.33.9 a12.2 a13 a645 a10.3 a
4.43.8 a7.9 a11 a558 a8.5 a
Mean3.9 A11.0 A14 A691 AB11.0 AB
Salt treatment1.13.8 a x10.9 a13 a706 a11.5 a
2.23.9 a11.2 a11 ab653 ab10.6 ab
3.33.5 a10.5 a10 ab538 bc8.6 bc
4.42.9 b6.5 b8 b457 c7.1 c
Cultivar*** w************
Treatment***************
Cultivar × Treatment*NSNSNSNS
z For each cultivar, means with the same lowercase letters within a column are not significantly different between treatments according to Tukey’s HSD test at p < 0.05; y means with same uppercase letters within a column are not significantly different according to Tukey’s HSD test at p < 0.05; x means with the same lowercase letters within a column are not significantly different according to Tukey’s HSD test at p < 0.05; w NS, *, **, ***: not significant, or significant at p < 0.05, 0.01, and 0.001, respectively.
Strawberry yield (number and fresh weight of mature fruits) and potential yield (number and fresh weight of immature fruit) were significantly different among salt treatments and among cultivars, but no interactions were evident (Table 2). All strawberry cultivars except “Benicia” and “Camino Real” had similar cumulative numbers of mature berries across treatment levels. The number of mature berries of “Benicia” and “Camino Real” at EC4.4 decreased by 56% and 38%, respectively, compared with the control. Salt treatment did not significantly reduce the yield of “Albion”, “Camarosa”, “Chandler”, “Radiance”, and “San Andreas”, although there was a lower total mature fruit fresh weight at EC4.4. The fresh weight of mature fruit of “Benicia” and “Camino Real” at EC4.4 was reduced by 57% and 56%, respectively, compared with the control. Salt treatment had no effect on immature fruit number. The fresh weight of immature berries of “San Andreas” at EC4.4 was reduced by 58%. The other cultivars had similar fresh weights among treatments. These results further demonstrate that salinity negatively impacted the yield of immature fruit strawberries, but the level of yield reduction varied with cultivar. Similar results on strawberry yield reduction with increasing salinity levels were reported by others [4,6,8].
Table 2. Cumulative number of mature berries, cumulative fresh weight (FW) of mature fruit, number of immature fruit, and FW of immature fruit of strawberry cultivars irrigated with nutrient solution (electrical conductivity (EC) = 1.1 dS·m−1) or salt solutions (EC = 2.2, 3.3, or 4.4 dS·m−1) in the greenhouse.
VarietyTreatment (dS·m−1)No. of Mature FruitsFW of Mature Fruits (g)No. of Immature FruitsFW of Immature Fruits (g)
Albion1.17 a z103.5 a5 a14.5 ab
2.27 a105.2 a6 a23.9 a
3.36 a89.4 a5 a12.1 ab
4.47 a81.8 a4 a9.8 b
Mean7 CD y95.2 A5.1 C14.9 ABC
Benicia1.111 a130.4 a5 a10.3 a
2.27ab82.7 ab4 a9.4 a
3.38 ab94.4 ab5 a14.8 a
4.45 b56.4 b3 a8.3 a
Mean8 CD88.6 AB4.1 C10.5 C
Camarosa1.111 a122.8 a7 a10.6 a
2.212 a126.3 a6 a9.0 a
3.312 a103.1 a5 a7.0 a
4.412 a100.9 a5 a7.3 a
Mean12 A114.5 A5.7 C8.6 C
Camino Real1.18 a138.3 a6 a17.6 a
2.26 ab90.7 ab8 a21.0 a
3.37 ab112.2 ab4 a10.5 a
4.45 b60.6 b7 a18.2 a
Mean7 CD100.3 A6.2 BC16.7 ABC
Chandler1.111 a135.0 a10 a27.5 a
2.29 a127.2 a12 a28.7 a
3.39 a112.0 a9 a21.1 a
4.47 a69.5 a9 a16.0 a
Mean9 BC112.3 A9.8 A23.1 A
Radiance1.113 a128.4 a7 a12.7 a
2.211 a124.7 a7 a17.6 a
3.312 a119.0 a6 a11.3 a
4.49 a90.4 a6 a10.5 a
Mean11 AB117.8 A6.3 BC13.3 BC
San Andreas1.16 a66.8 a10 a31.7 a
2.26 a70.1 a9 a18.7 ab
3.35 a54.4 a10 a17.8 ab
4.45 a41.0 a6 a13.3 b
Mean5 D57.6 B8.6 AB19.8 AB
Salt treatment1.110 a x118.8 a7 a17.8 a
2.28 ab103.5 a7 a17.3 a
3.38 ab97.3 a6 a13.8 a
4.47 b69.0 b6 a12.1 a
Cultivar*** w******
Treatment************
Cultivar × TreatmentNSNSNSNS
z For each cultivar, means with the same lowercase letters within a column are not significantly different among treatments according to Tukey’s HSD multiple comparison at p < 0.05; y means with the same uppercase letters within a column are not significantly different according to Tukey’s HSD test at p < 0.05; x means with the same lowercase letters within a column are not significantly different among treatments according to Tukey’s HSD test at p < 0.05; w NS, *, **, ***: Differences between means for main effects and their interaction were not significant or significant at p < 0.05, 0.01, and 0.001, respectively.
Fruit Brix values for plants at EC4.4 were similar to those in the control treatment (p = 0.11), but significantly different among cultivars (p = 0.02) (data not shown). In addition, there was no interaction effect between treatment and cultivar (p = 0.95). Our results indicated that salt treatment did not impact the sweetness of harvested berries. Ferreira et al. [10] also found similar results. However, Saied et al. [4] reported that Brix values for the strawberry cultivars “Korona” and “Elsanta” decreased significantly with salinity. The differences may be a result of the different salt concentrations used in these studies.
Hierarchical cluster analysis of the seven strawberry cultivars was conducted using multivariate parameters including all relative growth data [14]. The dendrogram showed three distinguishable clusters (Figure 2). “Albion”, “Camarosa”, and “San Andreas” were clustered together and were determined to be the most salt tolerant group. “Camino Real” was separated from all others and considered to have moderate salt tolerance. “Benicia”, “Chandler”, and “Radiance” were classified as salt sensitive. These results agree with previous reports on the salt tolerance of strawberry cultivars. Gulen et al. [17] found that “Camarosa” was more tolerant than “Chandler” to NaCl treatment at 8.5, 17.0, or 34.0 mM. Ferreira et al. [10] reported that in a field study, “Albion” was relatively tolerant among five cultivars based on growth, yield, and the calculated EC50 (the salinity level that would reduce fruit yield per hectare by 50%).
Figure 2. Hierarchical cluster analysis of seven strawberry cultivars using multivariate parameters including all relative growth data. The dendrogram is based on Ward linkage using the squared Euclidian distance of the means of multivariate parameters.
Horticulturae 01 00027 g002

3.3. Gas Exchange and Leaf Greenness

Gas exchange recorded after the strawberry cultivars were watered six times with the salt solutions showed that salt treatment had no effect on Pn (p = 0.47; data not shown). However, Pn differed among cultivars (p = 0.003). “Albion” had the highest Pn of 14.7 μmol·m−2·s−1, while “San Andreas” had the lowest Pn of 10.6 μmol·m−2·s−1. Gas exchange was measured again one week prior to the final harvest (eight weeks after the first measurement). Leaf, stomatal gs, and Pn were different among treatments (Table 3). Salt treatment generally decreased the overall transpiration rate or stomatal conductance across all cultivars at EC4.4 or EC3.3, respectively, although individual cultivars did not show salt effects on Pn. As shown in Table 3, all three parameters, Pn, gs, and E were reduced at EC3.3 and EC4.4 across all cultivars. Salt treatment did not affect the overall cultivar chlorophyll leaf content, but the SPAD meter readings varied among cultivars (Table 3). When averaged across all salt treatments, “San Andreas” and “Camino Real” had higher leaf chlorophyll content with SPAD readings of 49.2 and 48.3, respectively, while “Camarosa” and “Chandler” were lower at 45.6 and 41.9, respectively. By comparison, Turhan and Eris [18] reported that total chlorophyll content was unaffected in “Camarosa” and “Tioga” strawberries at the end of 10 weeks of NaCl treatments at 500, 1000, and 2000 mg·L−1.
Table 3. Leaf transpiration rate (E, mmol·m−2·s−1), stomatal conductance (gs, mmol·m−2·s−1), net photosynthesis (Pn, μmol·m−2·s−1), and relative chlorophyll content (SPAD) of strawberry cultivars irrigated with a nutrient solution (electrical conductivity (EC) =1.1 dS·m−1) and a salt solution (EC = 2.2, 3.3, or 4.4 dS·m−1) in the greenhouse.
VarietyTreatmentE (mmol·m−2·s−1)gs (mmol·m−2·s−1)Pn (μmol·m−2·s−1)SPAD
Albion1.17.9 a z422.6 a16.2 a46.3 a
2.27.1 a396.3 a15.6 a46.6 a
3.36.3 a306.4 a13.2 a45.5 a
4.46.1 a323.8 a13.9 a47.2 a
Mean6.9 A y360.5 AB14.7 A46.4 BC
Benicia1.17.8 a478.0 a16.0 a43.1 a
2.27.1 a391.6 a15.2 a47.4 a
3.37.3 a424.8 a15.6 a46.6 a
4.46.3 a299.4 a13.4 a47.0 a
Mean7.1 A392.6 A14.9 A46.2 BC
Camarosa1.17.3 a369.0 a14.7 ab45.1 a
2.27.6 a366.6 a15.8 a44.2 a
3.36.4 a269.8 a11.4 b46.2 a
4.46.2 a314.3 a12.2 ab47.2 a
Mean6.9 A334.1 AB13.7 A45.6 C
Camino Real1.17.9 a369.6 a14.0 ab49.4 a
2.27.3 a420.5 a17.0 a49.4 a
3.36.6 a304.8 a12.4 b47.1 a
4.47.4 a393.8 a15.8 ab47.3 a
Mean7.3 A373.2 AB14.8 A48.3 AB
Chandler1.17.1 a394.0 a15.8 ab43.2 a
2.27.1 a407.8 a16.5 a44.1 a
3.36.1 a306.8 a11.3 b40.5 a
4.46.2 a359.0 a15.4 ab40.0 a
Mean6.6 A365.1 AB14.6 A41.9 D
Radiance1.17.5 ab331.8 ab14.1 ab42.6 a
2.28.1 a375.0 a14.9 a48.9 a
3.35.7 b272.8 ab11.9 ab43.6 a
4.45.9 ab234.3 b9.4 b45.6 a
Mean6.8 A305.7 AB12.7 A45.8 BC
San Andreas1.17.1 a325.0 a13.7 ab48.5 ab
2.27.3 a356.6 a15.2 a52.2 a
3.36.2 a284.8 a13.0 ab50.0 ab
4.46.0 a245.2 a11.1 b47.2 b
Mean6.6 A301.7 B13.2 A49.2 A
Salt treatment1.17.5 a x384.8 a14.9 a45.8 a
2.27.4 a385.8 a15.7 a47.4 a
3.36.3 b307.8 b12.6 b45.5 a
4.46.3 b310.7 b13.1 b46.1 a
CultivarNS w*******
Treatment*********NS
Cultivar × TreatmentNSNSNS*
z For each cultivar, means with the same lowercase letters within a column are not significantly different among treatments according to Tukey’s HSD test at p < 0.05; y means with the same uppercase letters within a column are not significantly different according to Tukey’s HSD test at p < 0.05; x means with the same lowercase letters within a column are not significantly different according to Tukey’s HSD test at p < 0.05; w NS, *, **, ***: Differences between means for main effects and their interaction were not significant, or significant at p < 0.05, 0.01, and 0.001, respectively.

3.4. Ion Analysis

Leaf Na and Ca concentrations were significantly different among salt treatments and cultivars, but there were no interactions (Table 4). Compared with the plants in the control treatment, leaf Na concentrations of “Camarosa”, “Chandler”, and “San Andreas” at EC4.4 increased by 323%, 423%, and 90%, respectively, while those of “Camino Real” and “Chandler” at EC3.3 increased by 199% and 156%, respectively. The other salt treatments did not affect the leaf Na concentration of “Camarosa”, “Camino Real”, “Chandler”, and “San Andreas”. The highest Na concentration (2.21 mg·g−1 DW) was measured in “Radiance” at EC4.4. Turhan and Eris [9] reported that NaCl treatments at 8.5, 17.0, or 34.0 mM increased the Na concentration in the leaf tissue of “Camarosa” and “Chandler” with a sharp increase in “Chandler”.
Leaf Ca concentrations in the cultivars “Albion”, “Benicia”, and “Camarosa” were not statistically different among treatments (Table 4). Compared with control plants, the leaf Ca concentration of “Chandler”, “Radiance”, and “San Andreas” at EC3.3 increased by 25%, 27%, and 30%, respectively, while that of “Camino Real”, “Chandler”, and “San Andreas” at EC4.4 increased by 31%, 39%, and 33%, respectively. The highest Ca concentrations (25.84 mg·g−1 DW) were measured in “Radiance” at EC3.3. In contrast, Keutgen and Pawelzik [6] reported that leaf Ca concentrations for “Korona” and “Elsanta” were not affected when they were exposed to NaCl at 40 and 80 mmol·L−1.
Leaf Cl concentrations were significantly affected by the salt treatments and cultivars and their interaction (Table 4). Applying salt treatments increased the leaf Cl concentration of all strawberry cultivars. The three cultivars with relatively low leaf Cl concentrations (below 15 mg·g−1) at EC4.4 were “San Andreas”, “Albion”, and “Camarosa”. Coincidentally, these three cultivars had visual scores above 3.0 and were clustered together in the relatively tolerant group, while the other four cultivars had visual scores below 3.0 with leaf Cl concentrations at EC4.4 above 15.0 mg·g−1. The highest Cl concentration (19.77 mg·g−1 DW) was found in “Chandler” at EC4.4. Turhan and Eris [9] similarly reported that the Cl concentration in the leaves of “Camarosa” and “Chandler” progressively increased with increasing NaCl concentrations from 8.5 to 34.0 mM.
Na exclusion and tolerance of tissue to accumulated Cl are two mechanisms of plant adaptation to salinity [19]. Strawberry is considered an Na excluder [4] and has an extremely low chlorine requirement [8]. In our study, all cultivars had relatively low leaf Na concentrations, generally lower than 1.5 mg·g−1 dry mass. However, leaf Cl concentrations at EC4.4 were much higher, especially for “Benicia”, “Camino Real”, “Chandler”, and “Radiance”. Similar results were reported by Saied et al. [4] who conducted a two-year field study with “Elsanta” and “Korona” under salinity levels of 0.3, 2.6, and 5.1 dS·m−1. In their study, Na concentrations below 3 mg·g−1 were reported, while Cl concentrations increased up to 70 mg·g−1 in “Korona” and 80 mg·g−1 in “Elsanta” plants. They also reported that “Korona” retained most of its Cl in the roots and crowns, while the highest concentration of Cl was detected in “Elsanta” petioles. Strawberry plants are sensitive to high Cl levels [8] and a leaf Cl concentration higher than 0.5% is associated with leaf necrosis and yield reduction in many cultivars [20]. The foliar injury and growth reduction observed in “Benicia”, “Camino Real”, “Chandler”, and/or “Radiance” were most likely caused by high leaf Cl accumulation, similar to that reported by Martinez Barroso and Alvarez [7] and Kepenek and Koyuncu [8].
Table 4. Leaf ion concentration of strawberry cultivars irrigated with the nutrient solution (electrical conductivity (EC) = 1.1 dS·m−1) or salt solution (EC = 2.2, 3.3, or 4.4 dS·m−1) in the greenhouse.
VarietyTreatmentIon Concentration (mg·g−1)
NaCaClK
Albion1.10.56 a z17.29 a3.63 c27.03 a
2.20.82 a22.47 a8.58 b23.46 ab
3.30.66 a22.08 a10.58 ab23.34 ab
4.40.92 a21.37 a13.80 a21.16 b
Mean0.75 A y20.80 A9.14 A23.75 A
Benicia1.10.73 a18.52 a4.73 d23.79 a
2.20.94 a18.49 a8.60 c21.95 ab
3.31.41 a18.64 a11.58 b21.28 ab
4.41.55 a21.58 a16.08 a19.46 b
Mean1.16 A19.31 AB10.24 A21.62 AB
Camarosa1.10.43 b16.09 a3.10 c22.36 a
2.20.86 ab18.39 a9.20 b21.49 ab
3.31.06 ab21.98 a14.30 a19.29 b
4.41.35 a21.86 a13.43 a18.64 b
Mean0.89 A19.25 AB9.78 A20.44 B
Camino Real1.10.61 b17.08 b4.00 c26.36 a
2.20.93 b17.66 ab9.85 b23.95 ab
3.31.83 a22.30 ab16.38 a21.26 b
4.41.13 b22.42 a17.55 a20.54 b
Mean1.13 A19.86 A11.94 A23.03 AB
Chandler1.10.40 c16.65 b3.63 d24.33 a
2.20.62 bc18.42 ab9.48 c21.91 b
3.31.02 ab20.74 a13.00 b 20.88 b
4.41.31 a21.05 a19.77 a21.82 b
Mean0.80 A19.10 AB10.91 A22.24 AB
Radiance1.10.83 a21.27 b5.38 b25.67 a
2.21.11 a19.53 b9.70 b24.53 a
3.31.43 a25.84 a9.37 b21.09 a
4.42.21 a23.96 ab17.23 a21.29 a
Mean1.27 A22.20 A10.00 A23.41 A
San Andreas1.10.58 b13.85 b2.98 c25.80 a
2.20.80 ab15.31 ab7.83 b24.75 a
3.30.82 ab17.94 a11.33 a22.80 ab
4.41.11 a18.37 a13.78 a20.13 b
Mean0.83 A16.37 B8.98 A23.37 A
Salt treatment1.10.59 b x17.25 b3.92 d25.05 a
2.20.87 b18.61 b9.03 c23.15 b
3.31.18 a21.16 a12.47 b21.42 c
4.41.30 a21.32 a15.84 a20.37 c
Cultivar*** w*********
Treatment************
Cultivar × TreatmentNSNS*NS
z For each cultivar, means with the same lowercase letters within a column are not significantly different among treatments according to Tukey’s HSD test at p < 0.05; y means with the same uppercase letters within a column are not significantly different according to Tukey’s HSD test at p < 0.05; x means with the same lowercase letters within a column are not significantly different according to Tukey’s HSD test at p < 0.05; w NS, *, **, ***: Differences between means for main effects and their interaction were not significant, or significant at p < 0.05, 0.01, and 0.001, respectively.
Potassium (K) plays an important role in turgor-pressure-driven solute transport in the xylem and water balance of plants [21]. Plants exposed to NaCl inevitably accumulate high amounts of Na, which subsequently interferes with K uptake, causing a reduction in K content [22]. In our experiment, leaf K concentrations decreased significantly with increasing EC levels in all cultivars except “Radiance” (Table 4). Compared with the control plants, the leaf K concentration at EC4.4 for all strawberry cultivars decreased by 10% to 26%, except for Radiance. However, K concentrations for “Camarosa”, “Camino Real”, and “Chandler” were reduced by 14% to 19% when irrigated with a salt solution of only EC 3.3 dS·m−1. Interestingly, a salt solution at an EC of only 2.2 dS·m−1 decreased the leaf K concentration of “Chandler” by 10%. Turhan and Eris [9] reported that the potassium content decreased in the aerial part of “Camarosa” plants with increasing NaCl levels from 8.5 to 34.0 mM, but with “Chandler”, a solution of 8.5 mM NaCl increased the K content compared with the control. Keutgen and Pawelzik [6] reported that “Korona” strawberry also had a significant increase in the K content of the leaves. These results suggest that the efficiency of K uptake or the ability of strawberry adaptation to increasing levels of salinity is cultivar dependent.
The results of this study further indicated that variations in tolerance to salinity exists among cultivars. Growers who are considering growing strawberries in soils with relatively high salinity levels or who will be irrigating with saline water should consider selecting cultivars that have demonstrated salt tolerance. When produced under optimal conditions, strawberries have a high value of return; however, costs of production are also high and the increased salinity levels found in many regions like Texas could experience reduced yields, berry quality and, subsequently, grower profitability. Similar research is needed on additional selected cultivars that are being considered for strawberry production in Texas and other regions where high salt levels can potentially reduce crop performance.

4. Conclusions

The plant growth and fruit yield across all strawberry cultivars were reduced by the increased salinity of the irrigation water in this study, but the level of reduction varied with cultivar and the level of salinity. The salt solution at an EC of 4.4 dS·m−1 significantly reduced the shoot DW of “Camino Real” and “Chandler” as well as the fruit yield of “Benicia” and “Camino Real”. The salt solution at an EC of 3.3 dS·m−1 significantly reduced the shoot DW of “Camino Real”, but not the other cultivars. Three distinguishable strawberry groups were obtained using cluster analysis, which showed that “Albion”, “Camarosa”, and “San Andreas” were the most salt tolerant cultivars, while “Benicia”, “Chandler”, and “Radiance” were the least tolerant. Although “Camino Real” was classified as moderately salt tolerant by the cluster analysis, its visual scores were lower and leaf Cl concentrations were higher, and thus it probably should be grouped as less tolerant. “Chandler” is considered one of the industry standards for producers in Texas, but its susceptibility to salinity may reduce its widespread use as production acreage expands. “Camarosa” is similar to “Chandler” in overall production, and may be a better choice due to higher salt tolerance.

Acknowledgments

This research was partially supported by a grant from the National Strawberry Sustainability Initiative with funding provided by the Walmart Foundation and administered by the University of Arkansas and U.S. Department of Agriculture National Institute of Food and Agriculture Hatch project TEX090450. The content is solely the responsibility of the authors and does not necessarily represent the official views of the funding agencies.

Author Contributions

This work was a product of the combined effort of all of the authors. All authors conceptualized and designed the study. Youping Sun performed the experiments, collected and analyzed the data, and wrote the manuscript with assistance from all other authors, mainly Genhua Niu. Joseph Masabni, Russ Wallace, and Mengmeng Gu provided technical advice and assistance when the study was conducted, and revised and improved the manuscript.

Conflicts of Interest

The authors declare no conflict of interest.

References

  1. USDA, National Agricultural Statistics Service. Noncitrus Fruits and Nuts 2013 Summary; U.S. Department of Agriculture: Washington, DC, USA, 2014. [Google Scholar]
  2. Wallace, R.W.; Stein, L. Strawberry production in Texas. In Production Guide for Texas-Grown Strawberries; Wallace, R.W., Anciso, J., Eds.; Texas A&M AgriLife Extension: College Station, TX, USA; Available online: http://www.agrilifebookstore.org/ (accessed on 25 May 2015).
  3. Wallace, R.W.; Webb, C.J. Strawberries grown under protective cultivation on the Texas High Plains. J. Amer. Pomol. Soc. 2013, 67, 7–10. [Google Scholar]
  4. Saied, A.S.; Keutgen, A.J.; Noga, G. The influence of NaCl salinity on growth, yield and fruit quality of strawberry cvs. “Elsanta” and “Korona”. Sci. Hortic. 2005, 103, 289–303. [Google Scholar] [CrossRef]
  5. Orsini, F.; Alnayef, M.; Bona, S.; Maggio, A.; Gianquinto, G. Low stomatal density and reduced transpiration facilitate strawberry adaptation to salinity. Environ. Exp. Bot. 2012, 81, 1–10. [Google Scholar] [CrossRef]
  6. Keutgen, A.J.; Pawelzik, E. Quality and nutritional value of strawberry fruit under long term salt stress. Food Chem. 2009, 107, 1413–1420. [Google Scholar] [CrossRef]
  7. Martinez Barroso, M.C.; Alvarez, C.E. Toxicity symptoms and tolerance of strawberry to salinity in the irrigation water. Sci. Hortic. 1997, 71, 177–188. [Google Scholar] [CrossRef]
  8. Kepenek, K.; Koyuncu, F. Studies on the salt tolerance of some strawberry cultivars under glasshouse. Acta Hortic. 2002, 573, 297–304. [Google Scholar] [CrossRef]
  9. Turhan, E.; Eris, A. Changes of growth, amino acids, and ionic composition in strawberry plants under salt stress conditions. Commun. Soil Sci. Plant Anal. 2009, 40, 3308–3322. [Google Scholar] [CrossRef]
  10. Ferreira, J.F.S.; Liu, X.; Suarez, D.L. Salinity tolerance of five commercial cultivars of strawberry (Fragaria × ananassa Duch.). In Proceedings of the 3rd International Salinity Forum, Riverside Convention Center, CA, USA, 16–18 June 2014; pp. 170–171.
  11. Wright, R.D. The pour-through nutrient extraction procedure. Hortscience 1986, 21, 227–229. [Google Scholar]
  12. Harrill, R. Using a Refractometer to Test the Quality of Fruits & Vegetables; Pineknoll Publishing: Keedysville, MD, USA, 1998. [Google Scholar]
  13. Gavlak, R.G.; Horneck, D.A.; Miller, R.O. Plant, Soil, and Water Reference Methods for the Western Region; Western Regional Extension Publication (WREP): Corvallis, OR, USA, 1994; Volume 125. [Google Scholar]
  14. Zeng, L.; Shannon, M.C.; Grieve, C.M. Evaluation of salt tolerance in rice genotypes by multiples agronomic parameters. Euphytica 2002, 127, 235–245. [Google Scholar] [CrossRef]
  15. Niu, G.; Cabrera, R. Growth and physiological responses of landscape plants to saline water irrigation: A review. HortScience 2010, 45, 1605–1609. [Google Scholar]
  16. Kaya, C.; Higgs, D.; Saltali, K.; Gezerel, O. Response of strawberry growth at high salinity and alkalinity to supplementary potassium. J. Plant Nutr. 2002, 25, 1415–1427. [Google Scholar] [CrossRef]
  17. Gulen, H.; Turhan, E.; Eris, A. Changes in peroxidase activities and soluble proteins in strawberry varieties under salt stress. Acta Physiolagiae Plant. 2006, 28, 109–116. [Google Scholar] [CrossRef]
  18. Turhan, E.; Eris, A. Changes of micronutrients, dry weight, and chlorophyll contents in strawberry plants under salt stress conditions. Commun. Soil Sci. Plant Anal. 2005, 36, 1021–1028. [Google Scholar] [CrossRef]
  19. Munns, R.; Tester, M. Mechanisms of salinity tolerance. Annu. Rev. Plant Biol. 2008, 59, 651–681. [Google Scholar] [CrossRef] [PubMed]
  20. Ulrich, A.; Mostafa, M.A.E.; Allen, W.W. Strawberry Deficiency Symptoms: A Visual and Plant Analysis Guide to Fertilization; Agricultural Experiment Station, Division of Agriculture and Natural Resources, University of California: Berkeley, CA, USA, 1980. [Google Scholar]
  21. Marschner, H. Mineral Nutrition of Higher Plants, 2nd ed.; Academic Press: London, UK, 1995. [Google Scholar]
  22. Hasegawa, P.M.; Bressan, R.A.; Zhu, J.K.; Bohnert, H.J. Plant cellular and molecular responses to salinity. Annu. Rev. Plant Physiol. Plant Mol. Biol. 2000, 51, 463–499. [Google Scholar] [CrossRef] [PubMed]

