Article

Enhancement of 2,3-Butanediol Production by Klebsiella pneumoniae: Emphasis on the Mediation of sRNA-SgrS on the Carbohydrate Utilization

1
Engineering Research Center of Agricultural Microbiology Technology, Ministry of Education, Heilongjiang University, Harbin 150500, China
2
Key Laboratory of Microbiology, College of Heilongjiang Province, School of Life Sciences, Heilongjiang University, Harbin 150080, China
*
Author to whom correspondence should be addressed.
Fermentation 2022, 8(8), 359; https://doi.org/10.3390/fermentation8080359
Submission received: 20 June 2022 / Revised: 24 July 2022 / Accepted: 26 July 2022 / Published: 28 July 2022
(This article belongs to the Section Microbial Metabolism, Physiology & Genetics)

Abstract

:
The demand for renewable energy is increasing. Klebsiella pneumoniae is one of the most promising strains to produce 2,3-butanediol (2,3-BD). Compared with chemical methods, the biological production of 2,3-BD has the characteristics of substrate safety, low cost, and low energy consumption. However, excessive glucose concentrations can cause damage to cells. Therefore, this study investigated the effect of sRNA-SgrS as a sugar transport regulator on the fermentative production of 2,3-BD by K. pneumoniae in response to sugar stress. We designed multiple mutants of K. pneumoniae HD79 to redistribute its carbon flux to produce 2,3-BD. It was found that the 2,3-BD yield of sgrS overexpressed strain decreased by 44% compared with the original strain. The results showed that a high concentration of sRNA-SgrS could accelerate the degradation of ptsG mRNA (encoding the glucose transporter EIICBGlc) and downregulate the expression levels of the budA gene (encoding the α-acetyllactate decarboxylase) and the budB gene (encoding the α-acetyllactate synthase) and budC gene (encoding the 2,3-BD dehydrogenase) but had no effect on the ack gene (encoding the acetate kinase) and the ldh gene (encoding the lactate dehydrogenase). It provides a theoretical basis and a technical reference for understanding the complex regulation mechanism of sRNA in microorganisms and the genetics and breeding in industrial fermentation engineering.

1. Introduction

2,3-Butanediol (2,3-BD) is a colorless, odorless liquid with numerous industrial applications. As an important raw chemical raw material, 2,3-BD has a wide range of uses in oil refining, dyes, adhesives, electronic component cleaning, printing ink, and other industries [1,2]. As an alcohol substance, various chemical reactions can occur with it, and the products of 2,3-BD have important applications in industry and daily life. In daily life, 2,3-BD is used in the manufacture of cosmetics, medicines, and detergents; in industry, it is used in the synthesis of liquid fuels and polymers [3,4,5,6]. Currently, there are two main methods for producing 2,3-BD: chemical synthesis and biotransformation. Compared with chemical methods, biological methods have low cost and low technical difficulty and significantly reduce pollution to the environment. This method meets the requirements of the low-carbon and environmentally friendly green chemical industry and is extremely sustainable [7,8]. Many bacterial species can be used to produce 2,3-BD, and the most efficient strains reported to date are Klebsiella pneumoniae, Klebsiella oxytoca, Saccharomyces, and Escherichia aerogenes [9,10,11,12,13].
K. pneumoniae has tremendous potential in industrial applications as a microbial cell factory. Due to its wide range of recipes, it can directly use various carbon sources, such as glucose, arabinose, xylose, and fructose, to produce 2,3-BD and has the characteristics of thorough fermentation, fewer byproducts, and relatively high product concentrations and conversion rates [14,15,16]. An excessive glucose concentration will exert stress on the fermentation strain, and the high sugar-phosphate content inside the cell can inhibit the metabolic growth of the cell and even damage the DNA [17,18,19].
Therefore, we raised the following questions: based on the application of traditional metabolic engineering methods, does the yield of 2,3-BD not achieve the expected effect due to the limitation of substrate concentration? Could it be that increasing the tolerance of the strain to the substrate (glucose) could increase the metabolism to produce more 2,3-BD? After reviewing the literature, Negrete et al. found only one report demonstrating reduced acetic acid production of the Escherichia coli K-12 strain by overexpressing the sgrS gene in 2013 [20]. After 8 h of fermentation with 40 g/L glucose as a substrate, the acetic acid yield of the sgrS-overexpressing strain was close to 0 g/L, which was significantly lower than that of the original strain of 10 g/L [20]. Northern blot analysis showed that ptsG mRNA encoding EIICBGlc was significantly reduced in the sgrS-overexpressing strain but not in the original strain [20]. The results showed that sRNA-SgrS may affect the production of fermentation products by changing the uptake of sugars by fermentation strains and the concentration of sugar phosphate in the bacteria during the fermentation process with glucose as a carbon source. Therefore, sRNA-SgrS, as a sugar transport regulator in bacteria, became important.
Small RNA (sRNA) is an RNA molecule produced by genome transcription, but most sRNAs do not encode proteins [21]. In contrast to general sRNA, SgrS is a dual-function sRNA that regulates several mRNA targets through direct base pairing and encodes a short peptide, SgrT [22,23]. SgrS and SgrT solve the problem of sugar transport under sugar stress at two levels. At the protein level, the sgrS in most Enterobacteriaceae can translate a short peptide, SgrT, which can specifically bind to the EIICGlc part of the carrier PtsG cell membrane [24]. It can shut down the transport function of glucose on transporter PtsG so that the bacteria can better survive in an environment where multiple carbon sources coexist [19]. At the transcriptional level, SgrS performs posttranscriptional regulation of multiple target mRNAs, thereby changing the number of intracellular-related target mRNAs. There are three regulation modes of sRNA-SgrS [25] (Figure 1). First, the sgrS gene participates in the stress process of glucose metabolism by inhibiting the translation initiation of the ptsG mRNA, reducing the EIICBGlc encoding the glucose transporter on the cell membrane, and inhibiting the entry of glucose [17,26]. Second, the manXYZ mRNA (encoding the mannose transporter ManXYZ, EIIMan) interacts with sRNA-SgrS, thereby inhibiting the translation of manXYZ mRNA. When sRNA-SgrS binds to two parts of the manXYZ mRNA at the same time, RNase E accelerates the degradation of the target mRNA [27,28]. In contrast to the above two genes, the yigL gene can encode a phosphatase located in the cytoplasm, which can dephosphorylate the phosphorylated glucose in the cell, and then transport the dephosphorylated glucose out of the cell through free diffusion and corresponding transport vectors, thus improving the tolerance of bacteria to sugar stress [29,30].
Currently, the research on sRNA-SgrS mostly focuses on the regulatory mechanism of sugar metabolism (ptsG, manXYZ, yigL mRNA) and other related metabolisms (asd, adiY, folE, and purR mRNA) [31]. Little attention has been given to the effect of this sRNA on metabolite production. This experiment explores how sRNA-SgrS, as a sugar transport coordinator, activates related target genes. This affects K. pneumoniae HD79 and K. pneumoniae HD79-02 (Δldh, Δack) to utilize glucose metabolism to produce 2,3-BD. It provides a theoretical basis and a technical reference for understanding the complex regulation mechanism of sRNA in microorganisms and the genetics and breeding in industrial fermentation engineering.

2. Materials and Methods

2.1. Biochemical Reagents

5-Bromo-4-chloro-3-indole-β-D-galactoside (X-gal) and ampicillin (Amp) were purchased from Dalian Bao BioEngineering Co., Ltd. (Dalian, China). Ethylenediaminetetraacetic acid (EDTA) and agarose were purchased from Shanghai Bioengineering Co., Ltd. (Shanghai, China). Imported CaCl2 was purchased from Amresco Company (Shanghai, China).

2.2. Strains, Media, and Growth Conditions

All strains used or created in this work, along with their sources and characteristics are shown in Table 1. E. coli DH5α was purchased from Takara Biotechnology Co., Ltd. (Dalian, China), which is used for gene cloning. For enrichment, K. pneumoniae HD79 and K. pneumoniae HD79-02, stored in −80 °C refrigerator, were inoculated in Luria-Bertani (LB) liquid medium (1% tryptone, 0.5% yeast extract, 1% NaCl; w/v, pH 7.0). and oscillated at 30 °C for 24 h at 150 r/min. It also was used for the growth of E. coli DH5α. Seed medium (SM, pH 7.0): 1 g/L (NH4)2SO4, 3.4 g/L K2HPO4·3H2O, 1.3 g/L KH2PO4, 0.2 g/L MgSO4, 1 g/L yeast extract, 2 mL/L trace elements, 1 mL/L iron solution. The seed medium was added to the sterilized glucose so that the glucose concentration in the medium was 30 g/L. It was used for the cultivation of cryopreserved 2,3-BD fermenting strains. Liquid fermentation medium (LFM, pH 7.0): 6.6 g/L (NH4)2SO4, 8.7 g/L K2HPO4·3H2O, 6.8 g/L KH2PO4, 0.25 g/L MgSO4·7H2O, 5 g/L yeast extract, 0.05 g/L FeSO4·7H2O, 0.001 g/L ZnSO4·7H2O, 0.001 g/L MnSO4·H2O, 0.001 g/L CaCl2·2H2O. The LFM medium was added to the sterilized glucose so that the glucose concentration in the medium was 200 g/L. It was used for the metabolism test of 2,3-BD fermentation strains. Solid fermentation medium (SFM): 2× solid fermentation medium (13.2 g/L (NH4)2SO4, 17.4 g/L K2HPO4·3H2O, 13.6 g/L KH2PO4, 0.5 g/L MgSO4·7H2O, 10 g/L yeast extract, 0.1 g/L FeSO4·7H2O, 0.002 g/L ZnSO4·7H2O, 0.002 g/L MnSO4·H2O, 0.002 g/L CaCl2·2H2O, 4% agar powder; pH 7.0; autoclave at 121 °C for 15 min) and 2× saccharide aqueous solution (various sugars were doubled according to the required concentration, dissolved in sterile water, and sterilized by autoclaving at 108 °C for 20 min) were mixed in a ratio of 1:1, which was used to compare the tolerance of each strain to various carbohydrates.

2.3. Obtainment of sgrS Gene Knockout and Overexpression Strains

Bacterial genomic DNA (Mini) extraction kit (DP302-02) was used to extract the genomes of K. pneumoniae HD79 and K. pneumoniae HD79-02, cultured to the exponential stage. With K. pneumoniae HD79 and K. pneumoniae HD79-02 genomes as templates, the sgrS gene sequences (EMBL database, ID: URS0006F6AF4_573) were amplified by polymerase chain reaction (PCR) by using the following primers: sgrS-up (5′-CGGGGTACCGATGAAGCGAGGAGGTGAATA, KpnI), sgrS-down (5′-CCGCTCGAGGAAAAAAGCCAGCAGAGGC, XhoI). To clone EGFP, pEGEP-C3 (Laboratory preservation) was used as a template with the following primers: EGFP-up (5′-CGCTGATCAGTAACAACTCCGCCCCATTG, BclI) and EGFP-down (5′-CGCTGATCAGGGAGGTGTGGGAGGTTTT, BclI). The sgrS and EGFP genes were cloned into pMD18-T (D101A, TaKaRa, Dalian, China) to construct pT-sgrS and pT-EGEP, respectively. pT-sgrS and pT-EGEP were digested with BclI, and the resulting EGFP gene fragments and linear pT-sgrS were linked to pXL-sgrSA1-EGFP-sgrSA2 by T4 DNA ligase. The ligation products were transformed into E. coli DH5α by heat shock. Then, the obtained positive clones were double digested by KpnI and XhoI to obtain homologous recombination fragments, sgrSA1-EGFP-sgrSA2 (Figure 2a). The sgrSA1-EGFP-sgrSA2 was electroporated into K. pneumoniae HD79 and K. pneumoniae HD79-02 competent cells containing pKD46 (MLCC013, Wuhan Miaolingbio Bioscience & Technology Co., Ltd., Wuhan, China) and induced by L-arabinose to knock out the sgrS gene in the host bacteria.
To clone RFP, pmCherry-3.1-RFP (provided by Harbin Medical University, Harbin, China) was used as a template with the following primers: RFP-up (5ʹ- CGCGGATCCGGTCGCCACCATGGTGAGC, BamHI) and RFP-down (5ʹ-CCGGAATTCGGTGGAGTGGCGGCCCTC, EcoRI). The RFP was cloned into pRSFDuet-1 (Laboratory preservation), and the recombinant plasmid was called pT-RFP. The pT-RFP strain and pRSFDuet-1 were double digested with BamHI and EcoRI, and the vector after connecting them with T4 DNA ligase was pXL-RFP. The plasmids pT-sgrS and pXL-RFP were double digested with KpnI and XhoI to obtain the KpnI-XhoI-sgrS fragment and linear KpnI-XhoI-pXL-RFP, which are related to T4 DNA ligase, and the recombinant plasmid was named pXL-RFP-sgrS (Figure 2b). The pXL-RFP-sgrS was electroporated K. pneumoniae HD79 and K. pneumoniae HD79-02 competent cells.

2.4. Sugar Tolerance Test

K. pneumoniae HD79, HD79-O, HD79-K, HD79-02, HD79-02-O, and HD79-02-K grown in LB liquid medium for 6–8 h to logarithmic growth phase (OD600nm = 1.30 ± 0.5) were spread in SFM medium containing trehalose (150, 175, 200, 225, 250 g/L), glucose (150, 175, 200, 225, 250 g/L), galactose (150, 175, 200, 225, 250, 275 g/L), mannose (150, 175, 200, 225, 250, 275 g/L), arabinose (50, 62.5, 75, 100, 125, 150 g/L), xylose (50, 62.5, 75, 100, 125, 150 g/L) and fructose (50, 75, 100, 125, 150 g/L), respectively. The spread plate was incubated at 30 °C for 36 h. According to the growth of each strain in different kinds of sugars at different concentrations, the critical concentration of different sugars was finally determined; that is, the sugar concentration of different strains under different growth conditions could be clearly distinguished.

2.5. Fermentation Kinetics

The bacterial liquid of 6 strains growing on SM medium was inoculated into FM medium with 5% inoculation amount. Batch fermentation was performed in 500 mL flasks containing 150 mL fermentation medium with glucose (200 g/L) as the substrate. Flasks were cultured at 30 °C with shaking at 150 rpm for 120 h. Samples were taken every 12 h until the end of fermentation, and transcriptome analysis was performed every 12 h from 24 h to 72 h. Each time, every 3 mL sample was taken to determine its pH value. At the same time, 1 mL sample was taken and diluted tenfold, and the absorbance value at OD600nm was measured with the FM medium as a blank control. After the samples were processed, the concentrations of glucose and 2,3-BD were determined by high-performance liquid chromatography (HPLC). The HPLC analysis system (Shimadzu, Shanghai, China) of Shimadzu LC20A includes an LC-10ATvp pump, a RID-10A differential detector, an HPX-87H column, an injection volume of 20 μL, a mobile phase of 0.005 mol/L sulfuric acid, a flow rate of 0.8 mL/min, a differential detector temperature of 40 °C, a column temperature of 65 °C, and a fermentation product composition analysis time of 20 min.

2.6. Quantitative Real-Time PCR (qRT-PCR) to Measure Gene Expression

qRT-PCR was used to detect the expression of sgrS, ptsG, manXYZ, yigL, ack, ldh, budA, budB, and budC in K. pneumoniae HD79 and K. pneumoniae HD79-02 (Δldh, Δack) at 24 h, 48 h, and 72 h. The above reaction used SYBR Green on a 7500 Real-Time PCR System (Applied Biosystems, Inc., Waltham, MA, USA). The reaction primers were 16S-up (5ʹ-GATGACCAGCCACACTGGAA) and 16S-down (5ʹ-GGAGTTAGCCGGTGCTTCTT) and ack-up (5ʹ-CGATACGGCGTTCCATCAGA) and ack-down (5ʹ-GAAACAGAACCACCGTTGCC) and ldh-up (5ʹ-TCATACCGATCGCATGCTCA) and ldh-down (5ʹ-GACAGCGAAGACTGCCAAAA) and budA-up (5ʹ-TGATCGACCAGCAAATCCCC) and budA-down (5ʹ-CGACGTTGATCCCCTGCATA) and budB-up (5ʹ-AACAGTATCCGGTACGCCAG) and budB-down (5ʹ-ATAAATGCGGCGTTGGCTTC) and budC-up (5ʹ-ATGGCGGTGAAAGTGGATGT) and budC-down (5ʹ-CGCCGTGACCCTCTTTCTTA) and ptsG-up (5ʹ-AACTTTCGCTACATCCGCCA) and ptsG-down (5ʹ-GCGTGCTGATTAAAGCCCTG) and manXYZ-up (5ʹ-GCGTATCGACCTTTCCCGAT) and manXYZ-down (5ʹ-CACCACCAGCTGACTGCTTA) and yigL-up (5ʹ-ACCTGCGATAAGCATGAGCA) and yigL-down (5ʹ-TTCCGCATCGTTCATACCGT) and sgrS-up (5ʹ-AACGCTACTTTTCTGCGACG) and sgrS-down (5ʹ-AATCACGCAGCCCGAACATA). The qRT-PCR results were analyzed through the DDCt method using the 16s rRNA gene as the reference gene. Results are presented as relative quantities.

2.7. Statistical Analysis

The results are shown as the average and standard deviation of three independent samples. OriginPro 2021b software was also used for statistical analysis and chart analysis. Structural equation modeling (SEM) was conducted by IBM SPSS AMOS (version 23.0, New York, NY, USA) All Pearson correlation analyses were performed using SPSS 25.0. Glucose consumption and 2,3-BD production between 0–24 h, 24–48 h, and 48–72 h of strain fermentation were analyzed and visualized by using the Lingbo Microclass online platform. (http://www.cloud.biomicroclass.com/CloudPlatform/SoftPage/GGCOR, accessed on 15 June 2022).

3. Results and Discussion

3.1. Glucose Tolerance of Each Strain

At a low concentration of glucose, the transcription level of the sgrS gene was lower, while that of the ptsG gene was higher [32]. For example, the experiments of these researchers indicated that no sRNA-SgrS was observed in E. coli K-12, DH5α, and IT1508 in a 10 g/L glucose environment [33,34,35]. This part was to confirm whether sRNA-SgrS can act as a sugar transport factor to help cells adjust sugar tolerance in the face of different high concentrations of sugar stress. The critical concentration of the sgrS gene deletion strains for different carbohydrates was 62.5 g/L arabinose and xylose, 125 g/L fructose, 200 g/L trehalose, 225 g/L mannose, and galactose; those for the sgrS gene overexpressed strains were 75 g/L arabinose and xylose, 150 g/L fructose, and 250 g/L mannose, and galactose and trehalose (Figure S1). After knocking out the ack, ldh, and sgrS genes, the tolerance of the strains to glucose decreased by 30% (Figure 3). The tolerance of the sgrS-overexpressing strain to sugar was higher than that of the wildtype strain and gene knockout strain. It can be concluded that sRNA-SgrS can regulate the entry into and exit from cells of various carbohydrates and enhance the tolerance of bacteria to carbohydrates. Negrete et al. showed that E. coli B (BL21) tolerates high glucose concentrations not only through its more efficient central carbon metabolism but also by controlling sRNA-SgrS-regulated glucose transport into cells [32]. Wadler and Vanderpool also that the expression of sgrS allows E. coli to recover from glucose-phosphate stress upon the intracellular accumulation of nonmetabolized sugars [36]. Thus, the conclusions of all studies are consistent.

3.2. The Fermentation Results

The fermentation kinetics of K. pneumoniae HD79 series strains and K. pneumoniae HD79-02 series strains are shown in Figure 4a,b. The cell density of the original and knockout strains increased only slightly during the experiment. The culture density of the sgrS-overexpressed strain did not increase during the entire study period (Figure 4b), which may be one of the reasons why its 2,3-BD yield was lower than the original strain and the knockout strain. At a glucose concentration of 200 g/L, the glucose consumption rates of the control, sgrS knockout, and overexpression strains were similar regardless of the presence of the ldh and ack genes (Figure 4c). However, the overexpressed strain used the least amount of glucose. The theoretical yield of BD is 0.5 g/g glucose consumed. The reported yield in this study is around 0.2 to 0.25 g/g glucose at the highest level. This suggests that a significant amount of glucose is diverted to other products. Even when the K. pneumoniae HD79 strain knocked out ack and ldh, a drop in pH to about 4.5 indicated the production of other acids. After 72 h, the production of 2,3-BD might be inhibited by the production of other acids. Therefore, the 2,3-BD production in this study did not increase after reaching the peak at 72 h (Figure 4d). After the knockout of the sgrS gene, the production of 2,3-BD did not change significantly; after the overexpression of the sgrS gene, the production of 2,3-BD decreased significantly. The transformation rate of the strain after knocking out the sgrS gene was no different from that of the original strain, and the transformation rate of the strain after overexpressing the sgrS gene was much lower than that of the knock-out strain and the original strains. Therefore, the ability of the sgrS overexpression strain to consume glucose and produce 2,3-BD was significantly lower than that of other strains.
At higher initial sugar concentrations, the cellular utilization of D-xylose, L-arabinose, D-galactose, D-mannose, and D-cellobiose decreased and reduced the production of butanediol [37]. In turn, G-6-P activates sRNA-SgrS as a sugar transport regulator to coordinate intracellular glucose content, thereby affecting 2,3-BD production. The expression of the sgrS gene was upregulated, the content of glucose that could be transported into cells was downregulated, and the production of 2,3-BD produced by bacterial metabolism was also downregulated.
In addition, after knocking out the ack and ldh genes, the production of 2,3-BD was upregulated, indicating that the ack and ldh genes can affect the production of 2,3-BD. In our previous study, K pneumoniae HD79 ldhA and ack knockout strain eliminated acid by-products and significantly increased the yield of 2,3-BD [38]. Guo et al. demonstrated that the double mutant strain with deletion of adhE and ldhA resulted in accelerated fermentation and higher 2,3-BD production [39]. Jung et al. showed that the ldh gene was deleted in Enterobacter aerogenes achieving a 2,3-BD concentration of 118 g/L by fed-batch fermentation when glucose was the carbon source [40]. Nguyen et al. showed that knockout of the ldh, ack, and mdh genes in Mycobacterium chlorophila 20Z resulted in a further increase in the 2,3-BD concentration from 35.66 mg/L to 68.8 mg/L [41]. The pH value of HD79-02 series strains decreased during fermentation compared with the initial pH value, indicating that acid was produced during fermentation. Although this reduction was not as dramatic as in the HD79 series strain, it still indicated that acid was produced. It is very important to show the acetic acid and lactic acid profiles of the strain. After the gene encoding acetate kinase (Ack) and lactate dehydrogenase (Ldh) was knocked out, the metabolic pathway of glucose to produce acetate and lactate was blocked, which weakened the acid-producing ability of the strain. Glucose flowed to other pathways, increasing the production of 2,3-BD.

3.3. Analysis of Differentially Expressed Genes

This section further explores the regulatory mechanism of the sgrS gene on 2,3-BD biosynthesis at the gene transcription level. After knocking out the sgrS gene, the sgrS transcription level in the strain was significantly reduced; after the sgrS gene was overexpressed, the sgrS transcription level in the strain was significantly increased, and the difference was significant (p < 0.01). Compared with the original strain, the former was approximately 50% of the original strain, while the latter was approximately 2.5 times that of the original strain (Figure 5a–c). Under the condition of knocking out the ack and ldh genes, after knocking out the sgrS gene, the expression of the sgrS gene was downregulated by 58.5%, and after the overexpression of the sgrS gene, the expression of sgrS was upregulated by 163%. The expression level of sgrS in the strains that only knocked out the ack and ldh genes was much lower than that of the strains that only overexpressed or knocked out the sgrS gene (p < 0.01). Therefore, combined with the 2,3-BD production results of each strain, this result can better explain why sRNA-SgrS can regulate the entry and exit of sugars into and out of cells. The transport of internal sugars to the outside world reduces the intracellular glucose content and the product yield. Negrete et al. also conducted similar experiments and demonstrated that overexpression of sgrS enabled E. coli B (BL21) to reduce its acetate excretion by controlling the glucose transport [20].
After the knockout of sgrS, the expression of ptsG was significantly increased by 58%; after the overexpression of sgrS, the expression of ptsG was significantly decreased by 57%. The results demonstrated that the main regulatory target of sRNA-SgrS is the ptsG gene responsible for the intracellular transport of glucose. By negatively regulating it post-transcriptionally, the transporter encoded by the intracellular the ptsG gene is reduced, thereby reducing the uptake of glucose. Vanderpool and Gottesman showed that the overexpression of the sgrS gene directly promoted the degradation of ptsG mRNA during phosphate stress when glucose was the only carbon source [27]. Kimata et al. also found that when E. coli K-12 strains were grown in the presence of the nonmetabolized sugar α-methyl glucoside, sgrS transcript levels were increased, while ptsG mRNA was decreased [42]. Richards et al. demonstrated that SgrS helps to restore growth in part by inhibiting translation of the ptsG mRNA, which encodes the major glucose transporter EIICBGlc [43].
In K. pneumoniae HD79, K. pneumoniae HD79-O, and K. pneumoniae HD79-K, knocking out the sgrS gene downregulated the expression of the manXYZ and ack genes, while the overexpression of the sgrS gene upregulated the expression of the manXYZ and ack genes. This result did not occur for the K. pneumoniae HD79-02 series strains. In K. pneumoniae HD79-02, K. pneumoniae HD79-02-O, and K. pneumoniae HD79-02-K, after the knockout of the sgrS gene, the expression of the yigL gene was downregulated, and after the overexpression of the sgrS gene, the expression of the yigL gene was upregulated. This phenomenon did not appear in the K. pneumoniae HD79 series strains. At 48 h, the ldh gene expression was upregulated after the sgrS knockout and downregulated after the sgrS overexpression. Rice and Vanderpool noted that the regulation of manX by SgrS is not as conserved as that of ptsG and that in some gut bacterial species, the major source of stress-causing sugar phosphates is PtsG, not ManXYZ [44]. sRNA-SgrS regulates different target genes under different substrate conditions [29]. ptsG mRNA and yigL mRNA are predominantly regulated by the exposure of cells to low concentrations of carbohydrates, and manXYZ mRNA and ptsG mRNA are predominantly regulated by the exposure of cells to 2-deoxyglucose stress [29].
As shown in Figure 5d–i, the sgrS gene indirectly affects the transcription levels of budABC genes. To explore the relationship between genes and glucose concentration and 2,3-BD concentration, we analyzed the correlation between gene expression, glucose metabolism, and 2,3-BD production. Different genes have various responsibilities and jointly participate in and regulate the production of 2,3-BD (Figure 6). It can be seen from Figure 6 that in this experiment, manXYZ was positively correlated with ldh (p < 0.01), yigL was positively correlated with ack (p < 0.05), ack was positively correlated with budA (p < 0.01), and ldh was positively correlated with budC (p < 0.05). Moons et al. showed that the deletion of the budR reduced the transcriptional levels of ack [45]. Wei et al. demonstrated that K. pneumoniae with the budA knockout produced almost no 2,3-BD and lower levels of organic acids [46].
The expression of the ptsG gene was significantly correlated with the glucose concentration (p < 0.01), and the ptsG gene was significantly correlated with the 2,3-BD concentration (p < 0.05). Therefore, ptsG can regulate glucose consumption and 2,3-BD production after transcription. In addition, the ptsG gene and the sgrS gene were negatively correlated (p < 0.01), indicating that the sgrS gene could regulate glucose concentration and 2,3-BD production by negatively regulating ptsG mRNA. This is consistent with the results above and with the results of Sun and Vanderpool. Under high stress, ptsG is mainly regulated, but not yigL and manXYZ [29]. The budABC genes were significantly correlated with the 2,3-BD concentration (p < 0.01); the sgrS gene repressed the transcription level of budABC genes (Figure 5d–i). Therefore, the sgrS gene affects the production of 2,3-BD by changing the expression level of the budABC genes.
In general, sRNA-SgrS is required for the cellular stress response to nonmetabolizable phosphoglucose molecules. In the presence of sugar stress, overexpression of the sgrS gene reduced the uptake of sugar by the bacteria, resulting in a decrease in the transcription level of the ptsG gene. This reduces the intracellular sugar stress, which weakens the ability of the strain to consume and utilize the substrate glucose (decreased transcript level of budABC genes), which ultimately leads to the reduction of 2,3-BD production by overexpressing the sgrS gene. Ultimately, the overexpression of the sgrS gene reduces the production of 2,3-BD. However, there was no significant effect on the transcription levels of byproducts in the metabolic process, such as the acetate kinase gene (ack) and the lactate dehydrogenase gene (ldh).

3.4. Effects of sRNA-SgrS on Carbon Metabolic Flux

As shown in Figure 7a, among all strains, K. pneumoniae HD79-O had the smallest glucose consumption, the largest sRNA-SgrS content, the smallest relative expression levels of the ptsG gene and budABC genes, and the lowest 2,3-BD production. The same was true for the overexpressing strains in the K. pneumoniae HD79-02 series (Figure 7b). Consistent with Vanderpool and Gottesman, we conclude that under the conditions of glucose phosphate accumulation, the synthesis of SgrS leads to the degradation of ptsG mRNA, resulting in reduced production of the glucose transport machinery, thereby limiting the further accumulation of glucose phosphate [27]. Accordingly, the production of 2,3-BD will be downregulated, and the expression levels of budABC genes will be downregulated. Not only our results, Chou et al. aimed to improve cellular glucose uptake and reduce acetate excretion [47]. They minimized acetate excretion by knocking out the ptsG gene to reduce glucose uptake, thereby reducing the metabolic flux allocated to glycolysis [47].
The biosynthetic pathways of 2,3-BD, lactic acid, and acetate are the major consumption pathways of NADH in K. pneumoniae. Therefore, if the biosynthetic pathway of 2,3-BD is blocked, the distribution of carbon is naturally redirected to other pathways. Kim et al. increased carbon flux in 2,3-BD by knocking out ldhA and overexpressing budA and budB [48]. The K. pneumoniae HD79 and K. pneumoniae HD79-02 strains consumed similar concentrations of glucose, but the K. pneumoniae HD79-02 strain knocked out ack and ldh, resulting in a much larger expression of 2,3-BD-producing key enzyme genes (budABC) than the K. pneumoniae HD79 strain (Figure 7c). Therefore, the 2,3-BD production of K. pneumoniae HD79 was less than that of K. pneumoniae HD79-02. The knockout of ack and ldh significantly blocked the pathways of intracellular acetate and lactate production and altered the intracellular state. Compared with the original strain, the carbon flux from glucose to 2,3-BD increased by 31% in strains with ack and ldh genes knocked out and by 36% in strains lacking ack, ldh, and sgrS genes. Therefore, under the knockout of ack and ldh genes, the control of SgrS is of great significance in regard to increasing the production of 2,3-BD.

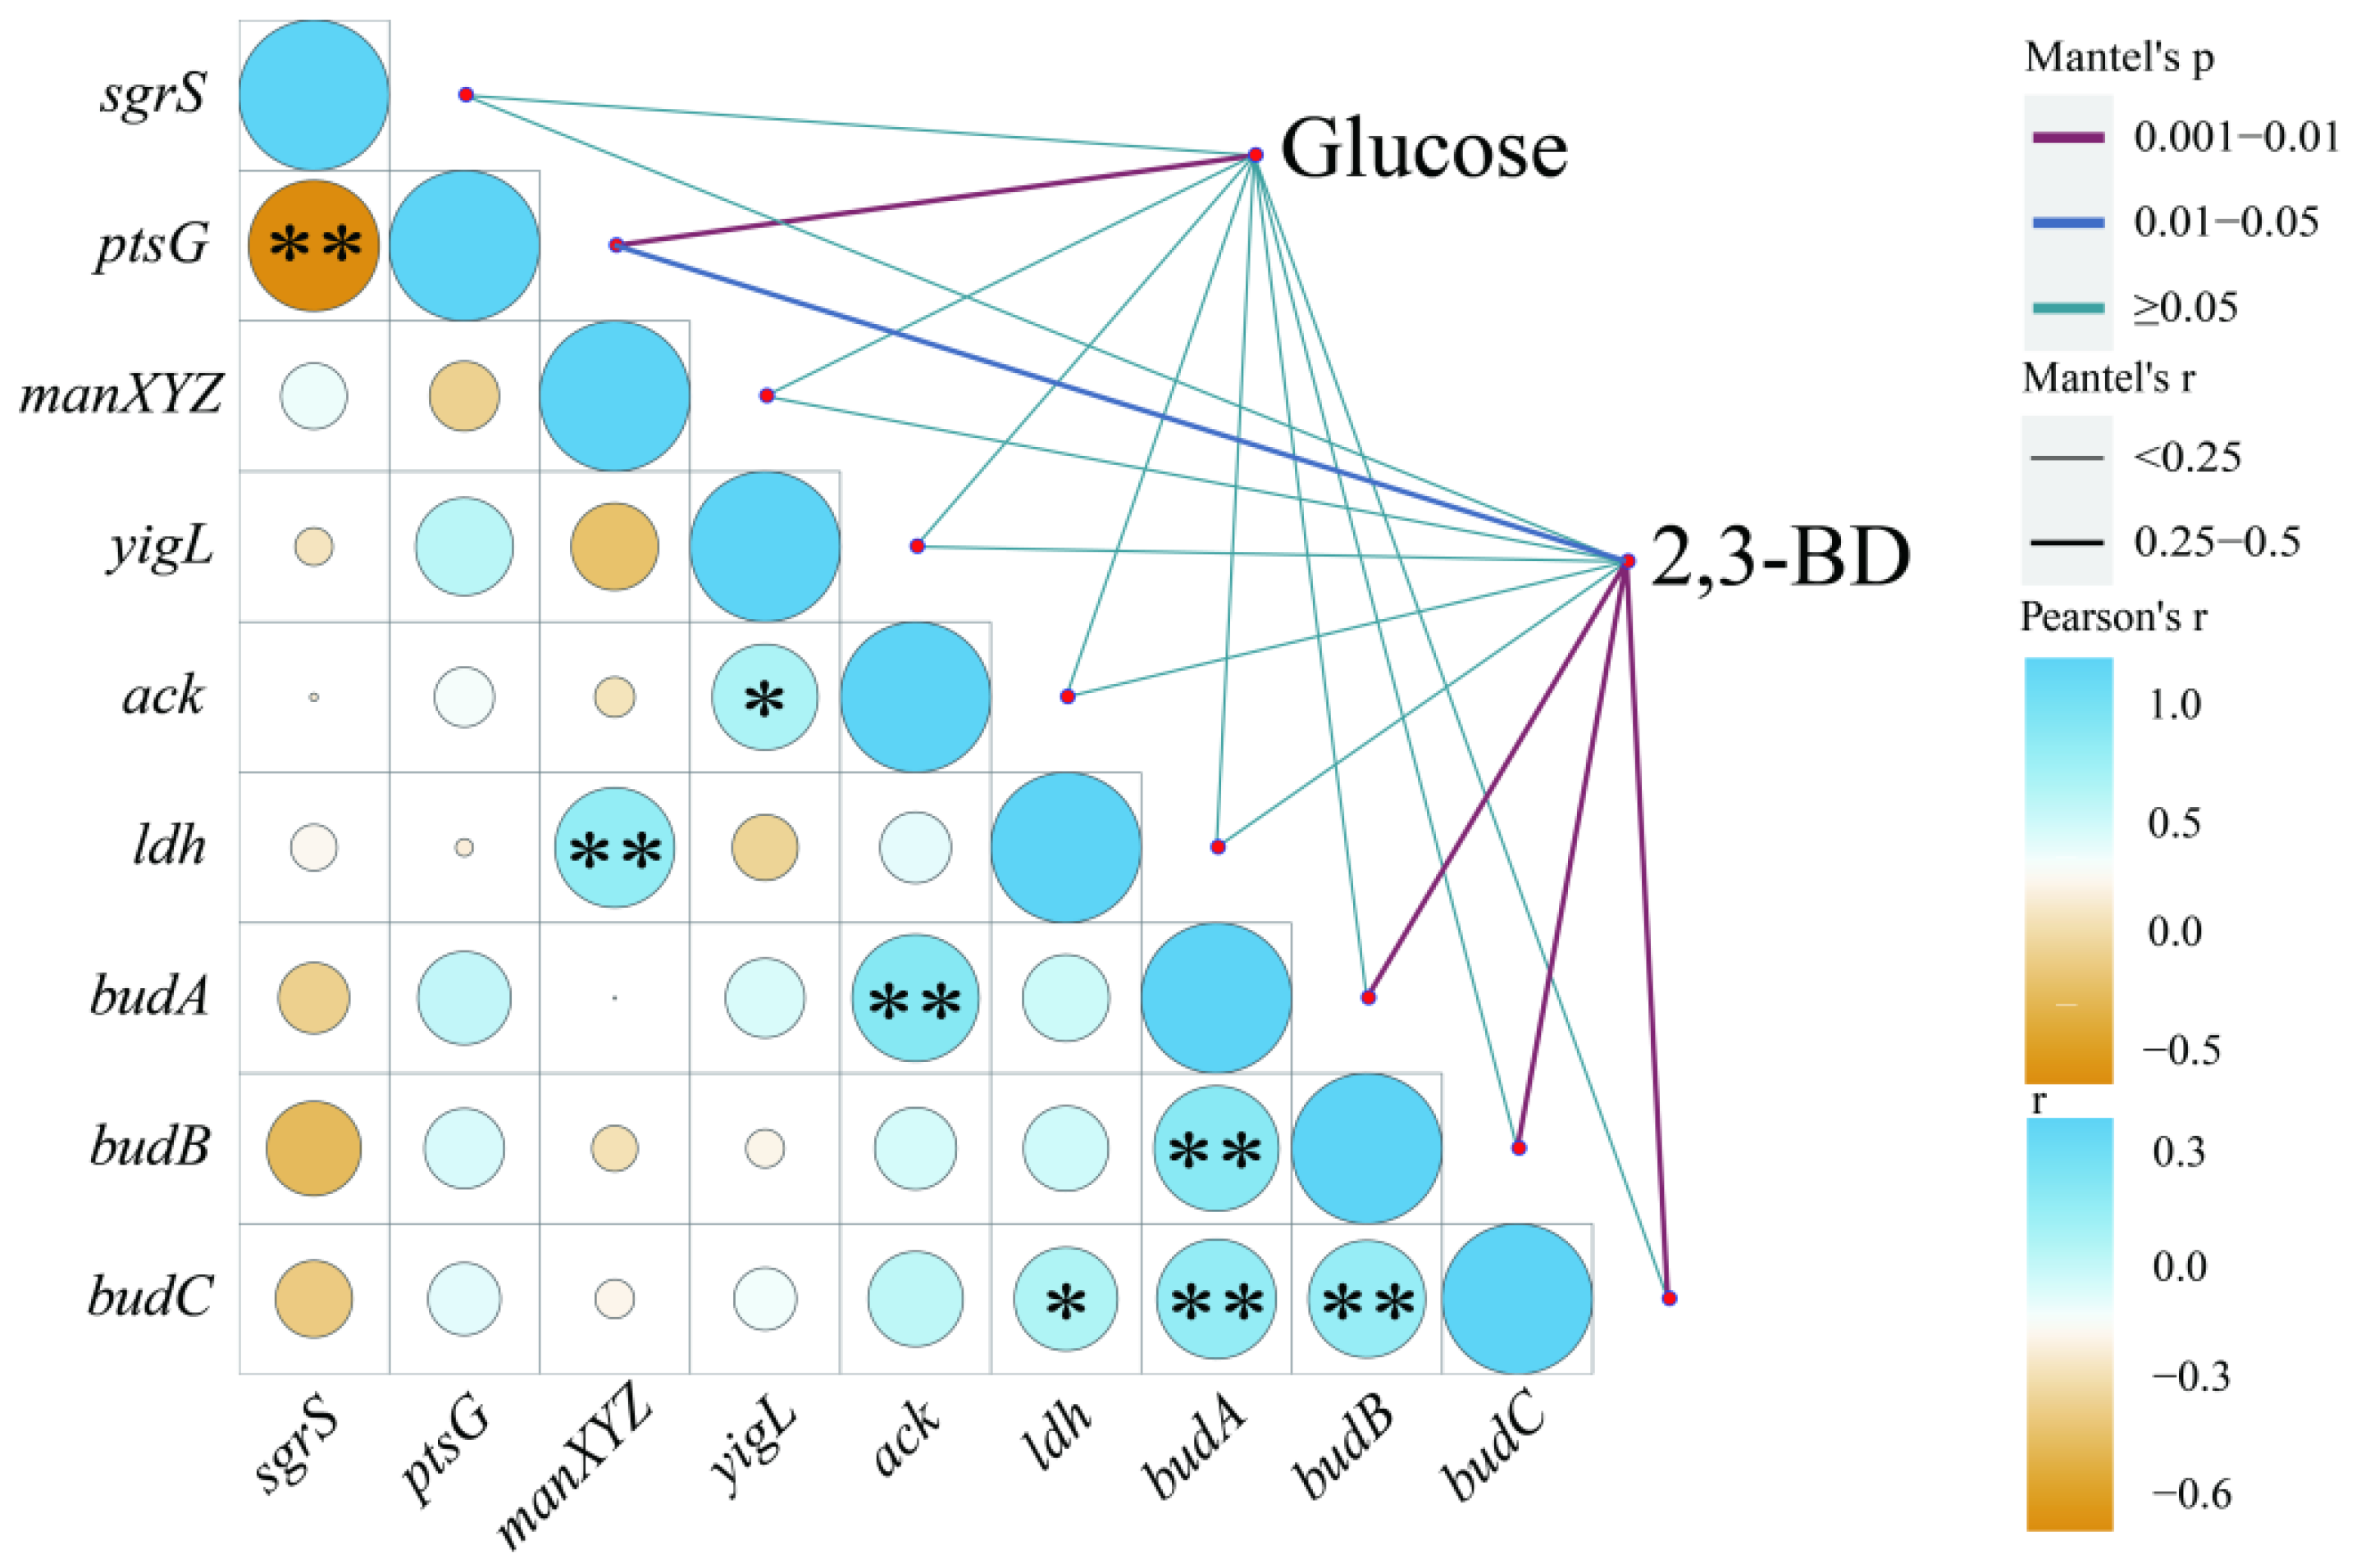
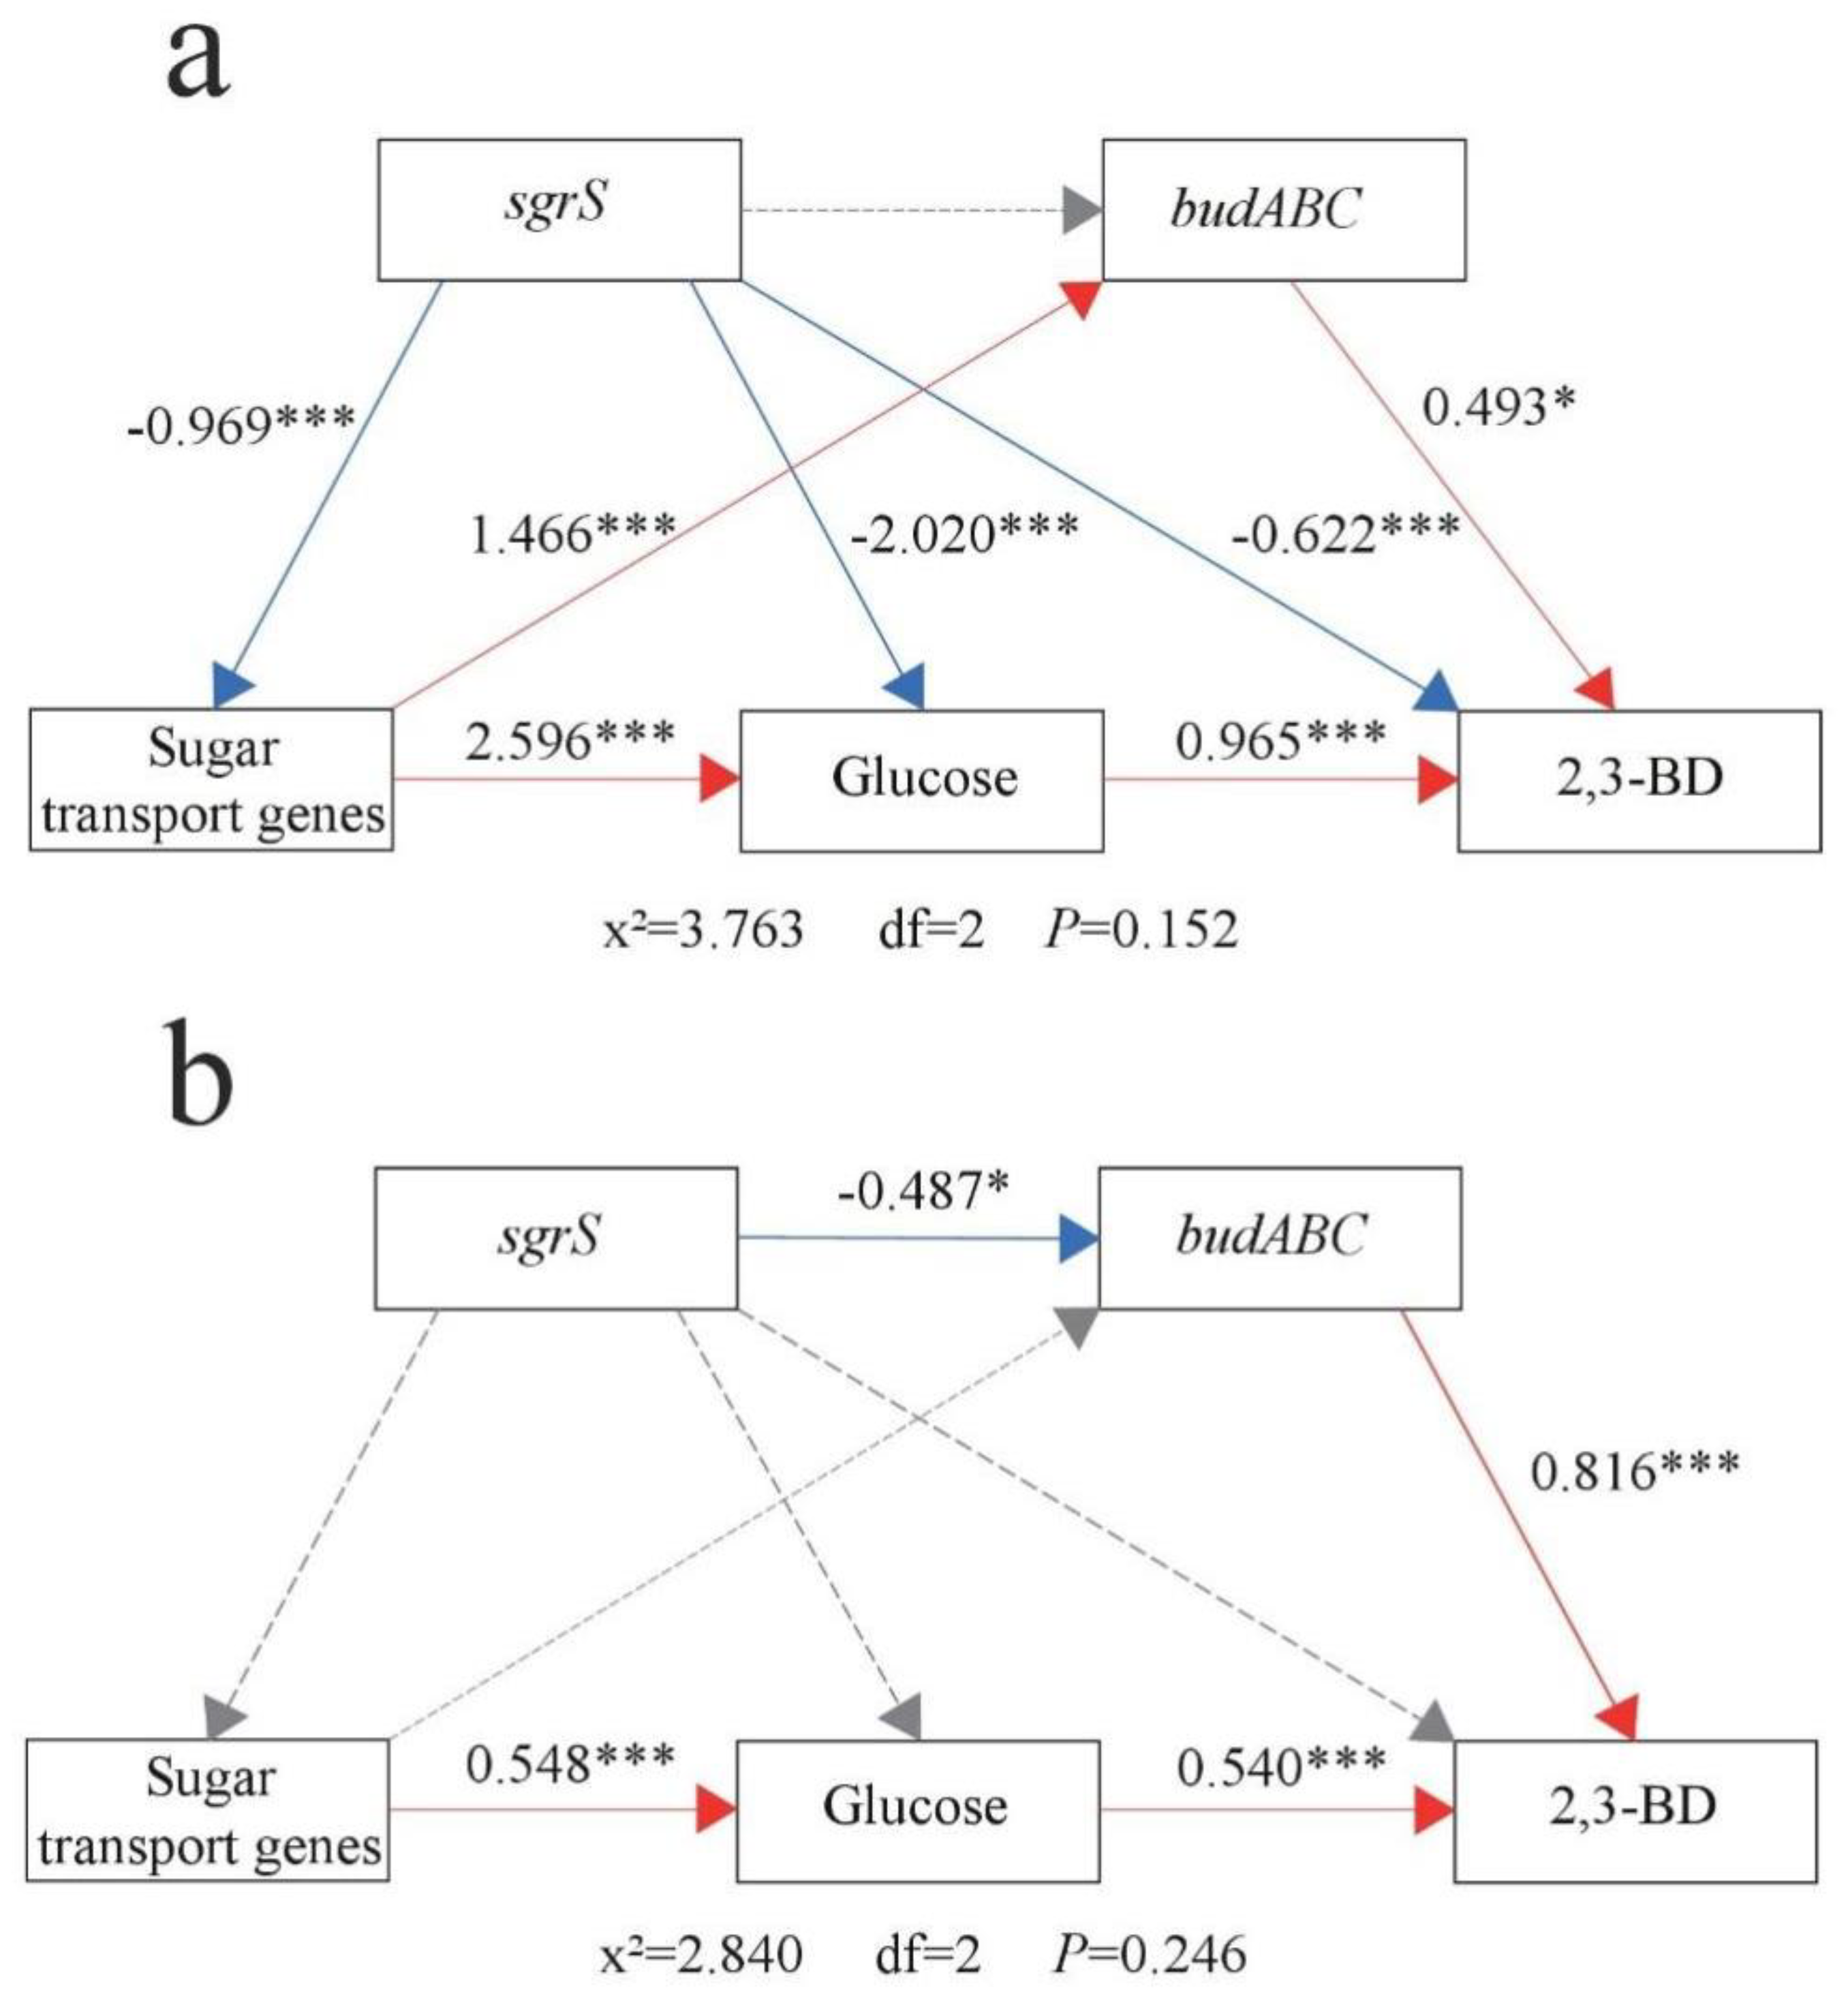
3.5. Relationship of sgrS, Sugar Transport Genes (ptsG, manXYZ), and budABC with Glucose Metabolism and 2,3-BD Production

The relative expression of the sgrS gene was significantly negatively correlated with the relative expression of sugar transport genes, glucose metabolism, and 2,3-BD production capacity but had no significant relationship with the relative expression of budABC genes (Figure 8a). This result suggests that the sgrS gene mainly negatively regulates sugar transport genes to affect the amount of glucose uptake by cells. In addition, 2,3-BD production and sugar transport genes were significantly positively correlated with metabolic glucose and the expression levels of budABC genes. Therefore, sugar transport genes positively regulate glucose metabolism, and budABC genes positively regulate 2,3-BD production. It is currently known that in bacteria, SgrS negatively regulates two target mRNAs, ptsG and manXYZ encoding EIICBGlc and EIIMan carriers, respectively. In fact, sgrS regulates the cellular utilization of various carbon sources, such as glucose, mannose, and fructose, by activating the expression of these two genes. The elimination of ptsG transcripts would halt the new synthesis of EIICBGlc, further reducing the transport and phosphorylation of glucose [19]. Therefore, although sgrS cannot directly regulate the genes involved in the synthesis of 2,3-BD, it can indirectly affect 2,3-BD production.
After knocking out ack and ldh, the sgrS gene only played a negative regulatory role on the budABC genes and had no significant relationship with the relative expression of sugar transport genes, glucose metabolism, or 2,3-BD production. 2,3-BD production and sugar transport genes were still significantly positively correlated with glucose metabolism and the expression levels of budABC genes (Figure 8b). Therefore, the ack and ldh genes affect the regulation of intracellular glucose content by sgrS on sugar transport genes. However, it is unclear whether this effect exists and what its mechanism of action is, and further characterization is needed.

4. Conclusions

To develop the economic industry of biorefineries, the efficient utilization of biomass is necessary. In this study, we knocked out or overexpressed the sgrS gene, which encodes the sugar transport regulator sRNA-SgrS, and observed how K. pneumoniae increased the production of 2,3-BD in the presence of high-concentration sugar fermentation. To effectively utilize the high substrate concentration of glucose, after overexpression of the sgrS gene, the transcription level of the ptsG gene decreased, and the content of glucose ingested by mutants was downregulated. This enhanced the tolerance of bacteria to sugar and indirectly inhibited the transcription level of budABC genes, resulting in the downregulation of 2,3-BD production. We also found that the knockout of ack and ldh reduced the carbon flux allocated to the acetate and lactate metabolic pathways and increased the carbon flux of the 2,3-BD metabolic pathway, further increasing the production of 2,3-BD. The transformation of K. pneumoniae utilizing genetic engineering provides a scientific basis for how to effectively utilize carbohydrates for the purpose of increasing the production of 2,3-BD.

Supplementary Materials

The following supporting information can be downloaded at: https://www.mdpi.com/article/10.3390/fermentation8080359/s1, Figure S1: Sugar tolerance of K. pneumoniae HD79 series strains and K. pneumoniae HD79-02 series strains.

Author Contributions

R.S.: Methodology, Data curation, Writing—original draft, Writing—review & editing. J.K.: Formal analysis. X.W.: Investigation. B.X.: Validation. W.P.: Conceptualization, Supervision. J.G.: Resources, Supervision. All authors have read and agreed to the published version of the manuscript.

Funding

This study was financially supported by the Key Program of Natural Science Foundation of Heilongjiang Province, China [ZD2020C008] and National Natural Science Foundation of China [No. 32071519].

Data Availability Statement

The data presented in this study are available on request from the corresponding author.

Conflicts of Interest

The authors declare no conflict of interest.

References

  1. Garg, S.K.; Jain, A. Fermentative production of 2,3-butanediol: A review. Bioresour. Technol. 1995, 51, 103–109. [Google Scholar] [CrossRef]
  2. Tran, A.V.; Chambers, R.P. The dehydration of fermentative 2,3-butanediol into methyl ethyl ketone. Biotechnol. Bioeng. 1987, 29, 343–351. [Google Scholar] [CrossRef] [PubMed]
  3. Long, S.K.; Patrick, R. Production of 2,3-Butylene Glycol from Citrus Wastes: I. The Aerobacter aerogenes Fermentation. Appl. Microbiol. 1961, 9, 244–248. [Google Scholar] [CrossRef]
  4. Sun, J.A.; Zhang, L.Y.; Rao, B.; Shen, L.Y.; Wei, Z.D. Enhanced acetoin production by Serratia marcescens H32 with expression of a water forming NADH oxidase. Bioresour. Technol. 2012, 119, 94–98. [Google Scholar] [CrossRef] [PubMed]
  5. Liu, Z.; Qin, J.; Gao, C.; Hua, D.L.; Ma, C.Q.; Li, L.X.; Wang, Y.; Xu, P. Production of (2S, 3S)-2,3-butanediol and (3S)-acetoin from glucose using resting cells of Klebsiella pneumonia and Bacillus subtilis. Bioresour. Technol. 2011, 102, 10741–10744. [Google Scholar] [CrossRef]
  6. Ji, X.J.; Xia, Z.F.; Fu, N.H.; Nie, Z.K.; Shen, M.Q.; Tian, Q.Q.; Huang, H. Cofactor engineering through heterologous expression of an NADH oxidase and its impact on metabolic flux redistribution in Klebsiella pneumoniae. Biotechnol. Biofuels 2013, 6, 1–9. [Google Scholar] [CrossRef] [Green Version]
  7. Ji, X.J.; Huang, H.; Ouyang, P.K. Microbial 2,3-butanediol production: A state-of-the-art review. Biotechnol. Adv. 2011, 29, 351–364. [Google Scholar] [CrossRef] [PubMed]
  8. Qureshi, N.; Cheryan, M. Production of 2,3-butanediol by Klebsiella oxytoca. Appl. Microbiol. Biotechnol. 1989, 30, 440–443. [Google Scholar] [CrossRef]
  9. Celińska, E.; Grajek, W. Biotechnological production of 2,3-butanediol—current state and prospects. Biotechnol. Adv. 2009, 27, 715–725. [Google Scholar] [CrossRef] [PubMed]
  10. Syu, M.J. Biological production of 2,3-butanediol. Appl. Microbiol. Biotechnol. 2001, 55, 10–18. [Google Scholar] [CrossRef] [PubMed]
  11. Ji, X.J.; Huang, H.; Du, J.; Zhu, J.G.; Ren, L.J.; Hu, N.; Li, S. Enhanced 2,3-butanediol production by Klebsiella oxytoca using a two-stage agitation speed control strategy. Bioresour. Technol. 2009, 100, 3410–3414. [Google Scholar] [CrossRef] [PubMed]
  12. Ng, C.Y.; Jung, M.; Lee, J.; Oh, M.K. Production of 2,3-butanediol in Saccharomyces cerevisiae by in silico aided metabolic engineering. Microb. Cell Factories 2012, 11, 1–14. [Google Scholar] [CrossRef] [PubMed] [Green Version]
  13. Zhang, C.; Zhou, X.; Tong, T.; Ge, J. Acetic acid acting as a signaling molecule in the quorum sensing system increases 2,3-butanediol production in Saccharomyces cerevisiae. Prep. Biochem. Biotechnol. 2021, 52, 487–497. [Google Scholar] [CrossRef]
  14. Cho, S.; Kim, T.; Woo, H.M.; Lee, J.; Kim, Y.; Um, Y. Enhanced 2,3-butanediol production by optimizing fermentation conditions and engineering Klebsiella oxytoca M1 through overexpression of acetoin reductase. PLoS ONE. 2015, 10, e0138109. [Google Scholar] [CrossRef] [Green Version]
  15. Ji, X.J.; Huang, H.; Li, S.; Du, J.; Lian, M. Enhanced 2,3-butanediol production by altering the mixed acid fermentation pathway in Klebsiella oxytoca. Biotechnol. Lett. 2008, 30, 731–734. [Google Scholar] [CrossRef] [PubMed]
  16. Jansen, N.B.; Tsao, G.T. Bioconversion of pentoses to 2,3-butanediol by Klebsiella pneumoniae. Pentoses Lignin 1983, 27, 85–99. [Google Scholar] [CrossRef]
  17. Kosfeld, A.; Jahreis, K. Characterization of the interaction between the small regulatory peptide SgrT and the EIICBGlc of the glucose-phosphotransferase system of E. coli K-12. Metabolites 2012, 2, 756–774. [Google Scholar] [CrossRef] [Green Version]
  18. Raina, M.; Storz, G. SgrT, a small protein that packs a sweet punch. J. Bacteriol. 2017, 199, e00130-17. [Google Scholar] [CrossRef] [Green Version]
  19. Lloyd, C.R.; Park, S.; Fei, J.; Vanderpool, C.K. The small protein SgrT controls transport activity of the glucose-specific phosphotransferase system. J. Bacteriol. 2017, 199, e00869-16. [Google Scholar] [CrossRef] [PubMed] [Green Version]
  20. Negrete, A.; Majdalani, N.; Phue, J.N.; Shiloach, J. Reducing acetate excretion from E. coli K-12 by over-expressing the small RNA SgrS. New Biotechnol. 2013, 30, 269–273. [Google Scholar] [CrossRef] [PubMed] [Green Version]
  21. Wassarman, K.M.; Zhang, A.; Storz, G. Small RNAs in Escherichia coli. Trends Microbiol. 1999, 7, 37–45. [Google Scholar] [CrossRef]
  22. Vanderpool, C.K.; Balasubramanian, D.; Lloyd, C.R. Dual-function RNA regulators in bacteria. Biochimie 2011, 93, 1943–1949. [Google Scholar] [CrossRef] [PubMed] [Green Version]
  23. Richards, G.R.; Patel, M.V.; Lloyd, C.R.; Vanderpool, C.K. Depletion of glycolytic intermediates plays a key role in glucose-phosphate stress in Escherichia coli. J. Bacteriol. 2013, 195, 4816–4825. [Google Scholar] [CrossRef] [PubMed] [Green Version]
  24. Bobrovskyy, M.; Vanderpool, C.K. Diverse mechanisms of post-transcriptional repression by the small RNA regulator of glucose-phosphate stress. Mol. Microbiol. 2016, 99, 254–273. [Google Scholar] [CrossRef] [PubMed] [Green Version]
  25. Zhang, A.; Wassarman, K.M.; Rosenow, C.; Tjaden, B.C.; Storz, G.; Gottesman, S. Global analysis of small RNA and mRNA targets of Hfq. Mol. Microbiol. 2003, 50, 1111–1124. [Google Scholar] [CrossRef] [Green Version]
  26. Bobrovskyy, M.; Vanderpool, C.K. The small RNA SgrS: Roles in metabolism and pathogenesis of enteric bacteria. Front. Cell. Infect. Microbiol. 2014, 4, 61. [Google Scholar] [CrossRef] [PubMed] [Green Version]
  27. Vanderpool, C.K.; Gottesman, S. Involvement of a novel transcriptional activator and small RNA in post-transcriptional regulation of the glucose phosphoenolpyruvate phosphotransferase system. Mol. Microbiol. 2004, 54, 1076–1089. [Google Scholar] [CrossRef] [PubMed]
  28. Balasubramanian, D.; Vanderpool, C.K. New developments in post-transcriptional regulation of operons by small RNAs. RNA Biol. 2013, 10, 337–341. [Google Scholar] [CrossRef] [PubMed] [Green Version]
  29. Sun, Y.; Vanderpool, C.K. Physiological consequences of multiple-target regulation by the small RNA SgrS in Escherichia coli. J. Bacteriol. 2013, 195, 4804–4815. [Google Scholar] [CrossRef] [PubMed] [Green Version]
  30. Vanderpool, C.K. Physiological consequences of small RNA-mediated regulation of glucose-phosphate stress. Curr. Opin. Microbiol. 2007, 10, 146–151. [Google Scholar] [CrossRef] [PubMed]
  31. Papenfort, K.; Podkaminski, D.; Hinton, J.C.D.; Vogel, J. The ancestral SgrS RNA discriminates horizontally acquired Salmonella mRNAs through a single GU wobble pair. Proc. Natl. Acad. Sci. USA 2012, 109, 757–764. [Google Scholar] [CrossRef] [PubMed] [Green Version]
  32. Negrete, A.; Ng, W.I.; Shiloach, J. Glucose uptake regulation in E. coli by the small RNA SgrS: Comparative analysis of E. coli K-12 (JM109 and MG1655) and E. coli B (BL21). Microb. Cell Factories 2010, 9, 1–9. [Google Scholar] [CrossRef] [Green Version]
  33. Wadler, C.S.; Vanderpool, C.K. A dual function for a bacterial small RNA: SgrS performs base pairing-dependent regulation and encodes a functional polypeptide. Proc. Natl. Acad. Sci. USA 2007, 104, 20454–20459. [Google Scholar] [CrossRef] [PubMed] [Green Version]
  34. Kawamoto, H.; Morita, T.; Shimizu, A.; Inada, T.; Aiba, H. Implication of membrane localization of target mRNA in the action of a small RNA: Mechanism of post-transcriptional regulation of glucose transporter in Escherichia coli. Genes Dev. 2005, 19, 328–338. [Google Scholar] [CrossRef] [Green Version]
  35. Morita, T.; Maki, K.; Yagi, M.; Aiba, H. Analyses of mRNA Destabilization and Translational Inhibition Mediated by Hfq-Binding Small RNAs. Methods Enzymol. 2008, 447, 359–378. [Google Scholar] [CrossRef] [PubMed]
  36. Wadler, C.S.; Vanderpool, C.K. Characterization of homologs of the small RNA SgrS reveals diversity in function. Nucleic Acids Res. 2009, 37, 5477–5485. [Google Scholar] [CrossRef] [Green Version]
  37. Yu, E.K.; Saddler, J.N. Fed-batch approach to production of 2,3-butanediol by Klebsiella pneumoniae grown on high substrate concentrations. Appl. Environ. Microbiol. 1983, 46, 630–635. [Google Scholar] [CrossRef] [Green Version]
  38. Ge, J.; Wang, J.; Ye, G.; Sun, S.S.; Guo, R.; Song, G.; Ping, W. Disruption of the lactate dehydrogenase and acetate kinase genes in Klebsiella pneumoniae HD79 to enhance 2,3-butanediol production, and related transcriptomics analysis. Biotechnol. Lett. 2020, 42, 537–549. [Google Scholar] [CrossRef]
  39. Guo, X.; Cao, C.; Wang, Y.; Li, C.; Wu, M.; Chen, Y.; Zhang, C.; Pei, H.; Xiao, D. Effect of the inactivation of lactate dehydrogenase, ethanol dehydrogenase, and phosphotransacetylase on 2,3-butanediol production in Klebsiella pneumoniae strain. Biotechnol. Biofuels 2014, 7, 1–11. [Google Scholar] [CrossRef] [Green Version]
  40. Jung, M.Y.; Ng, C.Y.; Song, H.; Lee, J.; Oh, M.K. Deletion of lactate dehydrogenase in Enterobacter aerogenes to enhance 2,3-butanediol production. Appl. Microbiol. Biotechnol. 2012, 95, 461–469. [Google Scholar] [CrossRef]
  41. Nguyen, A.D.; Hwang, I.Y.; Lee, O.K.; Kim, D.; Kalyuzhnaya, M.G.; Mariyana, R.; Hadiyati, S.; Kim, S.M.; Lee, E.Y. Systematic metabolic engineering of Methylomicrobium alcaliphilum 20Z for 2,3-butanediol production from methane. Metab. Eng. 2018, 47, 323–333. [Google Scholar] [CrossRef] [PubMed]
  42. Kimata, K.; Tanaka, Y.; Inada, T.; Aiba, H. Expression of the glucose transporter gene, ptsG, is regulated at the mRNA degradation step in response to glycolytic flux in Escherichia coli. EMBO J. 2001, 20, 3587–3595. [Google Scholar] [CrossRef] [PubMed] [Green Version]
  43. Richards, G.R.; Vanderpool, C.K. Induction of the Pho regulon suppresses the growth defect of an Escherichia coli sgrS mutant, connecting phosphate metabolism to the glucose-phosphate stress response. J. Bacteriol. 2012, 194, 2520–2530. [Google Scholar] [CrossRef] [PubMed] [Green Version]
  44. Rice, J.B.; Vanderpool, C.K. The small RNA SgrS controls sugar–phosphate accumulation by regulating multiple PTS genes. Nucleic Acids Res. 2011, 39, 3806–3819. [Google Scholar] [CrossRef] [PubMed] [Green Version]
  45. Moons, P.; Van Houdt, R.; Vivijs, B.; Michiels, C.M.; Aertsen, A. Integrated regulation of acetoin fermentation by quorum sensing and pH in Serratia plymuthica RVH1. Appl. Environ. Microbiol. 2011, 77, 3422–3427. [Google Scholar] [CrossRef] [PubMed] [Green Version]
  46. Wei, D.; Xu, J.; Sun, J.; Shi, J.; Hao, J. 2-Ketogluconic acid production by Klebsiella pneumoniae CGMCC 1.6366. J. Ind. Microbiol. Biotechnol. 2013, 40, 561–570. [Google Scholar] [CrossRef] [PubMed]
  47. Chou, C.H.; Bennett, G.N.; San, K.Y. Effect of modified glucose uptake using genetic engineering techniques on high-level recombinant protein production in Escherichia coli dense cultures. Biotechnol. Bioeng. 1994, 44, 952–960. [Google Scholar] [CrossRef] [PubMed]
  48. Kim, B.; Lee, S.; Jeong, D.; Yang, J.; Oh, M.K.; Lee, J. Redistribution of carbon flux toward 2,3-butanediol production in Klebsiella pneumoniae by metabolic engineering. PLoS ONE 2014, 9, e105322. [Google Scholar] [CrossRef] [PubMed]
Figure 1. Carbohydrates in vitro enter cells and become G-6-P through transporters encoded by ptsG and manXYZ. G-6-P stimulates the transcription of SgrR into SgrS. sRNA-SgrS positively regulates yigL mRNA and negatively regulates ptsG mRNA and manXYZ mRNA. Intracellular glucose is used for bacterial fermentation to produce 2,3-BD.
Fermentation 08 00359 g001
Figure 2. Diagram of the process of constructing a recombinant vector. (a) shows the whole strategy of homologus recombination fragment sgrSA1-EGFP-sgrSA2. (b) shows the construction process of recombinant overexpression vector pXL-RFP-sgrS containing target gene sgrS.
Fermentation 08 00359 g002
Figure 3. The growth of each strain on SFM plates containing different sugars and different concentrations. From left to right are trehalose, arabinose, xylose, glucose, mannose, fructose, and galactose. Red rectangles indicate good growth, green rectangles indicate inhibited growth, and yellow rectangles indicate no growth.
Fermentation 08 00359 g003
Figure 4. Fermentation of K. pneumoniae HD79 series strains and K. pneumoniae HD79-02 series strains. Variation curves of pH, OD600nm, glucose residue, and 2,3-BD concentration are shown in (ad), respectively. The pink box represents K. pneumoniae HD79 strain, the pink cycle represents K. pneumoniae HD79-O strain, the pink triangle represents K. pneumoniae HD79-K strain, the blue box represents K. pneumoniae HD79-02 strain, the blue cycle represents K. pneumoniae HD79-02-O strain, and the blue triangle represents K. pneumoniae HD79-02-K strain. The experiments were performed in triplicate, and the error bars represent the standard deviations.
Fermentation 08 00359 g004
Figure 5. Changes of related genes in K. pneumoniae HD79 series strains and K. pneumoniae HD79-02 series strains at 24 h, 48 h, and 72 h of fermentation. (ac) Relative expression levels of sgrS gene in different strains in three time periods; a, b and c on the bar chart are the results obtained by SPSS significance analysis. (df) Relative expression levels of each gene in HD79 series strains in three time periods; (gi) Relative expression levels of each gene in HD79-02 series strains in three time periods.
Fermentation 08 00359 g005
Figure 6. The lower left part of the figure is the heat map of correlation analysis between the relative expression levels of each gene at 24, 48, and 72 h. In this part, blue represents positive correlation and yellow represents negative correlation, * indicates p < 0.05; ** indicates p < 0.01. The upper right corner of the graph shows the correlation between each gene and glucose consumption and the yield of 2,3-BD at 24, 48, and 72 h. In this part, red represents p < 0.01 and blue represents p < 0.05, green represents no correlation.
Fermentation 08 00359 g006
Figure 7. The distribution of carbon metabolism flow of each strain consuming glucose to produce 2,3-BD at 72 h of fermentation. A small cell in a Sankey diagram represents the amount of traffic allocated. The first column on the left describes the carbon flow allocated to each strain to represent glucose utilization, the second column describes the expression level of different genes in each strain, and the third column describes the carbon flow allocated to different strains to redistribute to the pathway producing 2,3-BD. (a) shows the K. pneumoniae HD79 series strains; (b) shows the K. pneumoniae HD79-02 series strains; (c) shows the K. pneumoniae HD79 strain and K. pneumoniae HD79-02 strain.
Fermentation 08 00359 g007
Figure 8. Structural equation models (SEM) showing the direct and indirect effects of the sgrS gene, sugar transport regulatory genes, budABC genes, glucose metabolism, and 2,3-BD production, during fermenting. (a) shows the relationship of indexes in K. pneumoniae HD79 series strains; (b) shows the relationship of indexes in K. pneumoniae HD79-02 series strains. The line outlined in gray indicates no significance (p > 0.05). The solid red line shows a positive association, and the solid blue line shows a negative association (* p < 0.05, *** p < 0.001). Numbers on arrows were standardized pathways coefficients indicating the degree of influence for relationships.
Fermentation 08 00359 g008
Table 1. Strains used in this study.
StrainCharacteristicsSource/Reference
E. coli DH5αAmprLaboratory preservation
E. coli JM110Strr, dam dcm supE44Δ(lac-proAB)Jiangsu Yugong Life
K. pneumoniae HD79Ampr, Original strainLaboratory preservation
K. pneumoniae HD79-OAmpr, Kanr, PT7lacO- sgrS:: RFPMutant from gene disruption; this study
K. pneumoniae HD79-KAmpr, ΔsgrS:: EGFPMutant from gene disruption; this study
K. pneumoniae HD79-02Ampr, Cmr, Kanr, Δldh and ΔackLaboratory preservation
K. pneumoniae HD79-02-OAmpr, Cmr, Kanr, Δldh and Δack and PT7lacO-sgrS:: RFPMutant from gene disruption; this study
K. pneumoniae HD79-02-KAmpr, Cmr, Kanr, Δldh and Δack and ΔsgrS:: EGFPMutant from gene disruption; this study
Publisher’s Note: MDPI stays neutral with regard to jurisdictional claims in published maps and institutional affiliations.

