Article

Evaluating Bio-Hydrogen Production Potential and Energy Conversion Efficiency from Glucose and Xylose under Diverse Concentrations

State Key Laboratory of Urban Water Resource and Environment, School of Environment, Harbin Institute of Technology, Harbin 150090, China
*
Author to whom correspondence should be addressed.
Fermentation 2022, 8(12), 739; https://doi.org/10.3390/fermentation8120739
Submission received: 1 November 2022 / Revised: 10 December 2022 / Accepted: 10 December 2022 / Published: 14 December 2022

Abstract

:
Lignocellulose bioconversion to hydrogen has been proposed as a promising solution to augment the fossil fuel dominated energy market. However, little is known about the effects of the substrate concentration supplied on hydrogen production. Herein, the hydrogen producing bacteria Thermoanaerobacter thermosaccharolyticum W16 feeding with respective glucose, xylose, and glucose and xylose mixture (glucose–xylose) at different concentrations was evaluated, to study whether substrate concentration could impact the lignocellulose bioconversion to hydrogen and the associated kinetics. An average bio-hydrogen yield of 1.40 ± 0.23 mol H2·mol−1 substrate was obtained at an average substrate concentration of 60.89 mM. The maximum bio-hydrogen production rate of 0.25 and 0.24 mol H2·mol−1 substrate h−1 was achieved at a substrate concentration of 27.75 mM glucose and 30.82 mM glucose–xylose, respectively, while the value reached the high point of 0.08 mol H2·mol−1 xylose·h−1 at 66.61 mM xylose. Upon further energy conversion efficiency (ESE) analysis, a substrate of 10 g·L−1 (amounting to 55.51 mM glucose, 66.61 mM xylose or 60.55 mM glucose–xylose) provided the maximum ESE of 15.3 ± 0.3%, which was 15.3% higher than that obtained at a substrate concentration of 5 g·L−1 (amounting to 27.75 mM glucose, 33.30 mM xylose or 30.28 mM glucose–xylose). The findings could be helpful to provide effective support for the future development of efficient and sustainable lignocellulosic bio-hydrogen production.

1. Introduction

Hydrogen (H2) is considered as a sustainable alternative to fossil fuels due to its carbon neutral characteristic during combustion [1,2]. To date, the majority of H2 is produced from fossil fuels via physical or chemical processes, which require significant energy consumption and environmental management input [3,4]. By contrast, biological hydrogen (bio-hydrogen) production presents obvious benefits, such as having no dependence on fossil fuels, being renewable in nature, and being ecofriendly [5,6]. Among all the bio-hydrogen production processes, dark fermentative hydrogen production is considered to be one of the most promising methods for hydrogen production due to its dual effect on waste treatment and clean energy recovery [7,8]. A wide range of feedstocks have been investigated for bio-hydrogen production [9,10]. Lignocellulose is one of the most desirable substrates for bio-hydrogen production, due to its huge yield and difficulty in being processed [11].
Lignocellulose consists of cellulose, hemicellulose, and lignin. Current research has focused on obtaining pentoses and hexoses contained in cellulose and hemicellulose using appropriate pretreatment methods [12,13]. The results showed that the reducing sugars obtained from different straws and different pretreatment methods were generally glucose, xylose, or glucose and xylose mixture (glucose–xylose) in concentrations ranging from 5 to 30 g·L−1 [14,15,16]. Examples regarding the hydrogen yield from different sugar concentrations and glucose/xylose ratios are shown in Table 1. Thus, the hydrogen yield is determined by the glucose and xylose consumption capacity of the hydrogen producing biocatalysts. For example, a hydrogen yield of 3.1 mol H2·mol−1 substrate was obtained by Clostridium butyricum at 55.51 mM glucose [17]. Microorganisms of this genus have also been found to use xylose for hydrogen production; a hydrogen production rate of 0.76 mol H2·mol−1 substrate was obtained by Clostridium butyricum CGS5 from the rice straw hydrolysate with a xylose concentration of 61.28 mM [18]. Reference [19] found a coculture of C. thermocellum could achieve 0.85 mol H2·mol−1 substrate from sugarcane bagasse hydrolysate (69.38 mM glucose and 25.31 mM xylose). When the cornstalk hydrolysate concentration was increased to 20 g·L−1 (84.37 mM glucose and 31.97 mM xylose), the strain Clostridium sp. T2 could accomplished a hydrogen production rate of 1.70 mol H2·mol−1 substrate [20]. Additionally, [21] used corn stover hydrolysate (11.66 mM glucose and 6.66 mM xylose) as substrate and obtained the maximum cumulative hydrogen yield of 0.27 mol H2·mol−1 substrate by dark fermentative bacteria Enterobacter aerogenes. In view of the above studies, the gap to be addressed is evaluating the bio-hydrogen production potential from different reducing sugar concentrations, which is crucial for both efficient lignocellulosic biomass conversion to bio-hydrogen, and minimizing of the consideration of sugar concentration during lignocellulose pretreatment [10,22,23].
Our previous work on bio-hydrogen production from lignocellulose has resulted in the isolation of a glucose and xylose co-fermentation bacterium Thermoanaerobacter thermosaccharolyticum W16, making it a suitable candidate for bio-hydrogen production from lignocellulose hydrolysate [25]. Therefore, this study determined the hydrogen production potential of Thermoanaerobacter thermosaccharolyticum W16 at different concentrations of glucose, xylose, and glucose–xylose, respectively. Moreover, the kinetic analysis of hydrogen production under different conditions was also provided. The results obtained in this study will help to predict the bio-hydrogen production potential from lignocellulose hydrolysates of different origins, and will also give feedback on the choice of lignocellulose pretreatment methods.

2. Materials and Methods

2.1. Microorganism and Medium

The thermophilic hydrogen producing bacteria T. thermosaccharolyticum W16 used in this study was isolated by Ren et al. [25]. T. thermosaccharolyticum W16 was routinely grown at 60 °C in the medium containing: 1.0 g·L−1 K2HPO4, 1.0 g·L−1 KH2PO4, 1.0 g·L−1 NaCl, 0.2 g·L−1 KCl, 0.5 g·L−1 MgCl2·6H2O, 1.0 g·L−1 NH4Cl, 2.0 g·L−1 yeast extract, 2.0 g·L−1 peptone, 0.5 g·L−1 cysteine, 10 g·L−1 glucose, 1.0 mL·L−1 vitamin solution, 1.0 mL·L−1 trace element solution [25]. The strain at its exponential growth phase was prepared as the inoculum.

2.2. Bio-Hydrogen Potential Tests

A suite of 100 mL serum bottles with 48 mL aforementioned culture medium containing inorganic salts in addition to the carbon source was prepared. Glucose, xylose, and glucose–xylose (50% glucose and 50% xylose) at concentrations of 5 g·L−1, 10 g·L−1, 15 g·L−1, 20 g·L−1, and 25 g·L−1 were dispensed into serum bottles, respectively, to conduct bio-hydrogen potential tests. The initial pH for each bottle was adjusted to 6.5 using 2 mM NaOH. After degassing with nitrogen for 30 min, the serum bottles were sealed by the caps and autoclaved at 121 °C for 20 min. Then, the cooled serum bottles were inoculated with 2 mL inoculum solution and incubated in an orbital incubator shaker at 60 °C and a rotation speed of 150 rpm for 36 h until a negligible amount of bio-hydrogen was observed. The substrate consumption, hydrogen production, and cell growth profile were monitored with time, and all batch tests were performed in triplicates.

2.3. Analytical Methods

All liquid samples taken every 4–8 h during the batch tests were filtered through disposable sterile millipore filter units (pore size: 0.22 μm) for chemical analysis. The glucose and xylose concentrations were detected by high-performance liquid chromatography (HPLC) equipped with a refraction index detector (LC-10A, Shimadzu Corporation, Kyoto, Japan) [22,26]. A gas chromatograph (7890A, Agilent, Santa Clara, CA, USA) with a flame ionization detector (FID) and DB-FFAP (30 m × 50 μm, 0.25 μm) capillary column was employed to qualify and quantify the metabolic end products such as acetate and butyrate [27]. The volume of gas produced (H2 and CO2) was collected and measured by gas bag; meanwhile, the hydrogen fraction in the gas bag was determined by a gas chromatograph (7890A, Agilent, USA) with a thermal conductivity detector (TCD) [27]. The hydrogen amount was then calculated as accumulated gas production quantity * hydrogen content in the gas.

2.4. Data Analysis

In order to compare the bio-hydrogen production potential of T. thermosaccharolyticum W16 from different substrates under different concentrations, the hydrogen production capacity was fitted to a modified Gompertz model [26], as given in the formula (1) shown below:
H = P × exp { exp [ R m e P ( λ t ) + 1 ] }
where H (mol H2·mol−1 substrate) represents the total amount of H2 at culture time t (h), P (mol H2·mol−1 substrate) is the maximum cumulative amount of H2 produced, Rm (mol H2·mol−1 substrate h−1) is the maximum H2 production rate, λ (h) is the lag time before exponential H2 production, t (h) is the bio-hydrogen production tests time, and e = 2.71828.
The energy conversion efficiency (ECE) of the overall bio-hydrogen production from different substrates under different concentrations was computed by using the following formula:
ECE % = Heat   value   of   H 2   ( kJ · mol 1 ) Heat   value   of   glucose   ( kJ · mol 1 ) + Heat   value   of   xylose   ( kJ · mol 1 ) × 100 %
where the heating values (HV) of H2, glucose, and xylose were 284 kJ·mol−1, 2810.5 kJ·mol−1, and 2432.1 kJ·mol−1, respectively [28].
One-way factor analysis of variance (ANOVA) was utilized to analyze the significance of experimental data.

3. Results and Discussion

3.1. Bio-Hydrogen Production from Glucose, Xylose, and Glucose–Xylose

The bio-hydrogen production profile of T. thermosaccharolyticum W16 feeding with glucose, xylose, and glucose–xylose at different concentrations was shown in Figure 1, Figure 2 and Figure 3, and the corresponding kinetic parameters were given in Table 2. The hydrogen yield increased with glucose concentration rising from 27.75 to 55.51 mM, and the maximum hydrogen yield obtained was 1.32 mol H2·mol−1 glucose (Figure 1). Further increasing the glucose concentration to 83.26 mM reduced the hydrogen yield to 61.8% of the maximum value. When the glucose concentration was improved to 138.77 mM, the highest hydrogen yield was only 0.60 mol H2·mol−1 glucose. The cumulative bio-hydrogen yield was simulated with the modified Gompertz equation (Figure 1); the determination coefficient (R2) of over 0.99 confirmed that the experimental data fitted the modified Gompertz equation well. In contrast to the bio-hydrogen production performance, the highest predicted bio-hydrogen production rate (Rm) occurred at 27.75 mM glucose, which was 0.25 mol H2·mol−1 glucose h−1, although the lag time (λ) was 7.5 h. With the rising of glucose concentration from 27.75 to 138.77 mM, the Rm and the lag time decreased accordingly. The lowest Rm was 0.04 mol H2·mol−1 glucose h−1 at 138.77 mM glucose, while the lag time (λ) was shortened to 6.3 h (Table 2).
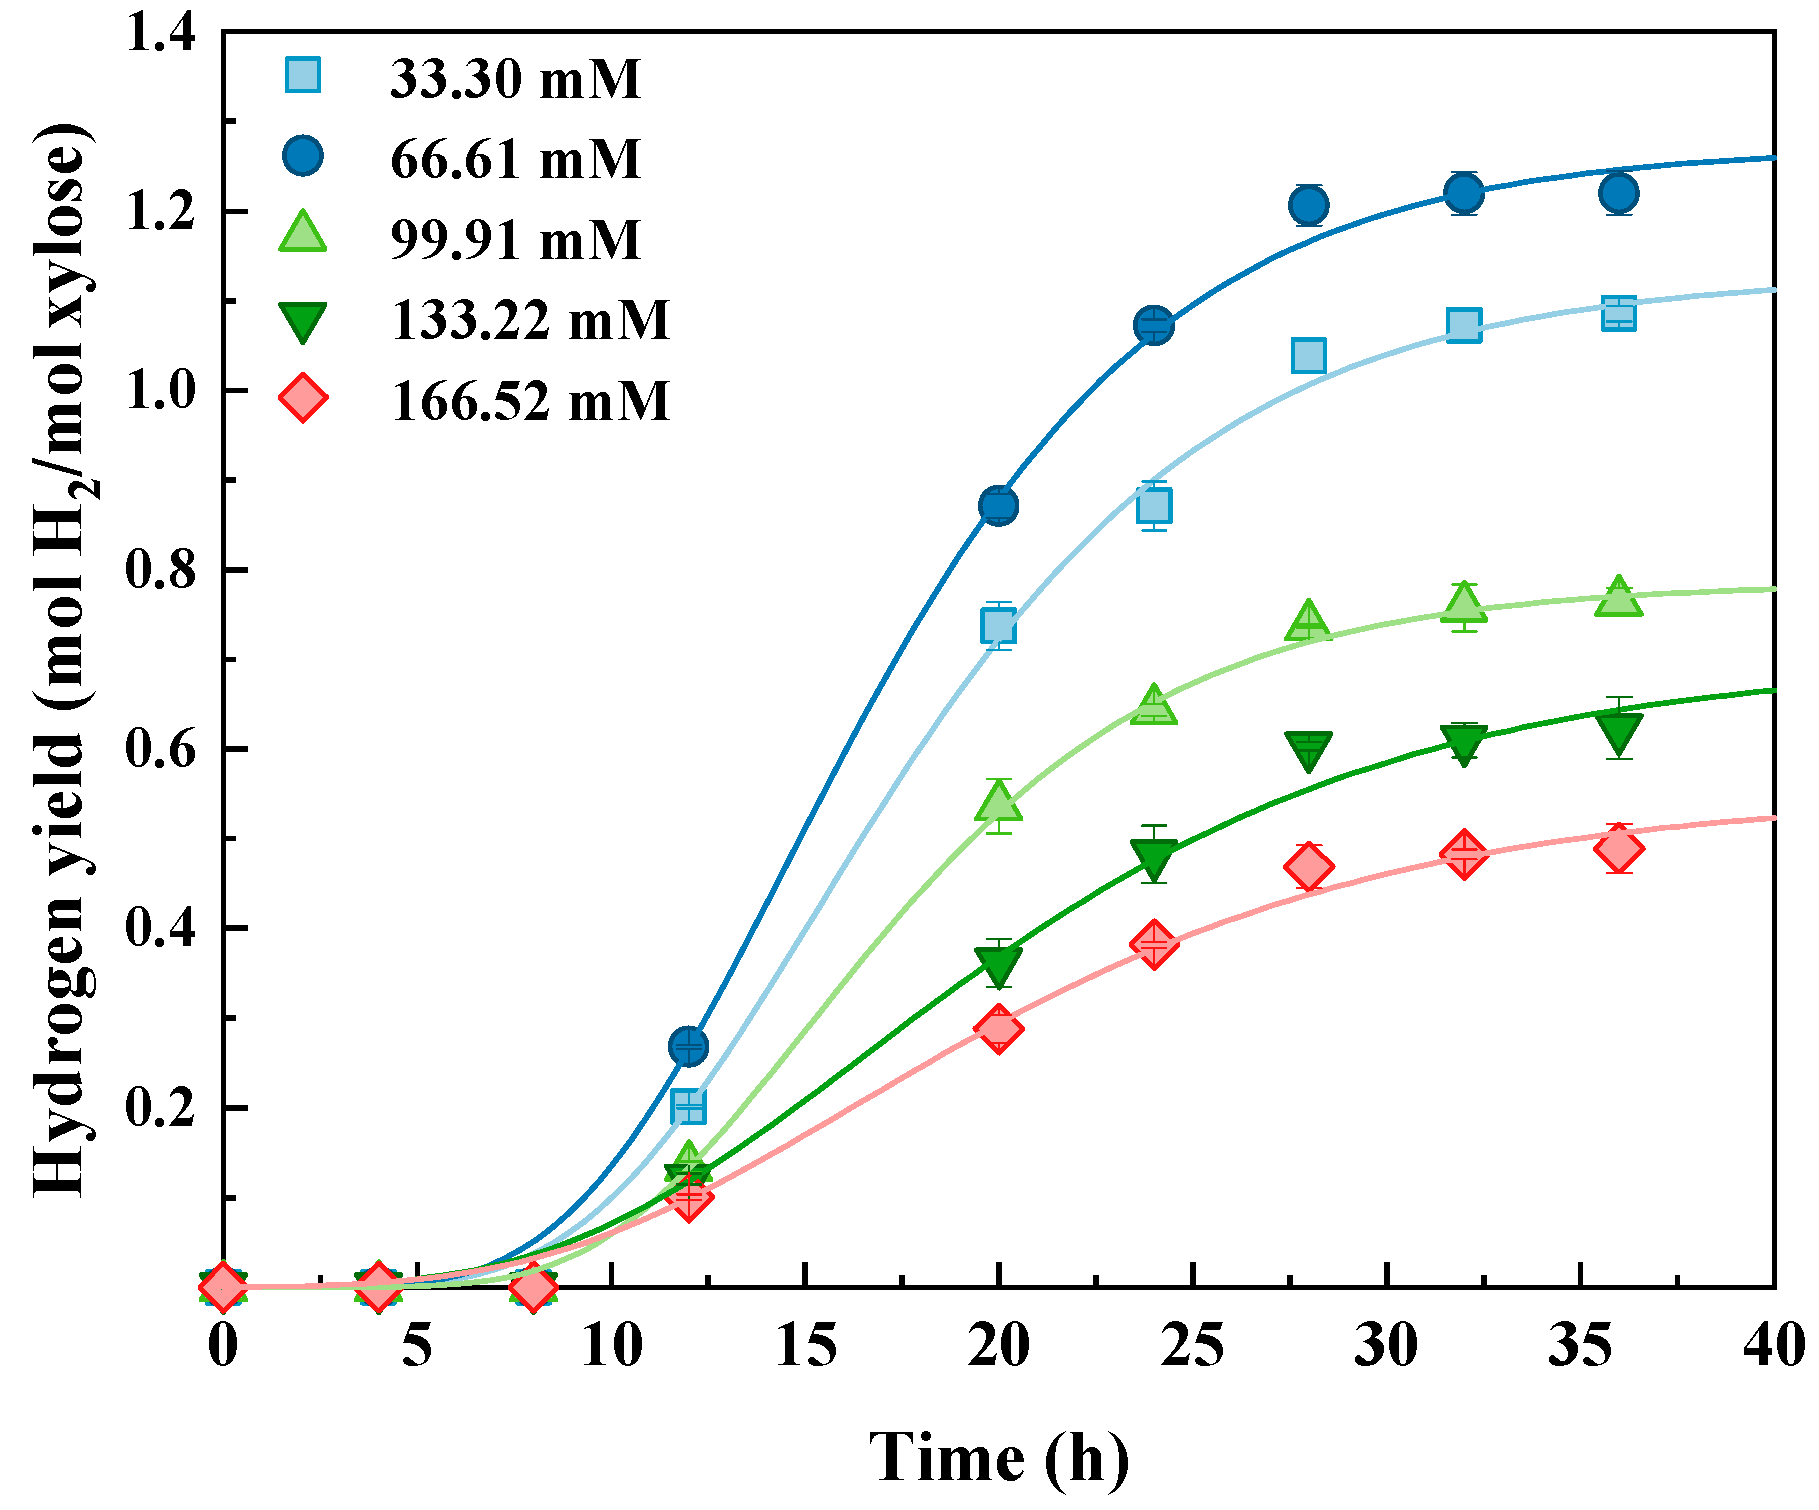
When feeding with xylose, the bio-hydrogen yield tendency was similar to that of glucose. The maximum value was 1.27 mol H2·mol−1 xylose at 66.62 mM xylose (Figure 2). While the hydrogen production rate was slightly different from that of glucose, the highest value of 0.08 mol H2·mol−1 xylose h−1 was also found at 66.62 mM xylose, which was only 34.3% that of 27.75 mM glucose (Figure 2). Additionally, the overall lag time was longer with xylose than that with glucose, indicating that the cell growth was directly related to the type of substrate. Moreover, it can be obtained from Figure 3 that the hydrogen production performance was similar to that of glucose alone when glucose–xylose was feeding as a substrate. The maximum bio-hydrogen yield and bio-hydrogen production rate was 1.39 mol H2·mol−1 glucose–xylose and 0.24 mol H2·mol−1 glucose–xylose h−1, respectively. Additionally, it was noteworthy that the lag time at a high glucose–xylose concentration of 151.38 mM was shortened to only 5.5 h (Table 2).
From the above results, it can be concluded that, no matter what type of reducing sugar was used, the maximum bio-hydrogen yield emerged when the substrate concentration was 10 g·L−1 (amounting to 55.51 mM glucose, 66.61 mM xylose or 60.55 mM glucose–xylose), indicating that different substrate types had little effect on the cumulative bio-hydrogen yield. The maximum hydrogen production rate appeared when the substrate concentration was 5 g·L−1 (amounting to 27.75 mM glucose, 33.30 mM xylose or 30.28 mM glucose–xylose) or 10 g·L−1 (amounting to 55.51 mM glucose, 66.61 mM xylose or 60.55 mM glucose–xylose), and the value decreased significantly with the increase of substrate concentration. Using glucose alone or glucose–xylose as the substrate at a concentration of 5 g·L−1 (amounting to 27.75 mM glucose, 33.30 mM xylose or 30.28 mM glucose–xylose), the bio-hydrogen production rate was significantly higher than that of xylose. However, as the substrate concentration increased, the difference in bio-hydrogen production rates among glucose, xylose, and glucose–xylose continued to decrease. The results confirmed that the bio-hydrogen production performance decreased along with substrate concentration increasing, which was consistent with previous research [29,30]. Table 3 showed that the metabolic end products (mainly acetate and butyrate) increased with substrate concentration when using glucose or xylose as the sole substrate, while for the glucose–xylose one, ethanol and butanol have also appeared in metabolic end products. When the substrate concentration increased from 30.28 mM to 151.38 mM, the ethanol and butanol concentration decreased accompanied with the gradual increase of acetate and butyrate. In our previous studies [31,32], trace amounts of ethanol and butanol were usually detected as by-products during H2 production by T. thermosaccharolyticum W16, no matter what concentration of glucose or xylose was used as substrate. However, in this study, the ethanol and butanol appeared only in the glucose/xylose mixture; it is a very interesting phenomenon that can be further investigated by means of functional genomics in another study. Moreover, the metabolic end products’ accumulation under high substrate concentration might also limit bio-hydrogen production [30,33]. It can also be found from the results that the substrate concentration had no significant effect on the lag time when the value was greater than or equal to 10 g·L−1 (amounting to 55.51 mM glucose, 66.61 mM xylose or 60.55 mM glucose–xylose) (when the substrates were glucose, xylose and glucose–xylose, the p values were all higher than 0.05). However, the lag time in hydrogen production from xylose was longer than that in the presence of glucose, which is consistent with previous studies [26]. The presence of xylose gives the strain W16 a greater preference for self-synthesis than for bio-hydrogen production.

3.2. Glucose and Xylose Consumption during Bio-Hydrogen Production

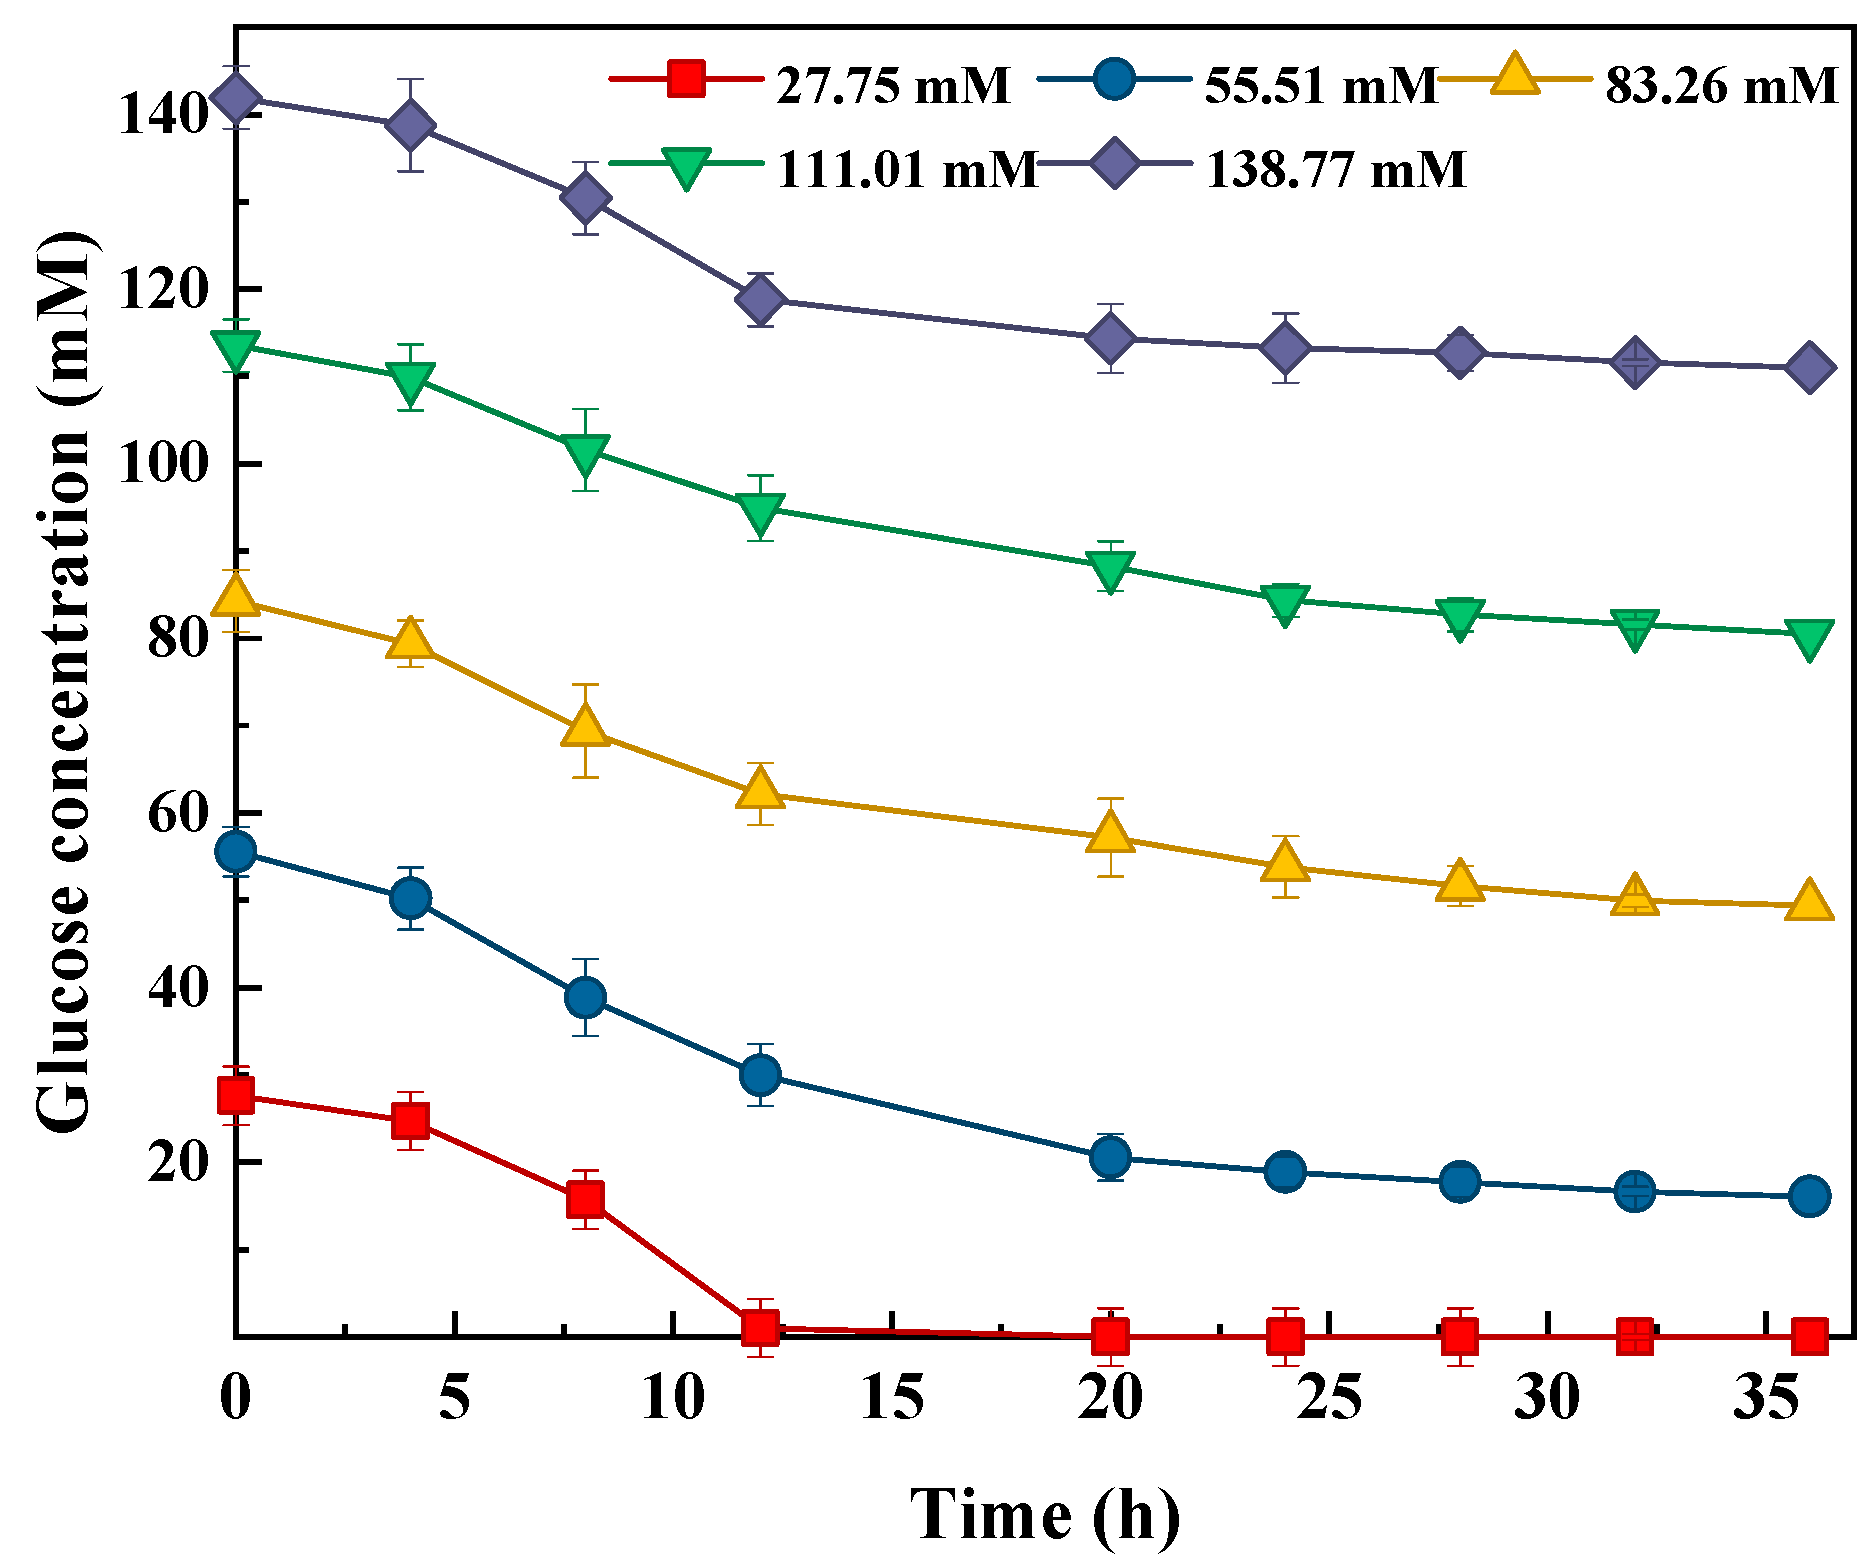
Profiles of residual reducing sugars concentration with time were shown in Figure 4, Figure 5 and Figure 6. When the initial glucose concentration was 27.75 mM (Figure 4), it could be fully utilized within 12 h of fermentation. The lack of carbon source might cause lower biomass and inactive metabolism. Therefore, this would explain why the highest hydrogen production rate was achieved at 27.75 mM glucose, but the final cumulative hydrogen yield was lower than that at 55.51 mM glucose. With the rising of glucose concentration from 27.75 mM to 55.51 mM, substrate consumption improved gradually, and the maximum substrate consumption of 39.47 mM was achieved. As the glucose concentration gradually increased to 138.77 mM, the substrate consumption decreased at the same time, and the lowest substrate consumption yield was only 30.88 mM. The results suggested that extremely high substrate concentration would restrict the metabolic growth activity of cells and cause harm to bio-hydrogen production.
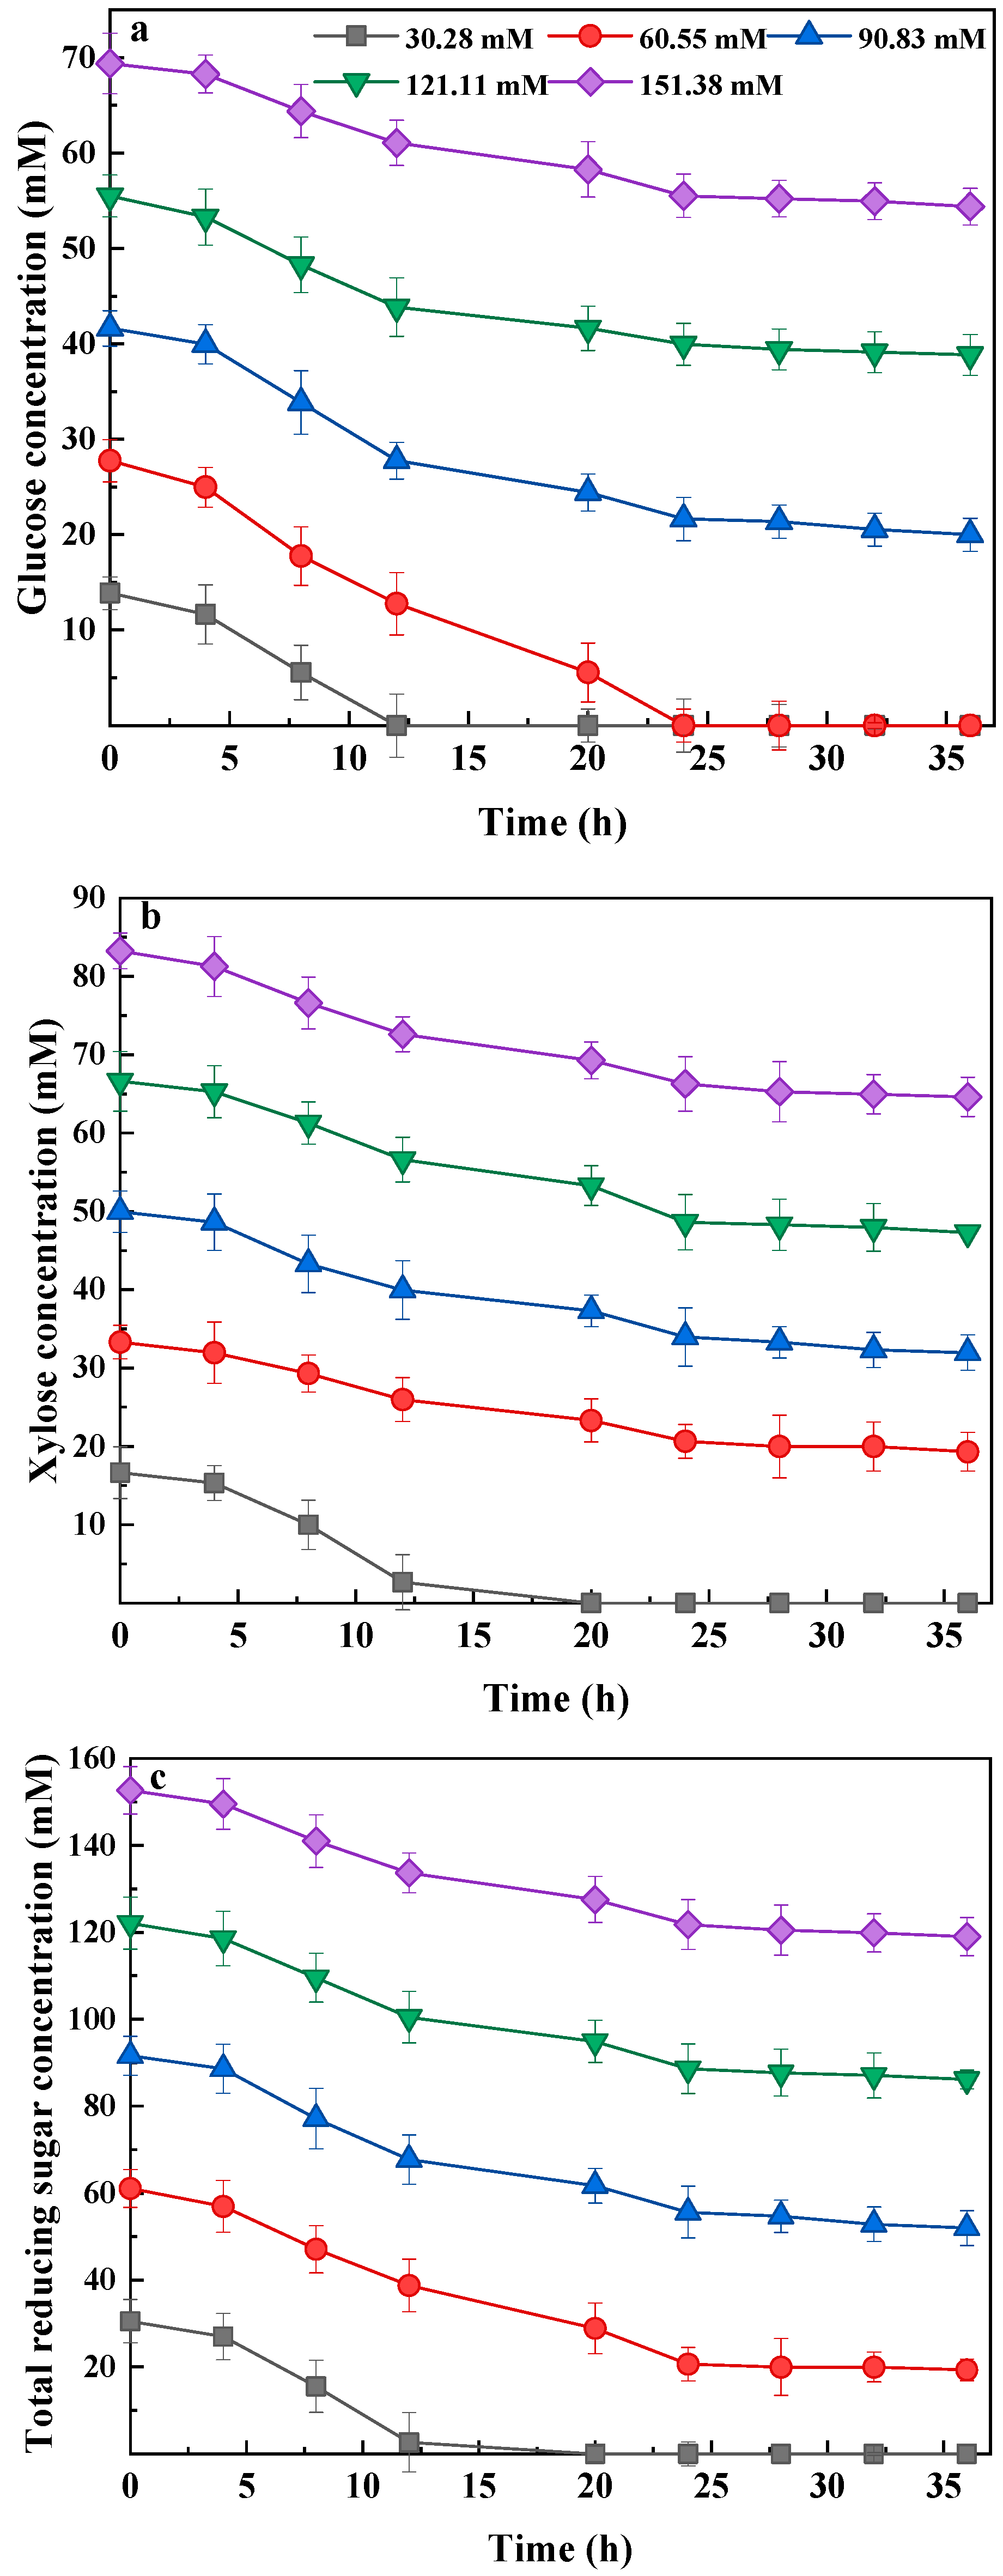
When feeding with xylose or glucose–xylose, respectively, the trend in substrate consumption at different concentrations is the same as that in glucose. The only difference is that the substrate was completely consumed within 28 h and 20 h, respectively, at a concentration of 33.30 and 30.28 mM (Figure 5 and Figure 6). Regardless of the substrate type, the highest substrate consumption (42.53 ± 3.86 mM) occurred at the substrate concentration of 55.51 mM glucose, 66.61 mM xylose and 60.55 mM glucose–xylose, which also corresponded to the maximum bio-hydrogen yield. It was found that the presence of glucose in the mixed substrate restricted the xylose utilization. For example, 27.75 mM glucose could be fully utilized in 60.55 mM glucose–xylose, while only 13.99 mM xylose was utilized for bio-hydrogen production and accounted for only 33.51% of the total sugar consumed. Increasing the glucose–xylose concentration from 60.55 mM to 151.38 mM, the xylose consumption ratio in the total substrates raised accordingly. The xylose consumption occupied 55.45% of the total substrate consumed when substrate concentration was 151.38 mM (Figure 6). In conclusion, the substrate consumption rule of three types of substrates with different concentration presented a positive correlation with total bio-hydrogen yield. That is, the bio-hydrogen production performance from lignocellulose hydrolysate was regulated by the substrate concentration rather than the substrate type.

3.3. Energy Conversion Efficiency of Bio-Hydrogen Production from Glucose, Xylose, and Glucose–Xylose

The energy conversion efficiency (ECE) of bio-hydrogen production from glucose, xylose, and glucose–xylose at varying concentrations was calculated and shown in Figure 7. The maximum ECE obtained by using glucose as a substrate was 15.6% at 55.51 mM glucose, 51.7% of the theoretical value. Increasing the glucose concentration to 83.26 mM, 111.01 mM, and 138.77 mM, the ECE went down to 9.5%, 8.0%, and 6.1%, respectively, which indicates that high substrate concentration was not conducive to energy conversion and bio-hydrogen production. Moreover, it can be clarified that ECE obtained from solely xylose with a concentration of 33.30 mM and 66.61 mM exhibits higher ECE, and 44.9% and 50.6% of the theoretical value were obtained, respectively. A similar value of the ECE (12.9% and 15.2%) has also been achieved from 30.28 mM and 60.55 mM glucose–xylose. In general, an energy conversion efficiency of less than 10% is not competitive compared to fossil-fuel-based bio-hydrogen production [28], and the maximal energy conversion efficiency of hydrogen production from solar is only 1.1% [34]. From the current results in this study, the ECE were all higher than 10% when the substrate concentration is less than 10 g·L−1 (amounting to 55.51 mM glucose, 66.61 mM xylose or 60.55 mM glucose–xylose), which indicates that the reasonable control of the soluble reducing sugars concentration can make the lignocellulosic bio-hydrogen production more energy efficient.

3.4. Implications of the Study

Bio-hydrogen production from lignocellulose has attracted serious concern from both environmental and economic points of view. However, lignocellulosic biomass presents a complex structure due to its recalcitrant nature, and appropriate pretreatment is necessary to release the reducing sugar for the subsequent bio-hydrogen production. Therefore, the rational use of lignocellulose hydrolysate is crucial to bio-hydrogen production. The results obtained in this study have confirmed that the total bio-hydrogen yield from lignocellulose hydrolysate is not related to the type of reducing sugar, but is mainly affected by the reducing sugar concentration. Taking T. thermosaccharolyticum W16 as an example, if continuous bio-hydrogen production from lignocellulose hydrolysate was operated, the hydrolysate containing glucose or glucose–xylose needs to be diluted to 5 g·L−1 (amounting to 27.75 mM glucose, 33.30 mM xylose or 30.28 mM glucose–xylose) to obtain the maximum bio-hydrogen production rate, while for the xylose one, it is better to be diluted to 10 g·L−1 (amounting to 55.51 mM glucose, 66.61 mM xylose or 60.55 mM glucose–xylose) to ensure efficient lignocellulosic bio-hydrogen production. These collectively imply that if T. thermosaccharolyticum W16 is used as the candidate hydrogen producing bacteria, the lignocellulose pretreatment can be independent of the reducing sugar types. Instead, efficient substrate consumption and energy recovery can be achieved with reasonable hydrolysate dilution. On the other hand, excessively reducing sugar concentration could lead to more by-product (e.g., acetate and butyrate) generation, which is beneficial in integrating this dark fermentative hydrogen production with photo fermentative hydrogen production or bio-electrochemical hydrogen production, and therefore increasing the final hydrogen yield. Moreover, it should be noted that most lignocellulosic bio-hydrogen production was carried out at the laboratory scale, while pilot-scale experiments made slow progress. There are many obstacles that need to be solved to realize pilot scale, including low hydrogen yield due to incomplete utilization of lignocellulosic biomass, and reduced cost for lignocellulosic biomass pretreatment. This study provides a measuring tool in bio-hydrogen production, and through the reasonable control of the substrate loading rate, the maximum hydrogen production rate and yield could be obtained and avoid the excessive input caused by inappropriate pretreatment.

4. Conclusions

In this study, the bio-hydrogen production performance of T. thermosaccharolyticum W16 from glucose, xylose, and glucose–xylose with different concentrations was evaluated. Results showed that the bio-hydrogen yield and bio-hydrogen production rate were mainly related to the substrate concentration rather than substrate type. The maximum bio-hydrogen yields all appeared when the substrate concentration was 10 g·L−1 (amounting to 55.51 mM glucose, 66.61 mM xylose or 60.55 mM glucose–xylose), while the highest bio-hydrogen production rate of 0.25, 0.08, and 0.24 mol H2·mol−1 substrate h−1 was obtained at 27.75 mM glucose, 66.61 mM xylose, and 30.28 mM glucose–xylose, respectively. These results suggest that diluting the substrate concentration is reasonably beneficial for bioenergy recovery. Moreover, more attention can be paid to the lignocellulose pretreatment efficiency than to the type of sugar obtained.

Author Contributions

Conceptualization, L.Z.; methodology, L.Z.; validation, Z.-H.W., J.-Y.T. and Y.-T.Z.; resources, L.Z. and N.-Q.R.; writing—original draft preparation, Z.-H.W.; writing—review and editing, L.Z. and N.-Q.R.; funding acquisition, L.Z. All authors have read and agreed to the published version of the manuscript.

Funding

This study was supported by the National Natural Science Foundation of China (No. 31800115); the China Postdoctoral Science Foundation (No. 2018M640299); the Heilongjiang Postdoctoral Foundation (No. LBH-Z18091), China; the State Key Laboratory of Urban Water Resource and Environment, Harbin Institute of Technology (No. 2021TS21), China; Open Project of Key Laboratory of Environmental Biotechnology, CAS (Grant No. kf2020009); Foundation from National Engineering Research Center for Bioenergy (Grant No. 2021B008); and Heilongjiang Touyan Innovation Team Program.

Institutional Review Board Statement

Not applicable.

Informed Consent Statement

Not applicable.

Data Availability Statement

Data is contained within the article.

Conflicts of Interest

The authors declare no conflict of interest.

References

  1. Azwar, M.Y.; Hussain, M.A.; Abdul-Wahab, A.K. Development of biohydrogen production by photobiological, fermentation and electrochemical processes: A review. Renew. Sustain. Energy Rev. 2014, 31, 158–173. [Google Scholar] [CrossRef]
  2. Das, D.; Veziroglu, T.N. Hydrogen production by biological processes: A survey of literature. Int. J. Hydrogen Energy 2001, 26, 13–28. [Google Scholar] [CrossRef]
  3. Voloshin, R.A.; Rodionova, M.V.; Zharmukhamedov, S.K.; Nejat Veziroglu, T.; Allakhverdiev, S.I. Review: Biofuel production from plant and algal biomass. Int. J. Hydrogen Energy 2016, 41, 17257–17273. [Google Scholar] [CrossRef]
  4. Abe, J.O.; Popoola, A.P.I.; Ajenifuja, E.; Popoola, O.M. Hydrogen energy, economy and storage: Review and recommendation. Int. J. Hydrogen Energy 2019, 44, 15072–15086. [Google Scholar] [CrossRef]
  5. Arregi, A.; Amutio, M.; Lopez, G.; Bilbao, J.; Olazar, M. Evaluation of thermochemical routes for hydrogen production from biomass: A review. Energy Convers. Manag. 2018, 165, 696–719. [Google Scholar] [CrossRef]
  6. Bundhoo, Z.M.A. Coupling dark fermentation with biochemical or bioelectrochemical systems for enhanced bio-energy production: A review. Int. J. Hydrogen Energy 2017, 42, 26667–26686. [Google Scholar] [CrossRef]
  7. Argun, H.; Kargi, F. Bio-hydrogen production by different operational modes of dark and photo-fermentation: An overview. Int. J. Hydrogen Energy 2011, 36, 7443–7459. [Google Scholar] [CrossRef]
  8. Lukajtis, R.; Holowacz, I.; Kucharska, K.; Glinka, M.; Rybarczyk, P.; Przyjazny, A.; Kaminski, M. Hydrogen production from biomass using dark fermentation. Renew. Sustain. Energy Rev 2018, 91, 665–694. [Google Scholar] [CrossRef]
  9. Marone, A.; Ayala-Campos, O.R.; Trably, E.; Carmona-Martinez, A.A.; Moscoviz, R.; Latrille, E.; Steyer, J.P.; Alcaraz-Gonzalez, V.; Bernet, N. Coupling dark fermentation and microbial electrolysis to enhance bio-hydrogen production from agro-industrial wastewaters and by-products in a bio-refinery framework. Int. J. Hydrogen Energy 2017, 42, 1609–1621. [Google Scholar] [CrossRef]
  10. Yadav, M.; Paritosh, K.; Vivekanand, V. Lignocellulose to bio-hydrogen: An overview on recent developments. Int. J. Hydrogen Energy 2020, 45, 18195–18210. [Google Scholar] [CrossRef]
  11. Bundhoo, Z.M.A. Potential of bio-hydrogen production from dark fermentation of crop residues: A review. Int. J. Hydrogen Energy 2019, 44, 17346–17362. [Google Scholar] [CrossRef]
  12. Shrestha, S.; Fonoll, X.; Khanal, S.K.; Raskin, L. Biological strategies for enhanced hydrolysis of lignocellulosic biomass during anaerobic digestion: Current status and future perspectives. Bioresour. Technol. 2017, 245, 1245–1257. [Google Scholar] [CrossRef] [PubMed]
  13. Mukasekuru, M.R.; Hu, J.G.; Zhao, X.Q.; Sun, F.F.; Pascal, K.; Ren, H.Y.; Zhang, J.H. Enhanced High-Solids Fed-Batch Enzymatic Hydrolysis of Sugar Cane Bagasse with Accessory Enzymes and Additives at Low Cellulase Loading. ACS Sustain. Chem. Eng. 2018, 6, 12787–12796. [Google Scholar] [CrossRef]
  14. Silva, J.S.; Mendes, J.S.; Correia, J.A.C.; Rocha, M.V.P.; Micoli, L. Cashew apple bagasse as new feedstock for the hydrogen production using dark fermentation process. J. Biotechnol. 2018, 286, 71–78. [Google Scholar] [CrossRef] [PubMed]
  15. Qi, N.; Hu, X.; Zhao, X.; Li, L.; Yang, J.; Zhao, Y.; Li, X. Fermentative hydrogen production with peanut shell as supplementary substrate: Effects of initial substrate, pH and inoculation proportion. Renew. Energy 2018, 127, 559–564. [Google Scholar] [CrossRef]
  16. Lopez-Hidalgo, A.M.; Sánchez, A.; De León-Rodríguez, A. Simultaneous production of bioethanol and biohydrogen by Escherichia coli WDHL using wheat straw hydrolysate as substrate. Fuel 2017, 188, 19–27. [Google Scholar] [CrossRef]
  17. Hu, C.C.; Giannis, A.; Chen, C.L.; Qi, W.; Wang, J.Y. Comparative study of biohydrogen production by four dark fermentative bacteria. Int. J. Hydrogen Energy 2013, 38, 15686–15692. [Google Scholar] [CrossRef]
  18. Lo, Y.C.; Lu, W.C.; Chen, C.Y.; Chang, J.S. Dark fermentative hydrogen production from enzymatic hydrolysate of xylan and pretreated rice straw by Clostridium butyricum CGS5. Bioresour. Technol. 2010, 101, 5885–5891. [Google Scholar] [CrossRef]
  19. Tian, Q.Q.; Liang, L.; Zhu, M.J. Enhanced biohydrogen production from sugarcane bagasse by Clostridium thermocellum supplemented with CaCO3. Bioresour. Technol. 2015, 197, 422–428. [Google Scholar] [CrossRef]
  20. Zhao, L.; Cao, G.L.; Sheng, T.; Ren, H.Y.; Wang, A.J.; Zhang, J.; Zhong, Y.J.; Ren, N.Q. Bio-immobilization of dark fermentative bacteria for enhancing continuous hydrogen production from cornstalk hydrolysate. Bioresour. Technol. 2017, 243, 548–555. [Google Scholar] [CrossRef]
  21. Zhang, T.; Jiang, D.; Zhang, H.; Jing, Y.; Tahir, N.; Zhang, Y.; Zhang, Q. Comparative study on bio-hydrogen production from corn stover: Photo-fermentation, dark-fermentation and dark-photo co-fermentation. Int. J. Hydrogen Energy 2020, 45, 3807–3814. [Google Scholar] [CrossRef]
  22. Zhao, L.; Wang, Z.; Ren, H.Y.; Chen, C.; Nan, J.; Cao, G.L.; Yang, S.S.; Ren, N.Q. Residue cornstalk derived biochar promotes direct bio-hydrogen production from anaerobic fermentation of cornstalk. Bioresour. Technol. 2021, 320, 124338. [Google Scholar] [CrossRef] [PubMed]
  23. Singh, T.; Alhazmi, A.; Mohammad, A.; Srivastava, N.; Haque, S.; Sharma, S.; Singh, R.; Yoon, T.; Gupta, V.K. Integrated biohydrogen production via lignocellulosic waste: Opportunity, challenges & future prospects. Bioresour. Technol. 2021, 338, 12. [Google Scholar]
  24. Saratale, G.D.; Kshirsagar, S.D.; Saratale, R.G.; Govindwar, S.P.; Oh, M.-K. Fermentative hydrogen production using sorghum husk as a biomass feedstock and process optimization. Biotechnol. Bioprocess Eng. 2015, 20, 733–743. [Google Scholar] [CrossRef]
  25. Ren, N.; Cao, G.; Wang, A.; Lee, D.; Guo, W.; Zhu, Y. Dark fermentation of xylose and glucose mix using isolated Thermoanaerobacterium thermosaccharolyticum W16. Int. J. Hydrogen Energy 2008, 33, 6124–6132. [Google Scholar] [CrossRef]
  26. Zhao, L.; Wang, Z.H.; Wu, J.T.; Ren, H.Y.; Yang, S.S.; Nan, J.; Cao, G.L.; Sheng, Y.C.; Wang, A.J.; Ren, N.Q. Co-fermentation of a mixture of glucose and xylose to hydrogen by Thermoanaerobacter thermosaccharolyticum W16: Characteristics and kinetics. Int. J. Hydrogen Energy 2019, 44, 9248–9255. [Google Scholar] [CrossRef]
  27. Li, W.M.; He, L.; Cheng, C.; Cao, G.L.; Ren, N.Q. Effects of biochar on ethanol-type and butyrate-type fermentative hydrogen productions. Bioresour. Technol. 2020, 306, 8. [Google Scholar] [CrossRef]
  28. Lei, Z.; Guo, W.Q.; Guo, X.C.; Ren, H.Y.; Wu, J.T.; Cao, G.L.; Wang, A.J.; Ren, N.Q.J.R.A. Continuous hydrogen production from glucose/xylose by an anaerobic sequential batch reactor to maximize the energy recovery efficiency. Rsc. Adv. 2018, 8, 20712–20718. [Google Scholar]
  29. Hitit, Z.Y.; Lazaro, C.Z.; Hallenbeck, P.C.J. Single stage hydrogen production from cellulose through photo-fermentation by a co-culture of Cellulomonas fimi and Rhodopseudomonas palustris. Int. J. Hydrogen Energy 2016, 42, 6556–6566. [Google Scholar] [CrossRef]
  30. Zagrodnik, R.; Duber, A.; Seifert, K. Hydrogen production during direct cellulose fermentation by mixed bacterial culture: The relationship between the key process parameters using response surface methodology. J. Clean. Prod. 2021, 314, 127971. [Google Scholar] [CrossRef]
  31. Zhao, L.; Cao, G.L.; Wang, A.J.; Guo, W.Q.; Ren, H.Y.; Ren, N.Q. Simultaneous saccharification and fermentation of fungal pretreated cornstalk for hydrogen production using Thermoanaerobacterium thermosaccharolyticum W16. Bioresour. Technol. 2013, 145, 103–107. [Google Scholar] [CrossRef] [PubMed]
  32. Zhao, L.; Cao, G.L.; Wang, A.J.; Ren, H.Y.; Dong, D.; Liu, Z.N.; Guan, X.Y.; Xu, C.J.; Ren, N.Q. Fungal pretreatment of cornstalk with Phanerochaete chrysosporium for enhancing enzymatic saccharification and hydrogen production. Bioresour. Technol. 2012, 114, 365–369. [Google Scholar] [CrossRef] [PubMed]
  33. Wang, Y.; Jing, Y.Y.; Lu, C.Y.; Kongjan, P.; Wang, J.; Awasthi, M.K.; Tahir, N.; Zhang, Q.G. A syntrophic co-fermentation model for bio-hydrogen production. J. Clean. Prod. 2021, 317, 9. [Google Scholar] [CrossRef]
  34. Wang, Q.; Hisatomi, T.; Jia, Q.X.; Tokudome, H.; Zhong, M.; Wang, C.Z.; Pan, Z.H.; Takata, T.; Nakabayashi, M.; Shibata, N.; et al. Scalable water splitting on particulate photocatalyst sheets with a solar-to-hydrogen energy conversion efficiency exceeding 1%. Nat. Mater. 2016, 15, 611–615. [Google Scholar] [CrossRef] [PubMed]
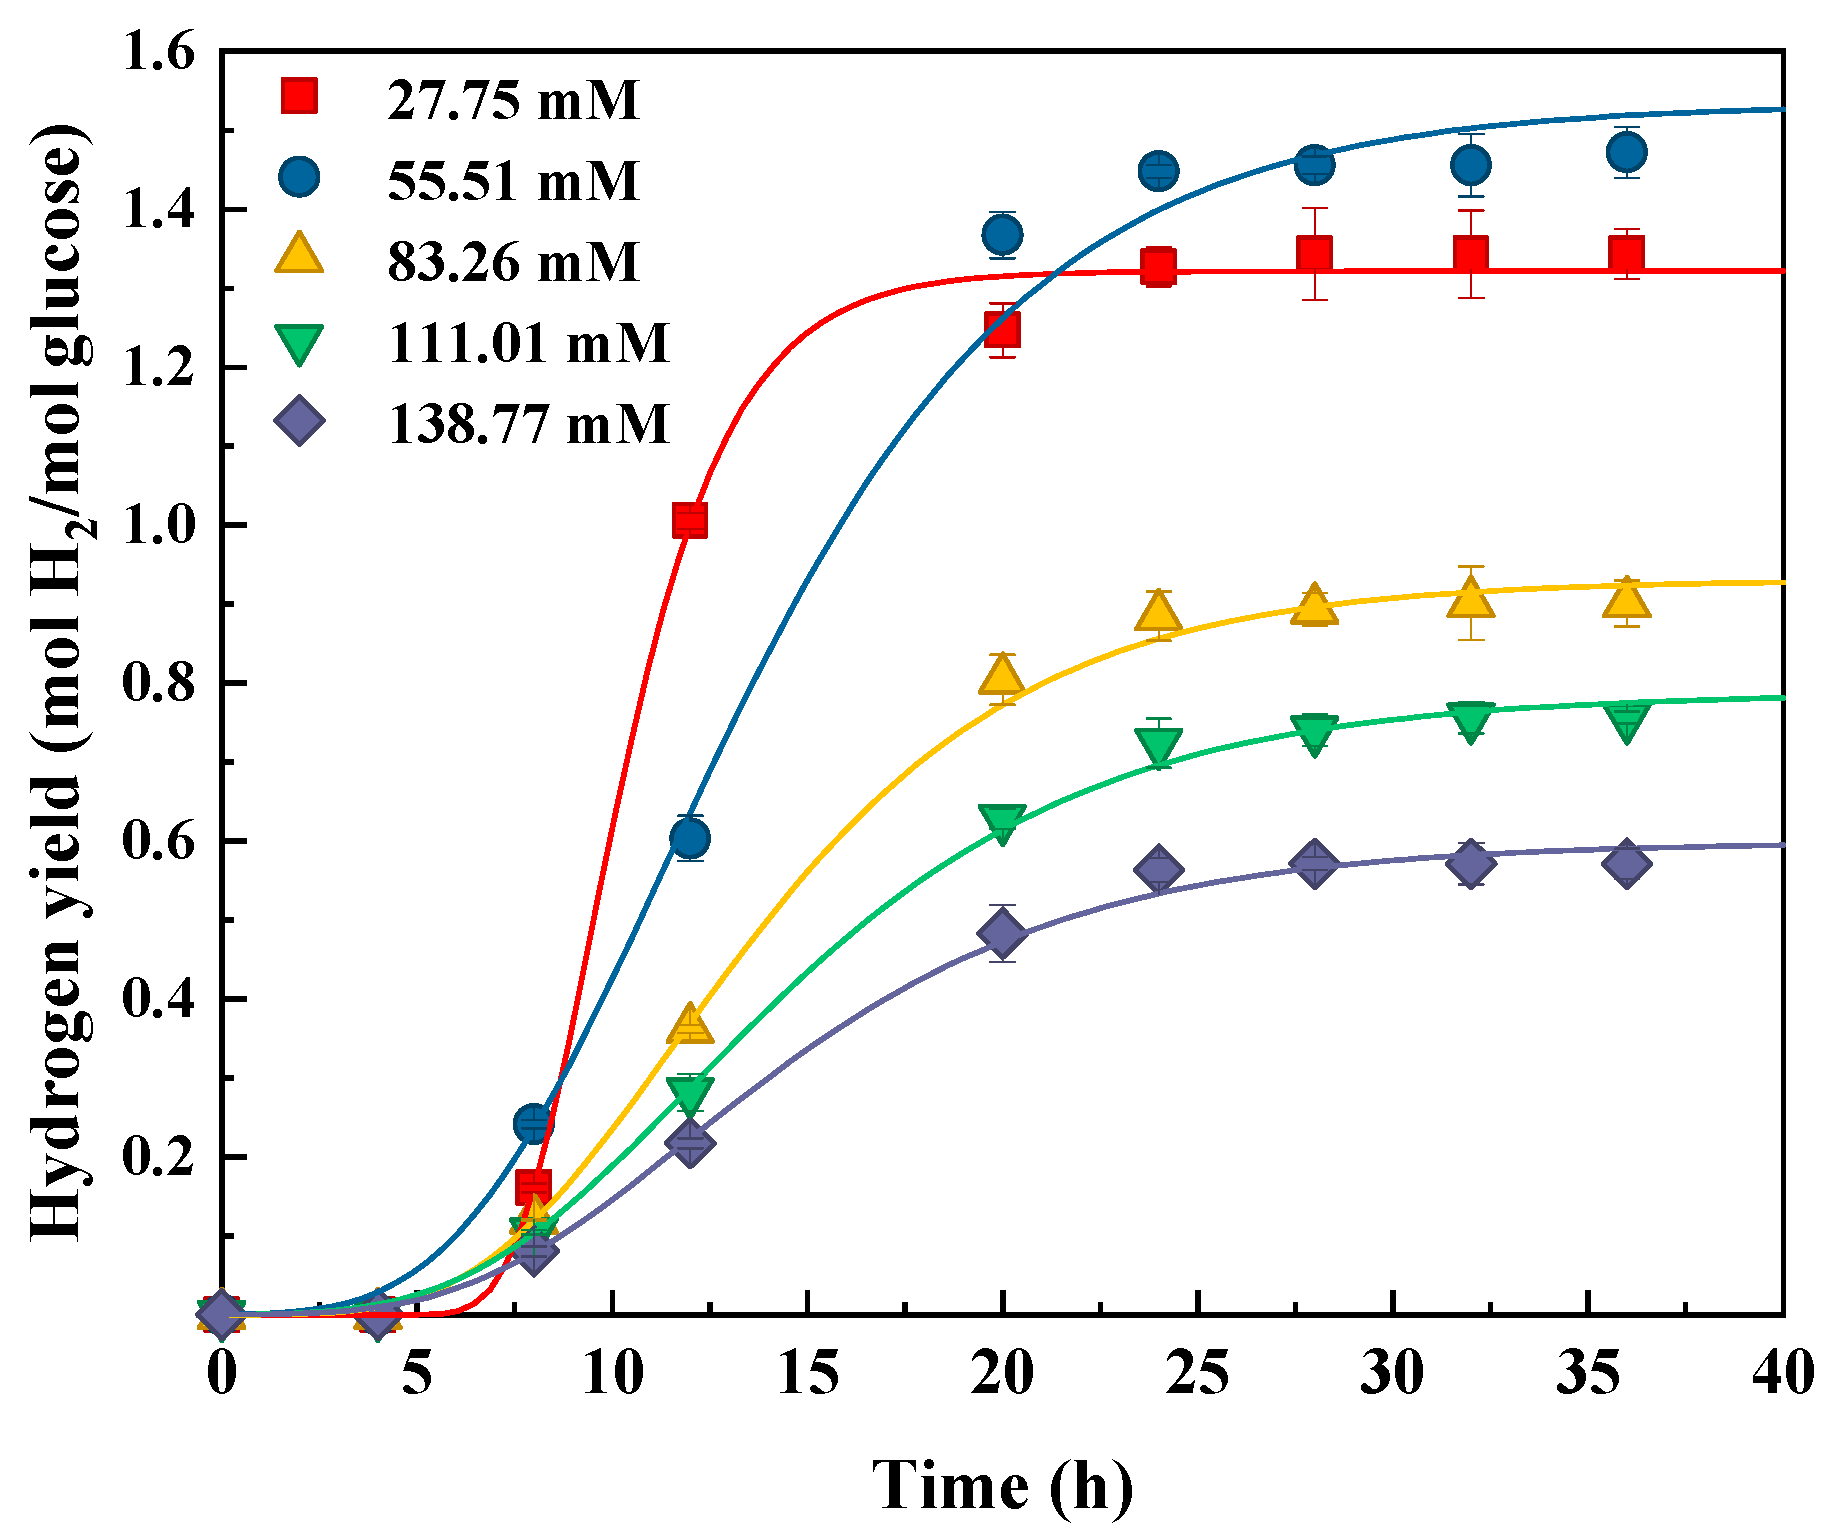
Figure 1. Cumulative bio-hydrogen yield from glucose at varying concentrations with simulation curves based on the modified Gompertz equation.
Fermentation 08 00739 g001
Figure 2. Cumulative bio-hydrogen yield from xylose at varying substrate concentrations with simulation curves based on the modified Gompertz equation.
Fermentation 08 00739 g002
Figure 3. Cumulative bio-hydrogen yield from glucose–xylose at varying substrate concentrations with simulation curves based on the modified Gompertz equation.
Fermentation 08 00739 g003
Figure 4. Residue glucose concentration during bio-hydrogen production at varying glucose concentrations.
Fermentation 08 00739 g004
Figure 5. Residue xylose concentration during bio-hydrogen production at varying xylose concentrations.
Fermentation 08 00739 g005
Figure 6. Residue substrate concentration during bio-hydrogen production at varying glucose–xylose concentrations. (a) Residue glucose concentration; (b) Residue xylose concentration; (c) Residue glucose and xylose concentration.
Fermentation 08 00739 g006
Figure 7. Energy conversion efficiencies of bio-hydrogen production from glucose, xylose, and glucose–xylose at varying concentrations.
Fermentation 08 00739 g007
Table 1. The hydrogen yield from different sugar concentrations and glucose/xylose ratios.
MicroorganismSubstrate Concentration (mM)Hydrogen Yield
(mol H2·mol−1 Substrate)
References
GlucoseXylose
Clostridium butyricum27.75–111.0102.4–3.1[17]
Clostridium butyricum CGS5087.26/61.280.70–0.76[18]
C. thermocellum69.38 25.31 0.85[19]
Clostridium sp. T284.37 31.97 1.70[20]
Enterobacter aerogenes11.66 6.66 0.27[21]
Clostridium beijerinckii15.26 7.99 1.051[24]
Clostridium roseum ATCC 17,797145.32 125.89 0.014[14]
Escherichia coli WDHL2.78 86.59 0.95[16]
Table 2. Estimated bio-hydrogen production potential (P) and maximum bio-hydrogen production rate (Rm) from glucose, xylose, and glucose–xylose at varying concentrations.
Substrate TypesSubstrate
Concentration (g·L−1)
Substrate
Concentration (mM)
P
(mol H2·mol−1 Substrate)
Rm
(mol H2·mol−1 Substrate h−1)
λ (h)R2
Glucose527.75 1.32 ± 0.110.25 ± 0.027.4 ± 0.40.997
1055.51 1.53 ± 0.120.11 ± 0.006.0 ± 0.30.997
1583.26 0.93 ± 0.070.07 ± 0.006.6 ± 0.40.999
20111.01 0.79 ± 0.060.05 ± 0.006.3 ± 0.30.991
25138.77 0.60 ± 0.050.04 ± 0.006.3 ± 0.50.992
Xylose533.30 1.13 ± 0.090.07 ± 0.019.3 ± 0.80.995
1066.61 1.27 ± 0.100.08 ± 0.018.9 ± 0.70.988
1599.91 0.79 ± 0.050.05 ± 0.009.7 ± 0.80.996
20133.22 0.70 ± 0.050.03 ± 0.008.6 ± 0.70.998
25166.52 0.55 ± 0.030.03 ± 0.008.3 ± 0.60.994
Glucose–xylose530.28 1.19 ± 0.090.24 ± 0.027.5 ± 0.50.994
1060.55 1.39 ± 0.110.09 ± 0.015.7 ± 0.40.993
1590.83 0.86 ± 0.070.06 ± 0.006.2 ± 0.50.998
20121.11 0.72 ± 0.050.04 ± 0.005.9 ± 0.30.998
25151.38 0.56 ± 0.040.03 ± 0.005.5 ± 0.30.999
Table 3. Metabolic end products of bio-hydrogen production from glucose, xylose, and glucose and xylose mixture at varying concentrations.
Substrate TypesSubstrate
Concentration (g·L−1)
Substrate
Concentration (mM)
Acetate (mM)Butyrate (mM)Ethanol (mM)Butanol (mM)
Glucose527.75 13.4 ± 1.040.4 ± 3.3n.d.n.d.
1055.51 19.3 ± 1.439.5 ± 3.1n.d.n.d.
1583.26 20.3 ± 1.535.1 ± 2.8n.d.n.d.
20111.01 20.1 ± 1.437.3 ± 3.1n.d.n.d.
25138.77 28.3 ± 2.245.8 ± 3.7n.d.n.d.
Xylose533.30 10.6 ± 0.838.1 ± 3.1n.d.n.d.
1066.61 15.9 ± 1.236.1 ± 2.9n.d.n.d.
1599.91 16.9 ± 1.332.6 ± 2.6n.d.n.d.
20133.22 17.8 ± 1.335.0 ± 2.8n.d.n.d.
25166.52 24.9 ± 1.941.2 ± 3.3n.d.n.d.
Glucose and xylose530.28 4.1 ± 0.212.3 ± 0.834.0 ± 2.222.5 ± 1.4
1060.55 6.0 ± 0.419.4 ± 1.125.9 ± 1.921.6 ± 1.4
1590.83 10.8 ± 0.326.9 ± 1.620.7 ± 1.220.2 ± 2.3
20121.11 15.4 ± 0.429.8 ± 2.420.4 ± 0.920.0 ± 1.6
25151.38 25.8 ± 0.831.8 ± 2.117.5 ± 1.116.4 ± 1.2
n.d.: not detected.
Publisher’s Note: MDPI stays neutral with regard to jurisdictional claims in published maps and institutional affiliations.