Article

Thermophilic Water Gas Shift Reaction at High Carbon Monoxide and Hydrogen Partial Pressures in Parageobacillus thermoglucosidasius KP1013

Technical Biology, Institute of Process Engineering in Life Science II, Karlsruhe Institute of Technology, 76131 Karlsruhe, Germany
*
Author to whom correspondence should be addressed.
Fermentation 2022, 8(11), 596; https://doi.org/10.3390/fermentation8110596
Submission received: 21 September 2022 / Revised: 25 October 2022 / Accepted: 26 October 2022 / Published: 1 November 2022
(This article belongs to the Section Microbial Metabolism, Physiology & Genetics)

Abstract

:
The facultatively anaerobic Parageobacillus thermoglucosidasius oxidizes carbon monoxide to produce hydrogen via the water gas shift (WGS) reaction. In the current work, we examined the influence of carbon monoxide (CO) and hydrogen (H2) on the WGS reaction in the thermophilic P. thermoglucosidasius by cultivating two hydrogenogenic strains under varying CO and H2 compositions. Microbial growth and dynamics of the WGS reaction were monitored by evaluating parameters such as pressure, headspace composition, metabolic intermediates, pH, and optical density. Our analyses revealed that compared to the previously studied P. thermoglucosidasius strains, the strain KP1013 demonstrated higher CO tolerance and improved WGS reaction kinetics. Under anaerobic conditions, the lag phase before the WGS reaction shortened to 8 h, with KP1013 showing no hydrogen-induced product inhibition at hydrogen partial pressures up to 1.25 bar. The observed lack of product inhibition and the reduced lag phase of the WGS reaction support the possibility of establishing an industrial process for biohydrogen production with P. thermoglucosidasius.

1. Introduction

The search for new ways to meet the increasing global energy demand and, at the same time, lower greenhouse gas discharged into the earth’s atmosphere is the greatest challenge of our time [1]. It is, therefore, key to detach the production chains from fossil fuels to evolve into a sustainable society [2]. Fossil fuels have, so far, remained indispensable, from their application as starting synthesis compounds in the chemical industry to the world’s predominant energy sources [3,4]. BP’s Review of 2020 showed that coal, natural gas, and oil constituted over 84% of the global energy supply in 2019 [4]. In the short term, fossil fuels are cheap because they are relatively easy to extract, but the implications on global climate can be far-reaching [5].
Hydrogen has a higher energy density per mass unit than oil or natural gas, thereby representing a promising alternative energy carrier [6]. To date, the primary sources of hydrogen are not environmentally friendly [7]. Fossil fuel-based hydrogen production, which constitutes 95% of the global production, implies substantial dissipation of the original energy content and is not sustainable [1]. Other sources, including renewable electricity via electrolysis, are expensive and account for only about 4% of the global hydrogen production [8].
Several microbial pathways yield hydrogen from different substrates, including organic and gaseous substrates [9,10,11,12]. These comprise dark fermentation, water gas shift reaction, direct and indirect biophotolysis, and photo-fermentation [13,14]. The water gas shift reaction is a reversible exothermic reaction that converts carbon monoxide and water to hydrogen and CO2 as presented in the equation below [15].
C O + H 2 O H 2 + C O 2 Δ H 298 K 0 = 41.09 k J / m o l
In biological systems, the water gas shift reaction is possible thanks to two key metalloenzymes [16]. On one hand, a monofunctional [NiFe]-carbon monoxide dehydrogenase ([NiFe]-CODH) can oxidize CO to CO2 [16]. On the other hand, an energy-conserving [Ni-Fe] hydrogenase (ECH), forms a complex with the CODH [16]. The ferredoxin (CooF) is part of the tight complex that catalyzes the reaction in Carboxydothermus hydrogenoformans [17]. This complex couples the oxidation of CO to the production of hydrogen gas through electron transfer to the ECH [16]. Evidence indicates that cells can obtain energy through proton translocation across the membrane linked to hydrogen generation by an ECH [18,19,20]. In biological systems that produce H2 from organic substrates, high hydrogen partial pressures shift the thermodynamic equilibrium between oxidation/reduction of ferredoxin towards the reduced state [21]. This limits the possibility of electron transfer from ferredoxin to protons at a critical hydrogen concentration [21]. In the WGS reaction, CooF also transfers electrons to the [NiFe]-hydrogenase [17], suggesting a similar H2 inhibitory effect. In addition, CO can bind to the nickel ion in the active site, thereby inhibiting the activity of hydrogenases [22].
Several studies have reported the kinetics of microbial hydrogen production, including the inhibitory roles of substrates and products during the process. H2 above a certain concentration threshold inhibits microbial growth and the formation of H2 [10,11,12]. In dark fermentation, an increased concentration of dissolved H2 in the liquid medium suppresses the activity of the H2-evolving hydrogenase, which leads to an increase in reducing equivalent and subsequent rerouting of metabolic fluxes to reduced products [11]. It remains unclear if the above principle is universal in the various biological hydrogen-yielding systems, including the WGS reaction. Sinharoy et al., 2019 reported the kinetics of CO consumption and biohydrogen production under the WGS reaction in anaerobic biomass, where high concentrations of H2 had inhibitory effects on the biomass growth and the kinetic of the WGS reaction [10].
Interestingly, the WGS reaction predominantly occurs among strict anaerobes and constitutes a process challenge in oxygen-prone cultivation [9]. Several microorganisms, including Parageobacillus thermoglucosidasius [15,23], can tolerate oxygen and catalyze the water gas shift (WGS) reaction upon oxygen depletion. P. thermoglucosidasius comprises obligately thermophilic, Gram-positive, and facultatively anaerobic bacilli in the phylum Firmicutes [24,25]. The species shows a wide distribution in diverse environments, including high-temperature oilfields, soils [26,27], hot springs [28], deep oceans [29] and high altitudes like the Bolivian Andes [30].
P. thermoglucosidasius has been the focus of multiple studies due to its catabolic versatility [31,32], and ability to withstand high ethanol concentrations, up to 10% v/v, making it a desirable platform for bioethanol production [33,34,35]. The thermophilicity of P. thermoglucosidasius makes the strain suitable for development and deployment in industrial processes. For instance, processes under high temperatures have distinct advantages over those at lower temperatures in terms of savings on cooling cost, contamination control, and product recovery [34,35,36] and possibly benefit the kinetics of the WGS reaction [15]. P. thermoglucosidasius shows a range of the WGS reaction capabilities, with several strains not expressing the metabolic pathway despite harboring the genomic locus encoding the WGS reaction proteins [23,37]. A recent screening of a collection of P. thermoglucosidasius strain revealed the hydrogenogenesis of KP1013 [37]. Therefore, the present work reports the influence of CO and H2 on the WGS reaction and metabolism of P. thermoglucosidasius, using the previously studied strain DSM 6285 and KP1013.

2. Materials and Methods

Two P. thermoglucosidasius strains, KP1013 and DSM 6285 were obtained from the Bacillus Genetic Stock Center in Columbus, Ohio, and the Leibniz-Institute DSMZ—German Collection of Microorganisms and Cell Experiments GmbH in Braunschweig, Germany, respectively. The strains were stored in glycerol at −80 °C. Before inoculation, the cells were revived aerobically for 17 h in shake flasks containing 20 mL modified lysogeny broth (mLB) medium (10 g/L tryptone, 5 g/L yeast extract, 5 g/L NaCl, 1.25 mL/L of 10 g/L NaOH, and 1 mL/L of each 1.05 M nitrilotriacetic acid, 0.59 M MgSO4, 0.91 M CaCl2 and 0.04 M FeSO4).
250 mL serum bottles containing 50 mL ammonium sulfate medium (ASM) medium (8.7 mM citric acid, 20.2 mM MgSO4, 10 mM K2SO4, 22.6 mM NaH2PO4, 0.8 mM CaCl2, 25 mM (NH4)2SO4, 4.16 mM or 5.55 mM glucose and trace elements (0.002 mM CuSO4, 0.004 mM CoSO4, 0.010 mM ZnSO4, 0.046 mM FeSO4, 0.006 mM NiSO4, 0.018 mM MnSO4 and 0.002 mM H3BO3) were sealed using rubber stoppers (top: 18 mm, bottom 14 mm and height 20 mm, Carl Roth, Karlsruhe, Germany). The ASM medium was supplemented per liter with 0.02 mM biotin (Carl Roth, Germany), 1% each of MEM amino acids solution (50×) and MEM non-essential amino acids solution (100×) and 1% MEM vitamin solution (100×; Thermo Scientific, Schwerte, Germany).
The gas composition was established for the various experiments after replacing the air in the 200 mL headspace. The bottles were purged with nitrogen in 40 cycles of pressurization to 1 bar over-pressure and depressurization. Subsequently, the headspace was filled with the appropriate gas composition as shown in Table 1 using a mass flow controller. For O2-containing bottles, equal amounts of O2 (1.2 mmol) were added using Luer lock syringes (Table 1). For comparison purposes, all setups containing the largest initial amount of CO before oxygen addition will be referred to as 100% CO setups. The strains were cultivated in triplicates at 60 °C, with an initial ASM medium pH set at 6.8 (adjusted using 4M NaOH) and at an initial optical density of 0.100 at 600 nm.
3 mL headspace and 1 mL liquid samples were collected using Luer lock syringes at each sampling point. Gas samples were analyzed using a 300 MicroGC (Inficon, Bad Ragaz, Switzerland) connected with 10 m Molsieve and 10 m PoraPLOT Q columns, using Ar and He as carrier gases, respectively. The liquid sampling was carried out every two hours during the first eight hours of cultivation and twice daily afterward. The optical density at a wavelength of 600 nm and pH of each at each sampling point were measured using Ultrospec 1100 pro spectrophotometer (Amersham Biosciences, Uppsala, Sweden) and Profilab pH 597 (Xylem Analytics, Weilheim, Germany), respectively.
Supernatants of the liquid samples, stored at −20 °C, were used for metabolites/intermediates analysis using an Agilent 1100 series HPLC (Agilent Technologies, Waldbronn, Germany) coupled with UV/RI detectors. The mobile phase used was 3 mM H2SO4 at a flow rate of 0.5 mL/min. The column RezexTM ROA-organic Acid Ht (8%) with a 300 mm length from Phenomenex was used at a working temperature of 60 °C. All acquired data were summarized with Microsoft Excel, and the graphs were plotted with Origin Pro 2021b.

3. Results

3.1. Cultivation of P. thermoglucosidasius KP1013 under Varying CO Concentrations at Atmospheric Pressure in the Presence of Oxygen

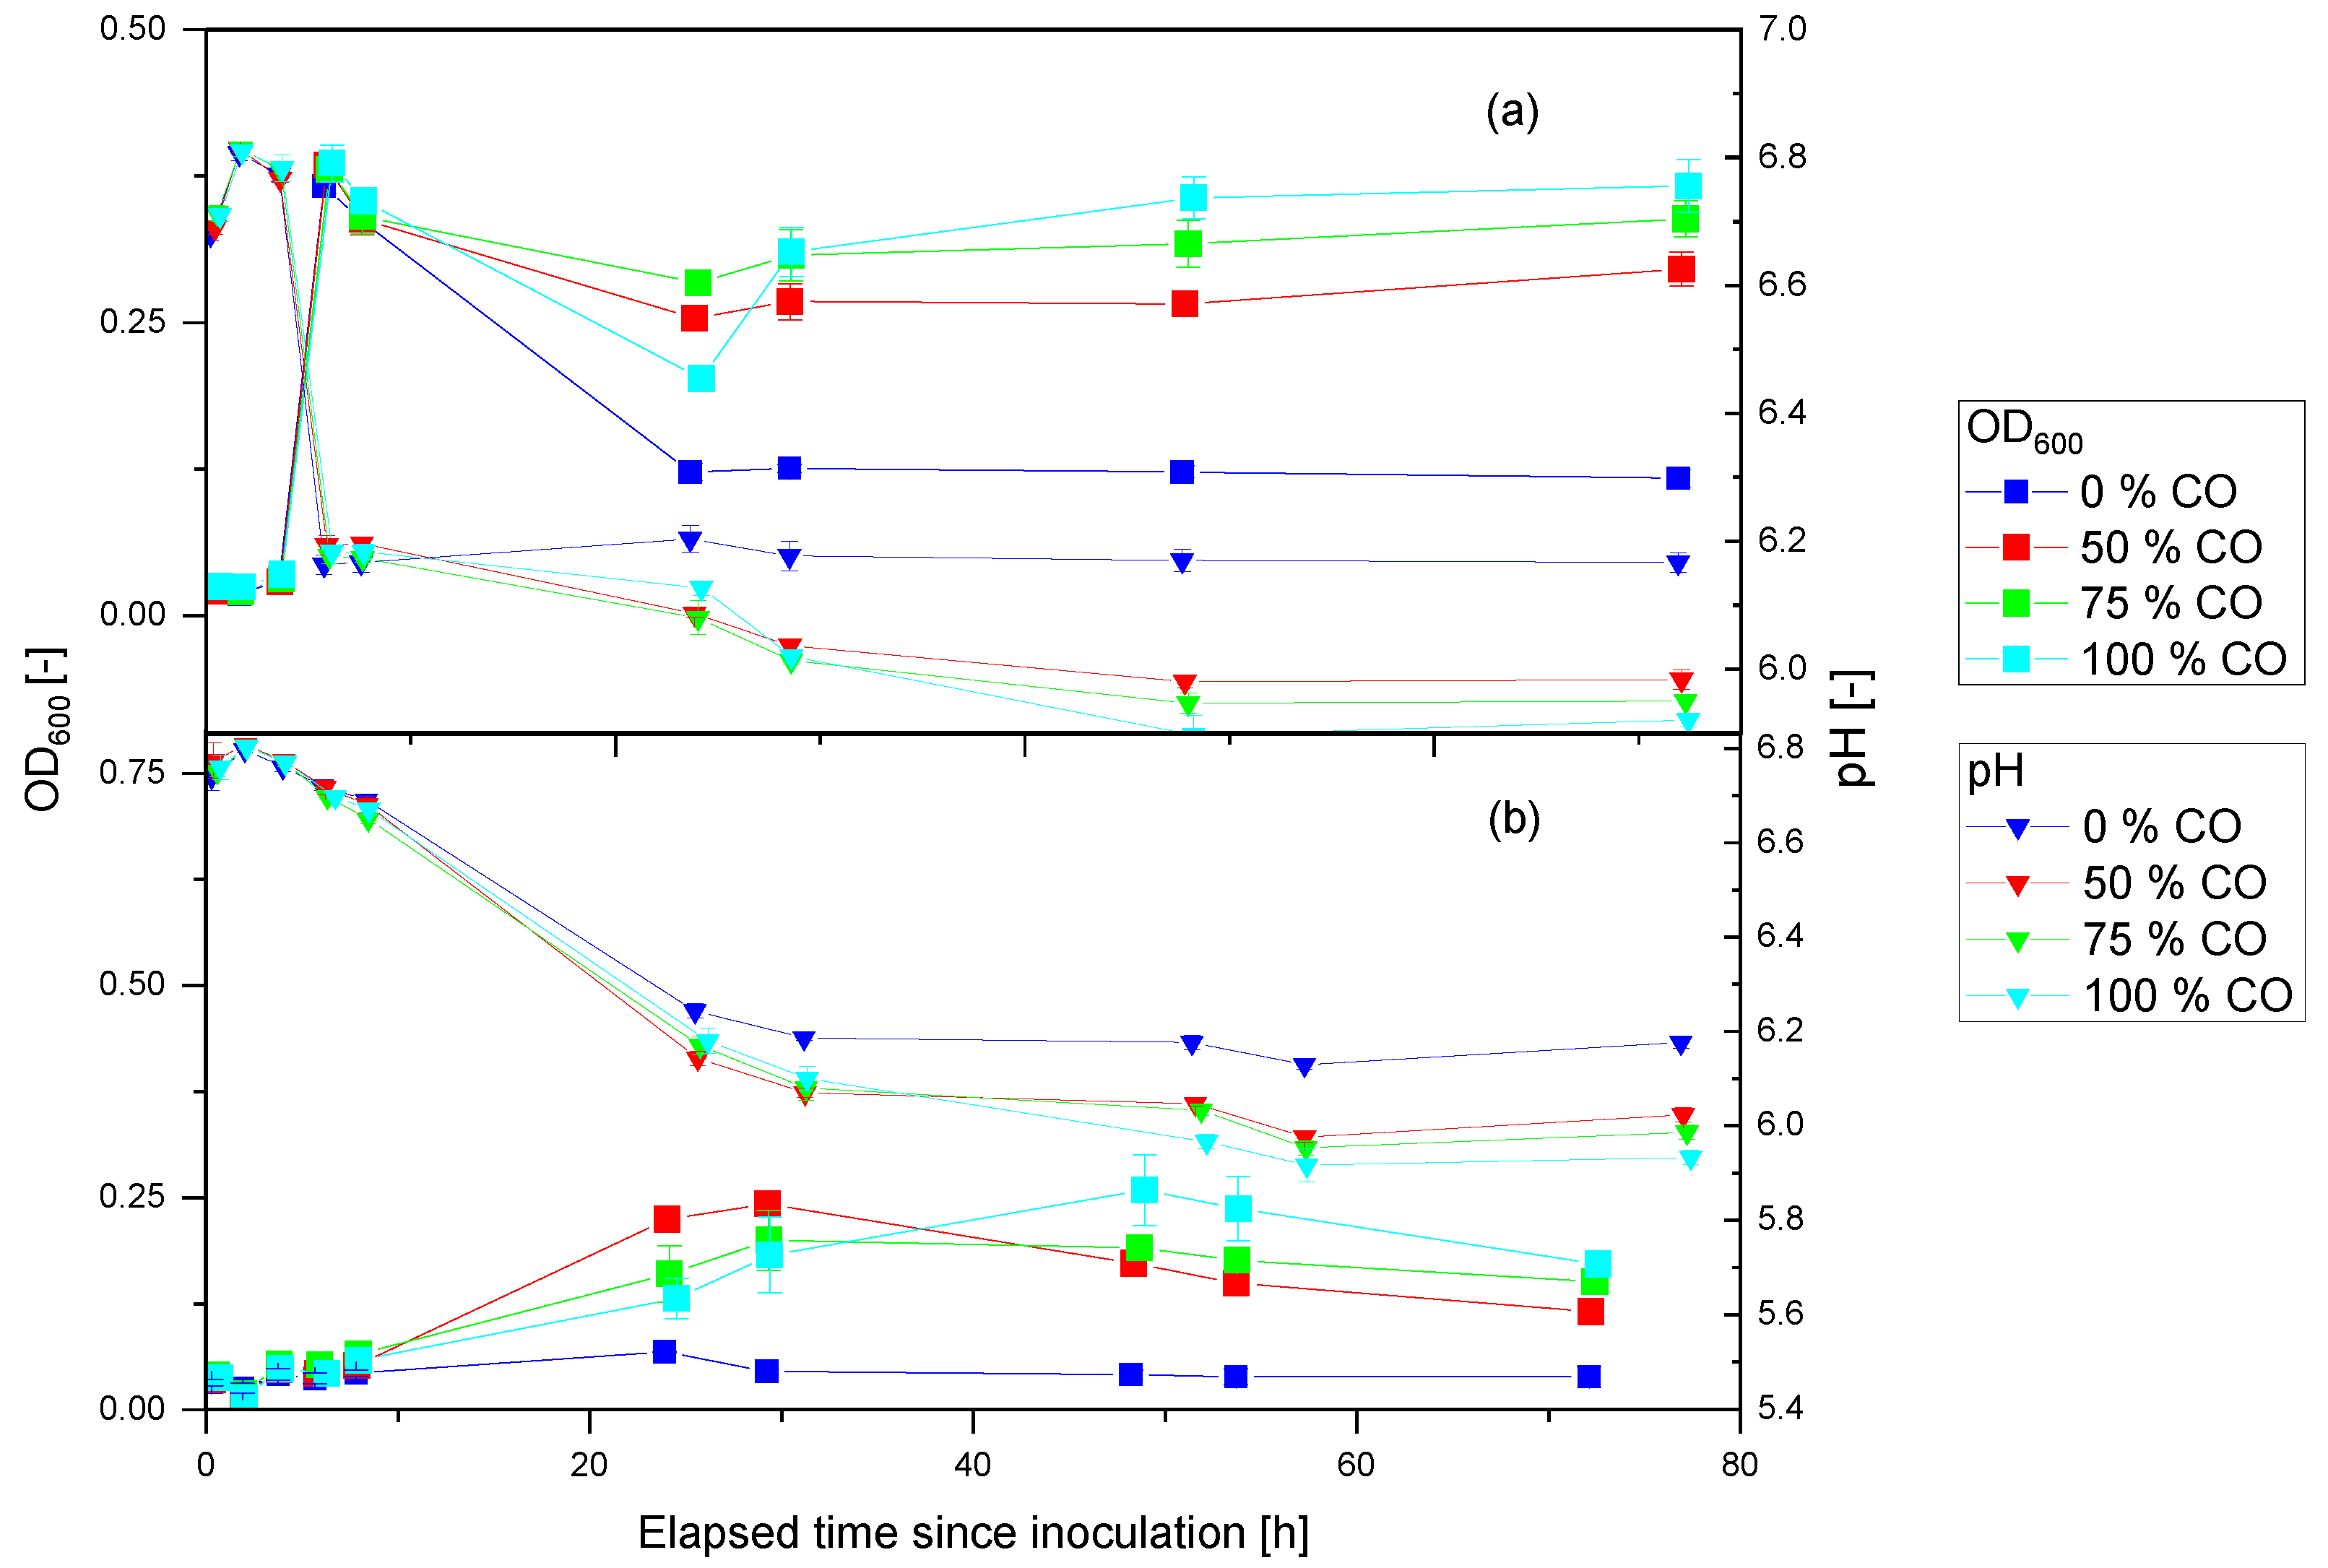
Previous studies have described the effects of different CO concentrations on metabolism and the WGS reaction in P. thermoglucosidasius DSM 6285 [38]. In the present work, we cultivated the related strain KP1013 in ASM medium with the starting CO amount of 0 mmol, 3.091 mmol, 4.891 mmol, and 6.316 mmol (0%, 50%, 75% and 100% bottles) in an O2-containing gas phase. The growth pattern, indicated by the OD600 values, was similar in all cultivation media with CO (Figure 1). Conversely, the cell density in bottles with no CO decreased after 28 h. At the end of the cultivation, higher initial CO partial pressures led to higher absorbance and lower pH values.
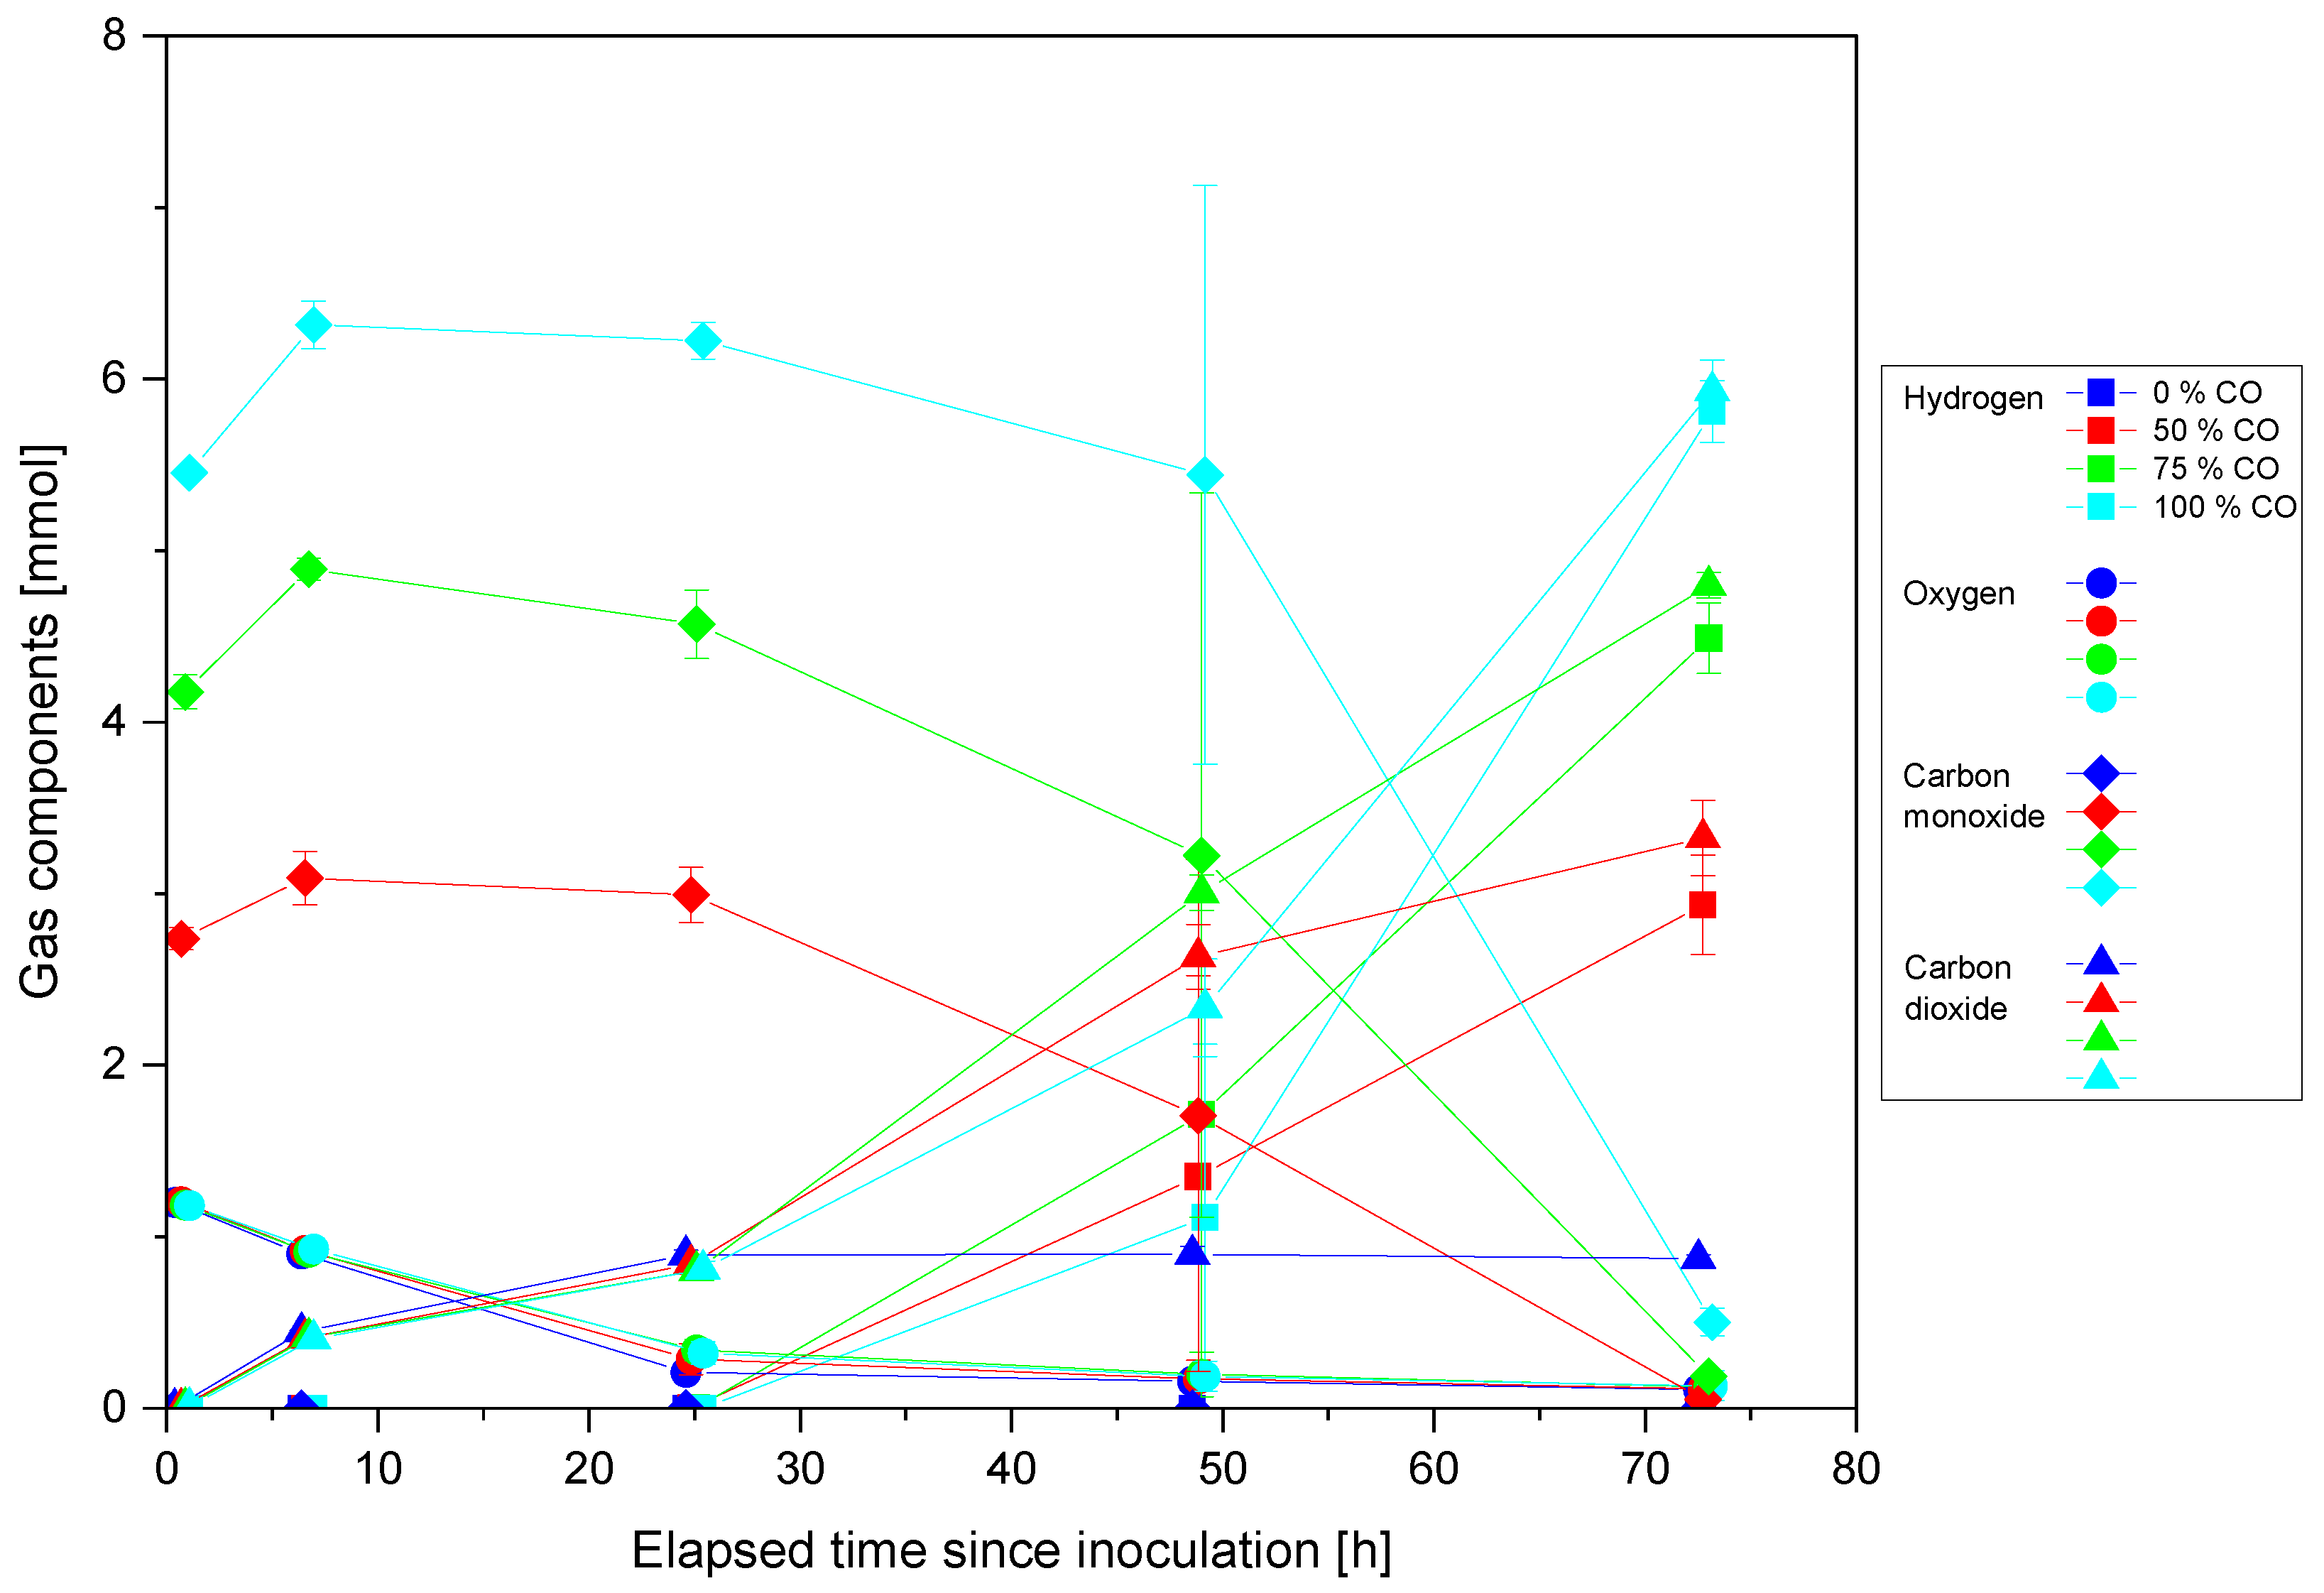
During the initial aerobic growth phase of the cultivation, oxygen consumption was slower in bottles containing CO (Figure 2). Around 48 h after inoculation, 1.39 mmol of CO was consumed in all CO cultures. The highest average consumption rate was observed in the 100% CO bottles with 0.206 mmol/h, followed by the 75% CO with 0.126 mmol/h. The trend observed in CO consumption matched the trend in CO2 and H2 production. At the end of the experiment, at around 73 h, the detected amounts of accumulated hydrogen were 5.811 mmol (100% CO), 4.489 mmol (75% CO), 2.943 mmol (50% CO), and the respective yields 92%, 92%, and 96%. The highest specific hydrogen production rates were detected between 48 and 73 h of cultivation in all bottles, increasing with higher initial CO content. The respective measured values are 1.27 mmol/Lh, 2.21 mmol/Lh, and 3.74 mmol/Lh.
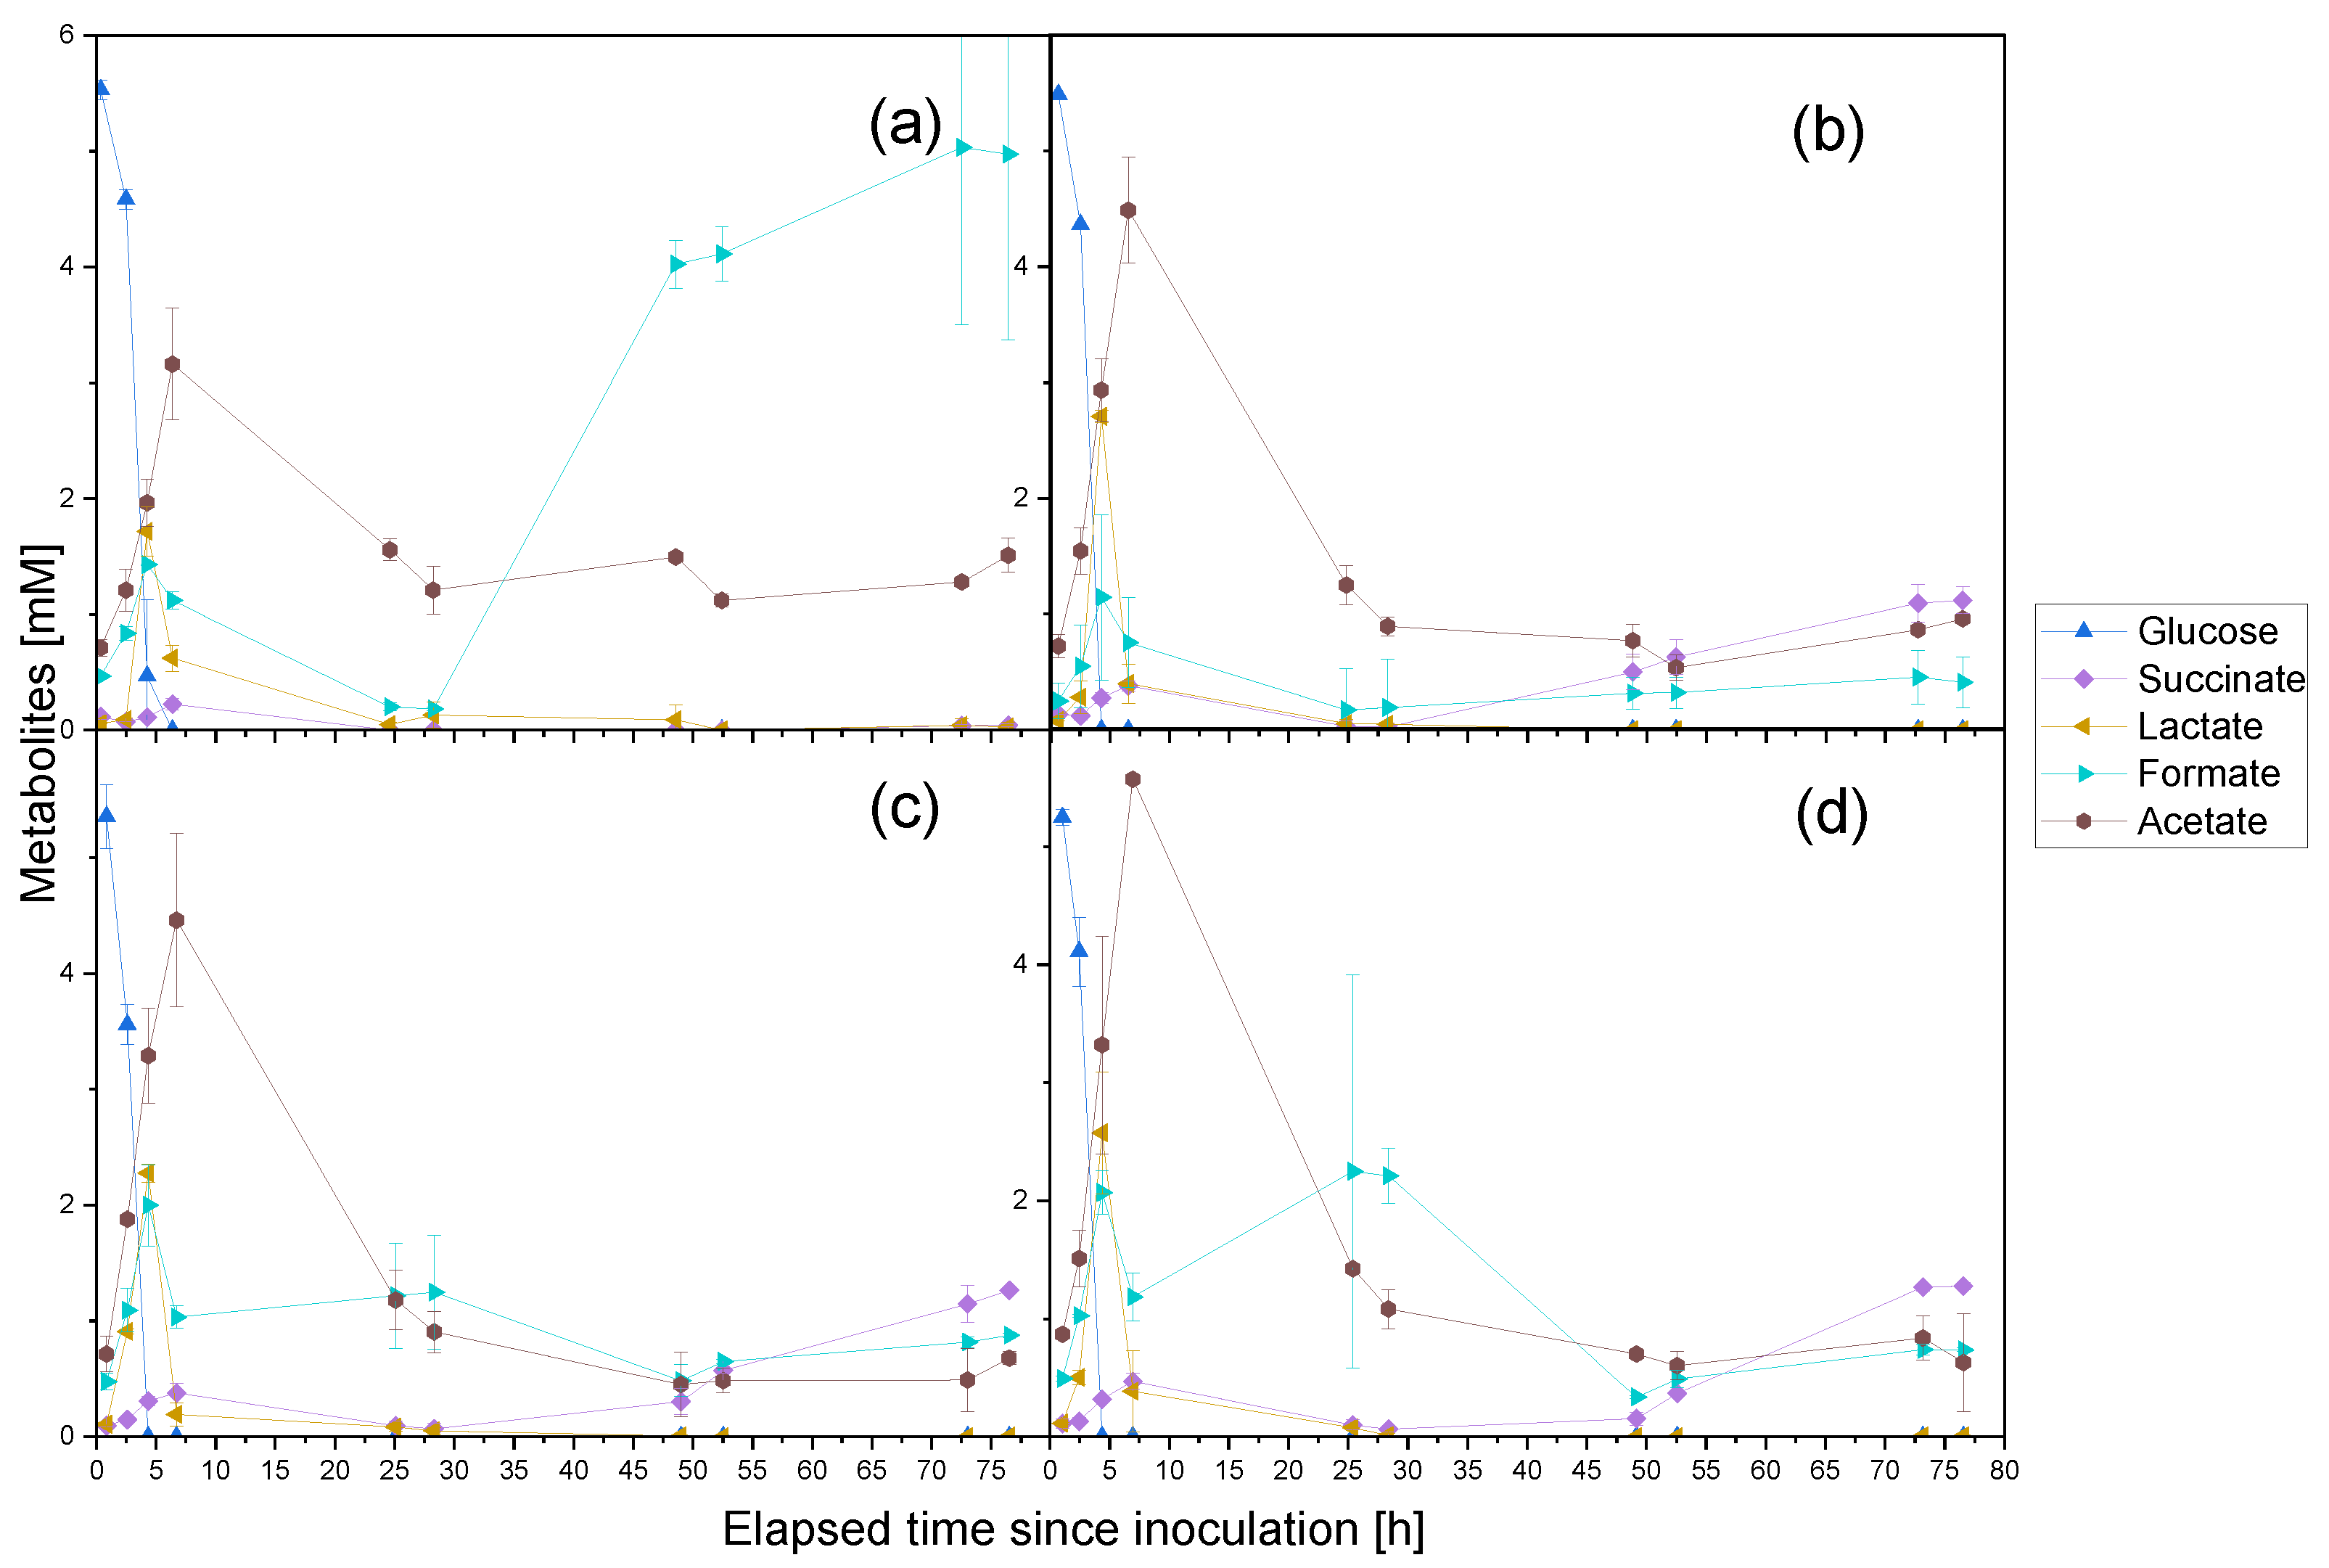
To determine the influence of different concentrations of CO on the metabolism of KP1013, glucose and other intermediates were tracked throughout the cultivation (Figure 3). Glucose consumption during the initial aerobic growth phase was the fastest in CO-containing bottles. For all experiments with CO, glucose was no longer detected after 4 h, while total consumption occurred 2 h later in the bottles without CO. Higher CO concentrations led to higher succinate production in the first 28 h of cultivation. After 28 h, the CO experiments showed a significant increase in the succinate concentration in the medium, whereas only trace amounts of succinate remained in the bottle without carbon monoxide. In general, CO presence led to higher lactic acid peaks 5 h after inoculation. Afterward, the lactic acid was consumed. After 24 h of cultivation, the acetate level in the 0% CO cultures remained relatively stable, whereas, in the bottles containing CO, it kept decreasing with higher initial CO concentrations leading to slightly lower acetate content at the end of the experiment.

3.2. Anaerobic Cultivation of P. thermoglucosidasius DSM 6285 and KP1013 under Varying CO Concentrations at Atmospheric Pressure

Previous studies have characterized CO-oxidation in P. thermoglucosidasius under initial aerobic cultivation conditions. To explore the dynamics of the WGS reaction under anaerobic conditions, we grew DSM 6285 and KP1013 under 0 to 100% initial CO headspace (Figure 4). KP1013 cultures grew to their maximum absorbance value of 0.39 for all the cultures after 6 h of cultivation (Figure 4a). The optical density for all cultures decreased between 8 and 24 h. Unlike in the 0% CO bottles, the absorbance in the bottles with CO increased at the commencement of the WGS reaction, suggesting an active growth activity in the presence of CO. In the latter cultures, the absorbance stabilized at a value of 0.12. Around 24 h post-inoculation, the 75% culture showed the highest optical density of 0.28, followed by the 50% culture with 0.25 and then by the 100% CO with 0.20. By contrast, DSM 6285 cultures grew between 8 and 24 h, with the 50% CO culture showing the highest optical density after 24 h of 0.22 (Figure 4b). The 100% CO bottles showed the highest optical density of 0.260 at about 48 h after inoculation. The final optical densities measured were 0.170, 0.150, 0.120, and 0.040 in order of decreasing initial CO concentration.
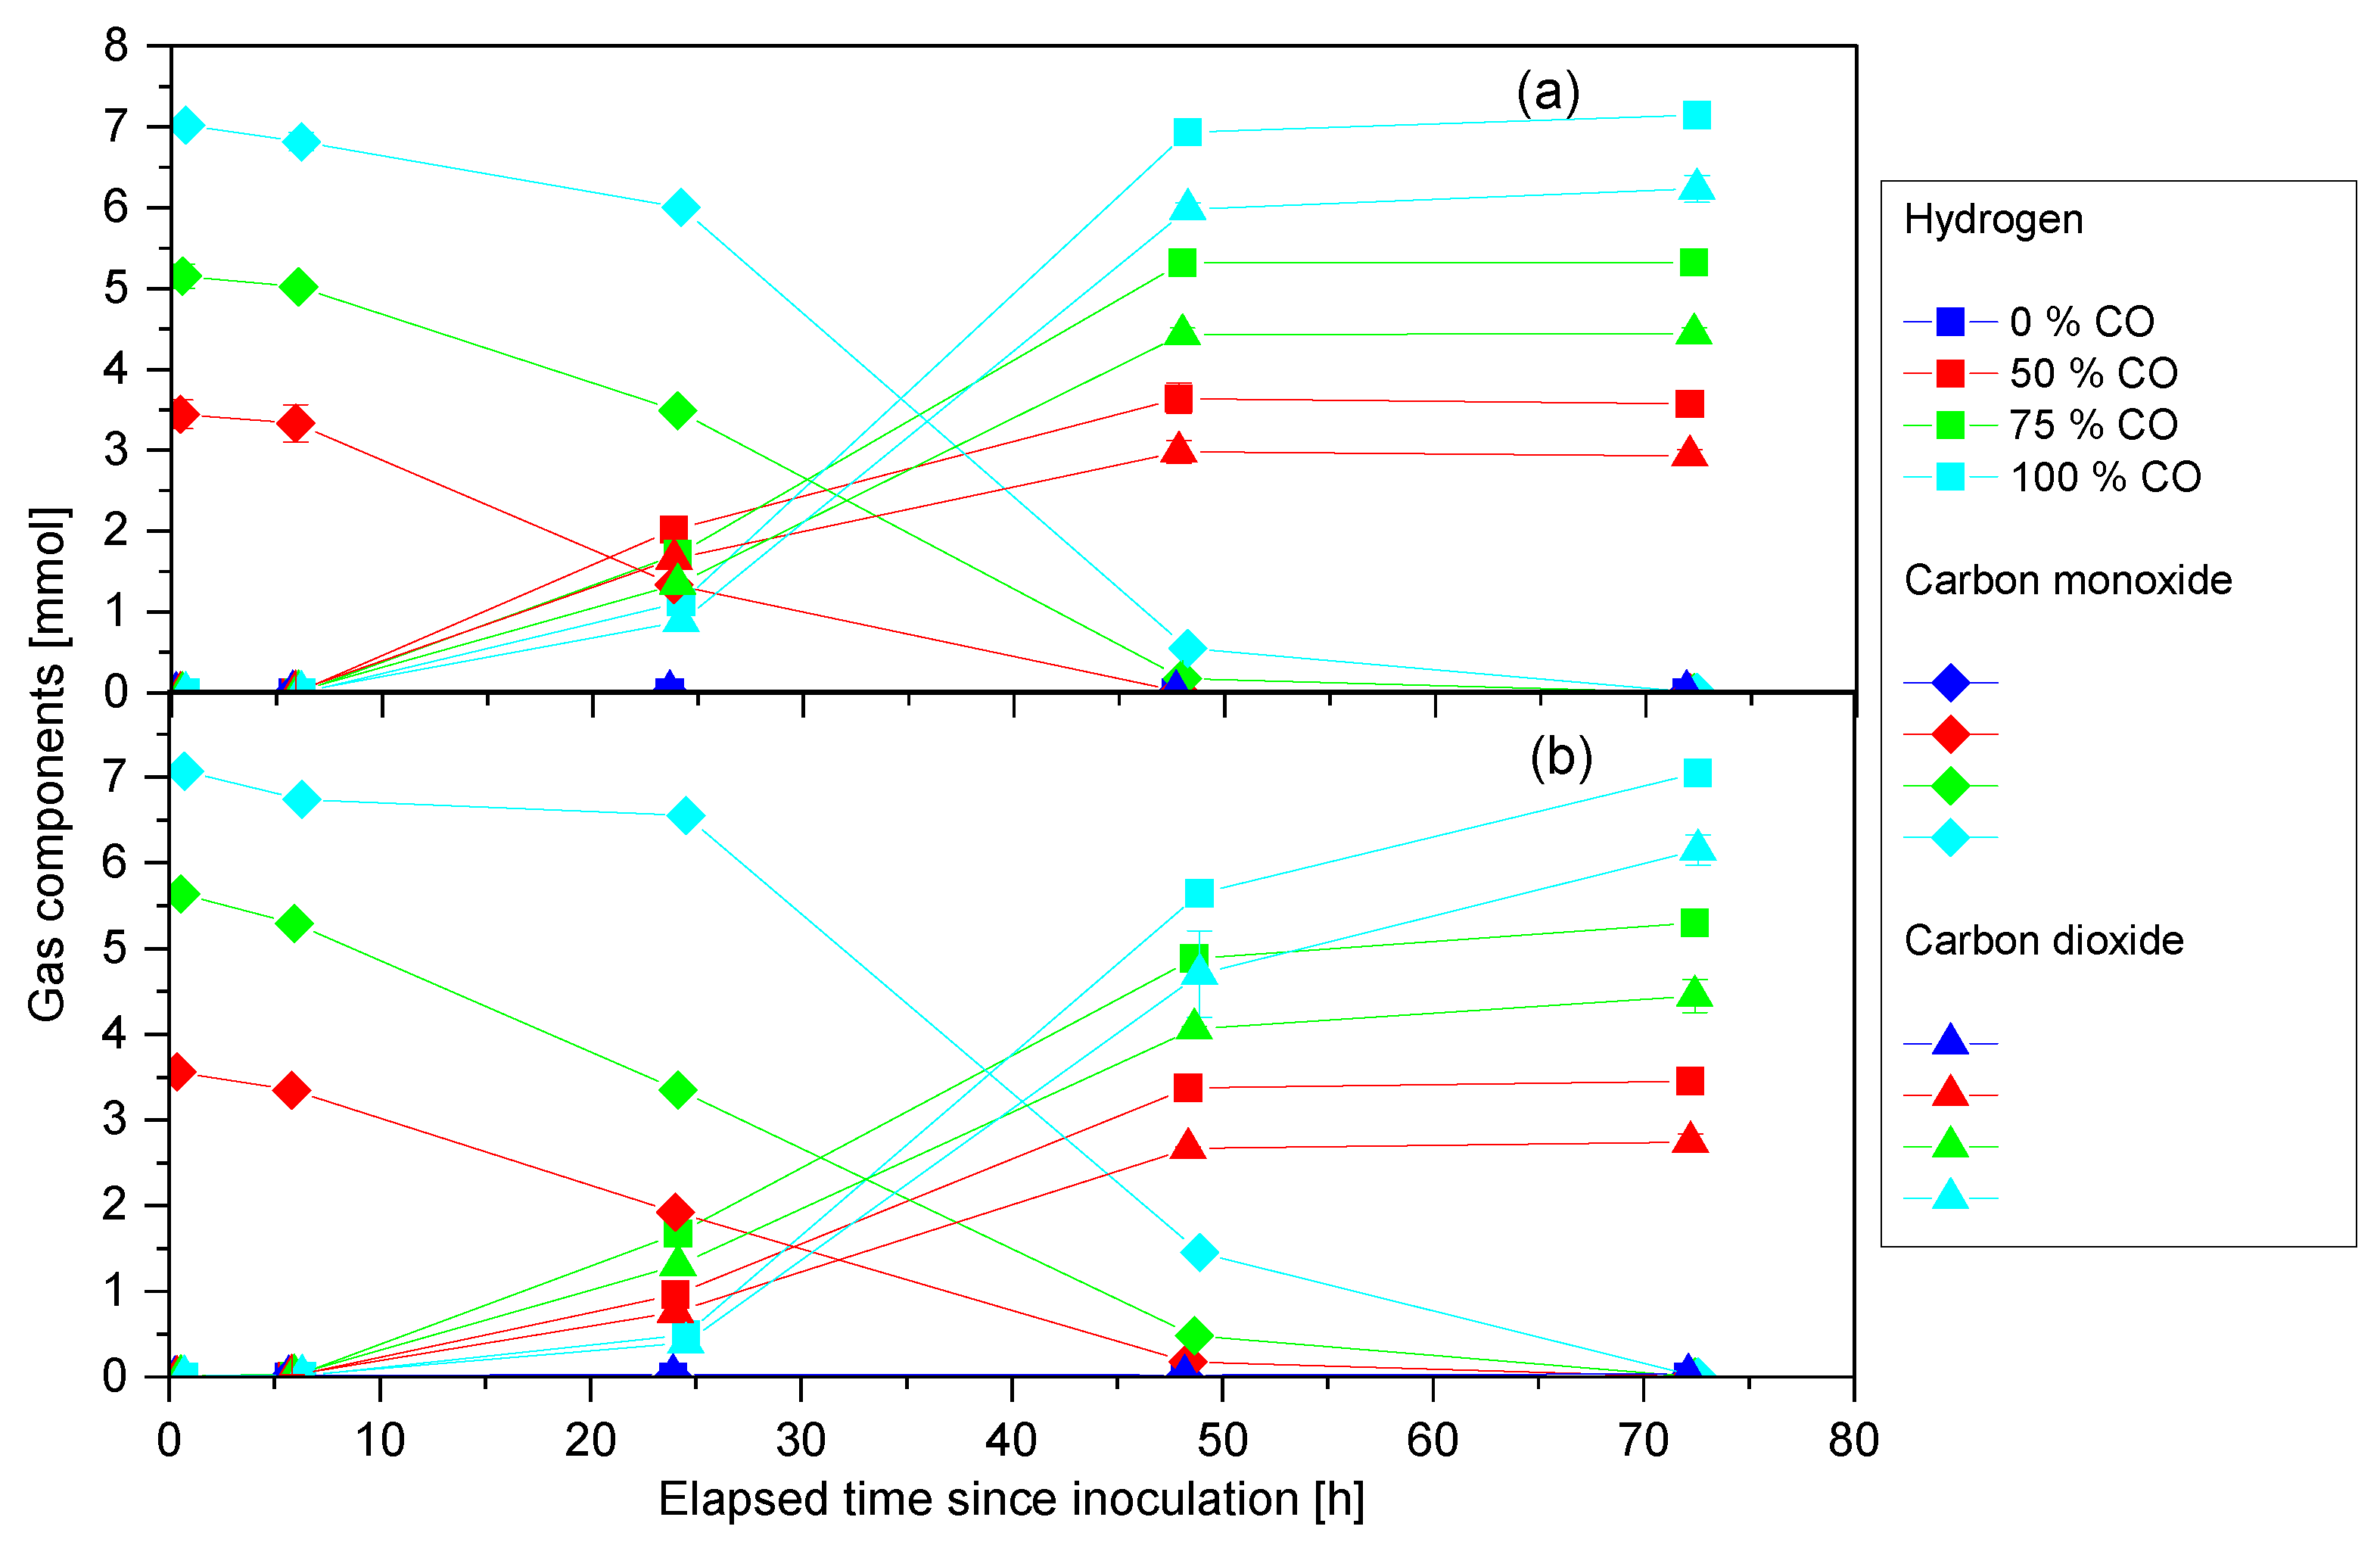
In KP1013, the highest hydrogen amounts after 24 h were achieved by the 50% CO culture (2.017 mmol) followed by the 75% CO culture (1.715 mmol) and the 100% CO culture (1.122 mmol; Figure 5a). The 100% CO cultures showed the highest CO consumption rate, with 0.227 mmol/h, followed by the 75% CO and 50% CO cultures, with 0.138 mmol/h and 0.055 mmol/h, respectively. After 48 h of cultivation, all the CO in the 50% CO bottles was consumed, and in the 75% and 100% CO cultures, respective amounts of 0.176 mmol and 0.549 mmol were still detected. At the end of the experiment at around 72 h, CO was depleted in all bottles, and the detected amounts of accumulated hydrogen were 7.145 mmol (100% CO), 5.322 mmol (75% CO), 3.575 mmol (50% CO), and the respective yields 102%, 103%, and 104%. The highest specific hydrogen production rates for each experiment were detected between 6 and 24 h of cultivation for the 50% CO culture and between 24 and 48 h for the 75% and 100% CO cultures, increasing with higher initial CO content. The respective measured values are 2.12 mmol/Lh, 2.85 mmol/Lh, and 4.58 mmol/Lh.
Like in the cultivation with KP1013, during the first 6 h, the levels of carbon monoxide decreased in DSM 6285 cultures (Figure 5b). At this sampling point, however, the first signs of hydrogen appeared in the bottles. Between 6h and 24h, the consumption rate of CO in the 50% CO bottle was 0.078 mmol/h, and in the 75% CO experiment 0.107 mmol/h. The 100% CO culture consumed the CO at the slowest rate in this time frame with an average consumption rate of 0.010 mmol/h. DSM 6285 started the WGS reaction earlier than KP1013 under the same conditions but showed slower CO conversion rates than KP1013. The 100% CO cultures showed the highest CO consumption rate, with 0.209 mmol/h, followed by the 75% CO and 50% CO cultures with 0.117 mmol/h and 0.072 mmol/h, respectively. At the end of the experiment at around 72 h, there was no more CO measured in the atmosphere, and the detected amounts of accumulated hydrogen were 7.051 mmol (100% CO), 5.299 mmol (75% CO), 3.545 mmol (50% CO) and the respective yields 99.7%, 94%, and 99.6%. Like in the anaerobic experiment with KP1013, the highest specific hydrogen production rates were detected between 6 and 24 h of cultivation for the 50% CO culture and between 24 and 48 h for the 75% and 100% CO cultures, increasing with higher initial CO content. The respective measured values are 1.94 mmol/Lh, 2.56 mmol/Lh, and 4.13 mmol/Lh.
Similar to the O2-containing experiment, the presence of CO in KP1013 led to higher production of succinate (Figure 6). After 28 h, all CO experiments showed a linear increase in the succinate concentration in the medium, whereas the bottles without CO had only trace amounts of succinate. In the end, higher initial CO partial pressures led to higher succinate concentrations. In contrast to the cultivation with initial O2 in the headspace, lactate remained (undepleted) in the anaerobic cultivation medium. The highest lactate end concentration was achieved by the 0% CO experiment, followed very closely by the CO cultures, with higher CO content leading to lower lactate concentration after 72 h. Like in the O2-containing experiment, higher initial CO content led to lower acetate concentrations at the end.
Like in the anaerobic experiment with KP1013, higher CO content led to higher succinate production in DSM 6285, and after 28 h, all CO experiments showed a linear increase in the succinate concentration in the medium (Figure 7). The highest succinate concentration achieved was 2.79 mM with DSM 6285, whereas KP1013 yielded 1.42 mM with the 100% CO culture. Like in the anaerobic cultivation with KP1013, lactate was not depleted from the cultivation medium, albeit at a slower rate than in KP1013. In DSM 6285, the highest lactate concentration peak occurred after 24 h in all the bottles, whereas with KP1013, this happened between six to eight hours after inoculation. In contrast to the anaerobic cultivation with KP1013, none of the acetate concentrations showed their local peak values after 6 h. This was observed later (after 24 h) in the cultivation, with higher peaks in bottles without CO.

3.3. Anaerobic Cultivation of P. thermoglucosidasius KP1013 under Varying Hydrogen Concentrations

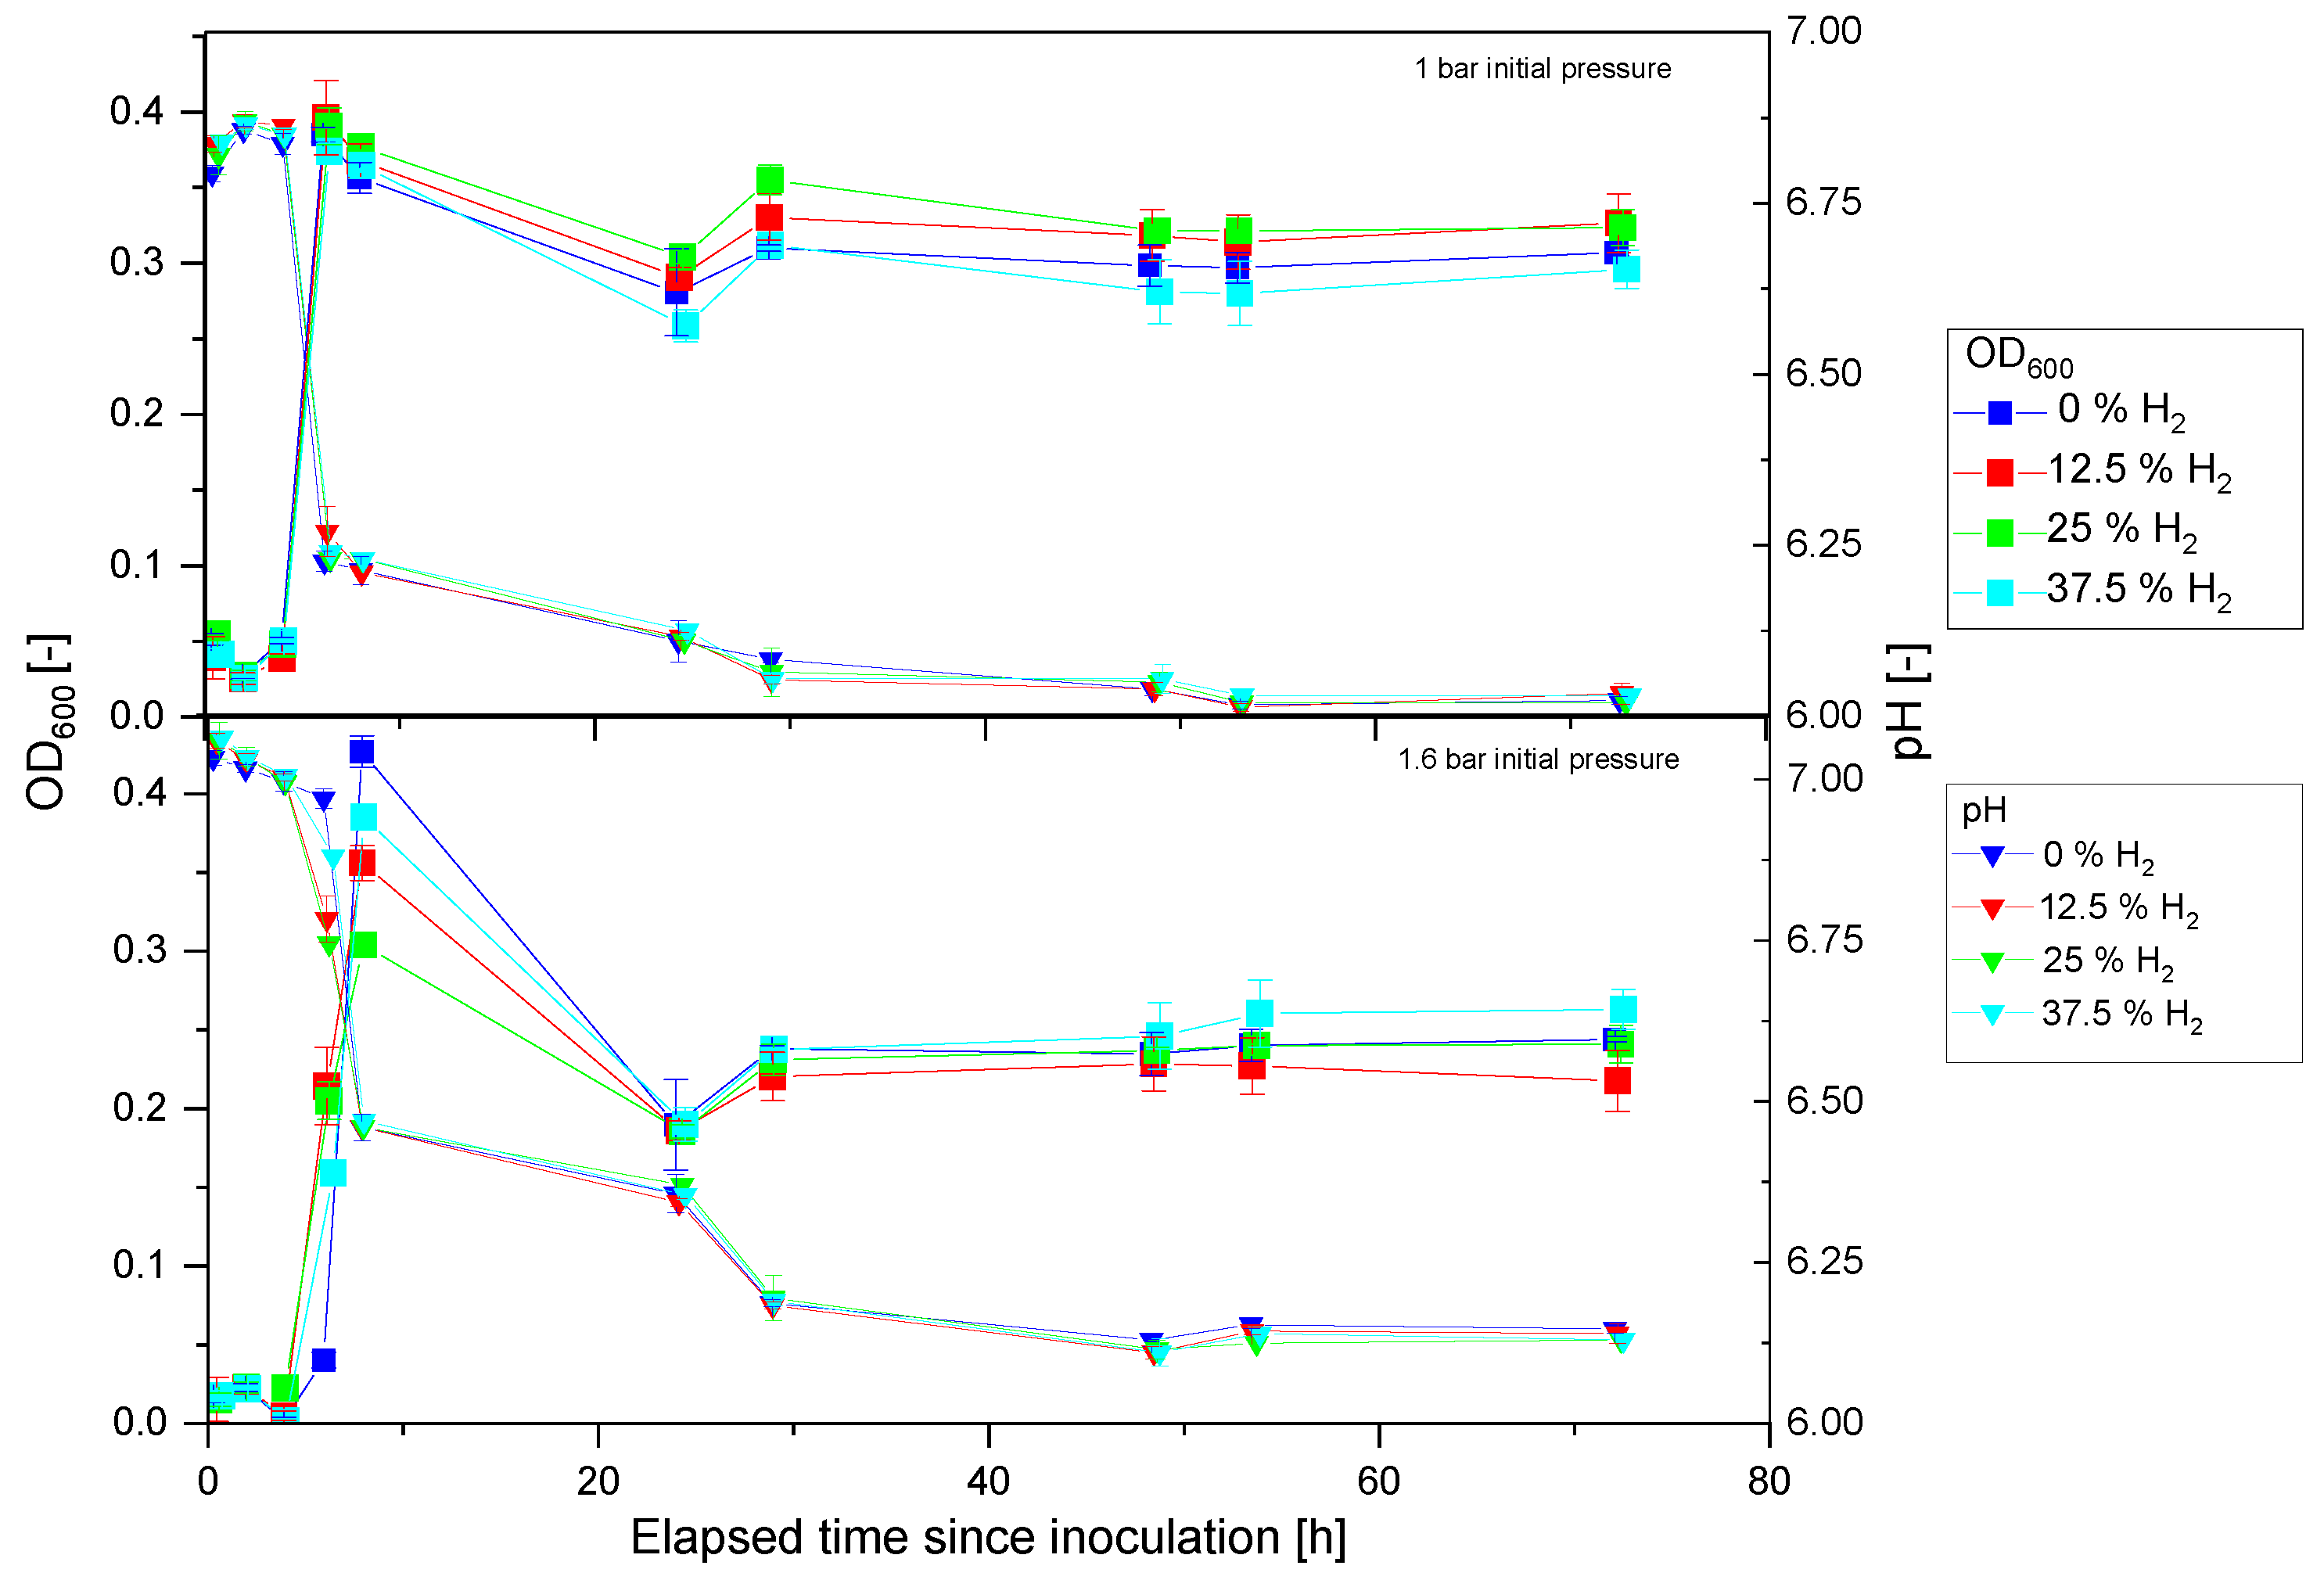
Having understood the dynamics of the WGS reaction in both strains and identifying the superior kinetics of KP1013, we investigated the effects of the product on the process by varying the initial hydrogen pressures. At initial 1 bar pressure, all cultures showed rapid growth between 0 h and 6 h. The maximal average optical density value of 0.39 was measured 6 h after inoculation in all the cultures (Figure 8). At 24 h after inoculation, the 37.5% H2 culture had the lowest average with 0.26, followed by the 0% H2 with 0.28, whereas the highest was measured in the 25% H2 culture, followed by the 12.5% H2 cultures.
In the first 8 h of cultivation, cultures growing under an initial hydrogen pressure of 1.6 bar showed rapid growth in all bottles. The 0% H2 culture showed the fastest growth after 8 h of cultivation based on the observed optical density value of 0.427, followed by the 37.5% H2 culture, with 0.385. The 12.5% and 25% cultures achieved the lowest absorbance values after 8 h of 0.356 and 0.304, respectively. After 24 h of cultivation, the optical density decreased in all cases to 0.190. From 24 to 28 h after inoculation, the cells grew slightly to an OD600 of approx. 0.230.
The calculated starting amounts of carbon monoxide under 1 bar hydrogen pressure were approx. 3.8 mmol for all bottles, whereas the amounts of hydrogen gas were 2.829 mmol, 1.913 mmol, 0.931 mmol, and 0 mmol (Figure 9). Until 48 h after inoculation, the H2 content kept increasing in all cases, showing very similar production rates, except for the 25% culture that slowed down its CO conversion rate. At this sampling point, no CO was detected in the bottles, analog to the other anaerobic KP1013 50% CO experiments. In the last hours of the experiment, hydrogen levels dropped slightly through sampling. The various cultures produced total hydrogen amounts of 3.146 mmol (37.5%), 3.488 mmol (25%), 3.492 mmol (12.5%), and 3.559 mmol (0%). Between 6 and 24 h of cultivation, the 0%, 25%, and 37.5% H2 cultures showed the highest specific hydrogen production rates, and between 24 and 48 h for the 12.5% H2 culture. The measured values in increasing order of initial hydrogen concentration are 1.87 mmol/Lh, 1.75 mmol/Lh, 2.61 mmol/Lh, and 1.778 mmol/Lh.
Under initial 1.6 bar pressure, the CO amounts in the gas phase increased slightly after the first 6 h of cultivation, probably due to the lower temperature during the first measurement (Figure 9). The values after six hours were, therefore, considered the starting values. The calculated starting amounts of carbon monoxide were approx. 4.8 mmol for all bottles, whereas the amounts of hydrogen gas were 3.871 mmol, 2.643 mmol, 1.222 mmol, and 0 mmol. After 24 h, traces of CO remained in the bottles. The maximal amounts of hydrogen produced were 4.526 mmol (37.5%), 4.708 mmol (25%), 4.724 mmol (12.5%), and 4.791 mmol (0%). The highest specific hydrogen production rates were detected between 6 and 24 h of cultivation for the 12.5% and 25% H2 cultures. For the 0% and 37.5% H2 cultures, this was the case between 24 and 48 h. The measured values in increasing order of hydrogen concentration are 2.46 mmol/Lh, 2.50 mmol/Lh, 2.24 mmol/Lh, and 3.04 mmol/Lh.
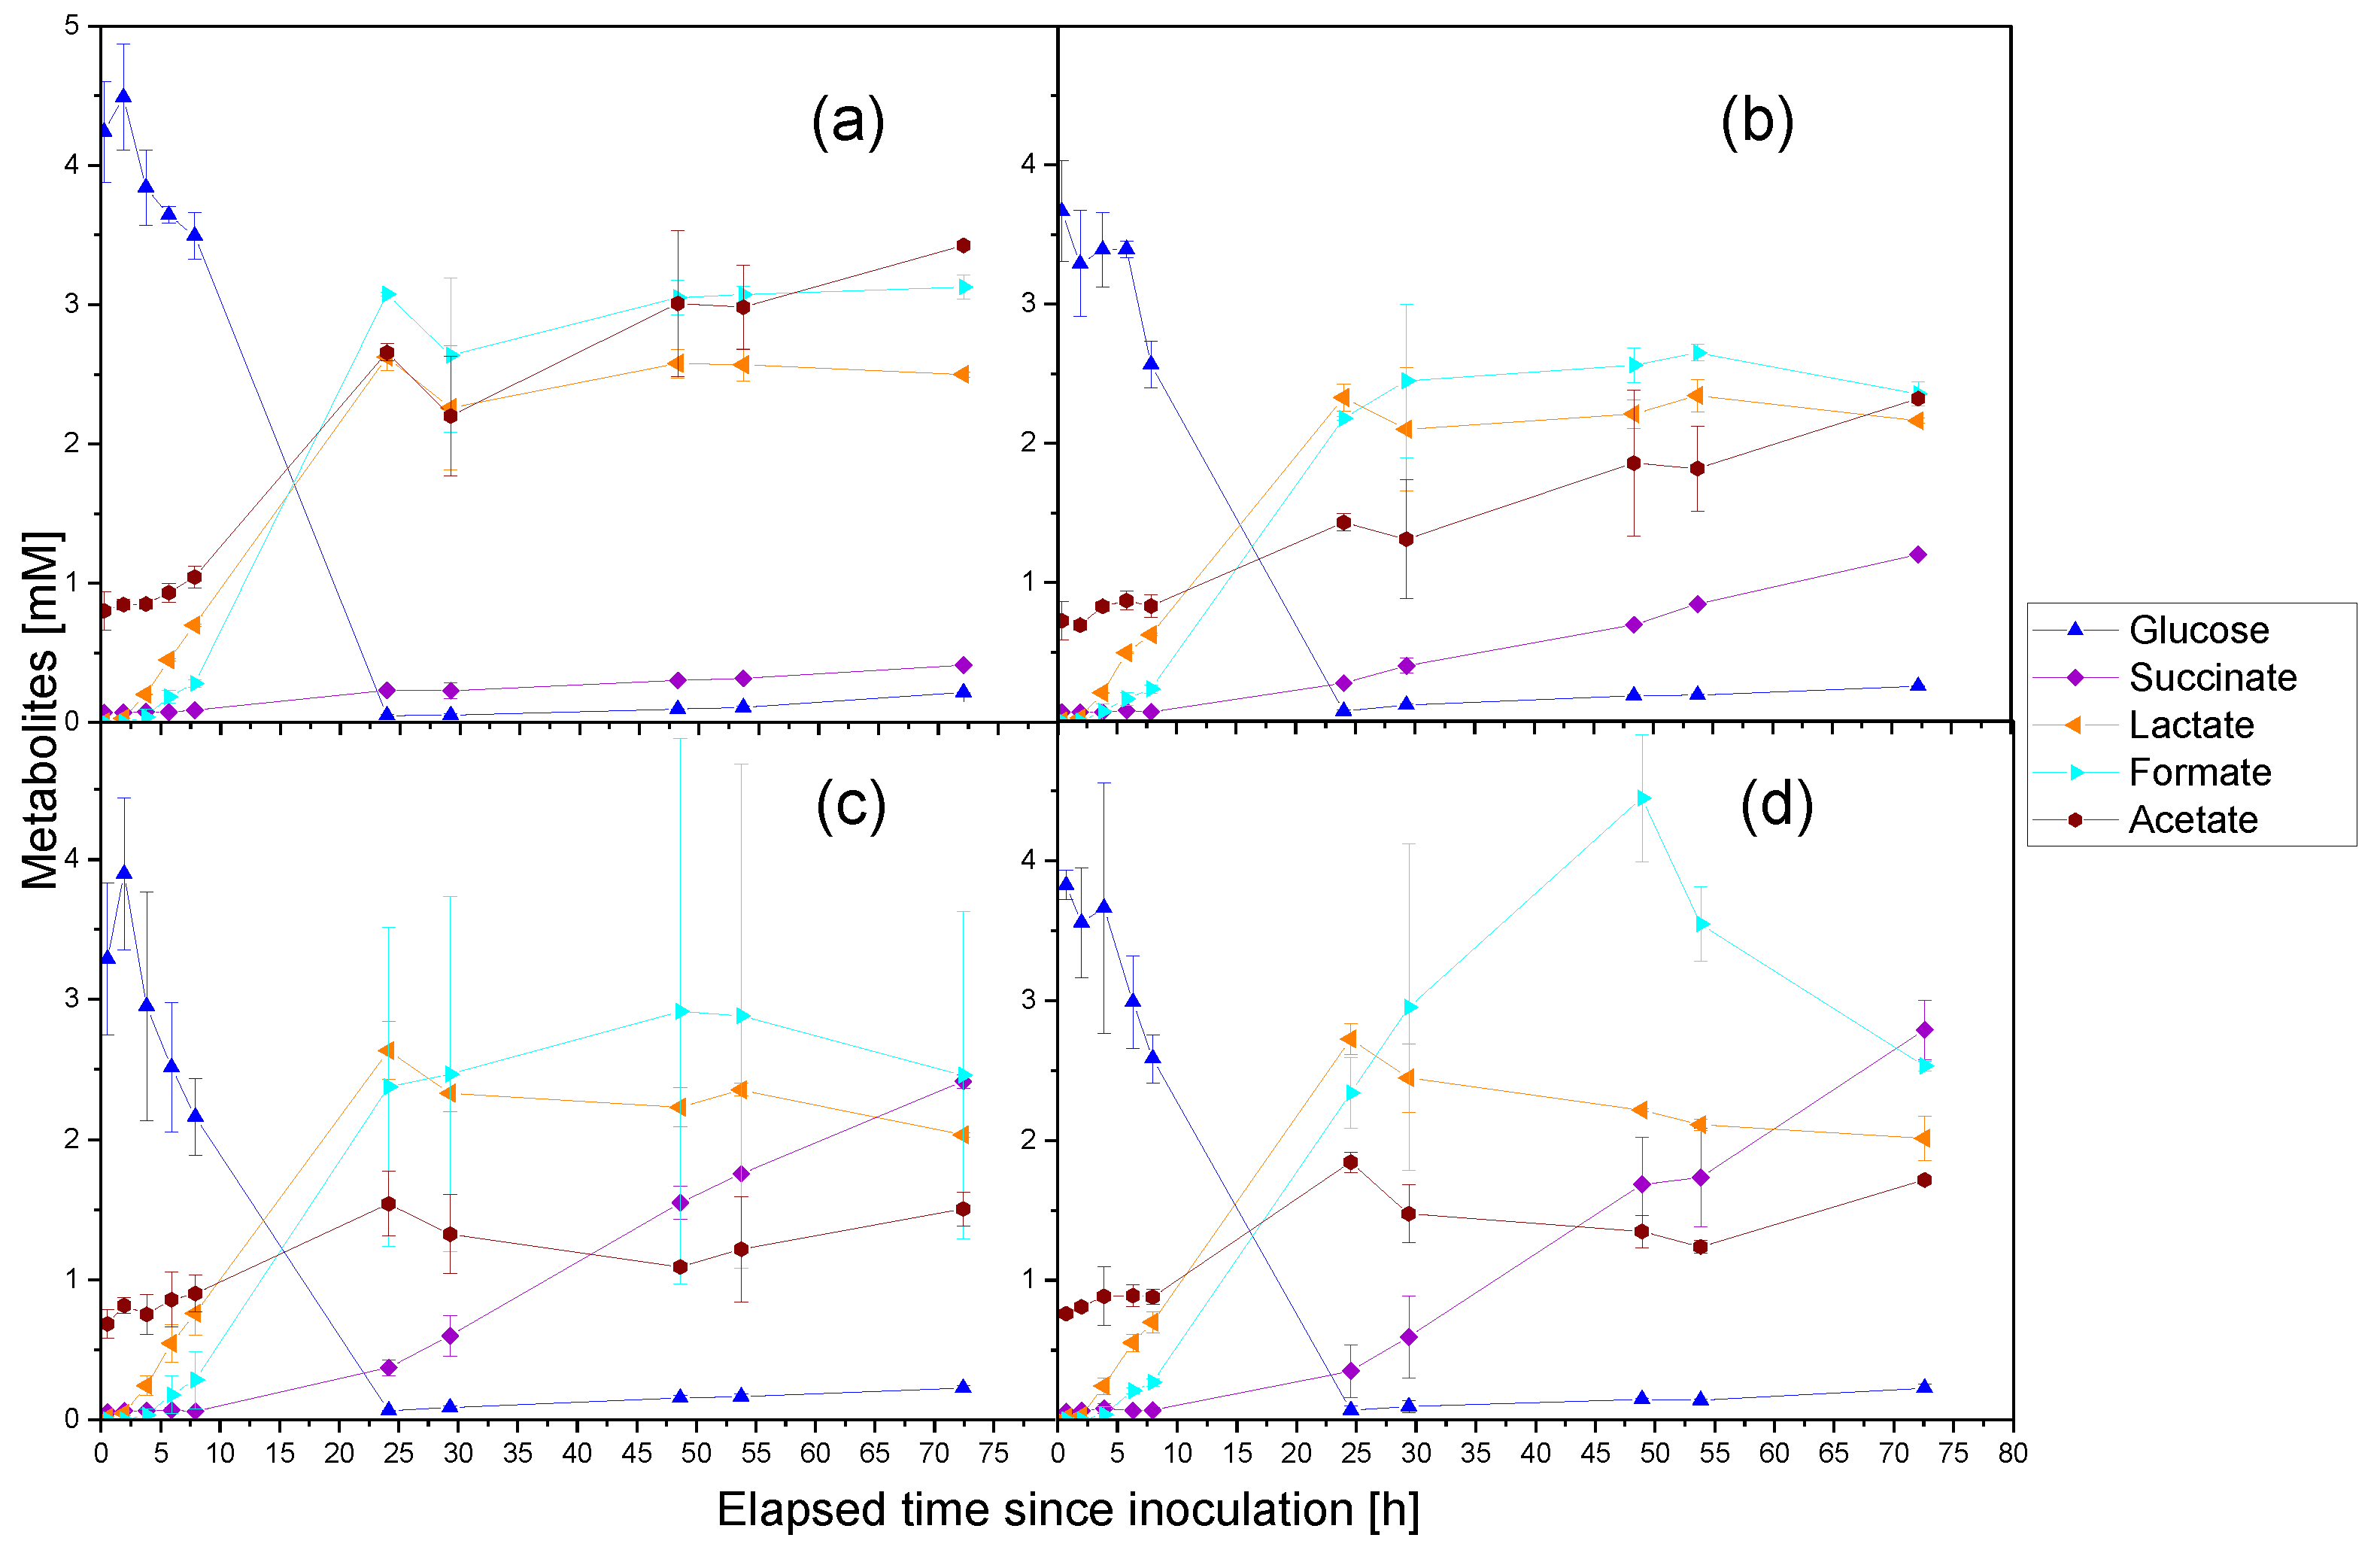
In the experiment at initial atmospheric pressure, succinate concentration increased with time and had approximately the same values for all cultures (Figure 10). However, the end concentration in the 37.5% bottle was the highest (1.18 mM), while in the other bottles, 0.92 mM of succinate accumulated. During the first 8 h of the cultivation, no major differences were detected between the cultures. Hydrogen presence, however, led to slightly higher lactate levels at 8 h. In the end, slightly higher lactate concentrations were measured in the bottles with higher hydrogen partial pressures. All acetate concentrations increased during the WGS reaction phase, with the hydrogen cultures showing higher final acetate concentrations (approx. 4.5 mM) than the culture with no initial hydrogen (approx. 3.13 mM).

4. Discussion

4.1. Carbon Monoxide Induced Rerouting of Carbon Flux during Initial Aerobic Growth Phase

Carbon monoxide inhibits growth and respiration by binding terminal oxidases in aerobic organisms [39]. The data obtained from the current study confirms previous findings in other hydrogenic P. thermoglucosidasius strains such as DSM628, NBRC 107763T, and TG4 [38,40,41], but also suggests that the strain KP1013 interacts differently with CO.
Carbon monoxide enhanced glucose consumption under both initial aerobic (Figure 3) and anaerobic conditions (Figure 6) for KP1013 and DSM 6285, which is consistent with previous findings on the CO cultivation of DSM 6285 in the presence of O2 [38]. Previous studies revealed a rerouting of that carbon flux under micro-aerobic and anaerobic conditions for P. thermoglucosidasius to mixed acid fermentation. This could be due to the repression of the enzymes of the TCA cycle under these conditions [34].
In this study, carbon monoxide induced the rerouting of the carbon flux towards organic acid in the O2-containing cultures (Figure 3). The metabolic intermediates analysis further demonstrated that higher CO contents led to faster consumption of glucose, which results in higher organic acid concentrations during the initial aerobic growth phase. This aligns with the previous suggestion that CO binds to terminal oxidases, thereby acting as a competitor to oxygen [39]. Further support for the occurrence of the CO interaction with terminal oxidases in P. thermoglucosidasius is provided by the absence of the above metabolic shift under anaerobic conditions. This shift results in faster glucose consumption under initial aerobic conditions as pyruvate and Acetyl-CoA pools get converted in one or two steps to lactate, and acetate, rather than going through several additional conversions in the TCA cycle [34,42]. However, this implicates the disadvantage of lower total ATP production since acid fermentation yields less ATP per mole of glucose [43].
However, in the O2-containing 0% CO experiment (Figure 3a), more formate accumulated towards the end of the cultivation (to 5 mM) compared to the CO cultures (<0.85 mM). In P. thermoglucosidasius, formate is produced through pyruvate conversion to Acetyl-CoA and formate by the pyruvate formate lyase [35]. This particular setup raises the question of the pyruvate source for the reaction. The cells have neither carbon monoxide in the gas phase nor is there glucose dissolved in the medium at this stage. The cells could metabolize L-alanine and L-cysteine, included in ASM, to pyruvate through the alanine dehydrogenase generating NADH. L-Serine can also be converted to pyruvate [44]. Alternatively, the observed formate accumulation may be associated with cell lysis and cryptic growth in the latter stages of the cultivation. By contrast, formate production, observed in all O2-containing bottles at 5 h, concomitant with O2 consumption, is a common phenomenon due to the possible occurrence of micro-oxic condition as O2 gets depleted in the liquid phase [45,46]. P. thermoglucosidasius undergoing microaerobic growth produced formate in addition to other fermentation products [34]. Further research is, however, required to elucidate the formate production pathway in P. thermoglucosidasius.
Consistent with previous studies [38], higher initial CO partial pressures also led to lower organic acid concentrations at the end of the cultivation, except for succinate, which accumulated as an end-product (Figure 3, Figure 6, Figure 7 and Figure 10). In the O2-containing 0% CO culture (Figure 3a), succinate is produced in the first 8 h and then depleted, whereas, in the anaerobic experiment without CO, succinate levels stay relatively constant throughout the experiments. Similarly, higher initial CO partial pressures led to higher succinate peaks at 6 h, which might indicate a CO-induced backlog of reducing equivalents. Further, by comparing the O2-containing (Figure 3) and anaerobic experiments (Figure 6, Figure 7 and Figure 10), it becomes apparent that O2 is essential for the re-absorption of succinate. Without available oxygen, the reductive branch of the TCA cycle could be the predominant redox sink [47], leading to succinate accumulation.
Higher initial CO partial pressures resulted in higher OD600 values at the end of the cultivation (Figure 1, Figure 4 and Figure 8), showing that CO contributes to the maintenance and growth of the organism. The [NiFe]-hydrogenase [48] in P. thermoglucosidasius shares high similarity with those found in organisms of the family Thermoanaerobacteraceae [40]. The group 4 hydrogen-evolving hydrogenase in Thermoanaerobacter kivui couples H2 production to the ion gradient across the membrane [20]. Consequently, the backflow of ions with the membrane potential through an ATP-ase could provide the cells of P. thermoglucosidasius with energy. This likely supplies the energy for metabolic processes during the observed growth under the WGS reaction. However, further investigation will elucidate the mechanism of the energy-conserving hydrogenase in P. thermoglucosidasius.
Higher initial CO partial pressure meant lower final pH due to higher accumulation of organic acids and, possibly, dissolved CO2 in the medium (Figure 1 and Figure 4). CO2 can spontaneously react with water to carbonic acid and increase the acidity of the medium [49]. This could also explain why this effect is more notable towards the end of the experiment when the 50% cultures have already converted most of the carbon monoxide in the headspace, and the higher CO cultures are still producing CO2 (Figure 2 and Figure 5). Further supporting the latter notion is the observed deviation in the stoichiometry of the WGS reaction, with less than the expected amount of CO2 produced. CO2 is more soluble in water than H2 [50] under the same conditions. P. thermoglucosidasius genomes, however, harbor a carbonic anhydrase gene, upstream of the cooC [51]. This enzyme catalyzes the inter-conversion of CO2 into bicarbonate and protons. The reaction potentially serves as a buffering mechanism for different physiological processes [52]. However, it is unclear if all the CO2 carbon missing from the gas phase dissolves in the medium, and no carbon fixing pathway from CO has been described in P. thermoglucosidasius.

4.2. Hydrogen Enhanced P. thermoglucosidasius Growth and Does Not Inhibit the WGS Reaction at High Temperature

Previous studies have demonstrated hydrogen inhibition of growth, substrate consumption, and hydrogen production in other organisms [10,11,12]. Our analysis, however, showed that hydrogen exerts the opposite influence on the growth and WGS reaction kinetics in P. thermoglucosidasius.
The cultivation of KP1013 under different H2 concentrations revealed no difference in the rapid growth phase under anaerobic conditions at initial atmospheric pressure (Figure 8). However, the optical density measurements showed minor differences, with the two middle hydrogen concentration cultures showing higher OD600 values. This suggests that higher hydrogen concentrations within a certain threshold enhance biomass formation. OD600 measurements in P. thermoglucosidasius, however, underestimates biomass amounts since the cells form clumps. Therefore, taking the standard deviation of the measurements into account, no significant influence on the system is seen at initial atmospheric pressure.
Conversely, at 1.6 bar initial pressure, clear differences were observed in the optical densities in the first 8 h of the experiment. The bacterial growth appears to benefit from the presence of hydrogen after 6 h of cultivation (Figure 8). However, after 8 h of cultivation, the opposite trend was detected. This suggests that higher hydrogen partial pressures influence the growth of the organism during the glucose consumption phase. During the WGS reaction phase, no significant influence of hydrogen on cell growth was detected. No major influence on H2 production was observed as hydrogen content increased, except for the highest hydrogen-containing bottle (Figure 9). This is consistent with previous reports that H2 inhibition begins at high partial pressures [10,11,12]. However, the conversion rate of CO increased during the second half of the experiment, which contradicts this idea, since hydrogen content increased even further during this time. This observation suggests that high hydrogen concentrations only extend the lag phase to the WGS reaction but have no inhibitory interaction with the pathway. Sinharoy et al. reported strong inhibition of biomass growth and hydrogen production at mesophilic temperature (30 °C) in experiments containing 0.5 to 4.5 mmol/L of hydrogen and 3.1 mmol/L CO in the gas phase. The authors reported a maximal H2 production rate of 0.14 mmol/Lh under an initial CO concentration of 5.12 mmol/L in the gas phase without initial hydrogen [10]. In both scenarios, H2 inhibited biomass growth and its production via the WGS reaction with a critical inhibitory concentration of 5.11 mmol/L in the gas phase [10]. The above-mentioned mixed culture obtained a maximum H2 yield of 70.8% from CO after 120 h of cultivation [10].
Interestingly, in the current work under a higher temperature (at 60 °C), with an initial hydrogen concentration of 15.54 mmol/L (37.5% H2 at 1.6 bar) in the gas phase, a maximal hydrogen production rate of 3.04 mmol/Lh was recorded with the only limiting factor being the substrate (CO) availability. The H2 yield from CO decreased slightly from 100% to 94% as the initial hydrogen concentration increased at 1.6 bar under complete utilization of CO after 72 h.
Van Niel et al. described the product inhibition by hydrogen in the extreme thermophile Caldicellulosiruptor saccharolyticus at 70 °C [12]. Growth of C. saccharolyticus and H2-production ceased at a hydrogen concentration of 27.7 mmol/L in the gas phase [12]. Ljunggren et al. modeled the effect of hydrogen on the reaction kinetics of H2 production in C. saccharolyticus, giving a critical dissolved hydrogen concentration of 2.2 mmol/L as a result [11] and a maximal hydrogen production rate of 10.7 mmol/Lh. However, it must be taken into consideration that C. saccharolyticus was cultivated in a 3 L reactor with pH regulation and N2 stripping, and this organism produces hydrogen from organic carbon source [11].
As discussed in [11], the dissolved H2(aq) concentration represents the critical factor driving the observed inhibitory effects of H2. Van Niel et al. determined the critical H2(aq) concentration to be 0.500 mmol/L at 70 °C and atmospheric pressure during cultivation with C. saccharolyticus [12]. In the current work, the maximal H2(aq) of 0.774 mmol/L was estimated at 1.2 bar hydrogen pressure and 60 °C from Henry’s law solubility constant = 6.47 × 10 6 mol/m 3 Pa [53,54]. No obvious inhibition of biomass growth or hydrogen production occurred up to 8.0 mmol H2 in the headspace and H2(aq) of 0.774 mmol/L, both of which fall above the respective critical inhibitory concentrations, 5.11 mmol/L and 0.0269 mmol/L, reported under mesophilic conditions [10]. These suggest that, in a batch process, stripping hydrogen with nitrogen gas is not a prerequisite for the reaction to proceed at the same rate. These results, alongside the other experiments mentioned, present an example of how thermophilic conditions could benefit the production kinetics of biohydrogen [15].
Hydrogen presence led to a higher final acetate concentration in the medium (+1.3 mM) (Figure 10). The difference increased after 53 h, when cultures with higher hydrogen contents kept on producing acetate, whereas the acetate concentration in the 0% H2 decreased slightly. This could indicate that hydrogen concentration influences the production of organic acids in this species. Two other species belonging to the family Bacillaceae possess orthologous [Ni-Fe] group 2a uptake hydrogenase loci. One of them, Hydrogenibacillus schlegelii, a thermophilic and facultatively chemolithoautotrophic bacterium, can oxidize molecular hydrogen [55]. However, the function of the group 1d and 2a hydrogenases in P. thermoglucosidasius remain unclear and seem unrelated to hydrogen oxidation. Previous reports suggest that group 2a hydrogenases likely regulate hydrogen flux [56].

4.3. Initial Aerobic vs. Anaerobic Cultivation of P. thermoglucosidasius for WGS Reaction-Based Hydrogen Production

Previous studies focused on the metabolism of P. thermoglucosidasius DSM 6285 while undergoing the WGS reaction. After consuming glucose aerobically, the bacteria started consuming most of the acids they produced. In contrast, succinate accumulates as a metabolic end-product. The lag phase before the WGS reaction was around 34 h for the bottles with 25, 50, and 75% CO, whereas, for the 100% CO bottle, it was around 59 h. The cultures grown under CO atmospheres adapted and used the WGS-reaction for maintenance and growth to an OD600 of around 1 [38]. Using a minimal B media supplemented with 0.1% yeast extract, Adachi et al. showed that under 100% CO atmosphere, P. thermoglucosidasius NBRC 107763 commenced the WGS reaction after 40 h, albeit attaining a maximum OD600 of around 0.25 after 100 h of cultivation [41].
The WGS reaction is an anaerobic process, and oxygen influences the reaction negatively due to its toxicity to the CO dehydrogenase [15]. In this work, we report the anaerobic growth of strains KP1013 and DSM 6285 under glucose consumption before the water gas shift reaction for the first time. As a result, the lack of oxygen in the system shortened the lag phase to the WGS reaction from 34 h [38] to 8 h after inoculation in KP1013 (Figure 5). Likewise, this represents a significant reduction in the lag phase compared to previously reported anaerobic cultivation, for instance, 40 h in [41]. It remains unclear whether the observed shortened lag phase to the WGS reaction phase is due to intraspecific physiological differences or improved cultivation conditions.
As expected, the current study revealed greater maximal OD600 values starting with aerobic conditions (Figure 1). With increasing carbon monoxide concentrations, the carbon flux was progressively rerouted towards mixed acid fermentation under initial aerobic conditions (Figure 3), whereas no metabolic shift occurred under anaerobic conditions (Figure 6). Previous studies show that under initial aerobic conditions, the carbon flux in P. thermoglucosidasius is channelled mainly through the TCA-cycle [34]. The growth rate and the carbon fluxes through the TCA cycle, and the pentose phosphate pathway are greater under these conditions, which is consistent with the observations of this work. The cells produce acetate if the carbon source is in excess to keep producing ATP from acetyl-CoA while the carbon flux exceeds the TCA-cycle capacities [34]. By contrast, the cells channel the carbon flux towards mixed acid production under anaerobic conditions. The cells produce acetate, lactate, formate, ethanol, and succinate under these conditions, and the TCA-cycle is used mostly for biosynthesis [34]. In P. thermoglucosidasius KP1013, CO seems to gradually shift the metabolism towards pathways normally observed under anaerobic conditions.
Furthermore, oxygen presence is key in the subsequent depletion of the organic acids produced from glucose in the initial growth phase of the cultivation, a product of a combination of overflow-metabolism and CO blockage of terminal oxidases [34,39]. Higher initial CO partial pressures led to increased consumption of organic acids in the medium (Figure 3, Figure 6 and Figure 7). This suggests that CO conversion supplies additional energy for rerouting carbon from acetate into the central carbon metabolism to form biomass. This process seems to rely on O2 since acetate consumption occurred only present in the O2-containing cultures (Figure 3). The conversion of acetate to Acetyl-CoA in E. coli can occur in one or two steps and requires ATP. The cells can incorporate Acetyl-CoA into the central carbon metabolism [57].
In this work, subsequent consumption of the produced acids was only observed in the culture with O2 in the initial gas atmosphere (Figure 3), which is consistent with previous studies [38]. The assimilation of lactate only under initial aerobic conditions could indicate the expression of the LutA-C protein complex genes present in P. thermoglucosidasius [38]. These sulfur-containing proteins that utilize lactate are proven to be active in Bacillus subtilis and require the presence of oxygen as the terminal electron acceptor [58].

5. Conclusions

This work has shed light on the influence of carbon monoxide and hydrogen on the water gas shift reaction, the growth, and the metabolism of P. thermoglucosidasius. Previous studies have reported adverse effects of hydrogen, at certain thresholds, on the metabolism of hydrogen-producing bacteria. Our data, however, showed that different initial hydrogen partial pressures and dissolved hydrogen of up to 0.806 mmol/L had no inhibitory effects on the growth and kinetics of the water gas shift reaction in P. thermoglucosidasius. On the other hand, carbon monoxide induces organic carbon flux rerouting towards organic acids only under initial aerobic conditions, with higher initial CO partial pressures leading to higher cell densities and lower organic acid concentrations (except for succinate). Combined, the above properties and the capacity of P. thermoglucosidasius to thrive under both aerobic and anaerobic conditions presents a clear biotechnological prospect for various applications. Subsequent studies would benefit from optimizing fermentation strategies that combine the advantages of a robust biomass build-up and an effective WGS reaction under initial aerobic and anaerobic conditions, respectively. Specifically, strain KP1013 demonstrated faster WGS reaction kinetics, higher tolerance to carbon monoxide, and builds more biomass (based on OD600) under the same conditions compared to strain DSM 6285. Thus, the strain offers a starting point for optimizing the biological water gas shift reaction. P. thermoglucosidasius can produce thermostable enzymes capable of breaking down complex substrates. In the future, a process involving initial aerobic growth on organic waste material could provide the required initial biomass and a by-product of interest in the liquid phase. In a subsequent step, oxidation of carbon monoxide under the water gas shift reaction could provide cheap hydrogen.

Author Contributions

Conceptualization, H.A.; methodology, D.B.D.; software, D.B.D.; formal analysis, D.B.D.; investigation, A.N. and H.A.; resources, A.N.; writing—original draft preparation, D.B.D.; writing—review and editing, A.N., D.B.D. and H.A.; visualization, D.B.D.; supervision, H.A.; project administration, A.N. All authors have read and agreed to the published version of the manuscript.

Funding

This research received no external funding. The APC was funded by Deutsche Forschungsgemeinschaft and the KIT-Publication Fund of the Karlsruhe Institute of Technology.

Institutional Review Board Statement

Not applicable.

Informed Consent Statement

Not applicable.

Data Availability Statement

Data is contained within the article.

Conflicts of Interest

The authors declare no conflict of interest.

References

  1. Winter, C.J. Hydrogen energy—Abundant, efficient, clean: A debate over the energy-system-of-change. Int. J. Hydrogen Energy 2009, 34, S1–S52. [Google Scholar] [CrossRef]
  2. Marchenko, O.; Solomin, S. The future energy: Hydrogen versus electricity. Int. J. Hydrogen Energy 2015, 40, 3801–3805. [Google Scholar] [CrossRef]
  3. Matar, S. Preface to First Edition. In Chemistry of Petrochemical Processes, 2nd ed.; Matar, S., Hatch, L.F., Eds.; Gulf Professional Publishing: Woburn, MA, USA, 2001; pp. xiii–xvi. [Google Scholar] [CrossRef]
  4. BP. BP Statistical Review of World Energy 2020; BP Plc: London, UK, 2020; pp. 1–6. Available online: https://www.bp.com/content/dam/bp/business-sites/en/global/corporate/pdfs/energy-economics/statistical-review/bp-stats-review-2020-full-report.pdf (accessed on 20 September 2022).
  5. Höök, M.; Tang, X. Depletion of fossil fuels and anthropogenic climate change—A review. Energy Policy 2013, 52, 797–809. [Google Scholar] [CrossRef] [Green Version]
  6. Møller, K.T.; Jensen, T.R.; Akiba, E.; Li, H.W. Hydrogen-A sustainable energy carrier. Prog. Nat. Sci. Mater. Int. 2017, 27, 34–40. [Google Scholar] [CrossRef]
  7. Momirlan, M.; Veziroglu, T. Current status of hydrogen energy. Renew. Sustain. Energy Rev. 2002, 6, 141–179. [Google Scholar] [CrossRef]
  8. Armaroli, N.; Balzani, V. The Hydrogen Issue. ChemSusChem 2011, 4, 21–36. [Google Scholar] [CrossRef] [PubMed]
  9. Su, X.; Zhao, W.; Xia, D. The diversity of hydrogen-producing bacteria and methanogens within an in situ coal seam. Biotechnol. Biofuels 2018, 11, 245. [Google Scholar] [CrossRef] [PubMed]
  10. Sinharoy, A.; Baskaran, D.; Pakshirajan, K. Sustainable biohydrogen production by dark fermentation using carbon monoxide as the sole carbon and energy source. Int. J. Hydrogen Energy 2019, 44, 13114–13125. [Google Scholar] [CrossRef]
  11. Ljunggren, M.; Willquist, K.; Zacchi, G.; van Niel, E.W. A kinetic model for quantitative evaluation of the effect of hydrogen and osmolarity on hydrogen production by Caldicellulosiruptor saccharolyticus. Biotechnol. Biofuels 2011, 4, 31. [Google Scholar] [CrossRef]
  12. van Niel, E.W.J.; Claassen, P.A.M.; Stams, A.J.M. Substrate and product inhibition of hydrogen production by the extreme thermophile, Caldicellulosiruptor saccharolyticus. Biotechnol. Bioeng. 2003, 81, 255–262. [Google Scholar] [CrossRef] [Green Version]
  13. Hallenbeck, P.C.; Benemann, J.R. Biological hydrogen production; fundamentals and limiting processes. Int. J. Hydrogen Energy 2002, 27, 1185–1193. [Google Scholar] [CrossRef]
  14. Levin, D.B.; Pitt, L.; Love, M. Biohydrogen production: Prospects and limitations to practical application. Int. J. Hydrogen Energy 2004, 29, 173–185. [Google Scholar] [CrossRef]
  15. Alfano, M.; Cavazza, C. The biologically mediated water–gas shift reaction: Structure, function and biosynthesis of monofunctional [NiFe]-carbon monoxide dehydrogenases. Sustain. Energy Fuels 2018, 2, 1653–1670. [Google Scholar] [CrossRef]
  16. Kung, Y.; Drennan, C.L. A role for nickel–iron cofactors in biological carbon monoxide and carbon dioxide utilization. Curr. Opin. Chem. Biol. 2011, 15, 276–283. [Google Scholar] [CrossRef] [PubMed] [Green Version]
  17. Soboh, B.; Linder, D.; Hedderich, R. Purification and catalytic properties of a CO-oxidizing: H2-evolving enzyme complex from Carboxydothermus hydrogenoformans. Eur. J. Biochem. 2002, 269, 5712–5721. [Google Scholar] [CrossRef]
  18. Maness, P.C.; Huang, J.; Smolinski, S.; Tek, V.; Vanzin, G. Energy Generation from the CO Oxidation-Hydrogen Production Pathway in Rubrivivax gelatinosus. Appl. Environ. Microbiol. 2005, 71, 2870–2874. [Google Scholar] [CrossRef] [Green Version]
  19. Welte, C.; Deppenmeier, U. Chapter thirteen—Proton Translocation in Methanogens. In Methods in Methane Metabolism, Part A; Rosenzweig, A.C., Ragsdale, S.W., Eds.; Academic Press: Cambridge, MA, USA, 2011; Volume 494, pp. 257–280. [Google Scholar] [CrossRef]
  20. Schoelmerich, M.C.; Müller, V. Energy conservation by a hydrogenase-dependent chemiosmotic mechanism in an ancient metabolic pathway. Proc. Natl. Acad. Sci. USA 2019, 116, 6329–6334. [Google Scholar] [CrossRef] [Green Version]
  21. Angenent, L.T.; Karim, K.; Al-Dahhan, M.H.; Wrenn, B.A.; Domíguez-Espinosa, R. Production of bioenergy and biochemicals from industrial and agricultural wastewater. Trends Biotechnol. 2004, 22, 477–485. [Google Scholar] [CrossRef]
  22. Rittmann, S.K.M.; Lee, H.S.; Lim, J.K.; Kim, T.W.; Lee, J.H.; Kang, S.G. One-carbon substrate-based biohydrogen production: Microbes, mechanism, and productivity. Biotechnol. Adv. 2015, 33, 165–177. [Google Scholar] [CrossRef]
  23. Mohr, T.; Aliyu, H.; Küchlin, R.; Zwick, M.; Cowan, D.; Neumann, A.; de Maayer, P. Comparative genomic analysis of Parageobacillus thermoglucosidasius Strains Distinct hydrogenogenic capacities. BMC Genom. 2018, 19, 880. [Google Scholar] [CrossRef] [Green Version]
  24. Aliyu, H.; Lebre, P.; Blom, J.; Cowan, D.; De Maayer, P. Phylogenomic re-assessment of the thermophilic genus Geobacillus. Syst. Appl. Microbiol. 2016, 39, 527–533. [Google Scholar] [CrossRef] [PubMed] [Green Version]
  25. Suzuki, Y.; Kishigami, T.; Inoue, K.; Mizoguchi, Y.; Eto, N.; Takagi, M.; Abe, S. Bacillus thermoglucosidasius sp. Nov., A New Species Obligately Thermophilic Bacilli. Syst. Appl. Microbiol. 1983, 4, 487–495. [Google Scholar] [CrossRef] [PubMed]
  26. Nazina, T.N.; Tourova, T.P.; Poltaraus, A.B.; Novikova, E.V.; Grigoryan, A.A.; Ivanova, A.E.; Lysenko, A.M.; Petrunyaka, V.V.; Osipov, G.A.; Belyaev, S.S.; et al. Taxonomic study of aerobic thermophilic bacilli: Descriptions of Geobacillus Subterraneus Gen. Nov., Sp. Nov. Geobacillus Uzenensis Sp. Nov. Pet. Reserv. Transf. Bacillus Stearothermophilus, Bacillus Thermocatenulatus, Bacillus Thermoleovorans, Bacillus Kaustophilus, Bacillus Thermodenitrificans Geobacillus New Comb. G. Stearothermophilus, G. Thermodenitrificans. Int. J. Syst. Evol. Microbiol. 2001, 51, 433–446. [Google Scholar] [CrossRef] [PubMed] [Green Version]
  27. Zeigler, D. The Geobacillus Paradox: Why Is A Thermophilic Bact. Genus So Prevalent A Mesophilic Planet? Microbiology 2013, 160 Pt 1, 1–11. [Google Scholar] [CrossRef] [PubMed] [Green Version]
  28. Hussein, A.H.; Lisowska, B.K.; Leak, D.J. Chapter One—The Genus Geobacillus and Their Biotechnological Potential. In Advances in Applied Microbiology; Academic Press: Cambridge, MA, USA, 2015; Volume 92, pp. 1–48. [Google Scholar] [CrossRef] [Green Version]
  29. Takami, H.; Nishi, S.; Lu, J.; Shimamura, S.; Takaki, Y. Genomic characterization of thermophilic Geobacillus Species isolated from the deepest sea mud of the Mariana Trench. Extremophiles 2004, 8, 351–356. [Google Scholar]
  30. Marchant, R.; Franzetti, A.; Pavlostathis, S.G.; Tas, D.O.; Erdbrűgger, I.; Űnyayar, A.; Mazmanci, M.A.; Banat, I.M. Thermophilic bacteria in cool temperate soils: Are they metabolically active or continually added by global atmospheric transport? Appl. Microbiol. Biotechnol. 2008, 78, 841–852. [Google Scholar] [CrossRef]
  31. Zhou, J.; Lian, J.; Rao, C.V. Metabolic engineering of Parageobacillus thermoglucosidasius efficient production (2R, 3R)-Butanediol. Appl. Microbiol. Biotechnol. 2020, 104, 4303–4311. [Google Scholar] [CrossRef]
  32. Styles, M.Q.; Nesbitt, E.A.; Hoffmann, T.D.; Queen, J.; Ortenzi, M.V.; Leak, D.J. The heterologous production of terpenes by the thermophile Parageobacillus thermoglucosidasius A Consol. Bioprocess Using Waste Bread. Metab. Eng. 2021, 65, 146–155. [Google Scholar] [CrossRef]
  33. Fong, J.C.; Svenson, C.J.; Nakasugi, K.; Leong, C.T.; Bowman, J.P.; Chen, B.; Glenn, D.R.; Neilan, B.A.; Rogers, P.L. Isolation and characterization of two novel ethanol-tolerant facultative-anaerobic thermophilic bacteria strains from waste compost. Extremophiles 2006, 10, 363–372. [Google Scholar] [CrossRef]
  34. Tang, Y.J.; Sapra, R.; Joyner, D.; Hazen, T.C.; Myers, S.; Reichmuth, D.; Blanch, H.; Keasling, J.D. Analysis of metabolic pathways and fluxes in a newly discovered thermophilic and ethanol-tolerant Geobacillus Strain. Biotechnol. Bioeng. 2009, 102, 1377–1386. [Google Scholar] [CrossRef] [Green Version]
  35. Cripps, R.; Eley, K.; Leak, D.; Rudd, B.; Taylor, M.; Todd, M.; Boakes, S.; Martin, S.; Atkinson, T. Metabolic engineering of Geobacillus thermoglucosidasius High Yield Ethanol production. Metab. Eng. 2009, 11, 398–408. [Google Scholar] [CrossRef] [PubMed]
  36. Taylor, M.P.; Eley, K.L.; Martin, S.; Tuffin, M.I.; Burton, S.G.; Cowan, D.A. Thermophilic ethanologenesis: Future prospects for second-generation bioethanol production. Trends Biotechnol. 2009, 27, 398–405. [Google Scholar] [CrossRef] [PubMed]
  37. Aliyu, H.; de Maayer, P.; Neumann, A. Not All That Glitters Is Gold: The Paradox of CO-dependent Hydrogenogenesis in Parageobacillus thermoglucosidasius. Front. Microbiol. 2021, 12, 3644. [Google Scholar] [CrossRef] [PubMed]
  38. Aliyu, H.; Kastner, R.; Maayer, P.; Neumann, A. Carbon Monoxide Induced Metabolic Shift in the Carboxydotrophic Parageobacillus thermoglucosidasius DSM 6285. Microorganisms 2021, 9, 1090. [Google Scholar] [CrossRef]
  39. Meyer, O.; Schlegel, H.G. Biology of aerobic carbon monoxide-oxidizing bacteria. Annu. Rev. Microbiol. 1983, 37, 277–310. [Google Scholar] [CrossRef]
  40. Mohr, T.; Aliyu, H.; Küchlin, R.; Polliack, S.; Zwick, M.; Neumann, A.; Cowan, D.; de Maayer, P. CO-dependent hydrogen production by the facultative anaerobe Parageobacillus thermoglucosidasius. Microb. Cell Factories 2018, 17, 108. [Google Scholar] [CrossRef] [Green Version]
  41. Adachi, Y.; Inoue, M.; Yoshida, T.; Sako, Y. Genetic Engineering of Carbon Monoxide-dependent Hydrogen-producing Machinery in Parageobacillus thermoglucosidasius. Microbes Environ. 2020, 35, ME20101. [Google Scholar] [CrossRef]
  42. Mol, V.; Bennett, M.; Sánchez, B.J.; Lisowska, B.K.; Herrgård, M.J.; Nielsen, A.T.; Leak, D.J.; Sonnenschein, N. Genome-scale metabolic modeling of P. thermoglucosidasius NCIMB 11955 reveals metabolic bottlenecks in anaerobic metabolism. Metab. Eng. 2021, 65, 123–134. [Google Scholar] [CrossRef]
  43. Shimizu, K. 1-Main metabolism. In Bacterial Cellular Metabolic Systems; Shimizu, K., Ed.; Woodhead Publishing Series in Biomedicine; Woodhead Publishing: Cambridge, UK, 2013; pp. 1–54. [Google Scholar] [CrossRef]
  44. Reitzer, L. Catabolism of Amino Acids and Related Compounds. EcoSal Plus 2005, 1, 1–26. [Google Scholar] [CrossRef]
  45. Metcalfe, G.D.; Sargent, F.; Hippler, M. Hydrogen production in the presence of oxygen by Escherichia coli K-12. Microbiology 2022, 168. [Google Scholar] [CrossRef]
  46. Soini, J.; Ukkonen, K.; Neubauer, P. High cell density media for Escherichia coli are generally designed for aerobic cultivations–consequences for Large-Scale bioprocesses and shake flask cultures. Microb. Cell Factories 2008, 7, 26. [Google Scholar] [CrossRef] [PubMed] [Green Version]
  47. Cheng, K.K.; Wang, G.Y.; Zeng, J.; Zhang, J.A. Improved Succinate Production by Metabolic Engineering. BioMed Res. Int. 2013, 2013, 538790. [Google Scholar] [CrossRef] [PubMed] [Green Version]
  48. Fontecilla-Camps, J.C.; Amara, P.; Cavazza, C.; Nicolet, Y.; Volbeda, A. Structure–function relationships of anaerobic gas-processing metalloenzymes. Nature 2009, 460, 814–822. [Google Scholar] [CrossRef] [PubMed]
  49. Hirshberg, B.; Gerber, R.B. Formation of Carbonic Acid in Impact of CO2 on Ice and Water. J. Phys. Chem. Lett. 2016, 7, 2905–2909. [Google Scholar] [CrossRef] [PubMed]
  50. Scharlin, P.; Battino, R.; Silla, E.; Tunon, I.; Pascual-Ahuir, J. Solubility of gases in water: Correlation between solubility and the number of water molecules in the first solvation shell. Pure Appl. Chem. 1998, 70, 1895–1904. [Google Scholar] [CrossRef]
  51. Brumm, P.; Land, M.L.; Hauser, L.J.; Jeffries, C.D.; Chang, Y.J.; Mead, D.A. Complete genome sequence of Geobacillus Strain Y4. 1MC1, A novel co-utilizing Geobacillus thermoglucosidasius Strain isolated from bath hot spring in Yellowstone National Park. BioEnergy Res. 2015, 8, 1039–1045. [Google Scholar] [CrossRef] [Green Version]
  52. Capasso, C.; Supuran, C.T. An overview of the alpha-, beta- and gamma-carbonic anhydrases from Bacteria: Can bacterial carbonic anhydrases shed new light on evolution of bacteria? J. Enzym. Inhib. Med. Chem. 2015, 30, 325–332. [Google Scholar] [CrossRef]
  53. Sander, R. Compilation of Henry’s law constants (version 4.0) for water as solvent. Atmos. Chem. Phys. 2015, 15, 4399–4981. [Google Scholar] [CrossRef] [Green Version]
  54. Sander, R.; Acree, W.E.; De Visscher, A.; Schwartz, S.E.; Wallington, T.J. Henry’s law constants (IUPAC Recommendations 2021). Pure Appl. Chem. 2022, 94, 71–85. [Google Scholar] [CrossRef]
  55. Schenk, A.; Aragno, M. Bacillus schlegelii, a new species of thermophilic, facultatively chemolithoautotrophic bacterium oxidizing molecular hydrogen. Microbiology 1979, 115, 333–341. [Google Scholar] [CrossRef] [Green Version]
  56. Islam, Z.F.; Welsh, C.; Bayly, K.; Grinter, R.; Southam, G.; Gagen, E.J.; Greening, C. A widely distributed hydrogenase oxidises atmospheric H2 during bacterial growth. ISME J. 2020, 14, 2649–2658. [Google Scholar] [CrossRef] [PubMed]
  57. Enjalbert, B.; Millard, P.; Dinclaux, M.; Portais, J.C.; Létisse, F. Acetate fluxes in Escherichia coli are determined by the thermodynamic control of the Pta-AckA pathway. Sci. Rep. 2017, 7, 42135. [Google Scholar] [CrossRef] [PubMed] [Green Version]
  58. Chai, Y.; Kolter, R.; Losick, R. A widely conserved gene cluster required for lactate utilization in Bacillus subtilis and its involvement in biofilm formation. J. Bacteriol. 2009, 191, 2423–2430. [Google Scholar] [CrossRef] [PubMed]
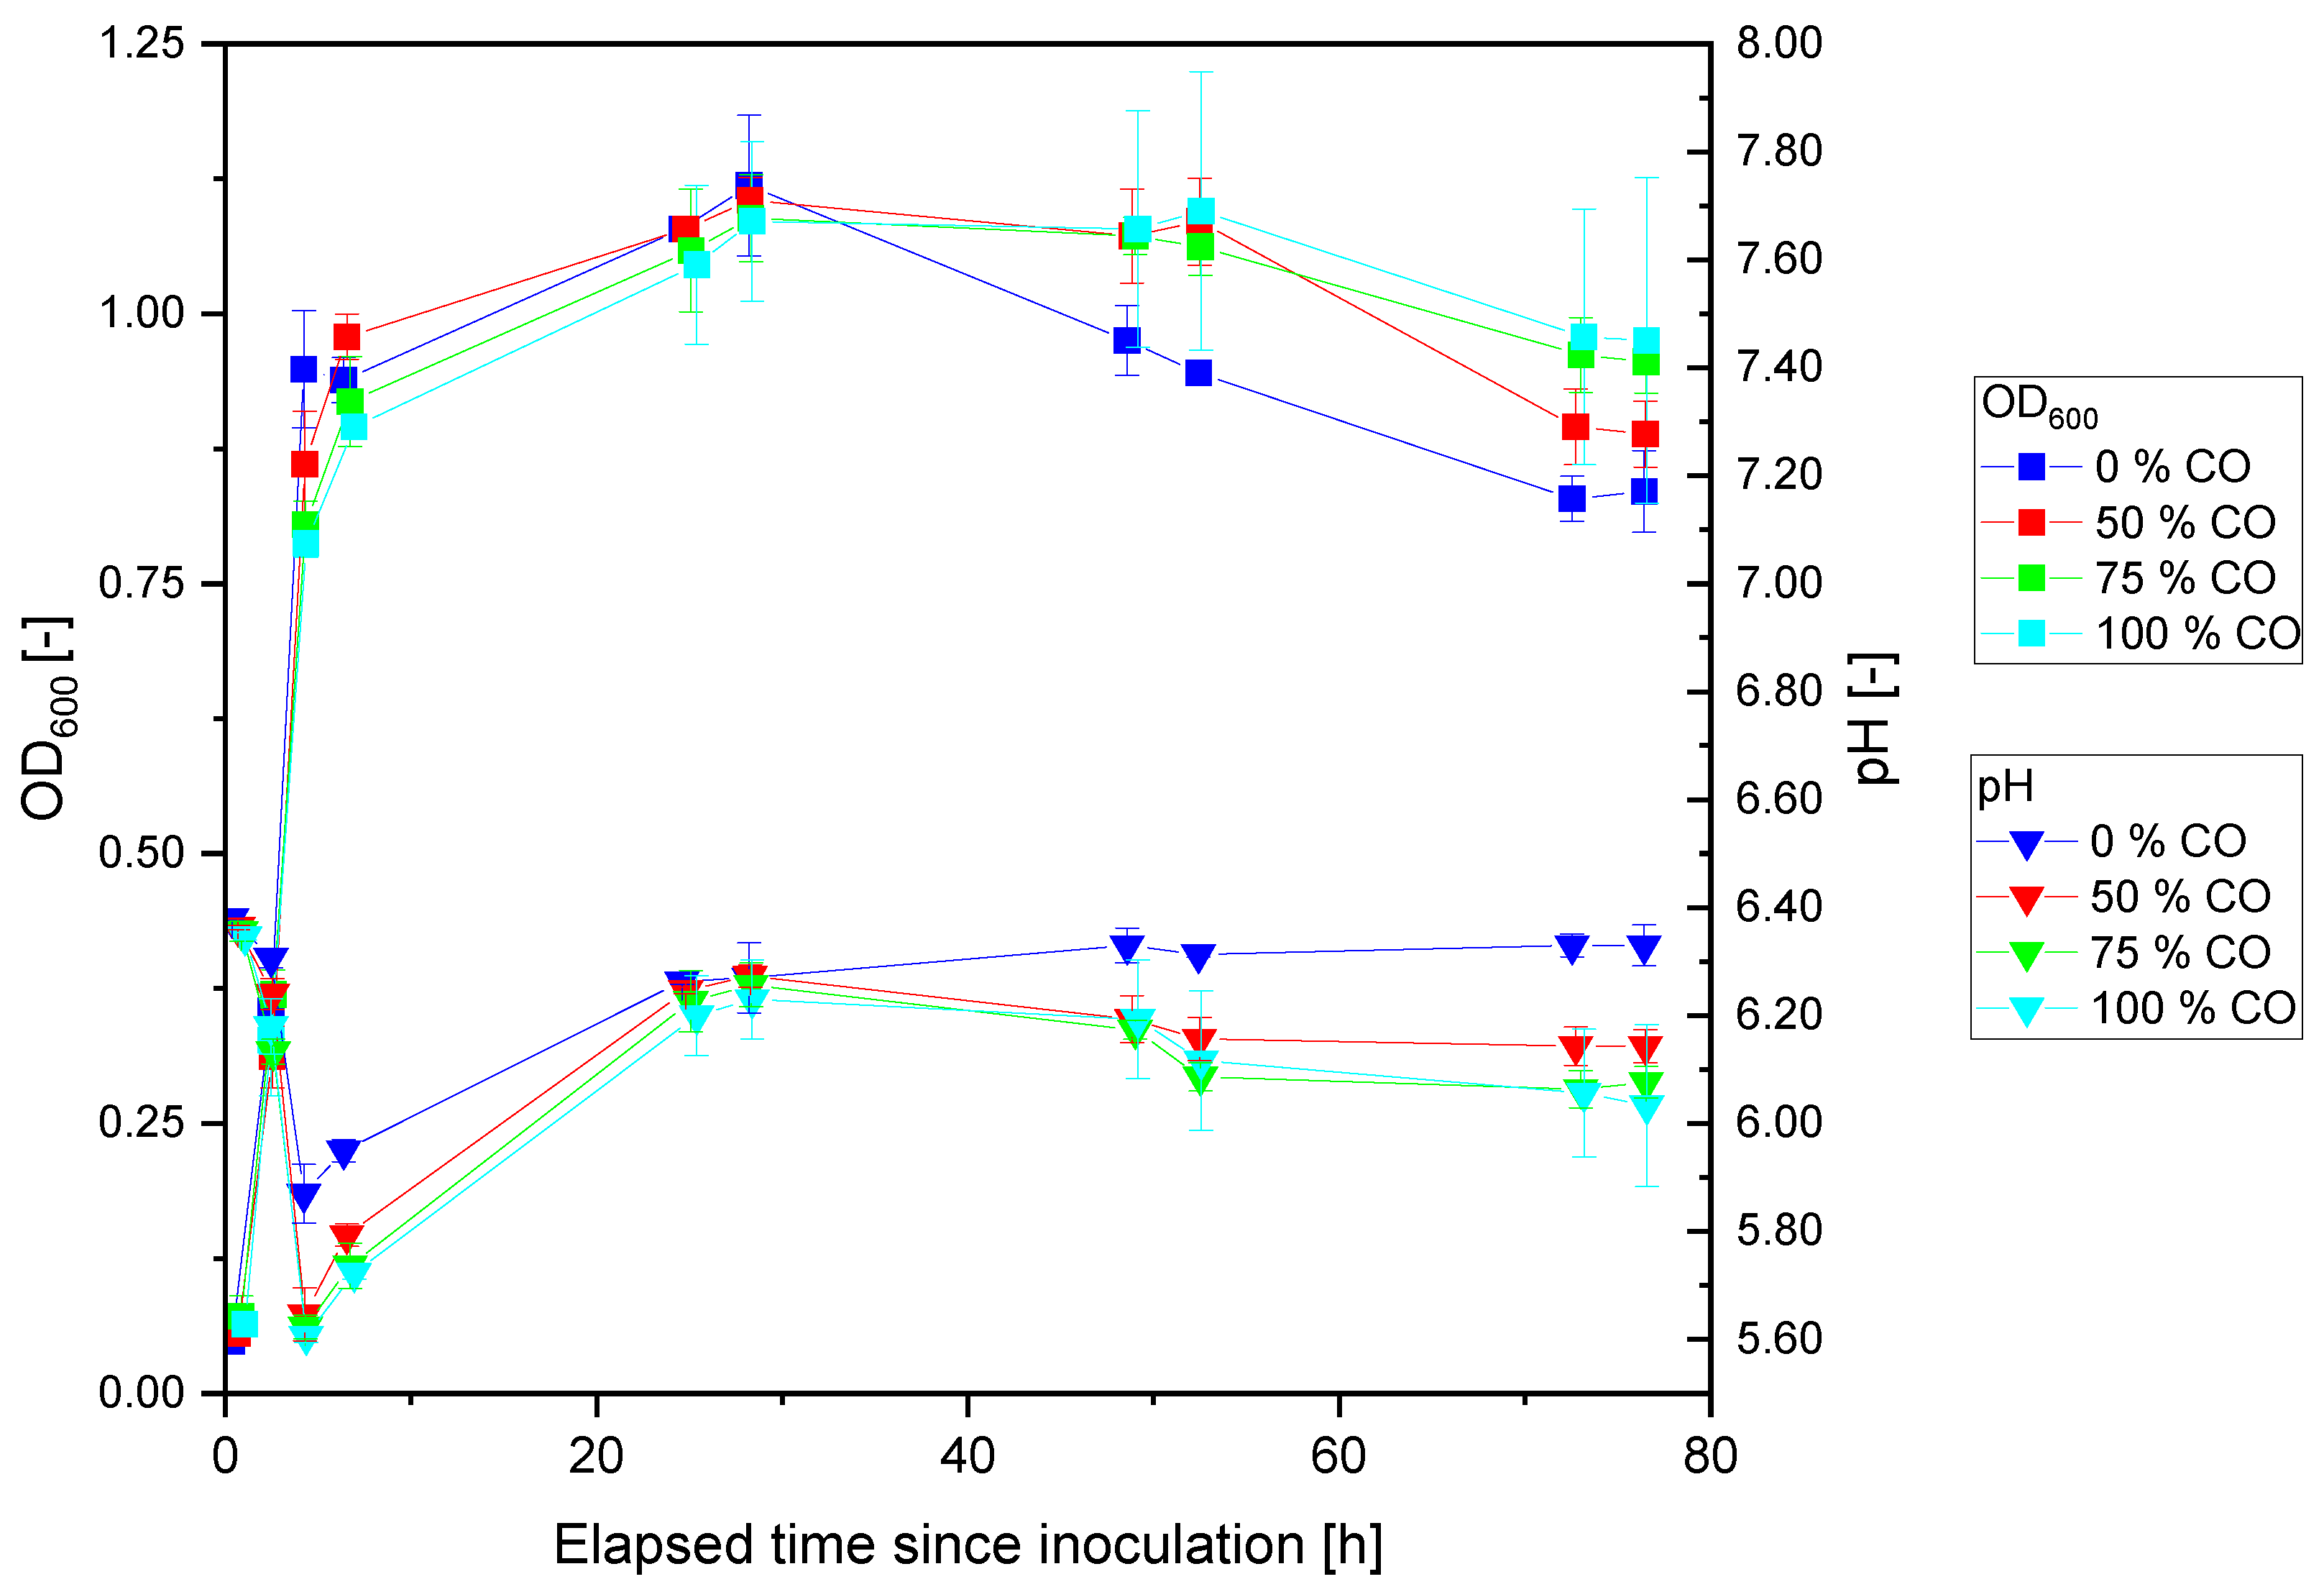
Figure 1. Development of optical density and pH in P. thermoglucosidasius KP1013 grown in ASM medium under 0–100% CO with O2. Different colors and symbols represent different gas atmospheres and parameters, respectively.
Fermentation 08 00596 g001
Figure 2. Content of gases in the headspace of the serum bottles for the experiment with P. thermoglucosidasius KP1013 under 0–100% CO concentrations with O2. Different colors and symbols represent different gas atmospheres and gases, respectively.
Fermentation 08 00596 g002
Figure 3. Concentration of metabolites in the cultivation medium for the different cultures under starting aerobic conditions with P. thermoglucosidasius KP1013. (a) 0% CO, (b) 50% CO, (c) 75% CO, (d) 100% CO.
Fermentation 08 00596 g003
Figure 4. Development of optical density and pH in P. thermoglucosidasius. (a) KP1013 and (b) DSM 6285 cultures grown with 0–100% CO in ASM medium under anaerobic conditions. Different colors and symbols represent different gas atmospheres and parameters, respectively.
Fermentation 08 00596 g004
Figure 5. Content of gases in the headspace of the serum bottles for the anaerobic experiments with P. thermoglucosidasius. (a) KP1013 and (b) DSM 6285 under 0–100% CO atmospheres. Different colors and symbols represent different gas atmospheres and gases, respectively.
Fermentation 08 00596 g005
Figure 6. Concentration of metabolites in the cultivation medium for the different cultures under initial anaerobic conditions with P. thermoglucosidasius KP1013. (a) 0% CO, (b) 50% CO, (c) 75% CO, and (d) 100% CO.
Fermentation 08 00596 g006
Figure 7. Concentration of metabolites in the cultivation medium for the different cultures under initial anaerobic conditions with P. thermoglucosidasius DSM 6285. (a) 0% CO, (b) 50% CO, (c) 75% CO, and (d) 100% CO.
Fermentation 08 00596 g007
Figure 8. Development of optical density and pH under anaerobic conditions with P. thermoglucosidasius KP1013 grown in the presence of under 0%, 12.5%, 25% and 37.5% hydrogen concentrations at 1 and 1.6 bar initial pressures. Different colors and symbols represent varying initial hydrogen concentrations and parameters, respectively.
Fermentation 08 00596 g008
Figure 9. Content of gases in the headspace of the serum bottles for the anaerobic experiment with P. thermoglucosidasius KP1013 under varying starting hydrogen concentrations at 1 and 1.6 bar initial pressures. Different colors and symbols represent different gas atmospheres and gases, respectively.
Fermentation 08 00596 g009
Figure 10. Concentration of metabolites in the cultivation medium for the different cultures under initial anaerobic conditions and 1 bar pressure with P. thermoglucosidasius KP1013. (a) 0% H2, (b) 12.5% H2, (c) 25% H2, (d) 37.5% H2.
Fermentation 08 00596 g010
Table 1. Summary of the operating conditions investigated in the batch tests and the assigned names.
ExperimentAmount (mmol)
H2N2CO
O2-containing with KP1013
0% CO06.900
50% CO03.763.09
75% CO02.234.89
100% CO00.696.32
Anoxic with KP1013
0% CO07.740
50% CO04.563.44
75% CO02.235.15
100% CO00.397.02
Anoxic with DSM 6285
0% CO07.430
50% CO03.873.56
75% CO01.895.64
100% CO00.487.07
Anoxic at 1 bar initial pressure with KP1013
0% H203.793.64
12.5% H20.932.723.77
25% H21.911.733.78
37.5% H22.830.793.80
Anoxic at 1.6 bar initial pressure with KP1013
0% H205.494.79
12.5% H21.224.184.79
25% H22.642.714.84
37.5% H23.871.504.82
Publisher’s Note: MDPI stays neutral with regard to jurisdictional claims in published maps and institutional affiliations.