Article

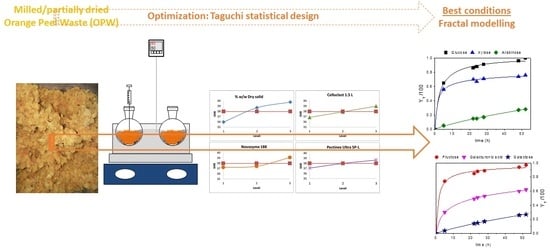
Optimization of the Enzymatic Saccharification Process of Milled Orange Wastes

Chemical Engineering Department, Chemistry College, Complutense University, 28040 Madrid, Spain
*
Author to whom correspondence should be addressed.
Fermentation 2017, 3(3), 37; https://doi.org/10.3390/fermentation3030037
Submission received: 2 July 2017 / Revised: 18 July 2017 / Accepted: 30 July 2017 / Published: 1 August 2017
(This article belongs to the Special Issue Bioconversion Processes)

Abstract

:
Orange juice production generates a very high quantity of residues (Orange Peel Waste or OPW-50–60% of total weight) that can be used for cattle feed as well as feedstock for the extraction or production of essential oils, pectin and nutraceutics and several monosaccharides by saccharification, inversion and enzyme-aided extraction. As in all solid wastes, simple pretreatments can enhance these processes. In this study, hydrothermal pretreatments and knife milling have been analyzed with enzyme saccharification at different dry solid contents as the selection test: simple knife milling seemed more appropriate, as no added pretreatment resulted in better final glucose yields. A Taguchi optimization study on dry solid to liquid content and the composition of the enzymatic cocktail was undertaken. The amounts of enzymatic preparations were set to reduce their impact on the economy of the process; however, as expected, the highest amounts resulted in the best yields to glucose and other monomers. Interestingly, the highest content in solid to liquid (11.5% on dry basis) rendered the best yields. Additionally, in search for process economy with high yields, operational conditions were set: medium amounts of hemicellulases, polygalacturonases and β-glucosidases. Finally, a fractal kinetic modelling of results for all products from the saccharification process indicated very high activities resulting in the liberation of glucose, fructose and xylose, and very low activities to arabinose and galactose. High activity on pectin was also observed, but, for all monomers liberated initially at a fast rate, high hindrances appeared during the saccharification process.

Graphical Abstract

1. Introduction

The integrated production of chemicals, fuels, food and feed, as well as thermal energy and electricity, using biomass as a renewable resource is the aim of a biorefinery [1]. Biomass is a plentiful resource, as it includes wood and its residues, agricultural crops and their corresponding residues, food waste, municipal solid waste as well as algae and microalgae. Biomass production is able to fix up to 0.02% of the incident sun energy, while reducing CO2 content in the atmosphere through photosynthesis, thus ensuring, from a theoretical point of view, a progressive swift from fossil resources to the original material behind their formation: biomass [2,3]. At the same time, second generation biorefineries are based mainly in renewable non-food resources, such as lignocellulosic biomass [4]. This abundant biomass conversion into chemicals and fuel poses several challenges that currently jeopardize its implementation due to economic reasons [5].
The increasing demand for food and feed due to the demographic surge in the last decades of the 20th century and during this century has created an enormous amount of food residues. According to the Food and Agriculture Organization of the United Nations (FAO), about 30% of food produced is lost during harvesting, manufacturing, and household and industrial consumption and disposal, amounting to over 1300 million tonnes [6]. Lal et al. [7] estimated the energy content for crop residues in circa 7.5 billion barrels (bbl) of diesel–estimation for 2005 that, if revised for production in 2014, would be increased by 23%, considering data from FAOSTAT [8]. The most abundant fruit tree in the world is sweet orange (Citrus sinensis L.), whose harvest creates almost 60% of the total world citrus fruits production (slightly over 70 million tonnes per year) [9]. Its production and transformation into juice results in almost 30 MM tonnes/year of peel, pulp and seeds waste (OPW). Part of it can be included in cattle feed [10] but, despite this use, such an amount is more than enough to search for further applications of this waste. Some applications in the literature include the use as bioadsorbent for site remediation and wastewater treatment, as raw material for biorefineries (for the production of essential oils, pectin, bioethanol, energy, food added-value ingredients including nutraceuticals, dietary fiber, carotenoids, vitamins, etc.), in the production of electricity by microbial fuel cells or isolation of essential oils [9,11,12,13,14,15,16,17,18].
Residues from orange juice factories are formed by orange pulp, seeds and peel. This peel is composed of the outer orange layer (flavedo) and the white and spongy inner layer (albedo). Orange pulp is very humid and rich in monosaccharides (glucose and fructose) and disaccharides (sucrose), as it is composed by vesicles containing the juice. The albedo layer is rich in pectin, while the flavedo layer contains a good amount of essential oils, with limonene as the main compound in them, and flavonoids. In short, orange waste contains low levels of lignin and protein, medium levels of cellulose and hemicellulose and high levels of pectin. Although their composition can change with the cultivar, the season of the year, the country and the technology used for juice extraction, all these residues are very humid, with a water content ranging from 80% to 84% [16,19].
In the biochemical approach of biorefineries, the two most important processes ensuring their economic success are the raw material pretreatment and fractionation, and the enzymatic saccharification [20]. The pretreated material should both be accessible to enzymes and very reactive, so a good pretreatment will reduce the content of inert or hindering biopolymers (lignin, hemicellulose, pectin) while increasing porosity, hydration, external surface, and the amorphous nature of cellulose [21]. Classical pretreatments have been tested with orange waste: acid and basic treatments, steam injection, steam explosion, etc., to observe that mild conditions of pressure, concentration and temperature suffice to render a material with high reactivity [22,23,24,25]. In fact, the combination of thermal, mechanical and chemical pretreatments result in a very high removal of pectin, thus aiding in the subsequent saccharification process [23]. Enzymatic saccharification is a combination of hydrolysis reactions resulting in the depolymerization of polisaccharides and the final production of monosaccharides, with glucose as the main target in most cases. This process is very complex due to its multiphasic nature, with several solid phases (if different polymers in the lignocellulosic matrix are regarded as such) interacting with a liquid phase, and several enzymes catalyzing reactions either in the solid surface or in the liquid phase. Several phenomena hinder these hydrolytic steps, creating an initial burst phase followed by a deep reduction in overall rates of monosaccharide production, due to a series of interfering phenomena that gain importance along the process. At the same time, high dry solid concentrations and low enzyme amounts are sought to reduce the cost impact of this time consuming process while reaching high titers for glucose and other monosaccharides [26,27,28,29]. To reduce the reduction of overall rates to product, several operational factors should be analyzed and optimized: mixing, agitation, adequate pretreatment(s), more active enzyme cocktails, avoidance or reduction of non-producing enzyme-solid interactions, and more [29,30,31]. Regarding orange waste, some papers report on the optimization of the pretreatment stage [32] or pectin extraction [33], but, to the knowledge of the authors, no paper is devoted to the optimization of the saccharification process.
This paper focuses on the optimization of the enzyme cocktail and the dry solid to liquid ratio for a partially dried and milled orange waste from juice factories. The optimization is performed by using a Taguchi design of experiments, after some previous experiments were developed to choose the more adequate pretreatment from a techno-economic point-of-view. Adequate conditions result in very high yields and good productivities to glucose and fructose at moderate enzyme loadings and medium solid to liquid ratios.

2. Materials and Methods

2.1. Materials

The orange waste (OPW) was provided by Biopolis S.L. (Valencia, Spain). A first pretreatment after their reception was knife-milling with a Knife Mill Grindomix GM 200 (Retsch, Haan, Germany), followed by sieving to a final average particle diameter of 2.2 ± 0.4 mm. This fraction was kept frozen at −20 °C until the moment of use.
The enzymatic cocktail consisted of a mixture of several industrial products kindly provided by Novozymes: Celluclast 1.5 L, Novozym 188, and Pectinex Ultra SP-L, containing glucanases, polygalacturonases, β-glucosidases, xylanases, β-xylosidases and several auxiliary activities. Their combined activities drive the hydrolysis of cellulose, hemicelluloses and pectin in parallel.
Several substrates for testing enzymatic activities were provided by Sigma-Aldrich (Saint Louis, MO, USA): Filter paper Whatman 1, Avicel PH-101, polygalacturonic acid and ONPG (o-nitrophenyl-β-d-glucoside). Citric acid, NaOH, and HCl for buffer solutions and pH adjustment were from Sigma-Aldrich, as all other reagents needed, all of them of reagent or better grade. Monosaccharides (glucose, fructose, galactose, xylose and arabinose) and galacturonic acid were purchased from the same supplier and employed as per HPLC analytical standards.

2.2. Methods

2.2.1. Basic Chemical Analysis of Solids

The basic chemical characterization was performed following National Renewable Energy Laboratory (NREL) USA procedures for the determination of glucans, arabinans, galactans, xylans, polygalacturonic acid, citric acid and fructose, apart for a previous analysis of extractives, ash and moisture (infrared drying at 70–90 °C till constant weight) [34,35,36]. These procedures were applied not only to the original material, but also to the materials resulting from several thermal pretreatments applied to the milled fraction.

2.2.2. Determination of Enzyme Activities

The activities of the main enzymes were tested, in triplicates, with several model substrates: global cellulase activity was measured on Whatman filter paper 1; the cellobiohydrolase activity was measured on Avicel PH-101; o-nitrophenyl-β-d-glucopyranoside was the substrate for β-glucosidase testing, while polygalacturonic acid was used for pectin depolymerase (PD) activity. In all cases, a 50 mM citrate buffer pH 4.8 and a temperature of 50 °C were the fixed operational conditions and a well-stirred batch reactor was employed. Several samples were withdrawn throughout the progress of the reaction and analyzed by HPLC, as explained in a subsequent section. The testing procedures are described in several references [37,38]. The amount of protein in each saccharification run was analyzed by the Bradford method, with BSA (Bovine Serum Albumin) as standard and Coomassie Brilliant Blue G250 as the dye [39].

2.2.3. Hydrothermal Pretreatments

The milled and sieved orange waste was subjected to either partial drying at 70 °C down 60% humidity or, as a previous process, to hydrodistillation (for several hours), microwave water extraction and steam stripping (for several minutes) to remove essential oils. All these pretreatments were performed at 100 to 120 °C at near atmospheric pressure. For hydrodistillation, a Clevenger apparatus was fitted to a round-bottom flask and a Dimroth condenser. For microwave heating, a 500 W power was set in a Milestone EthosX (Milan, Italy). Final solids were extracted with hexane (1% w/w dry solid/liquid) to analyze their content in essential oils by GC-MS. GC-MS analysis was performed in a GC-2010 Shimadzu with a single quadrupole detector GCMS-QP2010 Plus containing a ZB 1-ms column (10 m × 0.1 mm × 0.1 mm) using 99.999% v/v helium as eluent with a ramp from 160 to 200 °C at 5 °C/min and a final period of 15 min at 200 °C.

2.2.4. Saccharification Experiments

Saccharification runs were carried out in triplicates, in thermostated 50 mL round-bottom flasks with magnetic agitation and placed in thermostated aluminum blocks. In each run, 6 g of solids with 60% humidity produced by the several pretreatments tested were employed. Depending on the pretreatment, either 20 mL of citrate buffer solution 50 mM pH 5.2 were used or citric acid was added as needed (after pretreatment liquid phase HPLC analysis) and pH readjusted to 5.2. The total percentage of dried solids changed from 6.7% to 12.5% depending on the conditions to be tested for pretreatment comparison or for saccharification optimization. In all cases, the pH was controlled at 5.2 by adding NaOH 5 M after the addition of the enzymes during the first hour (burst phase), until a low viscosity was obtained.
In each saccharification run and in the case of the liquid phase after some pretreatments, several samples were withdrawn with reaction time. Sample preparation included centrifugation, dilution and filtration. The resulting liquid samples were analyzed by HPLC with JASCO 2000 series equipment (Tokyo, Japan), while analyte detection was performed with a refraction index detector. Acidified Milli-Q water (0.005 N H2SO4) flowing at 0.5 mL/min was employed as mobile phase, while the stationary phase was a Rezex ROA-Organic Acid H+ (8%) column (300 mm × 7.80 mm) placed in an oven at 60 °C. For the determination of xylose, arabinose and galactose, a Rezex RCM-Monosaccharide Ca2+ column (300 mm × 7.80 mm) at 80 °C was employed, with Milli-Q water as eluent (Both columns from Phenomenex, Torrance, CA, USA).
The comparison of the results obtained by HPLC analysis with original or pretreated solid hydrolyzed by using NREL procedures and enzymatic saccharification (in this case, at several reaction times) was employed as the basis to calculate yields. A total yield (YT) defines the amount of total glucose released by all possible means: enzyme aided extraction, sucrose inversion and saccharification, while the saccharification yield (YS) can be established by knowing the fructose released, as this monosaccharide proceeds only from inversion and enzyme-aided extraction, and its ratio to free glucose is well-known (average fru/glu in orange juice = 1.025).
Y T ( % ) = C total   glu   saccharification C total   glu   released   by   NREL   procedure × 100
Y S ( % ) = C total glu saccharification C total fru saccharification/1.025 C c e l l u l o s e × 1.1 × 100

2.2.5. Statistical Design of Experiments

A fractionated factorial design known as the Taguchi method was employed as a Design of Experiments (DOE) technique, which is based on: an orthogonal fractionated factorial design methodology. The application of this methodology results in a dramatic reduction of the number of experiments to be performed [40,41,42].
For enzymatic saccharification, there are many variables to be considered, although a pH of 5.0 or temperature of 50 °C are well established in the literature. As for other factors, like mixing or agitation, these should be fixed at medium to high values to avoid hindrances. To reach high concentrations of monosaccharides at an acceptable amount of enzymes, the factors to consider are the dry solid to liquid ratio, and the amount of the three industrial preparations used here: Celluclast 1.5 L, Novozym 188 and Pectinex Ultra-SP L.
Taguchi methodology has been followed according to the next steps: (1) selection of the responses or dependent variables to be optimized (in this case, total and saccharification yields to glucose); (2) identification of the factors and the choice of their values or levels; (3) performance of duplicate saccharification runs; (4) statistical analysis of results and the signal-to-noise ratio, determining the best values or levels for each factor and predicting the result for the optimal run; (5) triplicate conduction (of the confirmatory run) in the optimal conditions.
As concentrations and yields have to be maximized, the signal-to-noise ratio (S/N ratio or SNR) to be calculated in this case is the higher-the-better one, by using the following expression:
S / N   ratio = 10   log 10   1 n   i = 1 n 1 y i 2
where yi is the value of the response or objective variable (yield, in this case) for each run and n is the number of repetitions per run. To examine the importance of every single individual factor on the saccharification, the average S/N for each factor at each level is computed with equation [4].
S / N = Sum   of   S / N   values   for   factor   i   at   each   level   j 3
The interval of S/N ratios is calculated for each factor and compared to a global average value for all factors. The wider the interval the more influential the factor on the objective variable is. Moreover, given the optimal levels for all factors, the mean response predicted for the best conditions can be calculated with the next equation (for factors A, B, C, D):
Best   yield   predicted = Y + ( A opt Y ) + ( B opt Y ) + ( C opt Y ) + ( D opt Y )
where Y is the global average value for each yield (total, saccharification).

2.2.6. Kinetic Modelling

Fractal kinetic models are semi-empirical models that take into account the severe reduction in global productivity or rate in saccharification processes. The solids on which several of the enzymes involved are acting are similar to fractals in the sense that not all the surface is available for enzymatic action; therefore, there is no integer dimension at any reaction time and the solid is a fractal. This fractal nature extends to dynamic processes, as the controlling nature of each kinetic or dynamic phenomenon interacting during the whole process can change during saccharification [43,44,45]. Fractal models assume that hindrance increases with time, so kinetic constants decrease in the same direction, meaning that they are a function of time. The simplest fractal kinetic model supposes that the first hydrolysis steps are of first-order, as water is in excess.
R G = dX dt = k · ( 1 X )
where the kinetic constant k′ for the first hydrolytic event is a first-order constant and, for the subsequent hydrolysis, a function of time, according to:
k = k · t h     t 1   or   k = k     0 t 1
Therefore, for the very first hydrolysis taking place on the surface, the following equation is valid. After fitting the model to every set of kinetic data, goodness-of-fit can be expressed by several parameters: the sum of quadratic residues (SQR) (which should be near or equal to zero), Root-Mean-Square-Error (RMSE), the square root (SQR) divided by the degrees of freedom (same trend or value as SSR), and Fisher F (it should be high, as it includes SQR in the denominator). They can be calculated with these equations:
S Q R = i = 1 N ( y i , exp y i , calc ) 2  
R M S E = SQR N K  
F = Σ i = 1 N ( y i , calc ) 2 / K Σ i = 1 N SQR / ( N K )  
In these equations, yi,exp is the conversion of each product after the maximum concentration of that monosaccharide is estimated by NREL procedures, yi,calc is the same conversion, but calculated with the model and the optimal values of the kinetic parameters, N is the number of data and K, the number of kinetic/thermodynamic constants in the model (2, for the model proposed).

3. Results and Discussion

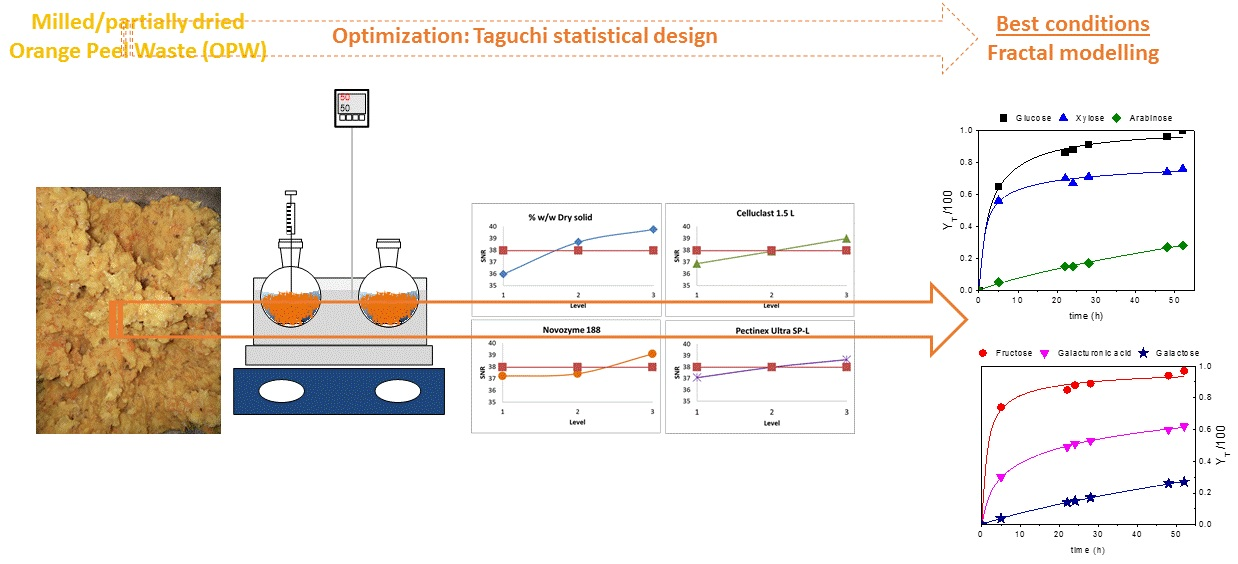
3.1. Preliminary Experiments: Hydrothermal Pretreatments

Prior to the performance of saccharification runs, the protocols established in NREL were used to determine the basic composition of several stocks of OPW pretreated by mild water thermal procedures or, in their absence, by mechanical knife milling (at least). Table 1 compiles the results and, as can be seen, water content depended on the pretreatment time as well as the physical state of the water and the type of device used to heat the solid (indirect electrical heating or direct microwave heating). Direct heating or steaming pretreatments result in higher hydration of the solid in only a few minutes. However, indirect or classical heating involves a very long time to increase water content in OPW. The more aggressive the hydration procedure the more evident the presence of hydrolysis reactions is within the solids, with an increase of the soluble part of any of the polymers considered. The original OPW contains a high amount of water, no extractives in chloroform and a high percentage of extractives in solids (38.5% ± 1.2%); pretreatments with steam or hot water lead to a reduction in free sugars and an increase of polymers (in mass percentage) compared to the original solid. Again, this extraction of free sugars is more effective when using microwaves or direct steaming (followed by rinsing with water in a Buchner funnel).
After plain knife milling or followed by hot water or steaming pretreatments, solids were partially dried to a 70% water content, so as to avoid a very high volume of solids for the next step and, at the same time, the collapse of their porous structure. Saccharification runs were performed at a relatively high content of cellulases (Celluclast 1.5 L), β-glucosidase and xylanases/β-xylosidases (Novozym 188) and polygalacturonases (PG) and auxiliary enzymes (Pectinex Ultra SP-L): 5.8 mg total protein per gram dry solid (DS), 98 FPU/g DS, 199 UI β-glu/g DS, and 11400 UI PG UI/g DS. With these conditions and high stirring at 500 rpm, a 5.0 pH value and 50 °C applied during the 72 h of the hydrolytic process, several effects due to mass transfer and low activity can be avoided, and results depend mainly on the pretreatment employed in each case. These are shown in Figure 1, as total yield to glucose, on one hand, at total liberated glucose concentration, in g/L, on the other.
A very mild mechanical pretreatment, knife milling, renders a solid very reactive, while all other pretreatments, except steaming, induce a considerable reduction in global yields and final glucose concentrations. Since the solids, by their soluble polymer content, should be more reactive, this situation should be due to a collapse of the porous structure, resulting in a mass transfer hindrance of the enzymes into the structure. In fact, if steaming is employed, it is reasonable to accept that this structure is not being affected by the treatment in this sense, but probably otherwise, leading to swelling. However, the energy used for this further pretreatment hardly compensates for only knife milling, at least, until it reaches medium to high dry solid content (15%). Therefore, knife milling followed by partial drying to 70% water content is the pretreatment used for further experimentation, reducing energy consumption to low values due to the softness of OPW.

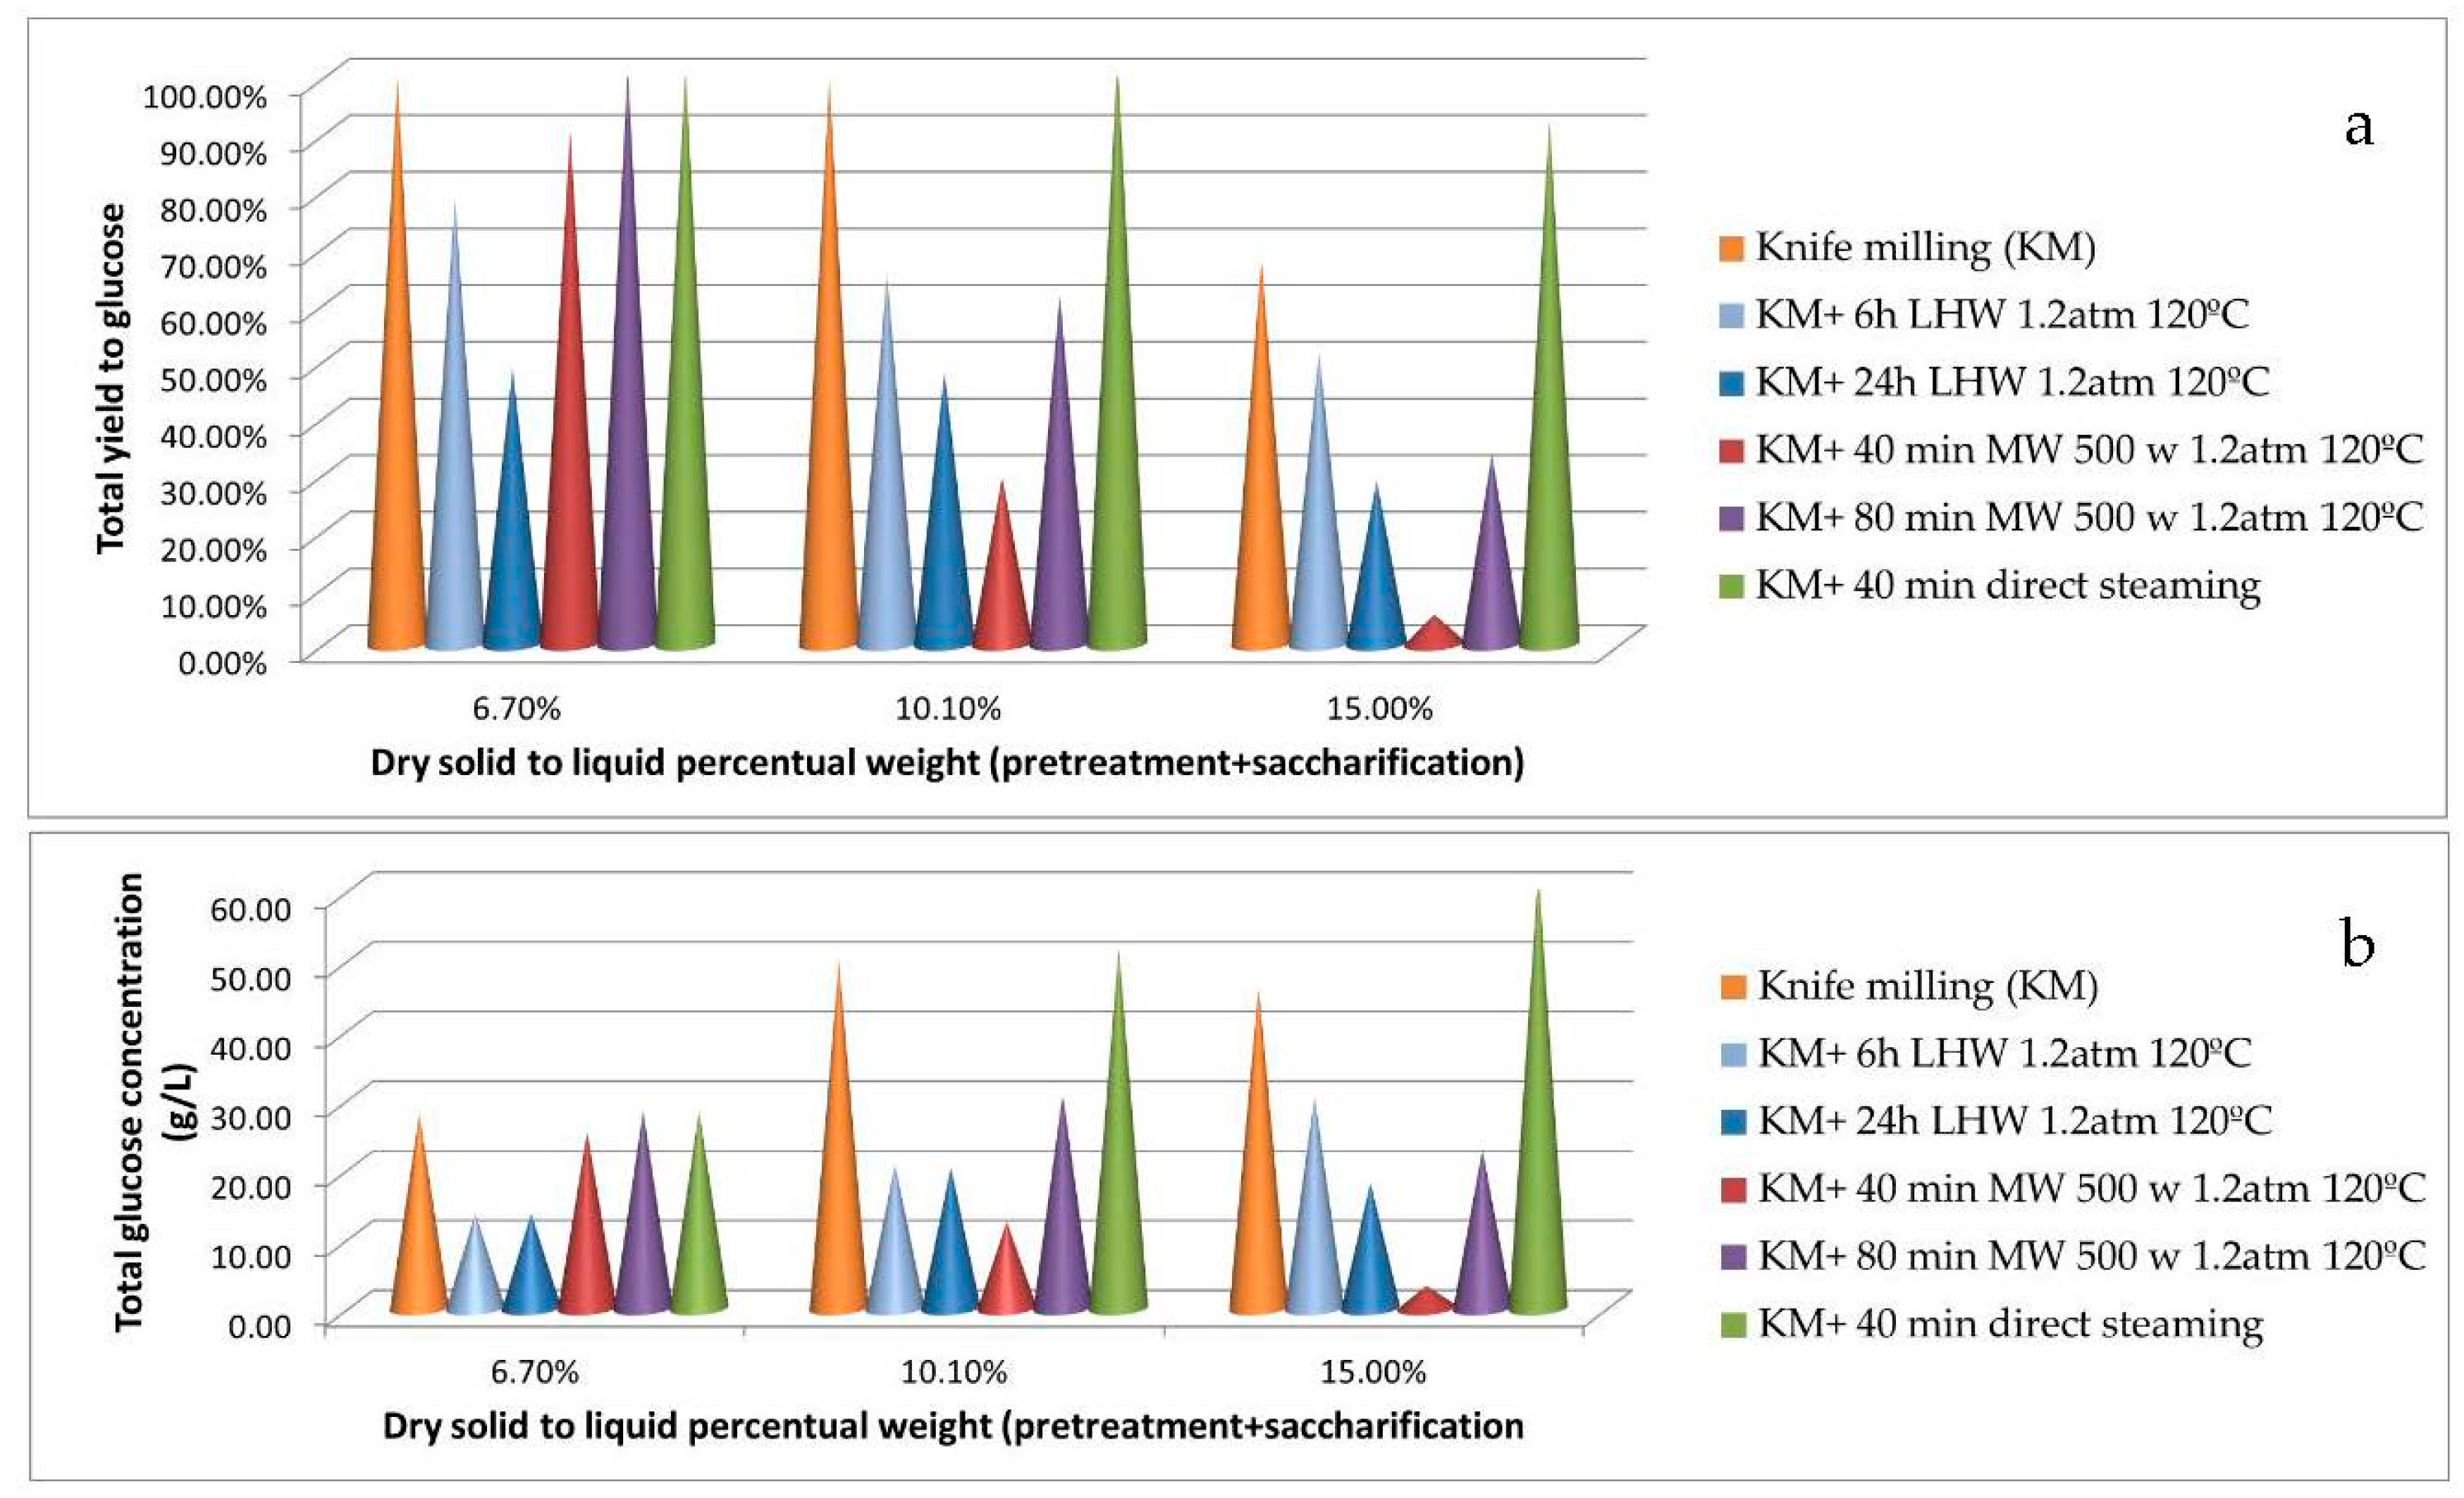
3.2. Taguchi Optimization of the Saccharification

The Taguchi method applied in this case focused on total and saccharification yields optimization, with a higher emphasis on the former, as a high concentration of monosaccharide is important, regardless of its origin. The number of factors or independent variables is four and three levels or values are chosen for each of them, as shown in Table 2. With these conditions, nine runs are needed to cover the experimental range under study (18 if duplicate experiments are performed). In general, the amount of runs N is a function of the number of factors P and the number of levels chosen for them L, as shown in Equation (11). This strategy avoids any bias in the selection of runs and in the information extracted from them.
N = ( L 1 ) P + 1
As for the total maximum concentration of protein (1.16 mg per gram of dry solid), it is evident that low concentrations of enzymes are selected to avoid a high cost in saccharification. At the same time, partial drying permits the increment of dry solid per liquid, so as to approach the solid amount usually found in wood and herbaceous raw materials saccharifications (from 15% upwards) and reach high concentrations of monosaccharides, if the final yields are favorable.
Table 3 displays the results of the saccharification runs after 72 h of process. At first glance, the increment of solid is not deleterious to the process owing to the narrow range of dry solid to liquid weight ratios here studied. The overall concentrations of glucose and fructose are medium to high, hence indicating good progress of enzyme-aided extractions, inversion and saccharification processes; however, the amount of sugars coming from hemicelluloses (arabinose, galactose and xylose) is relatively low, showing a certain recalcitrance of this polymer to the action of hemicellulases in Novozym 188. This can be expected as this preparation is more effective in wood and herbaceous hemicellulases, rich in xylose and mannose (and, in some cases, in glucose).
After estimating the SNR for each case for the-higher-the-better case, taking into account that the higher the yield the better process performance is obtained, partial average SNR values for each factor and level (for example, average SNR values for the A factor, that is, dry solid to liquid ratio, is the average value calculated from the values estimated from runs 1, 2 and 3 for level 1 of this factor) and the overall average SNR values (for all 9 runs and duplicates) are represented. This is performed for all factors. Results are depicted in Figure 2 for the global yield to glucose and in Figure 3 for the saccharification yield, paying particular attention to showing the same interval for the ordinate axis, so as to compare the effects of each operational variable or factor on the yields.
Figure 2 indicates that the most influential factor is the ratio of dry solid to liquid, so the higher amount leads to higher yields, within the restricted range analyzed here. As expected, if higher amounts of enzyme are added, the global yield increases regardless of their activities, but this increment is more evident for glucanases than for pectinases, for example. In the case of β-glucosidase and hemicellulases, this increment is not so progressive than in the other types of enzymes, indicating a critical amount that enhances the process. In any case, the optimal situation includes the highest level for all cases, so the optimal run should be A3B3C3D3 if we consider the global yield as our target.
Saccharification yield was estimated by subtracting the effects of enzyme-aided extraction and sucrose inversion on the glucose concentration. The results obtained are graphed in Figure 3, showing that the effects are quite different from the previous case, although for the dry solid to liquid mass ratio, performance is similar. In all other cases, the lowest activity is better than the highest one. This observation can only be explained if an excess of protein results in non-active adsorption (non-active for saccharification purposes), maybe due to overcrowding, an effect that has previously been described for enzymes acting on lignocellulosic surfaces. For the saccharification yield, the best situation will be obtained with a A3B1C1D1 run.
Further analysis can be carried out by way of a technoeconomical assessment. For this purpose, a good benchmark can be a 42 HFCS (High Fructose Corn Syrup) 75–85% (content in solids) syrup, whose market price has steadily increased from 0.41 to 0.65 €/kg from January 2014 to May 2017, according to the Economic Research Service of the US Deparment of Agriculture (Sugar and Sweeteners Yearbook Tables). One should keep in mind that glucose and fructose are the main monosaccharides obtained in these saccharification runs with OPW as biomass substrate. Table 4 presents some estimations on glucose to fructose ratio and enzyme cost per kg mixture (prices provided by Novozymes for all preparations tested: Celluclast 1.5 L 20 €/kg; Novozym 188 35 €/kg; Pectinex Ultra SP-L 26 €/kg supplied in 25 kg drums–data provided by Novozymes-).
It is evident that runs 7 and 8 are the best in this matrix if total sugars, total glucose or fructose concentrations are the objective functions to maximize. Although several cost effects are not included in this analysis, the conditions shown in run 9 appear much better if operational cost for the enzyme mixture amount, a well-known critical cost factor, is taken into account. Only run 1 is better than run 9 from this point of view, yet sugar amounts and yields are much worse in that case.
A final analysis and run performance applies Equation (5) for the chosen objective function or response. In this case, the global yield to glucose, being parallel to maximal concentrations of free monosaccharides, is the chosen one. In this case, the best conditions are A3B3C3D3 and the application of Equation (5) renders an expected global yield for this experiment of 108.2%. The validation runs give results of 99.85% and 99.64% global yield to glucose, which lead to an average final glucose concentration of 45.67 g/L, and 36.12 g/L of fructose, with an estimated enzyme cost of 0.51 €/kg of mixture glu+fru. Evidently, a very high yield to glucose (and other monosaccharides) results in a high cost, so the combination A3B3C2D1 (run 9) is much better from this perspective, with a good 92.75% global yield to glucose and a reduced cost (0.23 €/kg of mixture glu+fru). Even so, either further reductions in cost per kg industrial enzyme mixtures or higher specific activities at contained prices are needed to reduce the amount of protein (enzyme mixture) per gram dry solid.

3.3. Fractal Kinetic Modelling for Best Global Yield Conditions

A simple first-order fractal model has been fitted to kinetic data of all important monomers obtained in both corroboration runs (thus, optimal conditions regarding glucose total yield). Results on the kinetic parameters, with their standard errors, and goodness-of-fit parameters are provided in Table 5, while the fitting can be observed in Figure 4 in terms of total yields.
As may be seen from the kinetic parameters of the fractal equation for each case, it is perceptible that the standard error is low for most cases, thus indicating a good confidence degree in the optimal value of k′ (the first-order kinetic constant) and h (the fractal exponent). The low values for SQR and RMSE and the high to very high values for Fisher F (much higher than the values tabulated at 95% confidence needed in all cases) indicate a good to very good fitting, an idea that is corroborated by Figure 4.
The values of the first-order kinetic constant show that the enzyme cocktail is mostly active on cellulose and a part of the hemicellulose, liberating glucose and xylose (not very abundant) at a fast pace. Fructose is free, as a monosaccharide, so it is liberated due to the disruption of the juice vesicles (as is the case of a high percentage of glucose). It is evident that this process is the fastest-occurring step. Regarding pectin hydrolysis, a high concentration of galacturonic acid is reached (more than 12 g/L) at 52 h, but its liberation is relatively slow, so PG activity seems to not be very high in this context. The same can be said for arabinose and galactose, the main monosaccharides in OPW hemicelluloses: they are liberated at a very slow rate and only partially in 52 h, so there are low activities for α-galactosidase and arabinan endo-1,5-α-l-arabinanase.
Looking at the fractal exponent, a high value indicates the presence on limiting phenomena hindering the liberation of the considered monomer. Thus, fructose liberation is fast at the beginning, but it is rapidly reduced, as shown by a high value of h for this monosaccharide. This fact suggests that the vesicles are being disrupted at a fast pace in the first moments, while fructose can be adsorbed in the solid part of the wastes and only the progressive disappearance of this part permits the liberation of a fraction of fructose. The same can be said for the free part of glucose, although in the case of xylose, being a minor component in the hemicellulosic fraction, the low liberation of galactose and arabinose can be a hindrance for xylose production. Finally, in the case of galacturonic acid, the exposure of pectin to the enzymatic action should be heterogeneous, as can be deduced from the complexity of pectin extraction in acid conditions, a very slow process that always leaves a good quantity of pectin in the solid matrix.

4. Conclusions

This study indicates that knife milling, a mild mechanical pretreatment of orange peel waste, is enough to obtain acceptable yields for saccharification at low enzyme amounts. Furthermore, optimization of the hydrolysis and extraction enzymatic process performed on milled OPW shows that good to high yields of glucose and fructose are obtained, liberating more than 45 g/L glucose, more than 30 g/L fructose, and 12 g/L galacturonic acid within 52 h with a protein content under 1 mg per gram dry solid and at 11.5% w/w DS/L. Further enhancement of the enzymatic cocktail should be sought, especially to liberate the arabinose and galactose contained in the hemicellulose part of OPW. Reduction of the prices of pectinase and β-glu/hemicellulases industrial preparations should be pursued if the maximum yields to monomers are the main aim.

Acknowledgments

The kind gift of Celluclast 1.5 L, Novozym 188, and Pectinex Ultra SP-L by Ramiro Martinez (Novozymes Spain, Pozuelo de Alarcon—Madrid-Spain) is gratefully acknowledged. Likewise, the authors thank the supply of OPW sent by Marta Tortajada and Antonia Rojas (Biopolis S.L., Paterna—Valencia-Spain). This work was funded by MICINN under contracts CTQ-2013-45970-C2-1-R and PCIN-2013-021-C02-01.

Author Contributions

Miguel Ladero and Victoria E. Santos conceived and designed the experiments; Daniel Velasco, Juan J. Senit, Isabel de la Torre and Tamara M. Santos performed the experiments and analyzed the samples; Pedro Yustos and Miguel Ladero developed the analytical procedures and analyzed the retrieved data; Miguel Ladero wrote the paper. All the authors read and approved the final manuscript.

Conflicts of Interest

The authors declare no conflict of interest. The founding sponsors had no role in the design of the study; in the collection, analyses, or interpretation of data; in the writing of the manuscript, and in the decision to publish the results.

References

  1. Cherubini, F. The biorefinery concept: Using biomass instead of oil for producing energy and chemicals. Energy Convers. Manag. 2010, 51, 1412–1421. [Google Scholar] [CrossRef]
  2. Ragauskas, A.J.; Williams, C.K.; Davison, B.H.; Britovsek, G.; Cairney, J.; Eckert, C.A.; Frederick, W.J.; Hallett, J.P.; Leak, D.J.; Liotta, C.L. The path forward for biofuels and biomaterials. Science 2006, 311, 484–489. [Google Scholar] [CrossRef] [PubMed]
  3. Zhu, X.-G.; Long, S.P.; Ort, D.R. What is the maximum efficiency with which photosynthesis can convert solar energy into biomass? Curr. Opin. Biotechnol. 2008, 19, 153–159. [Google Scholar] [CrossRef] [PubMed]
  4. Naik, S.N.; Goud, V.V.; Rout, P.K.; Dalai, A.K. Production of first and second generation biofuels: A comprehensive review. Renew. Sust. Energy Rev. 2010, 14, 578–597. [Google Scholar] [CrossRef]
  5. Carriquiry, M.A.; Du, X.; Timilsina, G.R. Second generation biofuels: Economics and policies. Energy Pol. 2011, 39, 4222–4234. [Google Scholar] [CrossRef]
  6. Pham, T.P.T.; Kaushik, R.; Parshetti, G.K.; Mahmood, R.; Balasubramanian, R. Food waste-to-energy conversion technologies: Current status and future directions. Waste Manag. 2015, 38, 399–408. [Google Scholar] [CrossRef] [PubMed]
  7. Lal, R. World crop residues production and implications of its use as a biofuel. Environ. Int. 2005, 31, 575–584. [Google Scholar] [CrossRef] [PubMed]
  8. FAOSTAT. Country Indicators, Data, Compare Data. 2014. Available online: http://www.fao.org/faostat/en/#home (accessed on 17 July 2017).
  9. Erukainure, O.L.; Ebuehi, O.A.T.; Choudhary, M.I.; Mesaik, M.A.; Shukralla, A.; Muhammad, A.; Zaruwa, M.Z.; Elemo, G.N. Orange peel extracts: Chemical characterization, antioxidant, antioxidative burst, and phytotoxic activities. J. Diet. Suppl. 2016, 13, 585–594. [Google Scholar] [CrossRef] [PubMed]
  10. Bampidis, V.A.; Robinson, P.H. Citrus by-products as ruminant feeds: A review. Anim. Feed Sci. Technol. 2006, 128, 175–217. [Google Scholar] [CrossRef]
  11. Lessa, E.F.; Gularte, M.S.; Garcia, E.S.; Fajardo, A.R. Orange waste: A valuable carbohydrate source for the development of beads with enhanced adsorption properties for cationic dyes. Carbohydr. Polym. 2017, 157, 660–668. [Google Scholar] [CrossRef] [PubMed]
  12. De Farias Silva, C.E.; da Silva Gonçalves, A.H.; de Souza Abud, A.K. Treatment of textile industry effluents using orange waste: A proposal to reduce color and chemical oxygen demand. Water Sci. Technol. 2016, 74, 994–1004. [Google Scholar] [CrossRef] [PubMed]
  13. Miran, W.; Nawaz, M.; Jang, J.; Lee, D.S. Conversion of orange peel waste biomass to bioelectricity using a mediator-less microbial fuel cell. Sci. Total Environ. 2016, 547, 197–205. [Google Scholar] [CrossRef] [PubMed]
  14. John, I.; Muthukumar, K.; Arunagiri, A. A review on the potential of citrus waste for D-Limonene, pectin, and bioethanol production. Int. J. Green Energy 2017, 14, 599–612. [Google Scholar] [CrossRef]
  15. Putnik, P.; Kovačević, D.B.; Jambrak, A.R.; Barba, F.; Cravotto, G.; Binello, A.; Lorenzo, J.; Shpigelman, A. Innovative “Green” and Novel Strategies for the Extraction of Bioactive Added Value Compounds from Citrus Wastes—A Review. Molecules 2017, 22, 680. [Google Scholar] [CrossRef] [PubMed]
  16. Rezzadori, K.; Benedetti, S.; Amante, E.R. Proposals for the residues recovery: Orange waste as raw material for new products. Food Bioprod. Process. 2012, 90, 606–614. [Google Scholar] [CrossRef]
  17. Rafiq, S.; Kaul, R.; Sofi, S.A.; Bashir, N.; Nazir, F.; Nayik, G.A. Citrus peel as a source of functional ingredient: A review. J. Saudi Soc. Agric. Sci. 2016. [Google Scholar] [CrossRef]
  18. Sharma, K.; Mahato, N.; Cho, M.H.; Lee, Y.R. Converting citrus wastes into value-added products: Economic and environmently friendly approaches. Nutrition 2017, 34, 29–46. [Google Scholar] [CrossRef] [PubMed]
  19. Ángel Siles López, J.; Li, Q.; Thompson, I.P. Biorefinery of waste orange peel. Crit. Rev. Biotechnol. 2010, 30, 63–69. [Google Scholar] [CrossRef] [PubMed]
  20. Humbird, D.; Davis, R.; Tao, L.; Kinchin, C.; Hsu, D.; Aden, A.; Schoen, P.; Lukas, J.; Olthof, B.; Worley, M.; et al. Process Design and Economics for Biochemical Conversion of Lignocellulosic Biomass to Ethanol: Dilute-Acid Pretreatment and Enzymatic Hydrolysis of Corn Stover; National Renewable Energy Laboratory (NREL): Golden, CO, USA, 2011.
  21. Mussatto, S.I. Biomass Fractionation Technologies for a Lignocellulosic Feedstock Based Biorefinery; Elsevier: Amsterdam, The Netherlands, 2016. [Google Scholar]
  22. Rivas-Cantu, R.C.; Jones, K.D.; Mills, P.L. A citrus waste-based biorefinery as a source of renewable energy: Technical advances and analysis of engineering challenges. Waste Manag. Res. 2013, 31, 413–420. [Google Scholar] [CrossRef] [PubMed]
  23. Santi, G.; Crognale, S.; D’Annibale, A.; Petruccioli, M.; Ruzzi, M.; Valentini, R.; Moresi, M. Orange peel pretreatment in a novel lab-scale direct steam-injection apparatus for ethanol production. Biomass Bioenergy 2014, 61, 146–156. [Google Scholar] [CrossRef]
  24. Widmer, W.; Zhou, W.; Grohmann, K. Pretreatment effects on orange processing waste for making ethanol by simultaneous saccharification and fermentation. Bioresour. Technol. 2010, 101, 5242–5249. [Google Scholar] [CrossRef] [PubMed]
  25. Wang, L.; Xu, H.; Yuan, F.; Fan, R.; Gao, Y. Preparation and physicochemical properties of soluble dietary fiber from orange peel assisted by steam explosion and dilute acid soaking. Food Chem. 2015, 185, 90–98. [Google Scholar] [CrossRef] [PubMed]
  26. Merino, S.T.; Cherry, J. Progress and Challenges in Enzyme Development for Biomass Utilization. In Biofuels; Olsson, L., Ed.; Springer: Berlin/Heidelberg, Germany, 2007; pp. 95–120. [Google Scholar]
  27. Klein-Marcuschamer, D.; Oleskowicz-Popiel, P.; Simmons, B.A.; Blanch, H.W. The challenge of enzyme cost in the production of lignocellulosic biofuels. Biotechnol. Bioeng. 2012, 109, 1083–1087. [Google Scholar] [CrossRef] [PubMed]
  28. Fockink, D.H.; Urio, M.B.; Chiarello, L.M.; Sánchez, J.H.; Ramos, L.P. Principles and challenges involved in the enzymatic hydrolysis of cellulosic materials at high total solids. In Green Fuels Technology: Biofuels; Soccol, C.R., Brar, S.K., Faulds, C., Ramos, L.P., Eds.; Springer International Publishing: Cham, Switzerland, 2016; pp. 147–173. [Google Scholar]
  29. Jung, Y.H.; Park, H.M.; Kim, D.H.; Yang, J.; Kim, K.H. Fed-Batch enzymatic saccharification of high solids pretreated lignocellulose for obtaining high titers and high yields of glucose. Appl. Biochem. Biotechnol. 2017, 182, 1108–1120. [Google Scholar] [CrossRef] [PubMed]
  30. Wojtusik, M.; Zurita, M.; Villar, J.C.; Ladero, M.; Garcia-Ochoa, F. Influence of fluid dynamic conditions on enzymatic hydrolysis of lignocellulosic biomass: Effect of mass transfer rate. Bioresour. Technol. 2016, 216, 28–35. [Google Scholar] [CrossRef] [PubMed]
  31. Corrêa, L.J.; Badino, A.C.; Cruz, A.J.G. Mixing design for enzymatic hydrolysis of sugarcane bagasse: Methodology for selection of impeller configuration. Bioprocess Biosyst. Eng. 2016, 39, 285–294. [Google Scholar] [CrossRef] [PubMed]
  32. Satari, B.; Palhed, J.; Karimi, K.; Lundin, M.; Taherzadeh, M.J.; Zamani, A. Process optimization for citrus waste biorefinery via simultaneous pectin extraction and pretreatment. BioResources 2017, 12, 1706–1722. [Google Scholar] [CrossRef]
  33. Hosseini, S.S.; Khodaiyan, F.; Yarmand, M.S. Optimization of microwave assisted extraction of pectin from sour orange peel and its physicochemical properties. Carbohydr. Polym. 2016, 140, 59–65. [Google Scholar] [CrossRef] [PubMed]
  34. Sluiter, A.; Hames, B.; Ruiz, R.; Scarlata, C.; Sluiter, J.; Templeton, D.; Crocker, D. Determination of Structural Carbohydrates and Lignin in Biomass; National Renewable Energy Laboratory: Golden, CO, USA, 2008.
  35. Sluiter, A.; Hames, B.; Ruiz, R.; Scarlata, C.; Sluiter, J.; Templeton, D. Determination of Sugars, Byproducts, and Degradation Products in Liquid Fraction Process Samples; National Renewable Energy Laboratory: Golden, CO, USA, 2006.
  36. Sluiter, A.; Ruiz, R.; Scarlata, C.; Sluiter, J.; Templeton, D. Determination of Extractives in Biomass; National Renewable Energy Laboratory: Golden, CO, USA, 2008.
  37. Dashtban, M.; Maki, M.; Leung, K.T.; Mao, C.; Qin, W. Cellulase activities in biomass conversion: Measurement methods and comparison. Crit. Rev. Biotechnol. 2010, 30, 302–309. [Google Scholar] [CrossRef] [PubMed]
  38. Dalal, S.; Sharma, A.; Gupta, M.N. A multipurpose immobilized biocatalyst with pectinase, xylanase and cellulase activities. Chem. Central J. 2007, 1, 16. [Google Scholar] [CrossRef] [PubMed]
  39. Bradford, M.M. A rapid and sensitive method for the quantitation of microgram quantities of protein utilizing the principle of Protein-Dye binding. Anal. Biochem. 1976, 72, 248–254. [Google Scholar] [CrossRef]
  40. Wojtusik, M.; Rodríguez, A.; Ripoll, V.; Santos, V.E.; García, J.L.; García-Ochoa, F. 1,3-Propanediol production by Klebsiella oxytoca NRRL-B199 from glycerol. Medium composition and operational conditions. Biotechnol. Rep. 2015, 6, 100–107. [Google Scholar] [CrossRef] [PubMed] [Green Version]
  41. Rao, R.S.; Kumar, C.G.; Prakasham, R.S.; Hobbs, P.J. The Taguchi methodology as a statistical tool for biotechnological applications: A critical appraisal. Biotechnol. J. 2008, 3, 510–523. [Google Scholar] [CrossRef] [PubMed]
  42. Akhtar, N.; Goyal, D.; Goyal, A. Characterization of microwave-alkali-acid pre-treated rice straw for optimization of ethanol production via simultaneous saccharification and fermentation (SSF). Energy Convers. Manag. 2017, 141, 133–144. [Google Scholar] [CrossRef]
  43. Kopelman, R. Fractal Reaction Kinetics. Science 1988, 241, 1620–1626. [Google Scholar] [CrossRef] [PubMed]
  44. Wojtusik, M.; Zurita, M.; Villar, J.C.; Ladero, M.; Garcia-Ochoa, F. Enzymatic saccharification of acid pretreated corn stover: Empirical and fractal kinetic modelling. Bioresour. Technol. 2016, 220, 110–116. [Google Scholar] [CrossRef] [PubMed]
  45. Fockink, D.H.; Urio, M.B.; Sánchez, J.H.; Ramos, L.P. Enzymatic hydrolysis of steam-treated sugarcane bagasse: Effect of enzyme loading and substrate total solids on its fractal kinetic modeling and rheological properties. Energy Fuels 2017, 31, 6211–6220. [Google Scholar] [CrossRef]
Figure 1. Results for deep enzymatic saccharification for various OPW (Orange Waste) solids obtained by several mechanical and hydrothermal pretreatments: (a) Percentual total yield (YT) to glucose at 72 h; (b) Final glucose concentration liberated at 72 h.
Fermentation 03 00037 g001
Figure 2. Taguchi plots (SNR vs. level for each factor) for the global yield to glucose.
Fermentation 03 00037 g002
Figure 3. Taguchi plots (SNR vs. level for each factor) for the saccharification yield to glucose.
Fermentation 03 00037 g003
Figure 4. Fitting of the fractal models to the conversion data of monomers liberated during the saccharification process in optimal conditions to maximize the total glucose yield.
Fermentation 03 00037 g004
Table 1. Compositional analysis of original and pretreated solids based on NREL methodology (National Renewable Energy Laboratory, US Department of Energy).
OPW PretreatmentSolid Dry WeightGlucan Sol/InsXylan Sol/InsOther Sugars Sol/InsPectin Sol/InsLignin/Ash
Knife Milling (KM)16.5 ± 0.25.12/12.90.04/0.721.91/13.50/18.66.47/3.72
KM+ 6 h LHW 1.2 atm 120 °C15.7 ± 0.46.41/13.70.06/0.812.56/13.22.42/17.27.21/3.96
KM+ 24 h LHW 1.2 atm 120 °C15.1 ± 0.26.96/14.40.06/0.844.56/12.94.56/14.27.42/4.01
KM+ 40 min MW 500 w 1.2 atm 120 °C12.1 ± 0.37.89/15.40.45/1.127.56/8.457.84/12.28.12/4.29
KM+ 80 min MW 500 w 1.2 atm 120 °C10.9 ± 0.18.95/17.10.89/1.0410.2/4.689.41/8.568.23/4.56
KM+ 40 min direct steaming10.2 ± 0.410.6/11.51.12/0.9810.5/4.219.24/8.699.12/5.14
All results in % or % dry solid; Sol/Ins = soluble/insoluble; atm = atmosphere (pressure).
Table 2. L9 Taguchi matrix for exploring the experimental range of dry solid to liquid ratio and the diverse enzymatic activities included in the final enzymatic cocktail.
Run% DSCellulase FPU/g DSβ-Glucosidase (UI)/g DSPolygalacturonase UI/g PectinProtein/Dry Solid mg/g
1-1’6.116.08112167010.29
2-2’6.1112.152232134020.58
3-3’6.1124.303503285031.16
4-4’9.526.081232285030.40
5-5’9.5212.15250367010.75
6-6’9.5224.303121134020.88
7-7’11.536.08150367010.57
8-8’11.5312.152121285030.51
9-9’11.5324.303232134020.96
Factor A: DS/L ratio; Factor B: Cellulase; Factor C: β-glucosidase; Factor D: Polygalacturonase. Each factor has three levels or values (in italics).
Table 3. L9 Taguchi matrix results in terms of monomer concentrations in the fluid phase and total and saccharification yield to glucose after 72 h.
RunDP ≥ 2 (g/L)Glucose (g/L)Fructose (g/L)Ara + gal + xyl (g/L)Galacturonic Acid (g/L)YTYS
1-1’1.3014.5611.561.824.5250.9010.72
2-2’1.2416.8813.402.195.9861.8730.65
3-3’1.0122.6418.304.279.2882.9569.01
4-4’2.0228.4823.455.4211.9777.7358.78
5-5’0.9033.1124.743.689.4089.8981.62
6-6’1.4634.0626.414.0312.5892.4886.33
7-7’1.3545.0232.125.3212.9499.6899.42
8-8’1.1245.2736.215.6417.7099.7099.46
9-9’2.7041.8732.734.897.8992.7586.82
Table 4. L9 Taguchi matrix enzyme cost analysis with the glucose/fructose mixture as final monosaccharide mixture (compared to a 42 HFCS 75–85% syrup acting as benchmark).
RunEnzyme Cost per RunGlucose (g/L)Fructose (g/L)glu+fru (kg/10 L) fru glu + fru Enzyme Cost (€/kg glu+fru)
1-1′0.046814.5611.560.26120.440.18
2-2′0.128516.8813.40.30280.440.42
3-3′0.257022.6418.30.40940.450.63
4-4′0.217728.4823.450.51930.450.42
5-5′0.189433.1124.740.57850.430.33
6-6′0.173234.0626.410.60470.440.29
7-7′0.244545.0232.120.77140.420.32
8-8′0.297545.2736.210.81480.440.37
9-9′0.169141.8732.730.7460.440.23
Table 5. Kinetic and goodness-of-fit parameters for the fractal models.
ParameterGlucoseFructoseXyloseGalacturonic AcidArabinoseGalactose
k′0.32 ± 0.030.47 ± 0.050.327± 0.0210.116± 0.0030.0098± 0.0010.0092 ± 0.0003
h0.62 ± 0.070.91 ± 0.091.11 ± 0.050.72 ± 0.010.15 ± 0.040.14 ± 0.01
SQR0.00270.001120.001120.0000960.000180.000016
RMSE0.01980.0210.00110.00370.0050.0015
F-value42943835642041,795319532,769

