Selecting an optimal probiotic carrier for kombucha fermentation plays a key role in enhancing probiotic viability while preserving the beverage’s functional properties. This study systematically investigates probiotic survival, fermentation dynamics, and stability during storage through a multi-criteria decision-making framework. The research unfolds in three critical stages: (1) evaluating probiotic survival across different carriers, (2) examining how carrier selection affects kombucha fermentation parameters, and (3) assessing probiotic stability over storage time. To ensure data-driven optimization, CA, PCA, and advanced mathematical models, including kinetic modeling and ANN, were applied. The findings offer a detailed perspective on how various carriers influence probiotic retention, fermentation kinetics, and overall kombucha quality. The following sections provide an in-depth analysis, reinforced by statistical validation and predictive modeling.
3.1. Step 1: Probiotic Survival in Different Carriers
The probiotic survival varies significantly depending on the carrier type, pH level, and storage time, with statistically significant differences observed (
p < 0.05) between samples based on Tukey’s HSD test (database is provided as
Supplementary Table S1). The pea protein and whey protein carriers provide better protection for probiotics than maltodextrin, inulin, and pectin carriers, particularly under the acidic conditions and pH values that typically change during kombucha fermentation, where degradation is most pronounced for probiotic survival in maltodextrin, inulin, and pectin. Pea protein and whey protein carriers provide the highest probiotic stability, with initial values ranging from 8.09 to 8.185 log CFU/mL and 8.499 to 8.835 log CFU/mL, respectively, across all pH levels. Over time, the pea protein carrier shows a moderate decline in probiotic survival, particularly at pH 2.5, where it decreases from 8.124 at day 0 to 7.730 at day 10, corresponding to a 0.394 log reduction, while probiotic survival in the whey protein carrier remains stable under neutral conditions but declines significantly at pH 2.5 (from 8.499 at day 0 to 7.033 at day 10, representing a 1.466 log reduction). The probiotic survival in maltodextrin, inulin, and pectin carriers exhibits greater degradation under acidic conditions. The probiotic survival in maltodextrin declines rapidly at pH 2.5, from 8.029 (day 0) to 4.657 (day 1), corresponding to a 3.372 log reduction, and is undetectable by day 10. The probiotic survival in inulin follows a similar trend, dropping from 6.866 (day 0) to 1.617 (day 2), corresponding to a 5.249 log reduction and becoming undetectable by day 7 at pH 2.5, but remaining stable at higher pH levels. The probiotic survival in pectin is the most sensitive to acidity. After 1 h of addition, survivability decreased to 4.344 (time 0, pH 2.5) and continued to further drop, reaching 0.000 by day 4. In neutral and higher pH environments (pH 4–4.5), probiotic survival demonstrates greater stability for all carriers, with survival values remaining above 5.0 log CFU/mL for most carriers up to day 10.
The diagrams in
Figure 2 depict probiotic survival (log CFU/mL) across different carriers (pea protein, whey protein, maltodextrin, inulin, and pectin), with data points representing sample ages from 0 to 10 days. The results indicate a consistent trend across all samples, showing a gradual changes in probiotic survival over time.
Previous studies indicate that whey [
68] and pea proteins [
49] are commonly used carriers for probiotic bacteria since they have specific physicochemical properties, such as good emulsification, gelation, and fill-forming and water binding capacities [
49,
69]. Sun et al. [
28] successfully encapsulated the
Lactobacillus plantarum strain using whey protein, thus promoting its survivability and stability in apple juice during refrigerated storage. Polysaccharides are also commonly used; for example, Tarifa et al. [
46] encapsulated two
Lactobacillus sp. strains in pectin and pectin inulin microgels and their shelf life was extended but the results of survivability under simulated gastric and intestinal conditions were not as high as expected. This degradability under lower pH values of pectin and inulin is in correlation with the results of the current study. The stability of encapsulated cells in pectin, inulin, and maltodextrin could be further improved by coating the capsules with additional materials, such as chitosan or gelatine [
70].
Analysis of the coefficient values (
a,
b,
c, and
d) from the kinetics study shown in
Figure 2 using a four-parameter sigmoidal mathematical model (
Table 1) reveals that coefficient
a remains relatively consistent across most carriers and pH levels (ranging from 6.9 to 8.9), while
b shows greater variability with values often close to 0 but exceeding 15 in some cases (e.g., for whey protein at pH 4.5 with
b = 18.0). Coefficient
c exhibits high variability, with values close to 1 in some instances and reaching 115.0 for pectin at pH 4.5, whereas
d shows considerable variability, with notable decreases to 0 for inulin and pectin carriers at higher pH values. Coefficient
a represent a baseline property,
b is sensitive to specific protein–pH interactions, and
c and
d capture processes strongly influenced by both carrier type and pH value.
The verification kinetic model results (
Table 2) presented for various carriers across different pH levels demonstrates a generally strong model performance. Specifically, high r
2 values are observed in most instances, with values ranging from 0.644 for whey protein at pH 3 to 0.998 for maltodextrin at pH 4.5. Correspondingly, low RMSE values are also prevalent, ranging from 0.040 for maltodextrin at pH 4.5 to 0.431 for maltodextrin at pH 2.5. However, certain conditions exhibit comparatively lower accuracy. For example, the maltodextrin carrier at pH 2.5 shows an r
2 of 0.970 and an RMSE of 0.431, while the inulin carrier at pH 4 presents an
r2 of 0.024 and an RMSE of 0.193. These cases indicate reduced model accuracy in specific scenarios. Also, MBE and MPE values, while generally close to zero, show some deviations, such as an MBE of −0.051 and an MPE of 7.309 for maltodextrin at pH 2.5, and an MBE of −0.130 and an MPE of 5.817 for pectin at pH 2.5. These deviations suggest minor systematic biases in certain cases. Overall, the model demonstrates good predictive capability for most carrier–pH combinations, as evidenced by the predominantly high
r2 values and low RMSE values. However, further investigation and potential model refinement may be necessary to address the less accurate predictions observed in specific conditions, particularly those with higher RMSE and lower r
2 values, as well as those exhibiting larger deviations in MBE and MPE.
The five carriers were ranked by comparing their averages to extreme values, favoring higher values, as described by Brlek et al. [
71]. Maximizing the score identified whey protein as the optimal carrier, while pea protein also had a very high score (
Table 3). All other types of carriers obtained scores below 0.5, which was crucial for the selection of a protein-based carrier for further experiment steps. Although polysaccharide carriers have various advantages in the encapsulation of probiotics, such as high stability and availability, they also have reactive functional groups and are brittle and sensitive to moisture. On the other hand, protein encapsulation adds to the nutritional value of the product and due to their amphiphilic nature, they are suitable candidates for the encapsulation of probiotics. Whey protein, in particular, has shown the ability to enhance the resilience of probiotics [
72].
The correlation analysis (
Table 4) shows varying degrees of associations between the different carriers, with some statistically significant relationships. The correlation between pea protein and whey protein carriers (r = 0.472,
p = 0.011) is moderate and statistically significant, indicating a positive relationship. The correlation between whey protein and maltodextrin carriers (r = 0.658,
p = 0.000) is also moderate and statistically significant. Likewise, the correlations between whey protein and inulin carriers (r = 0.485,
p = 0.009) and whey protein and pectin carriers (r = 0.602,
p = 0.001) are moderate and statistically significant. The correlation between maltodextrin and inulin carriers (r = 0.902,
p = 0.000) is very strong and statistically significant, as is the correlation between maltodextrin and pectin carriers (r = 0.937,
p = 0.000), indicating strong positive relationships. Similarly, the correlation between inulin and pectin carriers (r = 0.918,
p = 0.000) is also very strong and statistically significant.
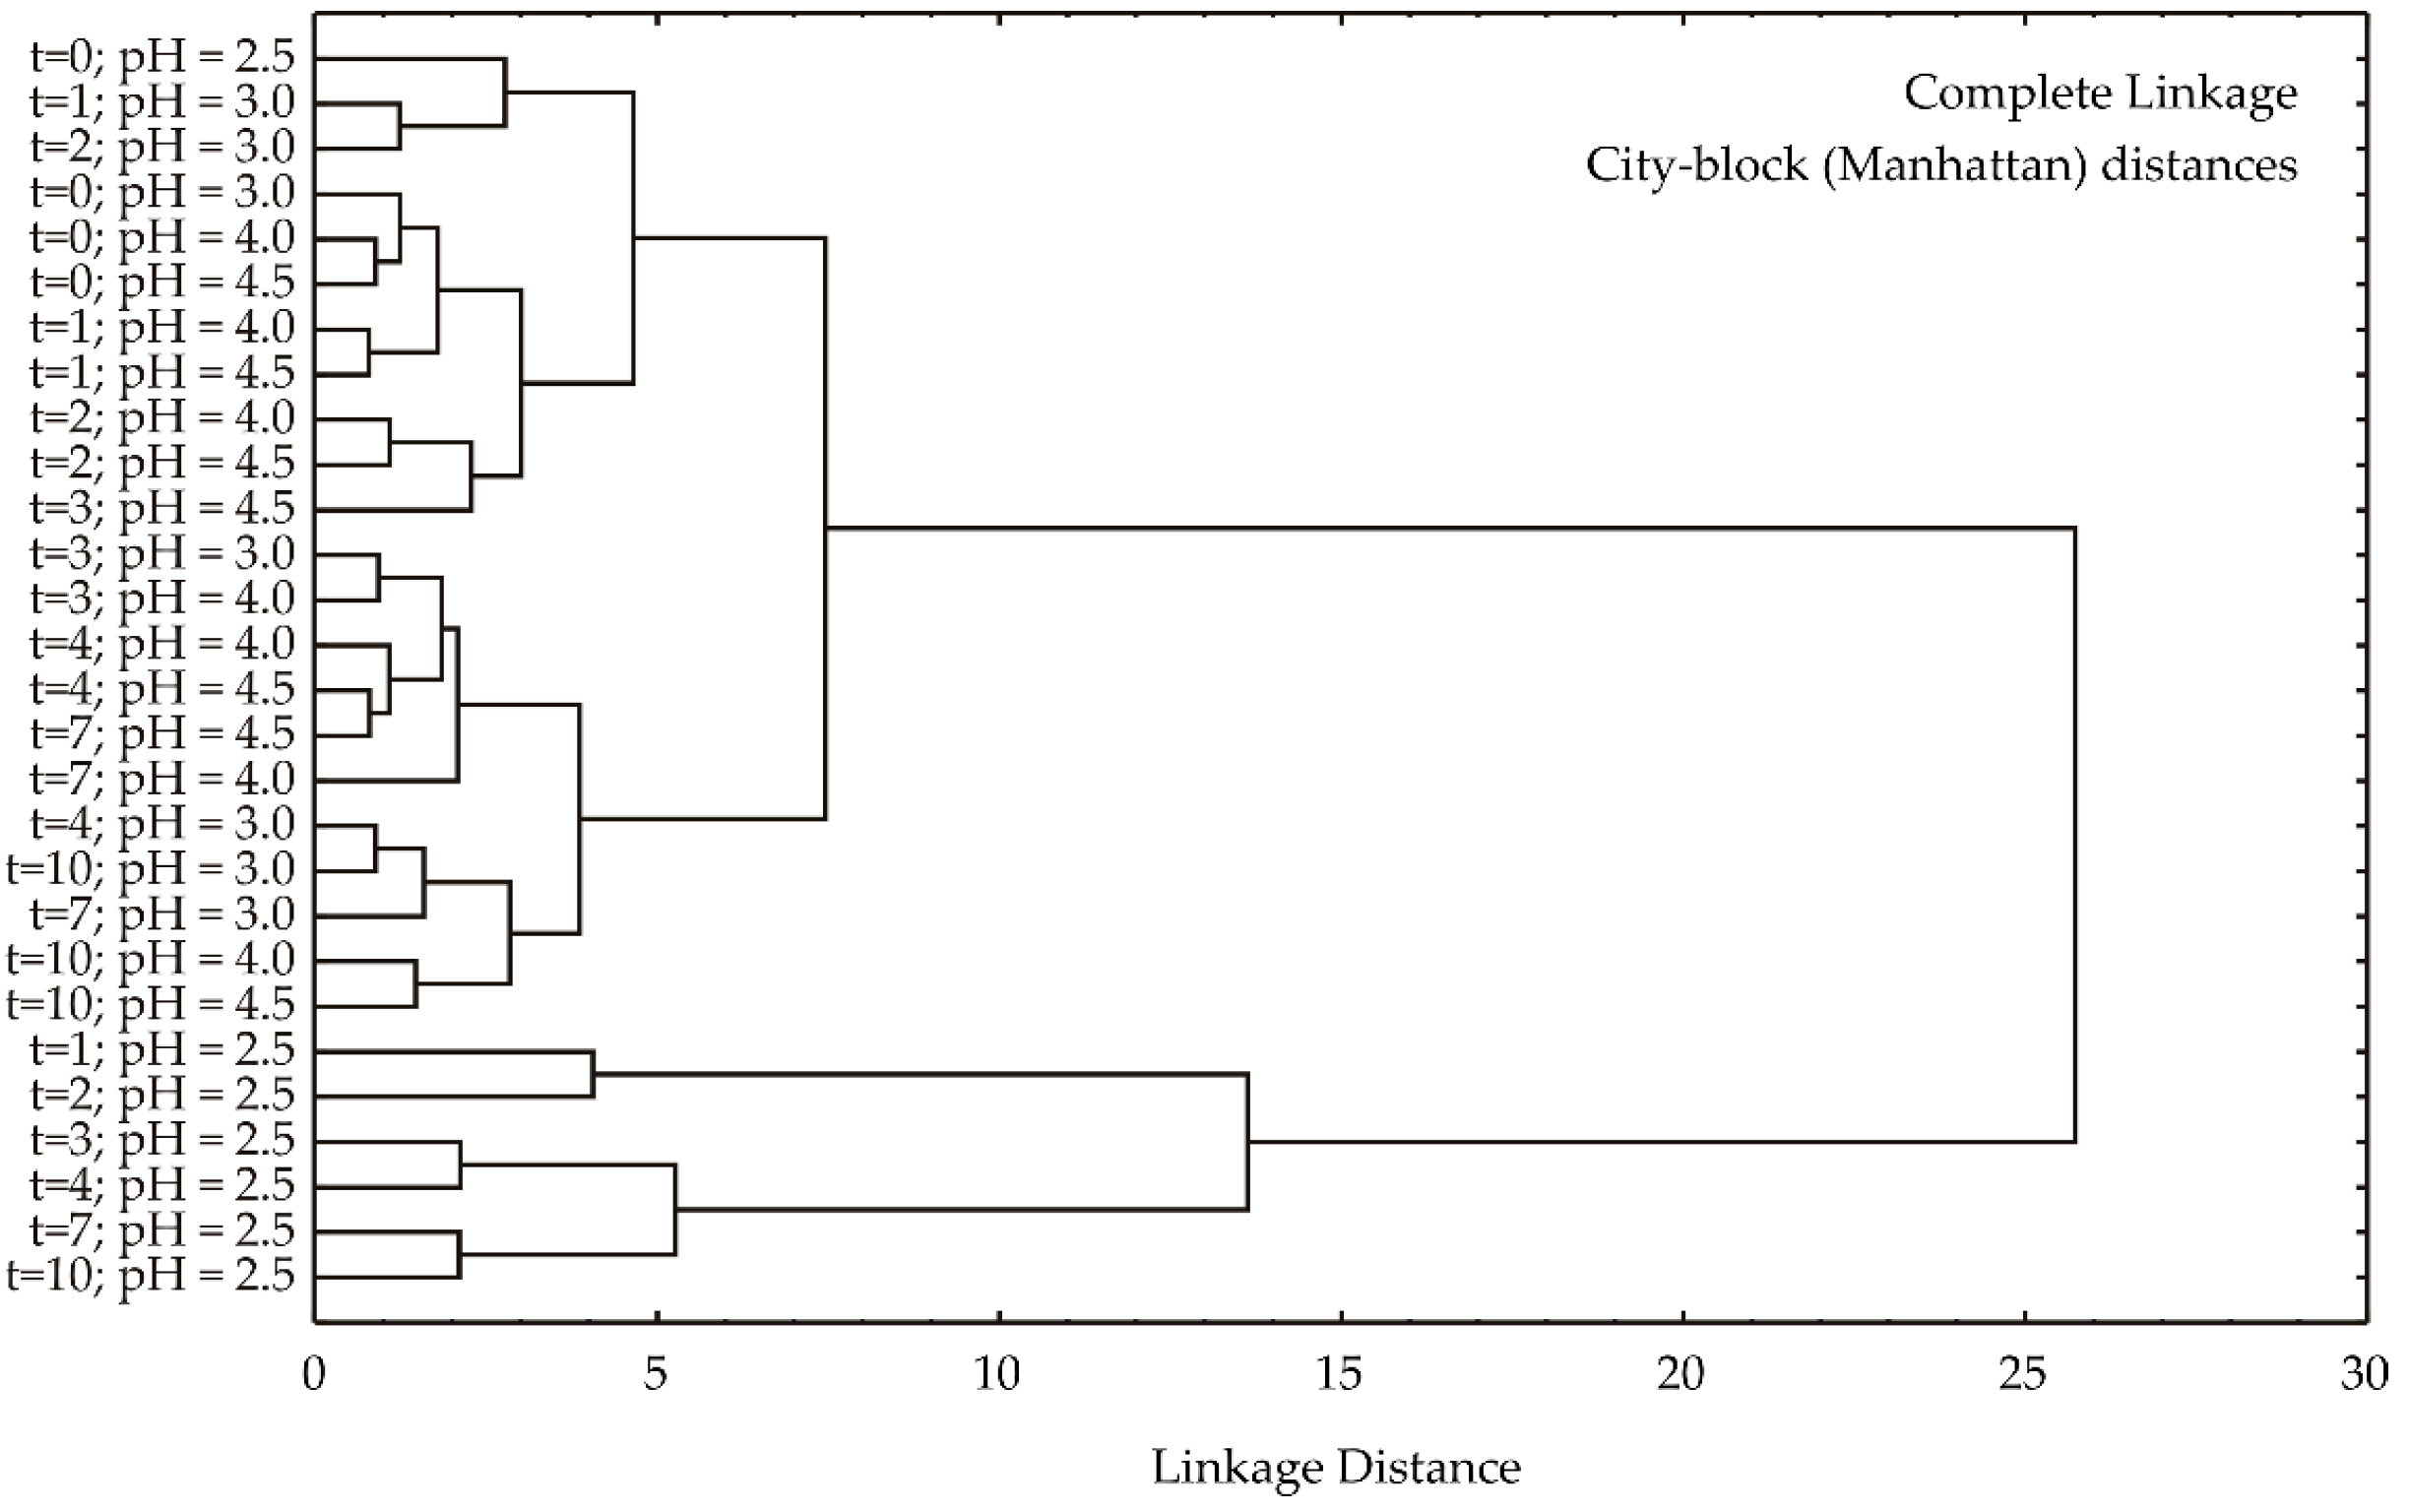
Based on the dendrogram resulting from a hierarchical cluster analysis using complete linkage and city-block (Manhattan) distances (
Figure 3), a clear separation of samples into two primary clusters is observed. The first cluster is exclusively composed of samples with a pH of 2.5, while the second cluster encompasses all remaining samples with pH values of 3.0–4.5. This primary division suggests that pH is the dominant factor influencing sample differentiation. Within the second cluster, further sub-structuring is evident. It is noted that samples with pH 4.0 and 4.5 are closely intermixed, indicating a high degree of similarity. In contrast, a temporal trend is discerned within the pH 3.0 subgroup, where samples from earlier time points appear to cluster separately from those at later time points. This suggests that while pH is the primary determinant of sample clustering, temporal changes also contribute to sample variability.
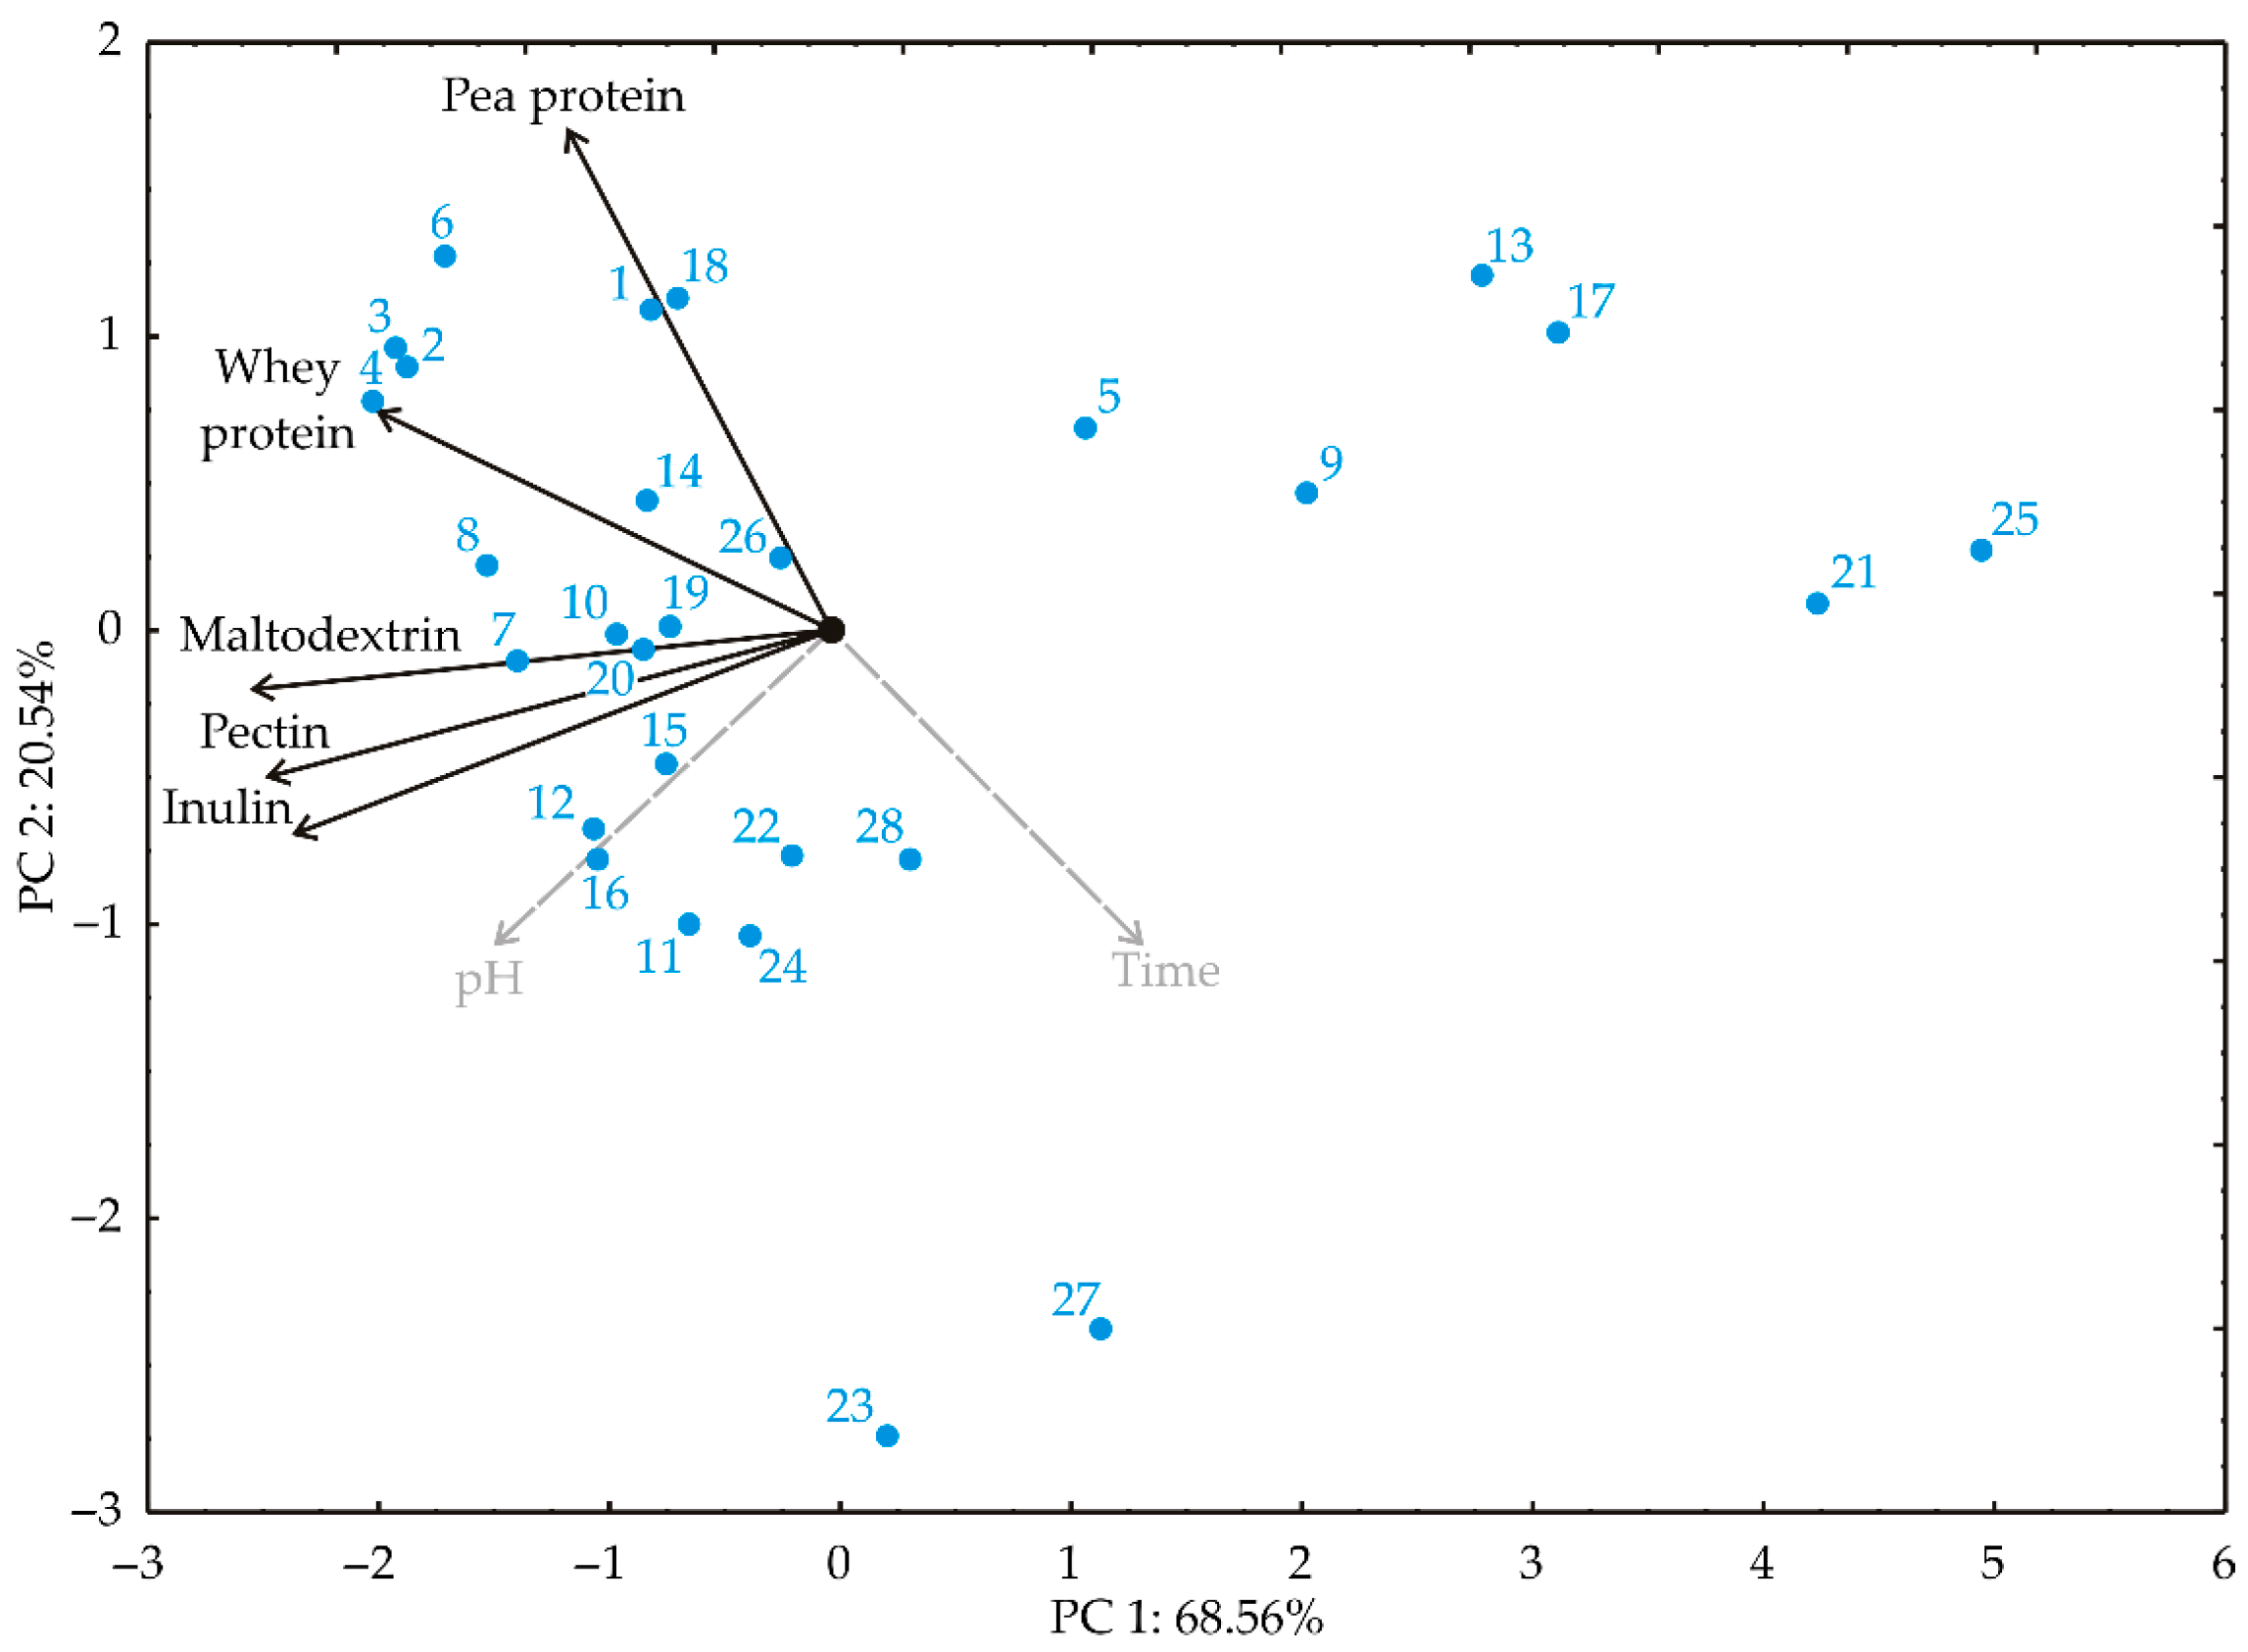
PCA was used to explore the relationships between variables during probiotic survival experiments in different carriers and during the kombucha fermentation process. In the PCA plot (
Figure 4), the proximity of spots signifies similarity in patterns [
73]. The direction of vectors in the factor space indicates variable trends, while their length represents the strength of the correlation between the fitting value and the variable [
74]. Smaller angles between variables denote stronger correlations. The first two principal components demonstrated 89.10% of the total variance in the recorded data. The first PC explained 68.56%, and the second explained 20.54% of the total variance between the collected data (eigenvalues were 3.428 and 1.027 for the first two PCs). The projection of the variables in the factor plane indicated that whey protein (−17.01%, based on correlation), maltodextrin (−27.56%), inulin (−23.68%), and pectin (−26.09%) contributed most negatively to the first principal component (PC1). Pea protein (68.36%, based on correlation) and whey protein (12.93%) contributed positively to the second principal component (PC2), while inulin (−11.64%) contributed negatively to PC2.
The optimal neural network models (
Figure 5) for predicting probiotic survival in different carriers demonstrated strong generalization capabilities for the collected data and can accurately predict the observed outputs based on input parameters such as pH value and carrier selection (
Table 5).
The number of neurons in the ANN models ranged from 3 to 9, which yielded the highest r2 values: 0.755, 0.868, 0.995, 0.943, and 0.980 for training, and 0.592, 0.927, 0.995, 0.744, and 0.931 during the testing cycle. Training accuracy improved as the number of training cycles increased, reaching a nearly constant value around the 40th to 50th epoch. Training beyond 50–60 epochs could potentially lead to overfitting, with 60 epochs being sufficient to achieve high model accuracy without the risk of overfitting.
The verification of the ANN models (
Table 6), applied to various carriers, reveals a generally good predictive performance, albeit with some variation across different carriers. High
r2 values, ranging from 0.694 for pea protein to 0.994 for maltodextrin, indicate a strong correlation between predicted and observed values for most carriers. However, pea protein exhibits a comparatively lower
r2 of 0.694, suggesting a somewhat reduced accuracy of prediction for this carrier. Correspondingly, the RMSE values are relatively low, ranging from 0.136 for pea protein to 0.718 for inulin, further supporting the generally good model performance. However, inulin shows a notably higher RMSE, indicating a larger average prediction error for this carrier. The MBE and MPE values, while generally close to zero, show some deviations, particularly for pea protein with an MBE of −0.018 and an MPE of 1.422, suggesting a slight systematic underestimation in this case. The ANN model demonstrates good predictive capability for most carriers, as evidenced by the predominantly high
r2 values and low RMSE values. The lower accuracy observed for pea protein and inulin, as well as the minor biases indicated by MBE and MPE values, suggest potential areas for model refinement and further investigation to enhance the overall prediction accuracy and robustness across all carriers.
3.2. Step 2: Kombucha Fermentation Parameters
The results of pH value, TA, number of yeasts, AAB, and LAB during kombucha fermentation (
Supplementary Table S2) demonstrate that the type of carrier significantly influences the fermentation process. The database includes control kombucha fermentation as well as the fermentation of kombuchas enriched with a whey protein–LAB or pea protein–LAB encapsulate system. The initial pH of uninoculated tea was 7.30 and decreased significantly in pH, ranging from 4.817 ± 0.012 for pea protein–LAB-enriched kombucha to 4.153 ± 0.015 for the control kombucha after inoculation (day 0). Over time, all kombucha samples exhibited a decrease in pH value, with whey protein–LAB-enriched kombucha and control kombucha showing the most pronounced acidification by day 4 (2.570 ± 0.010 for whey protein and 2.807 ± 0.006 for control), while pea protein–LAB-enriched kombucha maintained a higher pH value, reaching 3.100 ± 0.010 by day 4. TA increased across all treatments, with whey protein–LAB-enriched kombucha showing the highest final TA (6.090 ± 0.030), followed by the control kombucha (5.140 ± 0.035) and pea protein–LAB-enriched kombucha (4.210 ± 0.017). During kombucha fermentation, yeasts hydrolyze sucrose to glucose and fructose, thus producing ethanol. At the same time, AAB use glucose to produce gluconic acid and ethanol to produce acetic acid [
2]. Acetic acid is the most dominant acid in fermentation liquid and is responsible for the sourness of kombucha [
10]. In addition to acetic acid, through the metabolism of SCOBY microorganisms several other organic acids are produced, including lactic acid by LAB in enriched kombucha samples [
75]. The accumulation of acids over time affects TA, which linearly increases. This in turn influences the pH value that decreases gradually and stabilizes as the fermentation time increases. These results are in accordance with the standard pattern of kombucha fermentation [
76,
77,
78,
79].
The number of yeasts was 5.343, 5.347, and 5.614 log CFU/mL for the control sample, and the pea protein–LAB-enriched and whey protein–LAB-enriched kombucha samples, respectively, on day 0 and increased for about 1 log unit until the next day. Yeast counts then peaked between days 1 and 3, with the control and pea protein–LAB-enriched samples maintaining higher counts, 6.527 ± 0.196 and 6.441 ± 0.053, respectively, at day 2, while the whey protein–LAB-enriched kombucha showed a slight decline by day 2 (6.114 ± 0.163). Yeast count showed a decline on day 4 for all the samples, corresponding to 0.04, 0.44, and 1.17 log reduction for pea protein, whey protein, and control, respectively. A similar result was observed by Majid et al. [
80] where the maximum number of yeasts was noticed on the fourth day of fermentation, after which a slow decrease appeared. Cvetković et al. [
81] also noticed an increase in the number of yeasts on the first day, after which the number was relatively stable until the end of kombucha fermentation. Since there were no significant differences in yeast numbers in the enriched kombucha samples compared to the control sample, it could be concluded that the addition of carrier–LAB encapsulates did not have an influence on yeasts during the fermentation. On the other hand, more noticeable changes were observed in AAB numbers. In the control sample there was an increase in AAB numbers until day 2, after which a slight decrease appeared, reaching 5.967 log CFU/mL on day 4 of kombucha fermentation. Similarly, in pea protein–LAB-enriched kombucha an increase was observed until day 3, with a slight decrease on day 4, but still a higher number of AAB of 6.309 log CFU/mL was noticed compared to the control sample. The highest concentration of AAB was observed in whey protein–LAB-enriched kombucha, where it increased from 6.883 to 7.576 log CFU/mL on day 1, after which it remained mainly stable, reaching a maximum on day 4 of 7.832 log CFU/mL. Yang et al. [
82] noted that the presence of LAB during fermentation could support the growth and reproduction of other present bacteria, including AAB, which could be the reason for the higher numbers of AAB in enriched kombucha samples compared to the control sample. A similar pattern was noticed in the studies of Majid et al. [
80] and Cvetković et al. [
78], where the concentration of AAB was higher by the end of fermentation in the samples enriched with free LAB cells in comparison to the control. Also, the highest number of AAB in whey protein–LAB-enriched kombucha is in accordance with acetic acid production, since TA values were also the highest in this sample by the end of the 4-day fermentation. On the other hand, Wang et al. [
83] reported that the production of acetic acid was the most pronounced in the control sample compared to LAB-enriched kombucha samples and concluded that the addition of LAB strains limited the production of acids. The differences in the results of acetic acid production could be due to the different LAB strains used between the studies.
LAB growth was the highest in the whey protein–LAB-enriched kombucha (7.706 ± 0.029 at day 4), with the pea protein–LAB-enriched sample supporting moderate growth (6.550 ± 0.072 at day 3), while LAB was absent in the control sample. Since the optimal pH range for the
L. rhamnosus strain is between 6.4 and 4.5 [
84] and pH values during kombucha fermentation often decrease to below 3, it could be concluded that free cells would not survive these conditions [
27]. There is not much research available that has successfully produced a kombucha beverage that meets the requirements of a probiotic product, due to the drop in the concentration of LAB during fermentation and storage. In a previous study by Cvetković et al. [
27], the same strain of
L. rhamnosus as in the current study and an additional
L. plantarum strain were used and free cells were added at the beginning of kombucha fermentation, which lasted for 5 days. The number of both probiotic strains drastically decreased until the end of fermentation with less than 2.0 log CFU/mL on day 5, supporting the mentioned conclusion. Similarly, Bromley and Perry [
29] found that
Lactobacillus sp. final populations decreased and ranged from 1.0 to 3.0 log CFU/mL at the end of kombucha fermentation. Fu et al. [
30] concluded that the survival rate of LAB was only 0.98% on the eighth day of refrigerated storage of this beverage. On the other hand, Majid et al. [
80] managed to successfully produce blue pea tea (
Clitoria ternatea L.) kombucha with probiotic properties by adding the strain of
Lactiplantibacillus plantarum subsp. plantarum Dad-13 before 8-day fermentation, and their number after fermentation and 28-day storage was 6.26 log CFU/mL. This discrepancy in results may be due to the use of different LAB strains, as well as different tea substrates, for the preparation of kombucha.
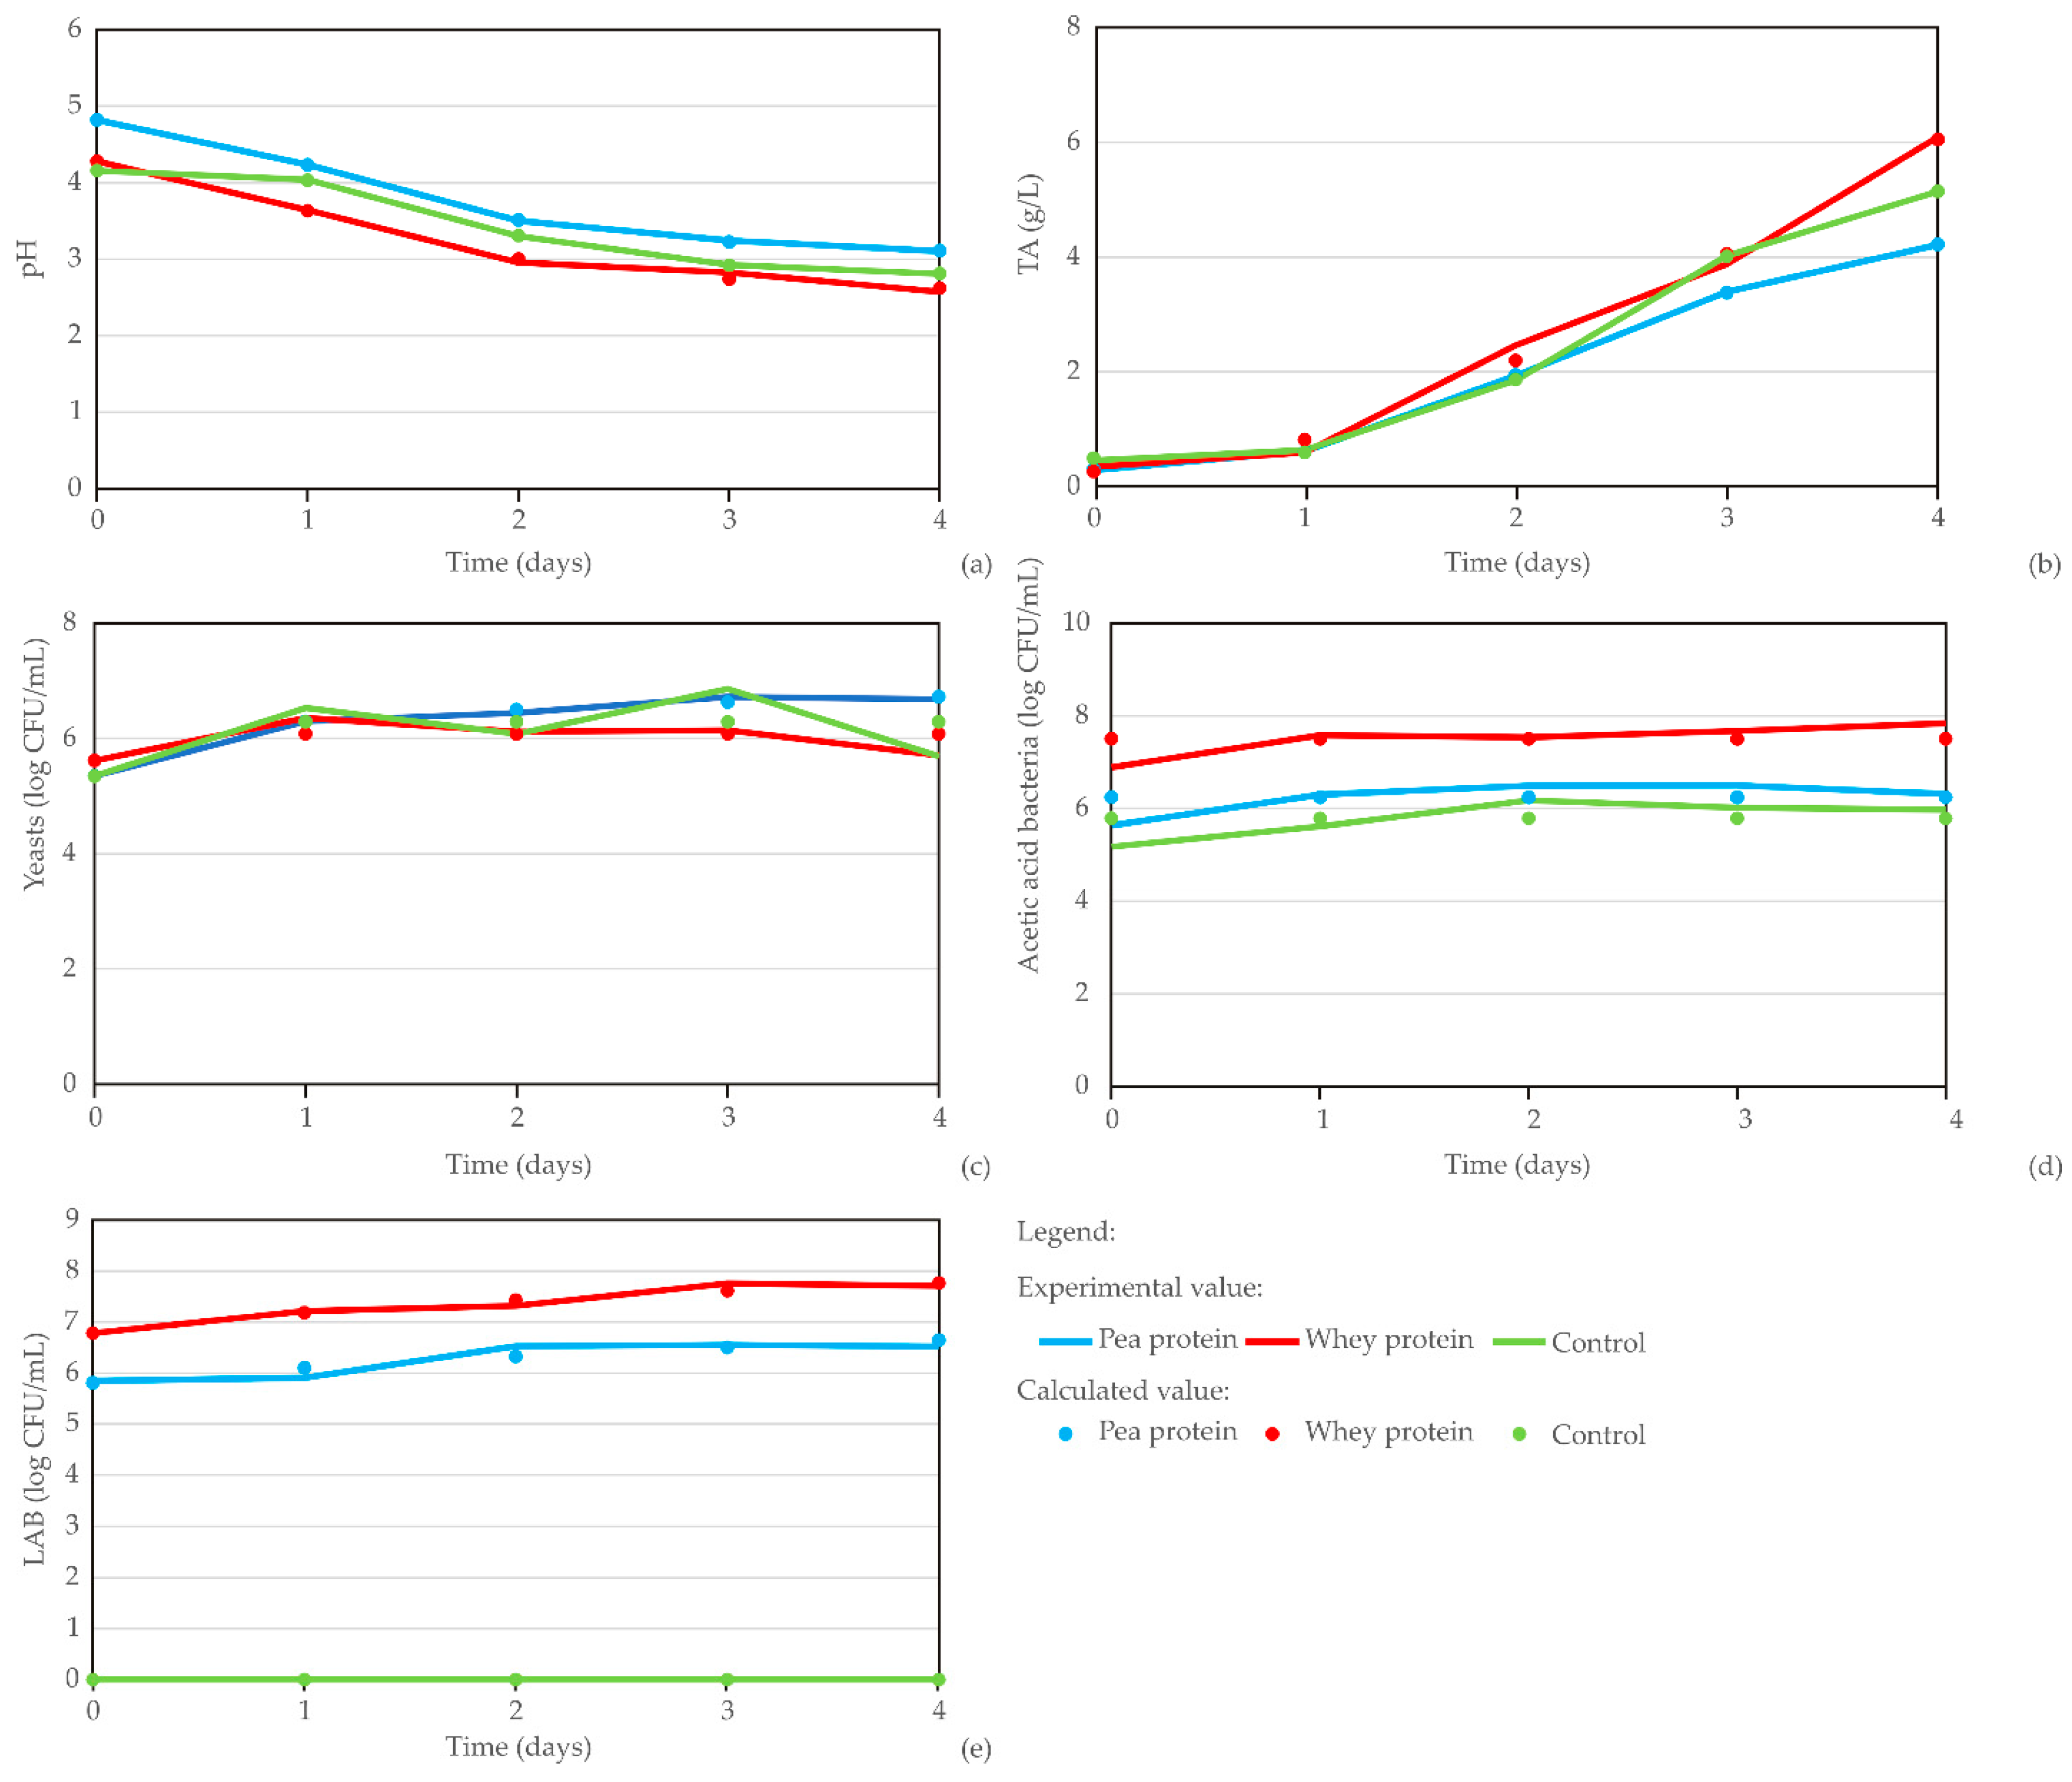
The diagrams in
Figure 6 show the kombucha fermentation parameters across different carriers (pea protein, whey protein, and control), with data points corresponding to sample ages from 0 to 4 days. The results reveal a clear trend: pH decreases while TA increases as the material ages. Meanwhile, yeast count and AAB and LAB levels remain relatively stable throughout the fermentation process.
Kinetic analysis (
Table 7) using a four-parameter model reveals that pea protein–LAB and whey protein–LAB systems differentially influence fermentation kinetics compared to the control, with the pea protein–LAB system often exhibiting slower rates of change (lower
b coefficient values, e.g., 2.4 for pH) and the whey protein–LAB system potentially promoting faster LAB growth (higher
b value of 10.4 for LAB) and higher final acidity (higher
c value of 6.4 for TA). The pea protein–LAB encapsulate sample shows a slightly higher initial pH (
a = 4.8) compared to the whey protein–LAB encapsulate sample (
a = 4.3) and the control (
a = 4.2). The high
c values for AAB with the pea protein–LAB system (159.1) and the whey protein–LAB system (25.7) suggest greater growth compared to the control. The whey protein–LAB system also exhibits a higher ‘c’ value for TA (6.4) compared to the pea protein–LAB system (1.3) and the control (1.8). Variations in ‘
d’ values indicate protein-specific effects on lag phases, with the pea protein–LAB system having a longer lag phase for yeast growth (‘d’ = 9.1) compared to the whey protein–LAB system (‘
d’ = 6.5) and the control (‘
d’ = 2.8). However, further analysis and domain expertise are needed to interpret these findings within the context of the specific model used and to elucidate the underlying mechanisms driving these observed differences.
Verification of kinetic models for various parameters (pH, TA, yeasts, AAB, LAB) across different kombucha samples (pea protein, whey protein, control) during fermentation reveals a range of model performances with varying accuracy (
Table 8). For the pea protein–LAB-enriched kombucha, pH and TA exhibit exceptional accuracy with χ
2, RMSE, and MBE values all at 0.000 and an
r2 of 1.000. Yeasts show slightly lower accuracy, with an r
2 of 0.989, χ
2 of 0.004, RMSE of 0.053, and MBE of 0.000. AAB and LAB present lower accuracy, with
r2 values of 0.066 and 0.806, respectively. Specifically, AAB have
χ2 of 0.128, RMSE of 0.320, and MBE of 0.000, while LAB show
χ2 of 0.025, RMSE of 0.142, and MBE of −0.010. For the whey protein–LAB-enriched kombucha, the pH value maintains high accuracy with χ
2 of 0.003, RMSE of 0.050, MBE of 0.000, and r
2 of 0.994. TA also shows good accuracy with χ
2 of 0.040, RMSE of 0.178, MBE of 0.000, and r
2 of 0.993. However, yeasts and AAB exhibit lower accuracy with r
2 values of 0.438 and 0.285, respectively. For yeasts, χ
2 is 0.055, RMSE is 0.210, and MBE is 0.000, while for AAB, χ
2 is 0.131, RMSE is 0.324, and MBE is 0.000. LAB in whey protein shows good accuracy with χ
2 of 0.009, RMSE of 0.085, MBE of 0.000, and r
2 of 0.943.
The control kombucha demonstrates high accuracy for pH and TA with χ2, RMSE, and MBE values all at 0.000 and r2 of 1.000. LAB also shows perfect accuracy with all metrics at 0.000. However, yeasts and AAB exhibit lower accuracy, with r2 values of 0.477 and 0.072, respectively. For yeasts, χ2 is 0.196, RMSE is 0.396, and MBE is 0.000, while for AAB, χ2 is 0.160, RMSE is 0.358, and MBE is 0.000.
The verification results highlight varying model performance across different parameters and kombucha samples. While pH and TA consistently demonstrate high accuracy, AAB and yeasts often exhibit lower accuracy, particularly in enriched kombuchas. The control sample shows high accuracy for pH, TA, and LAB, but lower accuracy for AAB and yeasts. These findings emphasize the need for further investigation and potential model refinement to improve prediction accuracy for specific parameters and carriers, ultimately enhancing the model’s overall robustness and reliability.
The control and enriched kombuchas were ranked by comparing their averages to extreme values, favoring lower values for pH value and higher values for TA, yeasts, AAB and LAB, as described by Brlek et al. [
71]. Maximizing the score identified the whey protein–LAB-enriched kombucha as the better option in view of probiotic stability for kombucha (
Table 9).
According to correlation analysis for kombucha samples (
Table 10), a strong negative correlation between pH value and TA (r = −0.895,
p = 0.000) and a moderate, statistically significant negative correlation between pH value and AAB (r = −0.515,
p = 0.049) suggest that lower pH values are associated with higher AAB concentrations. A strong positive correlation between AAB and LAB (r = 0.744,
p = 0.001) suggests that higher AAB concentrations are associated with higher LAB counts [
82].
Additionally, hierarchical cluster analysis (
Figure 7) using complete linkage and city-block distances reveals distinct clustering based on protein source, indicating that protein type carrier is a primary determinant of sample characteristics. Sub-clustering within each protein group highlights temporal variations, suggesting that protein properties evolve over time, potentially due to degradation, aggregation, or other time-dependent changes. Pea protein exhibits greater stability compared to the whey protein carrier, which shows more variability over time. The use of Manhattan distance emphasizes the magnitude of changes in measured variables, further supporting the observation of differential temporal stability among the protein sources.
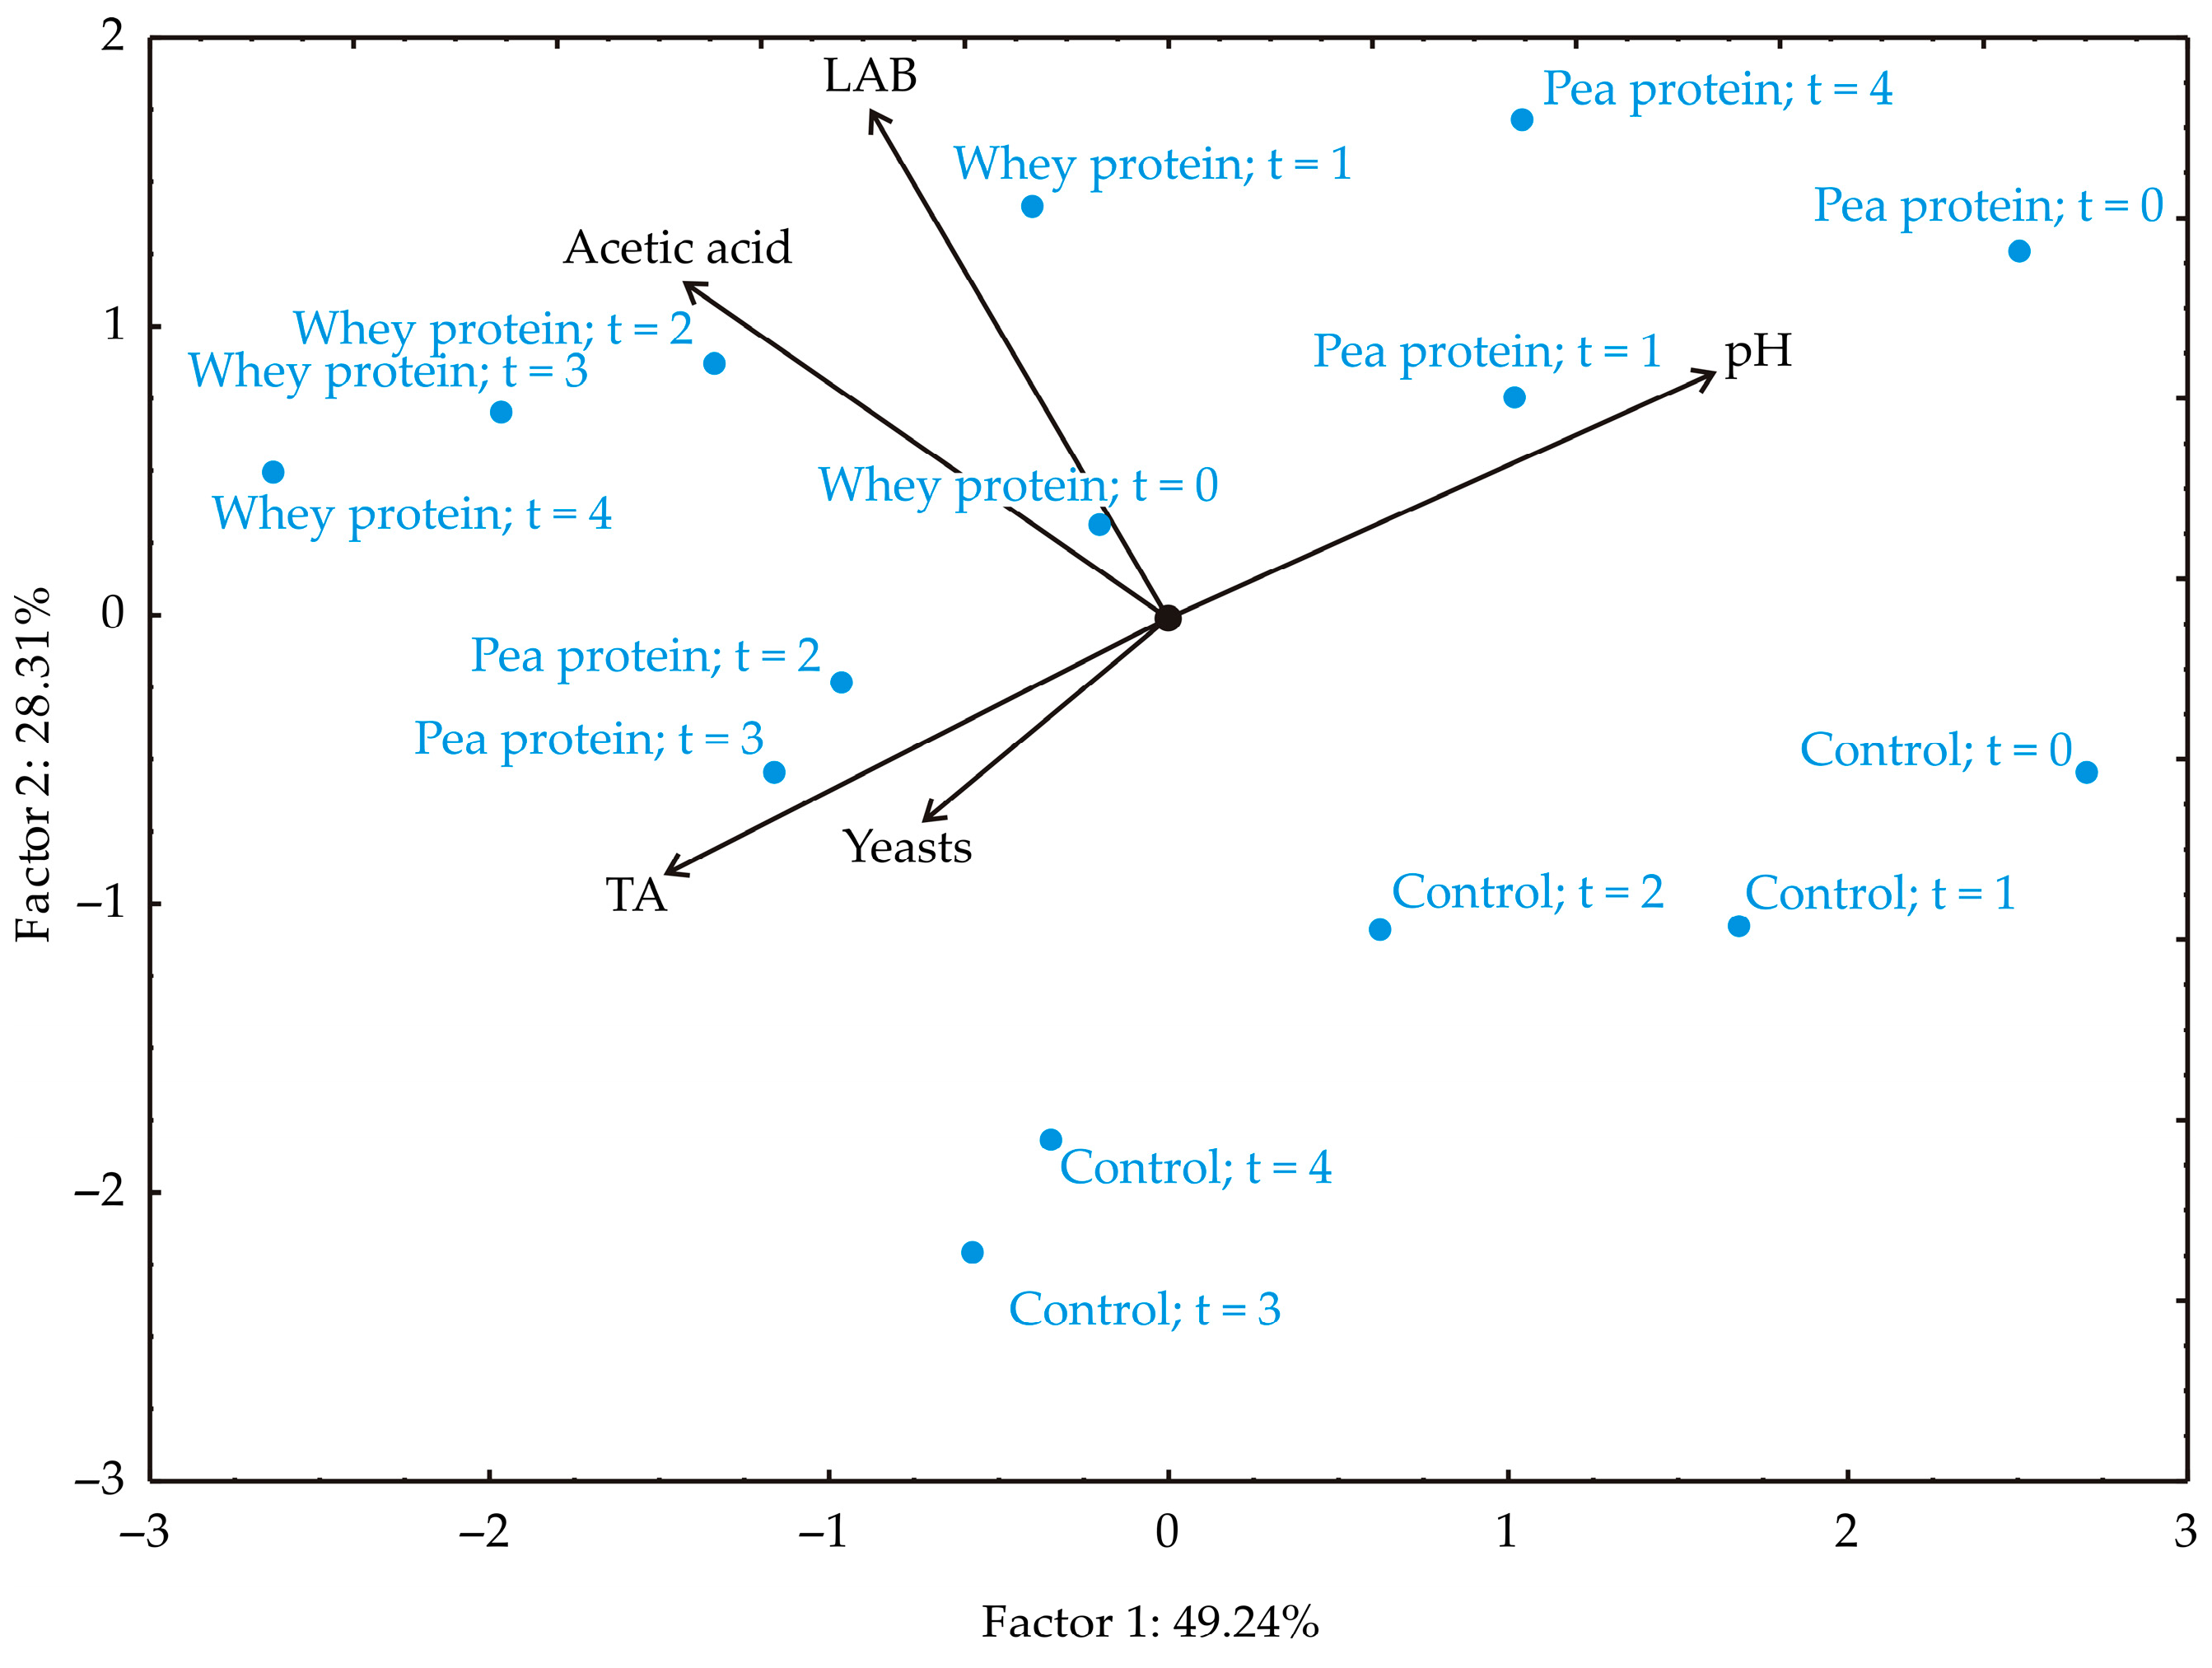
As shown in
Figure 8, the first two principal components accounted for 77.55% of the total variance in the data, with PC1 explaining 49.24% and PC2 accounting for 28.31% (eigenvalues: 2.462 and 1.416, respectively). The factor plane projection indicated that TA (−26.82%, based on correlation), AAB (−24.99%), and LAB parameters (−9.45%) contributed most negatively to PC1, while pH value contributed positively (32.25%). In PC2, pH value (11.03%), AAB (20.99%), and LAB parameters (47.84%) had positive contributions, whereas TA (−12.32%) and yeast count (−7.81%) contributed negatively.
The optimal neural network models (
Figure 9,
Table 11) for predicting kombucha parameters demonstrated strong generalization capabilities for the collected data and can accurately predict the observed outputs based on input parameters such as time and carrier selection. The model with six neurons yielded the highest
r2 values, with 0.903 for training and 0.946 during the testing cycle.
The training performance for the variables was as follows: 0.974 for pH value, 0.976 for TA, 0.641 for yeast count, 0.931 for AAB, and 0.995 for LAB. During testing, the r2 values reached 0.979 for pH value, 0.993 for TA, 0.763 for yeast count, 0.993 for AAB, and 1.000 for LAB. Training accuracy improved as the number of cycles increased, stabilizing around the 40–50th epoch. Exceeding 50–60 epochs could lead to overfitting, so 60 epochs were sufficient to achieve high model accuracy without the risk of overfitting.
The verification analysis (
Table 12), conducted across various fermentation parameters (pH, TA, yeasts, AAB, LAB), reveals a range of model performances with varying accuracy. Generally, the model demonstrates good predictive capabilities for most parameters, as evidenced by high r
2 values and relatively low RMSE values. Specifically, pH and TA exhibit strong agreement between predicted and observed values, with
r2 values of 0.946 and 0.956, respectively. LAB also shows a high
r2 value of 0.993, indicating excellent model performance for this parameter. However, the model exhibits comparatively lower accuracy for yeasts, with an r
2 value of 0.217 and a higher RMSE of 0.473. Similarly, AAB shows a moderate
r2 value of 0.890 and a higher RMSE of 0.276, suggesting some discrepancies between predicted and observed values for this parameter. The MBE and MPE values, while generally close to 0, indicate minor systematic biases for certain parameters. For instance, pH shows a slight underestimation with an MBE of −0.043, while yeasts exhibit a slight overestimation with an MBE of 0.208. Overall, the verification results demonstrate robust model performance for most fermentation parameters, particularly pH, TA, and LAB.
3.3. Step 3: LAB Stability During Storage
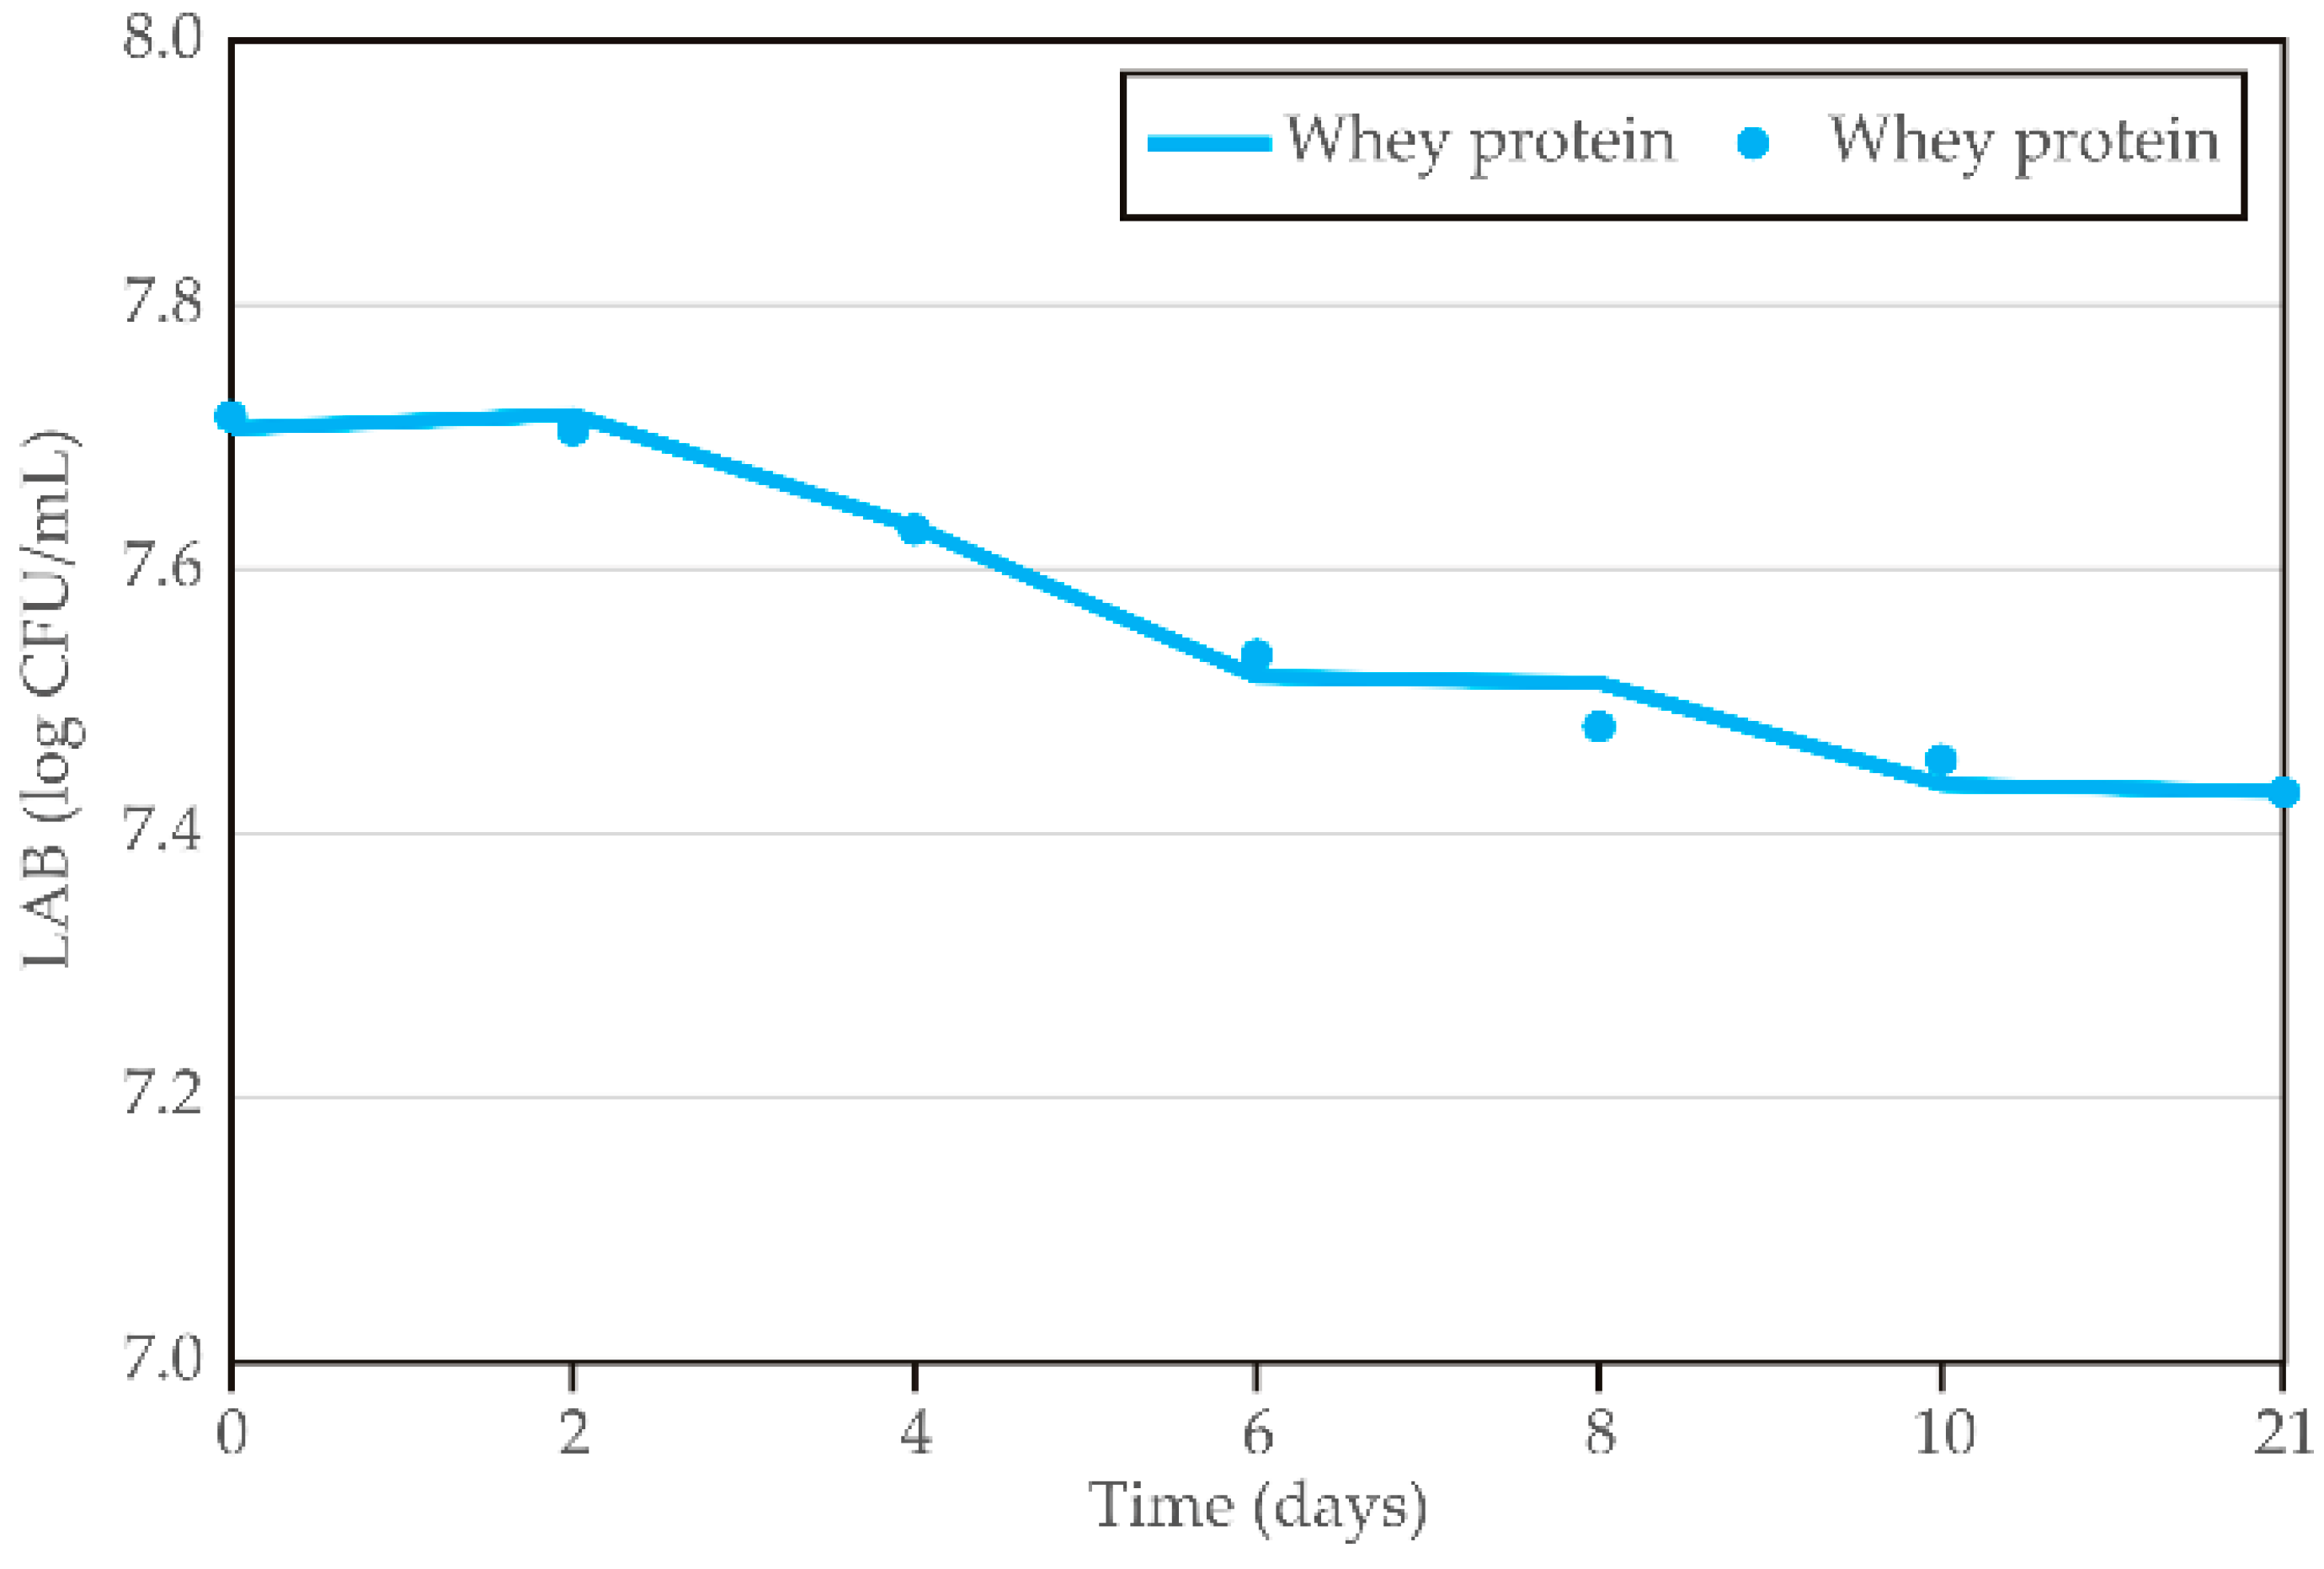
In the final step of the experimental and mathematical evaluation of the optimal carrier for LAB encapsulation and application in kombucha, whey protein was defined as the best choice according to the previously defined results. Therefore, LAB stability in this enriched kombucha was additionally evaluated during cold storage. The results obtained during cold storage of the whey protein–LAB-enriched kombucha (
Supplementary Table S3) indicate that LAB stability slightly decreases over time during storage. Initially, LAB levels remain relatively stable between 0 and 4 days (
p > 0.05), showing minor fluctuations. However, a slight decline is observed from day 6 onward (
p < 0.05), as indicated by the change in superscript letters. Between days 6 and 21, LAB levels continue to decrease, but the differences among these time points are not statistically significant. This suggests that while LAB viability gradually declines over storage period, the most pronounced reduction occurs between days 4 and 6. On the other hand, the total decreasing rate is lower than 0.3 log CFU/mL, which is microbiologically acceptable and presents minor fluctuations in LAB population in the sample. As previously mentioned, the defined minimum of probiotic concentration for a beverage to obtain therapeutic and health-improving effects is 6–7 log CFU/mL of LAB cultures [
42]. Enriched kombucha beverage in this study presented with LAB concentrations above the mentioned minimum for probiotic effect after fermentation and for all storage periods, and it can be concluded that the finalized beverage presents the targeted properties.
The diagrams in
Figure 10 show LAB stability during storage in kombucha with whey protein–LAB encapsulates, with data points representing sample ages from 0 to 21 days. The results reveal a clear trend, with LAB levels generally decreasing as the material ages. A similar decreasing trend was also noticed by Majid et al. [
80] during 28-day storage of a kombucha beverage with the addition of free
L. plantarum cells.
Kinetic analysis using a four-parameter sigmoidal model indicates that the LAB stability of whey protein–LAB-enriched kombucha during storage showed slow rates of change, as reflected by the relatively low c and b coefficients (5.1 and 3.4, respectively). The parameters a and d reached similar values (7.7 and 7.4, respectively), suggesting a potentially stable LAB value during storage.
The results in
Table 13 show that the kinetics model for LAB stability during storage provides an excellent fit to the data. The
χ2 value of 0.000 indicates no significant discrepancy between the observed and predicted values. With an RMSE of 0.017 and MBE of 0.000, the model’s predictions are accurate and unbiased. The low MPE (0.173) and SSE (0.002) further suggest minimal error in the model, while the AARD of 0.173 confirms the small average deviation between the predicted and observed values. The high
r2 value of 0.978 indicates that the model explains 97.8% of the variance in the data, demonstrating strong predictive power and reliability.
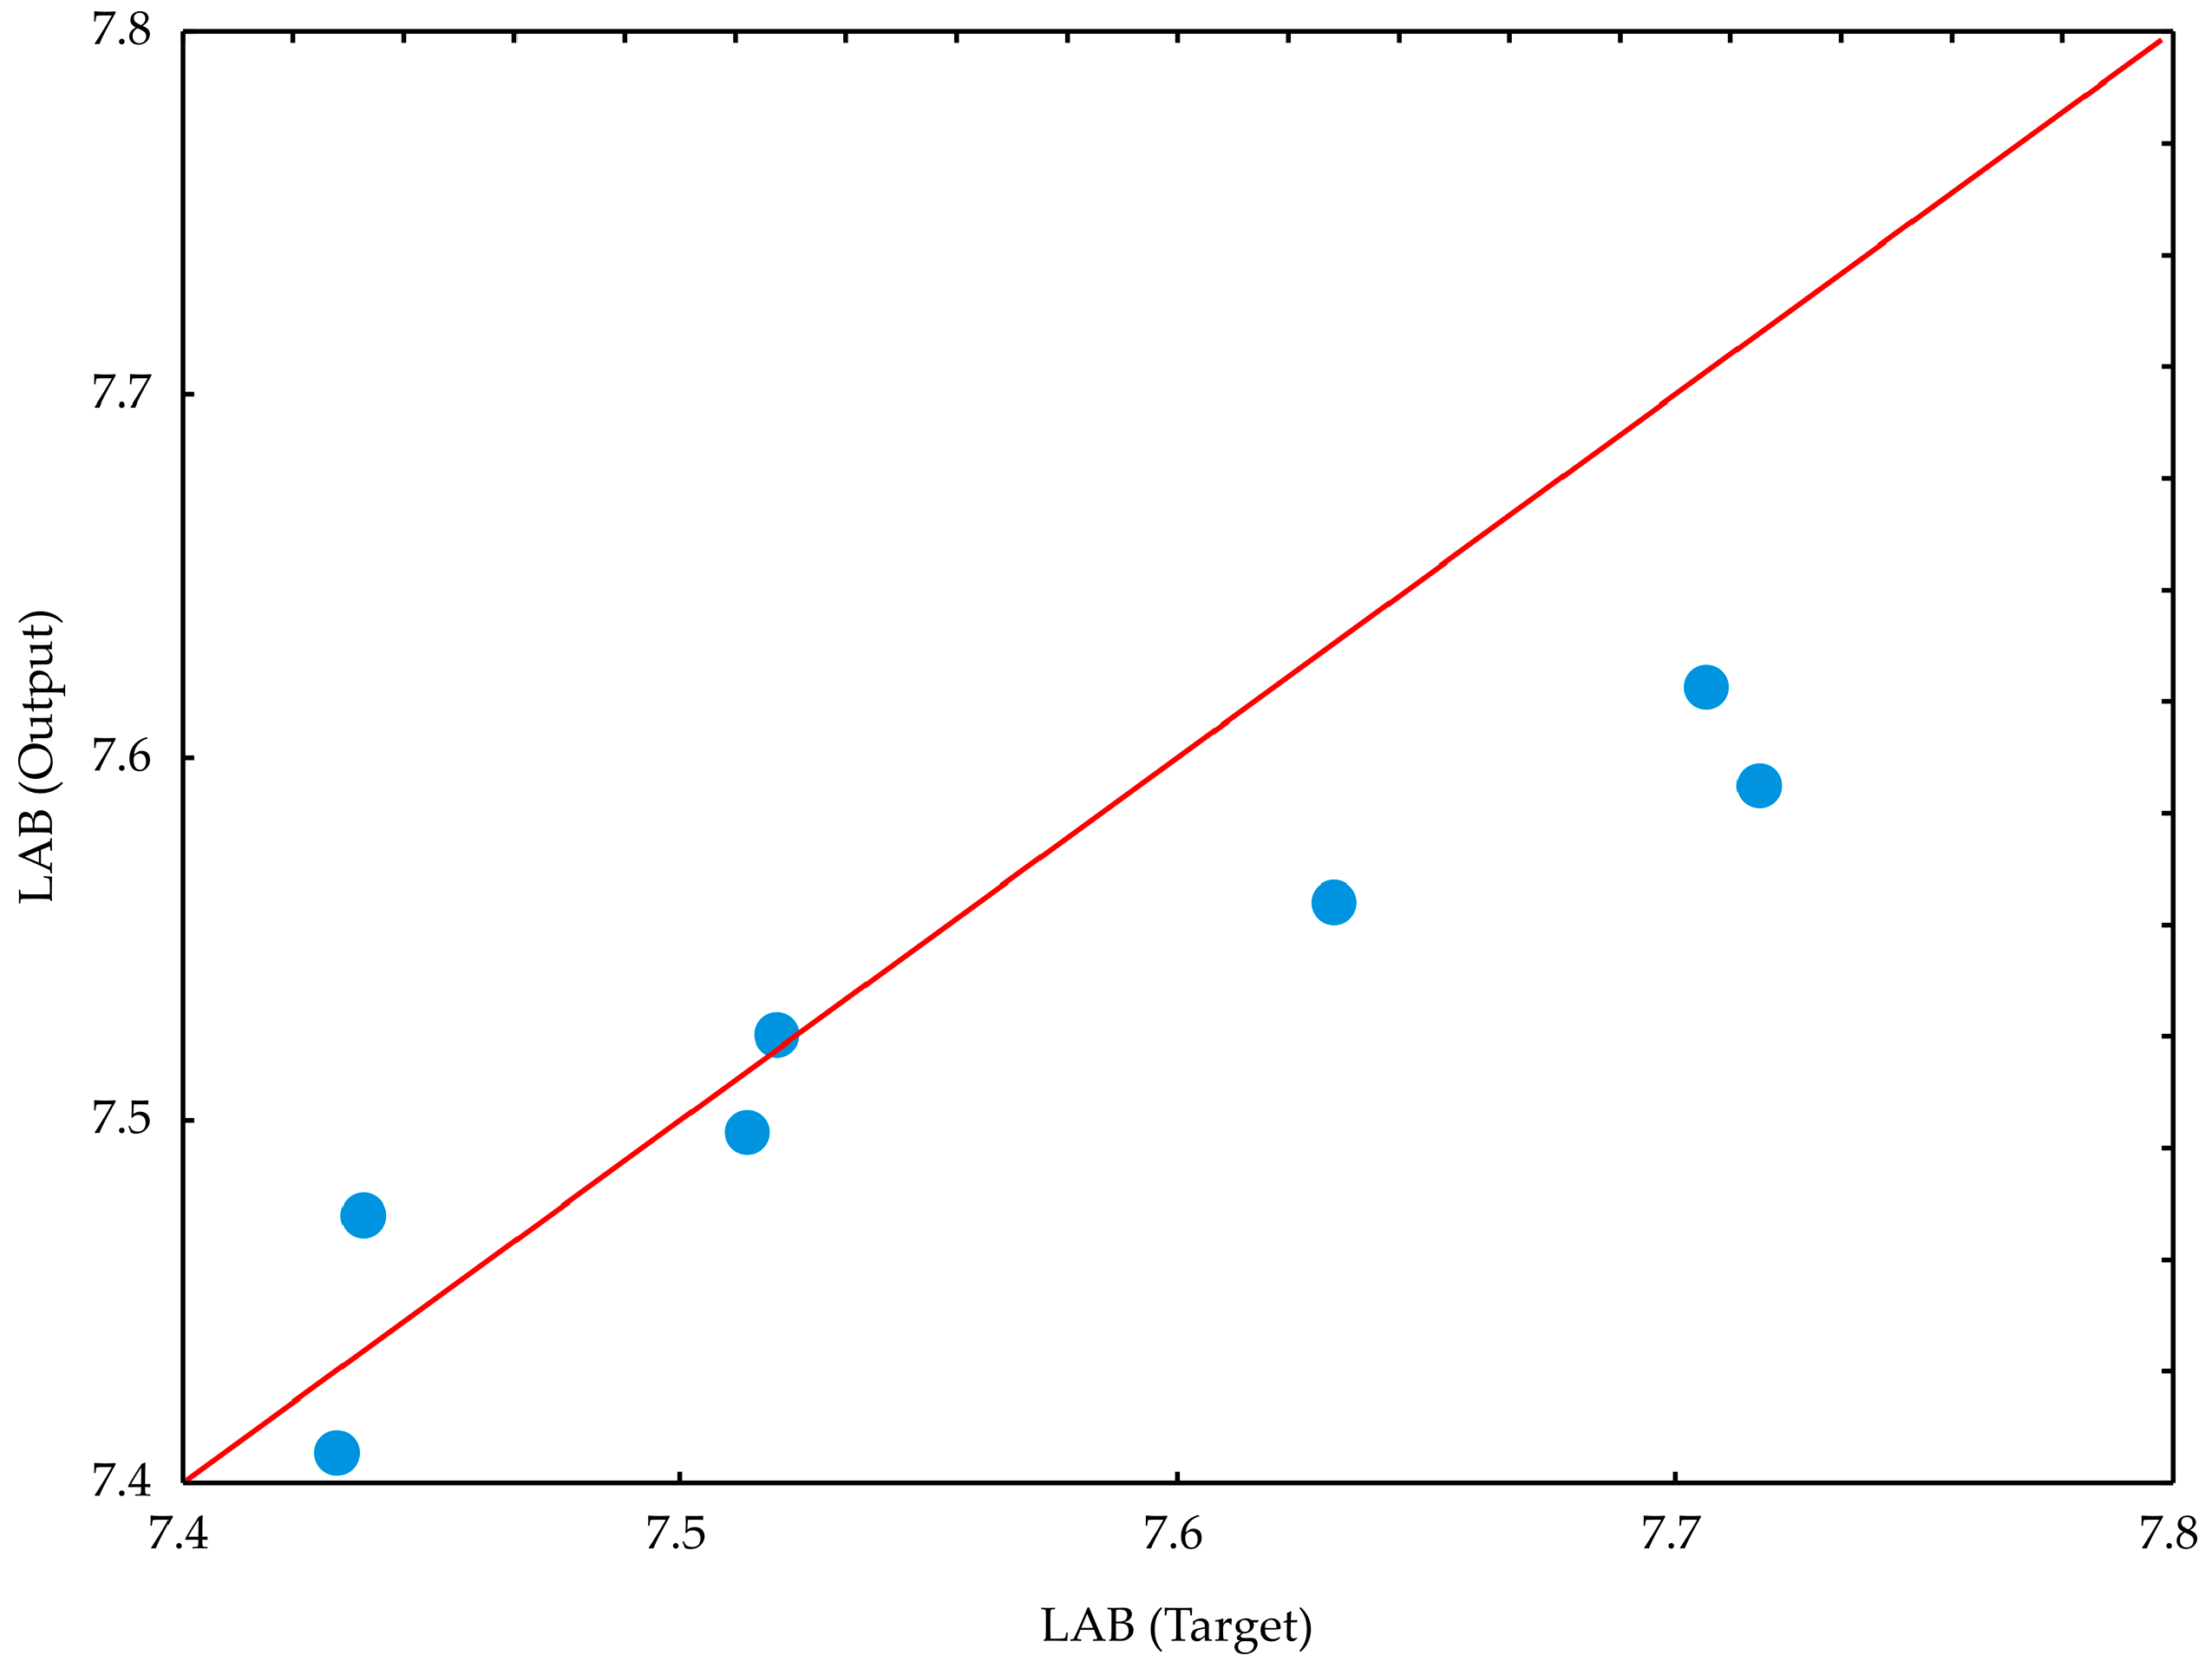
The optimal neural network models (
Figure 11,
Table 14) for predicting LAB stability during storage demonstrated strong generalization capabilities for the collected data and can accurately predict the observed outputs based on input parameters such as time and carrier selection. The model with eight neurons yielded the highest
r2 values, with 0.945 for training and 1.000 during the testing cycle.
The results in
Table 15 indicate that the ANN model for predicting LAB stability during kombucha storage provides a good fit to the data. The
χ2 value of 0.005 suggests minimal discrepancy between the observed and predicted values. The RMSE of 0.066 and MBE of 0.040 demonstrate that the model’s predictions are both accurate and slightly biased, but within an acceptable range. The MPE of 0.687 indicates the average percentage error is relatively high, suggesting some variability in the predictions. The SSE of 0.030 further reflects low overall error in the model. The AARD of 0.687 confirms that the average deviation between the predicted and observed values is consistent. Finally, the
r2 value of 0.892 indicates that the model explains 89.2% of the variance in the LAB stability data, demonstrating strong predictive power.
3.4. Evaluation of Enriched Kombucha in Terms of Health-Promoting Potential and Sensory Attributes
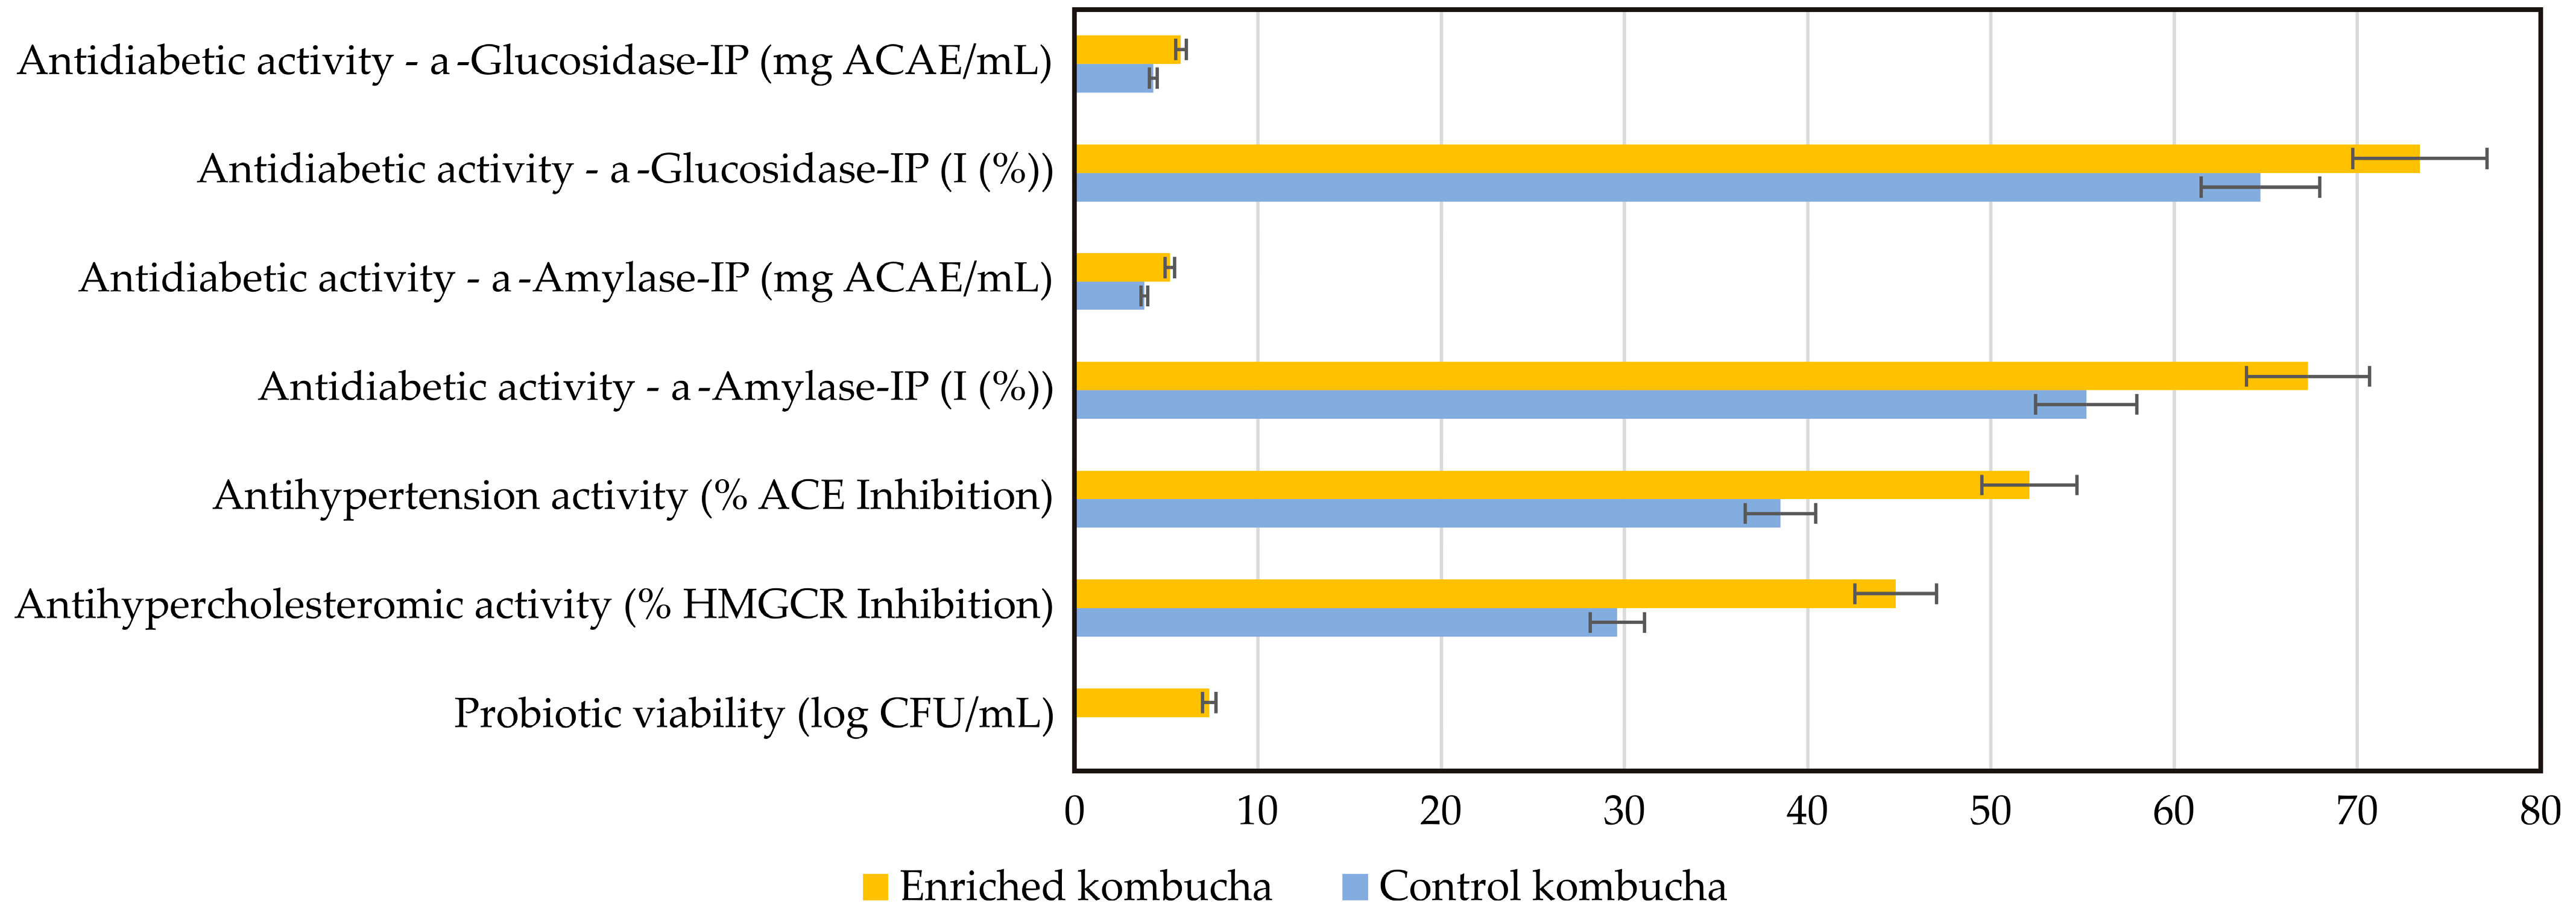
As final step in this study, two crucial segments of the final enriched beverage were tested—their health-improving parameters and their sensory attributes. Namely, this study explores the impact of whey protein–LAB encapsulate enrichment on kombucha’s biological activities, with a particular focus on its antidiabetic, antihypertensive, and antihypercholesterolemic effects, and probiotic viability (
Figure 12). All results are compared to the control kombucha sample.
Diabetes mellitus is the most common endocrine disease that affects many people worldwide and continues to grow yearly [
85]. It is characterized by chronic hyperglycemia, which occurs due to impaired insulin secretion and/or action and is closely linked to the inhibition of digestive enzymes like α-glucosidase and α-amylase, which are crucial for carbohydrate digestion and glucose absorption [
86]. The findings from this study reveal that enriched kombucha exhibits significantly higher inhibition of these enzymes compared to its control counterpart, suggesting an improved ability to regulate postprandial glucose levels. The results highlight a significant enhancement in α-glucosidase inhibition in enriched kombucha compared to the control, suggesting an improved ability to slow carbohydrate digestion and reduce postprandial blood glucose spikes. This increase in inhibitory potential is likely due to the higher polyphenolic content and the presence of bioactive peptides produced through probiotic fermentation. Similarly, α-amylase inhibition follows the same trend, demonstrating a stronger regulatory effect on starch breakdown. These results are aligned with research by Azadikhah et al. [
87], where it was found that probiotic fermentation enhances bioactive peptide and polyphenol production, leading to increased inhibition of α-glucosidase and α-amylase. Similarly, previous studies have shown that
Lactobacillus-fermented products can support glucose metabolism and improve insulin sensitivity, further reinforcing the antidiabetic potential of enriched kombucha [
88,
89].
Hypertension affects more than 1 billion adults worldwide and is associated with increased risk of various cardiovascular diseases that could ultimately lead to heart failure, stroke, and death [
90]. The analysis of antihypertensive activity reveals that enriched kombucha exhibits a significantly higher degree of ACE (angiotensin-converting enzyme) inhibition compared to control kombucha. Hypertension is often managed by inhibiting the angiotensin-converting enzyme (ACE), which plays a role in blood pressure regulation [
91]. This study demonstrates that enriched kombucha has a greater ACE inhibitory effect than the control sample, highlighting its potential to help manage hypertension. Additionally, tea polyphenols, naturally present in kombucha, have been linked to ACE inhibition and vascular relaxation, further contributing to its antihypertensive benefits [
92]. Given the crucial role of ACE in blood pressure regulation by converting angiotensin I into angiotensin II, a potent vasoconstrictor, this increased inhibition suggests that enriched kombucha may contribute to blood pressure modulation. The observed enhancement in ACE inhibition is likely attributed to bioactive peptides derived from whey protein hydrolysates and probiotic fermentation, reinforcing prior research on the cardiovascular benefits of probiotic-fermented beverages [
93].
In addition to its impact on glucose metabolism and blood pressure regulation, enriched kombucha demonstrated superior inhibition of HMG-CoA reductase (HMGCR), the key enzyme responsible for cholesterol biosynthesis. The increased inhibitory activity suggests greater potential for cholesterol-lowering effects, which could be linked to probiotic-induced modulation of lipid metabolism and enhanced bile salt hydrolase activity. By facilitating the reduction in cholesterol absorption, enriched kombucha may contribute to lowering LDL cholesterol levels, further supporting its role in cardiovascular health. Prior research supports this observation, with Begley et al. [
94] demonstrating that probiotics can influence cholesterol metabolism by increasing bile salt hydrolase activity, thereby reducing cholesterol absorption. Additionally, whey protein hydrolysates have been associated with cholesterol-lowering effects, further validating the superior efficacy of enriched kombucha [
95].
Another critical finding of the study is the probiotic presence in kombucha, which adds another dimension of kombucha’s functionality. The protective effects of whey protein encapsulation appear to enhance the survival of probiotic bacteria, ensuring greater stability in acidic environments. Since probiotic viability is essential for gut microbiota modulation, immune support, and overall metabolic health [
40], the increased microbial stability in enriched kombucha suggests superior functional benefits. The results indicate that enriched kombucha has significant probiotic viability, confirming that whey protein encapsulation effectively preserves LAB stability. This aligns with findings from Sompach et al. [
96], who reported that whey protein carriers enhance probiotic survival in acidic environments. Moreover, probiotic strains such as
Lactobacillus have been shown to improve kombucha fermentation, leading to increased production of organic acids, mainly glucuronic and bioactive compounds, thus enhancing the antibacterial and antioxidant activities of kombucha [
97]. These results suggest that enriched kombucha may offer greater probiotic benefits for gut health compared to conventional formulations.
It can be summarized that the enriched kombucha consistently outperforms the control kombucha across all measured health-promoting parameters. This enhanced bioactivity can be attributed to the synergistic effects of probiotic fermentation, whey protein encapsulation, and the increased bioavailability of polyphenols and bioactive peptides. The combined impact of these factors suggests that enriched kombucha offers a promising alternative for metabolic disease prevention, particularly in relation to diabetes, hypertension, and hypercholesterolemia. Future research should focus on evaluating the long-term stability of probiotics in enriched kombucha, as well as conducting clinical trials to validate its metabolic effects in human subjects.
Additionally, an analysis of sensory attributes and consumer acceptance was performed as one of the essential steps for completely assessing the market potential of enriched kombucha as a functional beverage with significant health benefits.
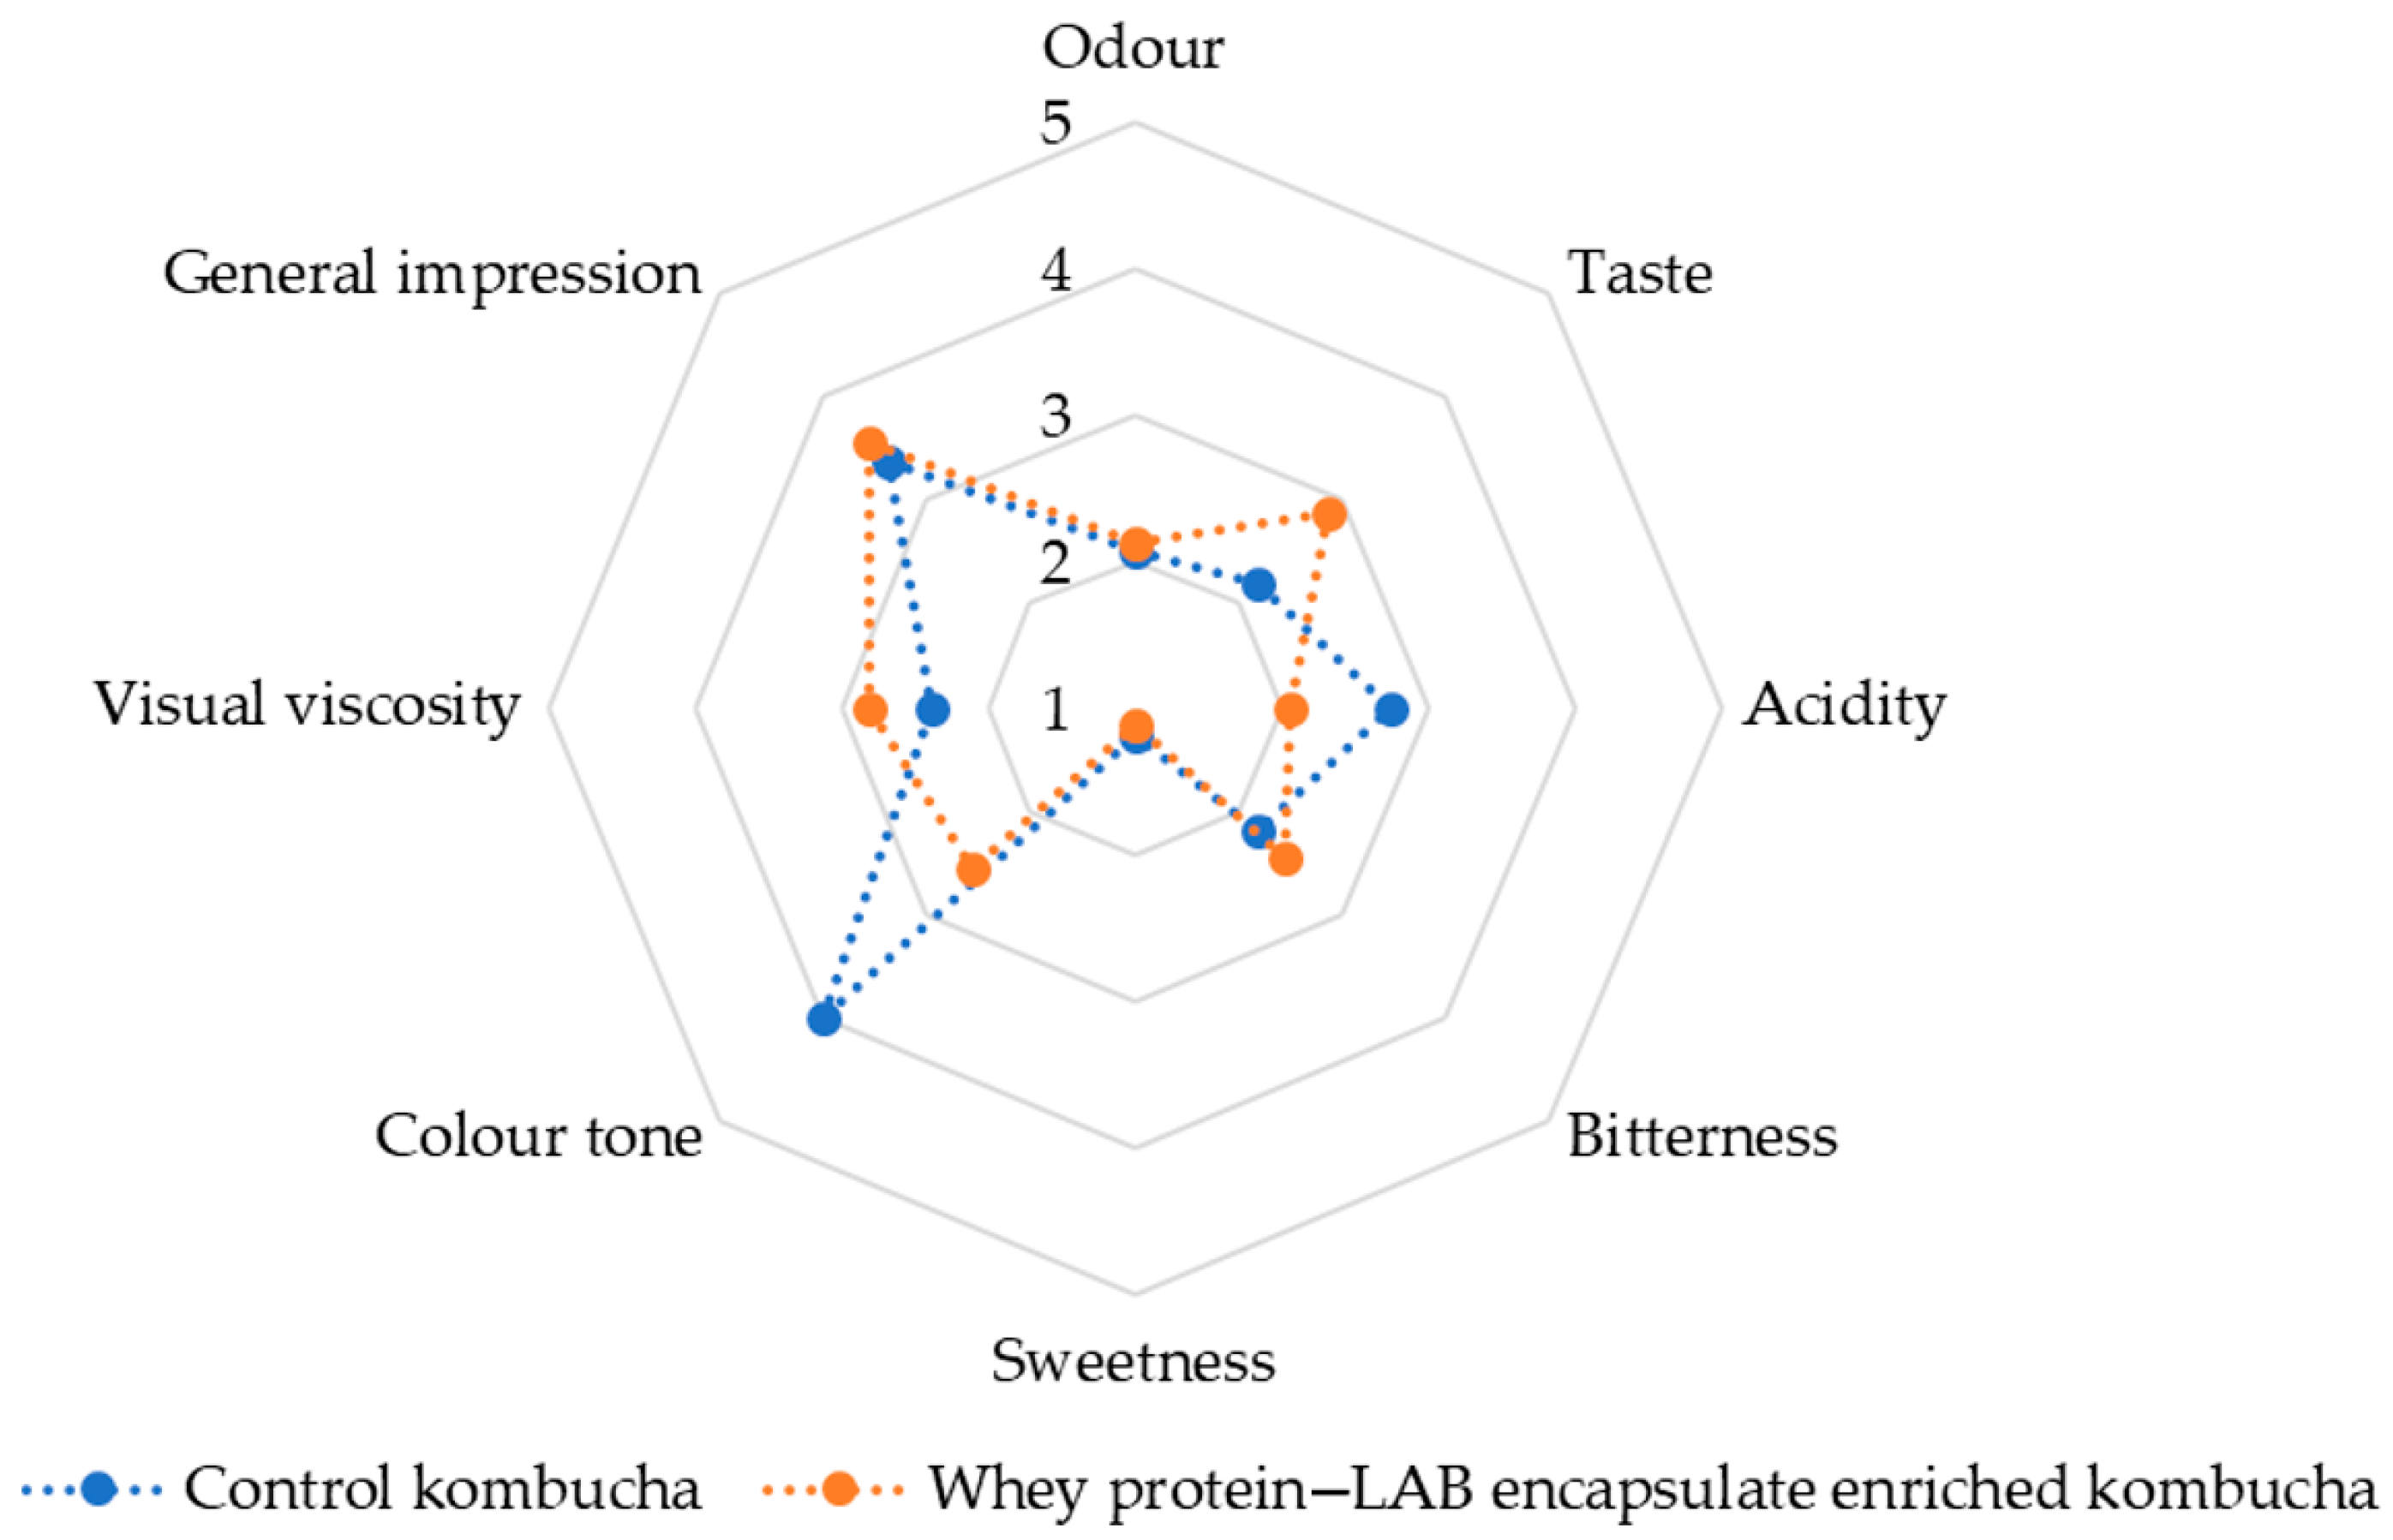
Figure 13 presents a radar chart comparison of sensory attributes between the control kombucha (blue, dotted line) and the whey protein–LAB-encapsulate-enriched kombucha (orange, dotted line). The analysis covers key sensory descriptors: odor, taste, acidity, bitterness, sweetness, color tone, visual viscosity, and general impression.
Currently, no specific standards or regulations govern the sensory analysis of kombucha beverages. This lack of standardization largely stems from the vast diversity in microbial consortia, the wide range of production methods used both domestically and industrially, and the varying physicochemical properties of the ingredients used in kombucha preparation [
61]. Given these complexities, sensory evaluations across different studies exhibit considerable variation. In this study, 16 trained panelists evaluated the mentioned descriptors (
Figure 13). A comparative sensory analysis between the control and enriched kombucha reveals notable differences in key attributes, including odor, taste, acidity, bitterness, sweetness, color, and viscosity. The results suggest that the incorporation of whey protein–LAB encapsulate may have contributed to subtle but meaningful enhancements in the overall sensory profile. In terms of odor and taste, the enriched kombucha scored slightly higher, indicating a more favorable aroma and flavor profile. This improvement may be attributed to the presence of the LAB strain, probiotic fermentation, and the production of bioactive metabolites, which are known to contribute to the taste, texture, and aroma of the product, resulting in unique organoleptic characteristics [
36]. Previous studies have demonstrated that microbial activity during fermentation can enhance aroma complexity and modify flavor compounds, potentially explaining the improved perception of the enriched formulation [
98]. Bacterial growth in probiotic beverages leads to the consumption and/or production of compounds that change the aroma and flavor [
99]. Wang et al. [
83] concluded that the addition of different LAB strains to kombucha fermentation positively affected the production of volatile compounds that contributed to the flavor quality of kombucha and lactic acid that generally has softer taste.
Regarding acidity and bitterness, both samples exhibited comparable acidity levels, with only minor differences in sensory perception. However, the control kombucha appeared slightly more bitter than its enriched counterpart. This suggests that whey protein encapsulation may have contributed to a milder taste profile, potentially by modifying the organic acid composition or masking harsher flavors. Differences in sweetness and color tone were also observed. The control kombucha demonstrated slightly higher sweetness levels compared to the enriched version, likely due to variations in residual sugar content and fermentation kinetics. Probiotic-enriched formulations tend to exhibit higher sugar consumption rates, which could explain the reduced sweetness perception in the enriched kombucha. Additionally, subtle variations in color tone were noted, potentially influenced by protein interactions or changes in pigment stability resulting from encapsulation. Visual viscosity was another distinguishing factor between the two formulations. The enriched kombucha exhibited a higher viscosity, indicating a slightly thicker and more stable texture. This outcome aligns with the known effects of whey protein encapsulation, which can improve the overall sensory experience by increasing viscosity [
99,
100]. The general impression of the enriched kombucha was slightly more favorable, suggesting that the sensory modifications introduced by probiotic encapsulation were positively received. This finding is consistent with research indicating that probiotic-fortified fermented beverages often achieve improved consumer ratings due to their enhanced texture, balanced taste, and perceived health benefits [
101].
Tenea et al.’s [
101] results demonstrated that the addition of LAB strains to maracuya/coconut juice significantly influenced the sensory properties of the final product, with enriched juice being preferred for its taste and flavor over the control sample. Sensory analysis of enriched kombucha in the study of Majid et al. [
80] is in accordance with the current study. Kombucha with added probiotic, the
L. plantarum strain, was better accepted by panelists with higher ratings for aftertaste, taste, and overall impression. The color of enriched kombucha in their study seems to be generally the same as the control sample, which was not the case in the current study. This could be due to the tea used for preparation, but also due to the presence of whey protein as a carrier in the current study.
From a market potential perspective, the results indicate that whey protein–LAB encapsulate enrichment maintains or enhances the sensory characteristics of kombucha, making it a viable candidate for commercial development. However, consumer preferences can vary based on several factors, including sweetness levels, texture, and viscosity. While a thicker beverage may be associated with improved quality, excessive viscosity could be undesirable for certain consumers. Similarly, variations in odor and taste acceptance may necessitate further sensory optimization to align with broader market expectations. To ensure commercial success, future studies should incorporate a larger consumer panel and employ quantitative sensory evaluation techniques, including hedonic testing, to validate broader consumer acceptance. Additionally, targeted formulation adjustments may be required to optimize the balance between acidity, sweetness, and mouthfeel to cater to varying consumer preferences.
Additionally, a panel analysis was conducted using a Mixed Models—Type III Sum of Squares approach to evaluate the significance of various sources of variation, including products, assessors, and their interactions. ANOVA was performed on all dependent variables based on the following model:
where P represents product (a fixed factor), while A (assessor) and P × A are random factors. The results of the panel analysis are summarized in
Table 16.
The panel analysis conducted using Mixed Models—Type III Sum of Squares evaluated the significance of variation sources, specifically the effects of product and assessor, across multiple sensory descriptors. The product effect was found to be significant for color tone (F = 49.906, p < 0.001) and visual viscosity (F = 5.788, p = 0.029), indicating that these attributes differed significantly among the tested samples. No significant differences among products were observed for odor (F = 0.063, p = 0.806), taste (F = 2.612, p = 0.127), acidity (F = 3.030, p = 0.102), bitterness (F = 1.154, p = 0.300), sweetness (F = 0.319, p = 0.581), or general impression (F = 0.513, p = 0.485), suggesting that these descriptors did not effectively distinguish between the samples. The assessor effect was significant for odor (F = 5.251, p = 0.001), bitterness (F = 4.596, p = 0.003), color tone (F = 2.610, p = 0.036), visual viscosity (F = 8.622, p < 0.001), and general impression (F = 4.072, p = 0.005), indicating variability in individual evaluations for these attributes. Conversely, taste (F = 1.495, p = 0.223), acidity (F = 0.386, p = 0.963), and sweetness (F = 1.851, p = 0.122) did not exhibit significant variation among assessors, suggesting consistent evaluation of these descriptors. Sensory attributes that did not show significant differentiation across products, namely odor, taste, acidity, bitterness, sweetness, and general impression, were removed from further analysis. The results suggest that color tone and visual viscosity serve as the most discriminatory attributes among the examined samples, while the variability observed among assessors underscores the need for refined panel training to enhance the reliability of sensory evaluations.
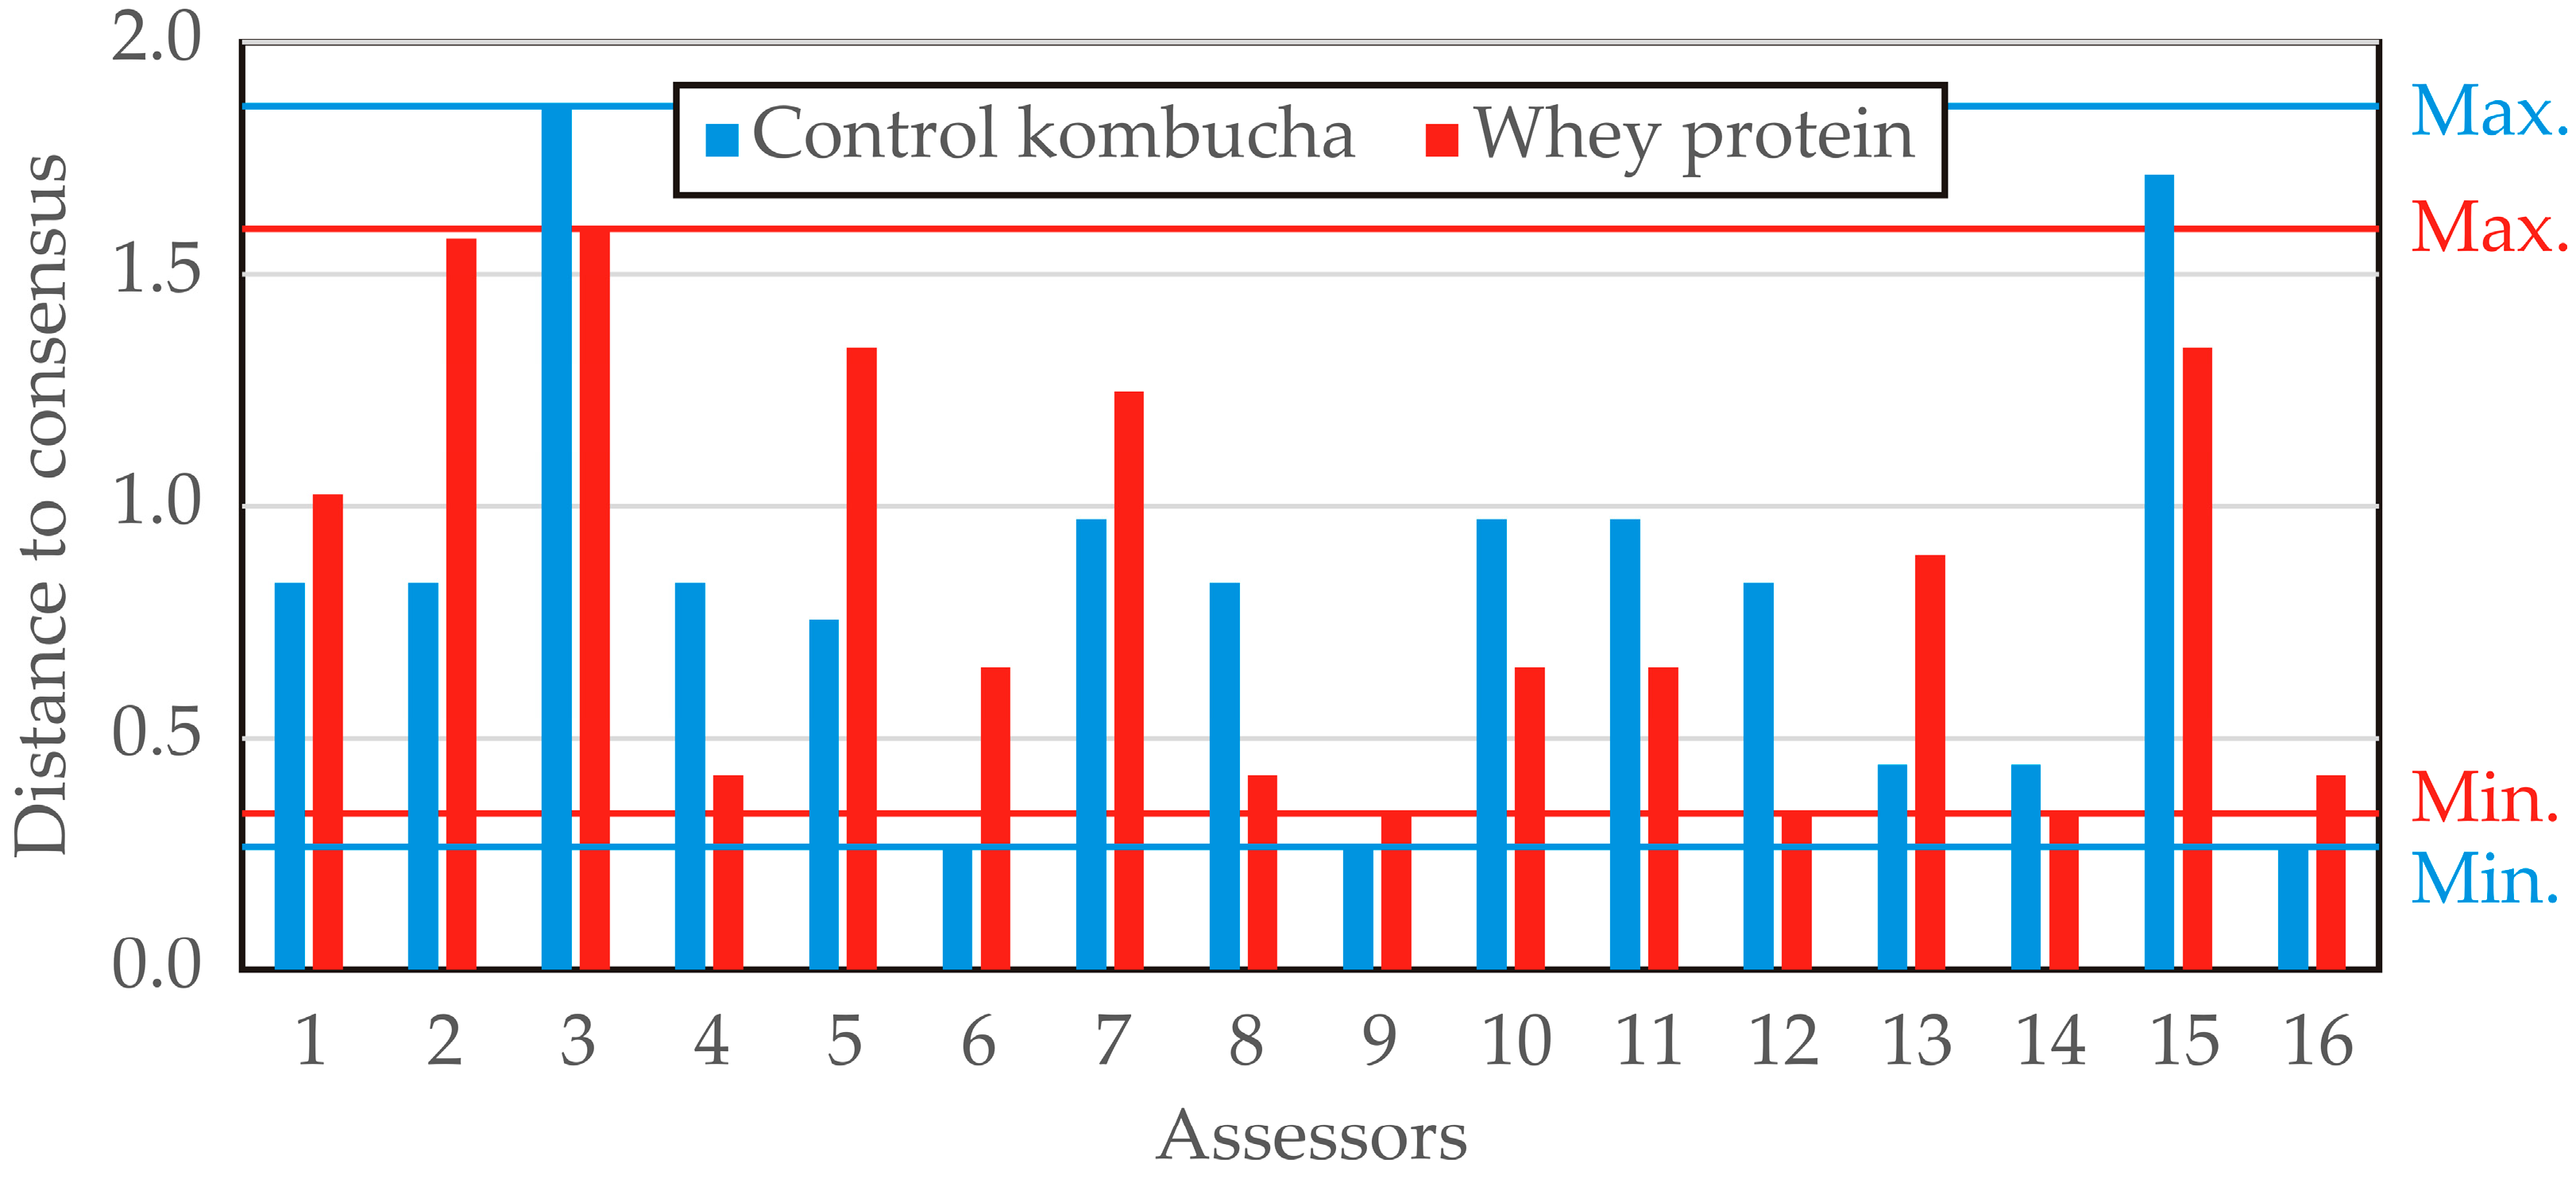
The distance to consensus across descriptors was computed for each assessor concerning the two evaluated products (control kombucha and whey protein–LAB-enriched kombucha), providing insights into the level of agreement among panelists (
Figure 14). Lower values indicate a closer alignment with the panel consensus, whereas higher values suggest greater deviation from the group assessment. For control kombucha, the distance to consensus ranged from 0.265 (panelists 6, 9, and 16) to 1.856 (panelist 3), indicating notable variability in individual assessments. Several assessors exhibited a strong alignment with the panel’s consensus, with multiple values clustering around 0.834 and 0.972, suggesting moderate agreement among the majority of panelists. For the whey protein–LAB-enriched kombucha, the distance to consensus varied between 0.337 (panelists 9, 12, and 14) and 1.597 (panelist 3). The overall variability appeared slightly higher compared to the control kombucha, with some assessors (e.g., panelists 2 and 3) showing a greater deviation from the consensus. Notably, panelist 3 exhibited the highest deviation for both products (1.856 for control kombucha and 1.597 for whey protein–LAB-enriched kombucha), suggesting possible inconsistencies in their evaluations. Conversely, panelists 6 and 9 demonstrated the lowest distance to consensus, implying a high level of agreement with the panel. The analysis suggests that control kombucha exhibited slightly greater variability in panelist agreement, while the whey protein–LAB-enriched kombucha showed a more consistent evaluation pattern. The presence of high deviations in certain assessors highlights the potential need for panel training to improve alignment in sensory assessments.


 ,
, 


