Article

Improving Haemophilus influenzae Type b Polysaccharide Productivity Through Continuous Culture for Pentavalent Vaccine Manufacturing

by
Lucas Santos Solidade
1,
Lucas Dias Vieira
2 and
Mickie Takagi
2,*
1
Department of Botany, Federal University of São Carlos, Rod. Washington Luís, São Carlos 13565-905, SP, Brazil
2
Process Development Laboratory, Development and Innovation Center, Butantan Institute, Av. Vital Brasil 1500, São Carlos 13565-905, SP, Brazil
*
Author to whom correspondence should be addressed.
Fermentation 2025, 11(11), 622; https://doi.org/10.3390/fermentation11110622
Submission received: 6 August 2025 / Revised: 17 October 2025 / Accepted: 25 October 2025 / Published: 31 October 2025

Abstract

Haemophilus influenzae type b (Hib) is a Gram-negative bacterium that causes severe infections in children under five, especially in developing countries. Although vaccination using capsular polysaccharide by Hib (linear polymer 5-D-ribitol-(1→1)-β-D-ribose-3-phosphate) conjugated to tetanus toxoid is effective, its production is complex and costly. This study aimed to develop a continuous production process for PRP to increase productivity, reduce batch numbers, and simplify manufacturing. Using a 1 L bioreactor, five dilution rates (0.13 to 0.32 h−1) were tested, with the best performance observed at 0.23 h−1, reaching a productivity of 167 mgL−1·h−1. Under optimized conditions, parameters such as free and immobilized PRP, glucose consumption, acetate formation, and biomass were monitored. The process yielded 874 mgL−1 of PRP after 74.4 h, with 78% in the free form and a final productivity of 165 mgL−1·h−1, approximately six times higher than batch processes and twice as high as fed-batch processes. The continuous process proved more efficient and required less infrastructure to meet production demands. However, further optimization is needed to enhance product quality and assess overall feasibility.

1. Introduction

Haemophilus influenzae (Hi) is a Gram-negative, coccobacillus bacterium responsible for causing both invasive and non-invasive diseases, mainly in children under 5 years of age [1]. Infections caused by H. influenzae include epiglottitis, otitis, sinusitis, bronchitis, bacteremia, pneumonia, and meningitis. Nevertheless, not all strains are virulent and do not cause problems beyond mild infections; other strains, however, have a capsule in addition to the cell wall, which evades the immune system and causes successful infection. The capsular polysaccharide of Hi is classified into six important serotypes, i.e., a through f, with serotype b being the most prevalent and associated with the largest number of severe infection cases worldwide [2].
H. influenzae type b (Hib) showed a high mortality rate due to meningitis and, in the case of survival, left permanent sequelae [2]. Serotype b is still the most common isolate in meningitis caused by Hi in children 2–14 years old globally [2,3]. Vaccination against Hib was introduced in most national immunization programs (NIPs) in the 1990s, causing a significant reduction in meningitis cases and deaths [4].
The vaccine against Hib is constituted by the hib capsular polysaccharide, polyribosylribitol phosphate (linear polymer 5-D-ribitol-(1→1)-β-D-ribose-3-phosphate), linked chemically to a carrier protein such as tetanus toxoid to improve the immune response [5,6]. For the production of the Hib vaccine, it is necessary to take into consideration the following three major processes: a) producing the polysaccharide upstream; b) purifying the polysaccharide downstream; and c) conjugating the polysaccharide to protein. Losses in PRP are expected during each process, resulting in a final yield of less than 50% of the produced amount [7,8]. One way to overcome this problem is to improve each one of these processes individually, for example, by studying and innovating polysaccharide production strategies for the fermentative processes.
One approach that could be adopted is a differentiated cultivation system, such as using a fed-batch system that increases cell yield and has better control of nutrient availability [9]. However, despite achieving a high cell concentration, Hib fed-batch cultivation is limited by growth-inhibiting byproducts, such as acetic acid [10]. Using alternative cultivation systems, such as continuous culture, may present a viable solution.
Continuous cultivation involves constantly adding fresh nutrients and removing fermented broth, maintaining a constant volume throughout the process, which is known as a chemostat. This system allows the concentration of the cells, the substrate, and the product to be kept constant throughout the cultivation in a steady state [9]. The adoption of this strategy is very promising, but it may present some disadvantages, such as difficulty in maintaining constant input and output flow rates and a greater possibility of contamination. On the other hand, it presents advantages that can overcome its counterpoints, such as a reduction in non-productive periods that can lead to higher productivity, greater uniformity of the fermented broth, less need for manpower, and a reduction in the fermenter size [11]. Even with these advantages, there are still few studies concerning the continuous cultivation approach. One example is the study carried out by Gogola-Kolling et al. [12], who observed capsular polysaccharide production from Streptococcus pneumoniae, finding an increase in yield of 300% when compared to batch culture. More recently, Gerritzen et al. [13] worked with the continuous cultivation of N. meningitidis and found a steady state with similar high OMV (outer membrane vesicle) concentrations, an increase in the volumetric productivity, and a reduction in the production and capital costs with high-quality OMVs.
This study aimed to establish the production process of Haemophilus influenzae type b polysaccharide through continuous culture.

2. Materials and Methods

2.1. Microorganism and Culture Medium

H. influenzae type b strain GB3291 was acquired from the Collection and Culture of Microorganisms of the Instituto Adolfo Lutz (São Paulo, Brazil) in freeze-dried form. Working seed was prepared at Instituto Butantan as described by Takagi et al. [14].

2.2. Media

The culture medium used for inoculum was MMP (modified peptone medium) with the following composition per litter: Bacto Soytone (BD, San Jose, CA, USA) 10.0 g; yeast extract (BD, San Jose, CA, USA) 5.0 g; glucose (Merck, Oakville, ON, Canada) 5.0 g; sodium chloride (Merck, Oakville, ON, Canada) 5.0 g; K2HPO4 (Merck, Oakville, ON, Canada) 2.5 g; Na2HPO4 (Merck, Oakville, ON, Canada) 13.5 g; Na2HPO4·H2O (Merck, Oakville, ON, Canada) 3.3 g; NAD (sigma, Oakville, ON, Canada) 15 mg; bovine hemin (sigma, Oakville, ON, Canada) 30 mg; and pH adjusted to 7.5. The reactor medium was modified to a composition of Na2HPO4 (Merck, Oakville, ON, Canada) 10.5 g and Na2HPO4·H2O (Merck, Oakville, ON, Canada) 5.8 g, and for the feed medium, UF yeast extract (BD, San Jose, CA, USA) and glucose (Merck, Oakville, ON, Canada) were increased to 10.0 g·L−1. The pH was adjusted to 7.1 for media, the reactor, and feed with NaOH.

2.3. Inoculum Preparation

For pre-inoculum, 400 µL of bacterial suspension (1.0 × 10⁹ CFU mL−1) was aliquoted to 50 mL of MMP medium and incubated at 37 °C in anaerobiosis. After reaching an OD540nm above 0.4, a known volume was transferred to 100 mL of fresh MMP medium contained in a 500 mL flask to reach an initial OD540 of 0.05. The flask was incubated on a New Brunswick™ Excella® E25 orbital shaker (Eppendorf, Hamburg, Germany) at 250 rpm and 37 °C for 15 h.

2.4. Culture Conditions and Growth System

Continuous cultures were performed in 1 L benchtop bioreactors (Infors HT, Bottmingen, Switzerland) with a working volume of 0.8 L. The temperature was controlled at 30 °C, pH was adjusted to 7.1 with NaOH 5 M, and dissolved oxygen (pO2) was measured using polarographic oxygen sensors (Hamilton VisiFerm DO Arc 225 mm, Hamilton, NV, USA) previously calibrated at 100%. The initial OD540nm was 0.1 in the reactor medium. The pH was controlled by a pH probe (Hamilton EasyFerm Plus PHI Arc 225 mm, Hamilton, NV, USA) maintained at 7.1 with an automatic addition of 5 M NaOH, and pO2 was controlled at 30% by atmospheric air with a fixed VVM of 0.5 and an automatic increasing agitation rate during the cultivation (300–1000 RPM) [15]. Figure 1 shows the general scheme of the fermentation system used in the continuous culture.
During the experiments, samples were collected every hour and processed for biomass determination and the concentration of glucose, organic acids, and released polysaccharide (PRP). For continuous operation, H. influenzae was first grown in batch mode for 9 h, at which point the glucose concentration had decreased to below 1 g L−1. At this point, fresh MMP medium was introduced into the bioreactor. The culture volume was maintained constant at 0.8 L, with medium inflow controlled using the bioreactor peristaltic pump system. After at least four residence times, three samples were collected at different intervals.
For each dilution rate change, at least 14 h of stabilization were required, followed by 8 h of monitoring. Steady state was confirmed after at least two residence times and a variation of less than 10% in cell concentration. Culture purity was verified through colony morphology analysis. The volume of the feed medium and 5 M NaOH solutions was monitored using scales to estimate the dilution rate and ensure pH control.
The values for the dilution rate were calculated according to the formula below (Equation (1)), considering D as the dilution rate in h−1, F as the flow rate in Lh−1, and V the volume of the medium contained in the bioreactor in L.
D h 1 = F L h 1 / V ( L )
Dilution rates were evaluated throughout the fermentation process, starting with lower values and increasing progressively. The maximum specific growth rate of H. influenzae in batch cultures, under the same conditions as continuous cultures, was 0.40 h−1. Based on this value, dilution rates (D) of 0.13, 0.19, 0.23, 0.28, and 0.32 h−1 were tested. Four experiments were conducted with increasing D values, including stabilization periods between each dilution change and regular sampling every two hours. For each D value except 0.32 h−1, two independent experiments were performed to determine the optimal dilution rate. After this definition, a continuous culture was grown with the selected D value, taking three daily samples at four-hour intervals, for 65 h of cultivation. Experimental details are described in Table A1.

2.5. Analytical Methods

2.5.1. Biomass Determination

Biomass was determined by taking samples directly from the reactor, and it was measured using 2 different methodologies. The first was an optical density reading (OD540nm) at 540 nm (spectrophotometer, Pharmacia Biotech—Ultrospec 2000, Grens, Switzerland) by diluting the sample with saline solution to a reading range between 0.100 and 0.500 AU. The second methodology was based on gravimetry, as described by Takagi et al. [14].

2.5.2. Analysis of Carbohydrate, Organic Acid and Polysaccharide

Carbohydrate and Organic Acid Determination
The glucose and the metabolic acids produced by Haemophilus were measured through high-performance liquid chromatography (HPLC; Ultimate 3000, Dionex, Olten, Switzerland) using an automatic sampler, an aminex HPX-87H (300 mm × 7.8 mm; Bio-Rad, Hercules, CA, USA)-type column, a UV detector (210 nm), and an integrator (class Chromeleon 6.8, version 6.2; Dionex, Olten, Switzerland). An aliquot of 20 µL of cell-free supernatant, collected during cultivation, was diluted with 100 mM H2SO4 (1:5), filtered in Millex 0.22 µm, and injected into the column at 60 °C. A 50 mM H2SO4 solution was used as the mobile phase with a flow rate of 0.6 mL min−1.
Free PRP Determination
The concentration of free PRP (PRPfree) was determined from the cell-free culture supernatant. Samples were centrifuged at 10,000× g for 10 min at 4 °C, and the supernatant was stored at −20 °C and further quantified.
The quantification of PRP was performed through ion chromatography, where the sample was previously diluted to reach the ideal concentration (~500 mg L−1) according to the protocol and hydrolyzed in the presence of 400 mM sodium hydroxide, then incubated at 37 °C for 20 h. After 20 h, samples were neutralized by the addition of 400 mM acetic acid and, finally, 100 μL of internal standard (glucose-6-phosphate) was added, as established by Haan et al. [16] and modified by Braga et al. [17]. In total, 10 μL was injected into the ion chromatographer Thermo Dionex ICS-5000 with a Dionex Carbo Pac PA10 column (Olten, Switzerland) and a Thermo ICS-5000 Electrochemical cell (S/N 5545, Waltham, MA, USA) detector controlled by Chromeleon 6.8 software. The PRP standard curve followed the international PRP standard defined by Mawas et al. [18].
Cell-Associated PRP Determination
Cell-associated PRP was quantified based on the method described by Kroll and Moxon [19]. Pellets from 1 mL of each culture were washed with 0.15 M NaCl, resuspended in buffer containing 10 mM EDTA, 10 mM Na2HPO4, and 150 mM NaCl at pH 7.5, and they were incubated at 37 °C for 2 h. Samples were then centrifuged, and the resulting supernatant was frozen for subsequent quantification by ion chromatography, as previously reported [16,18].

2.5.3. Molecular Mass Determination

For molecular mass determination, the PRP was previously purified by precipitation with hexadecytrimethylammonium bromite (CTAB), following the methodology described by Cintra & Takagi [20]. After the recovery process, the polysaccharide was applied to a gel filtration system composed of two serial TSKgel GMPWXL columns using an Ultimate 3000 UHPLC system (Dionex, Sunnyvale, CA, USA) at a flow rate of 0.6 mL min−1 and a temperature of 40 °C. The system was connected in series to a refractive index detector (RID-10A, Shimadzu, Columbia, MD, USA) and a multi-angle light scattering (MALS) detector (Wyatt Technology, Santa Barbara, CA, USA). Data acquisition and molecular weight determination were performed using ASTRA software 7.10 (Advanced System Information Tool, Sysinfo Lab, Toronto, ON, Canada).

2.6. Kinetic Parameters of Culture

For batch and continuous cultivation, the parameters were determined based on the data, as illustrated in Table 1. The value of the maximum specific growth rate (μmax) for the batch was calculated based on Equation (2), where the value of X is the biomass (g L−1), Xo is the initial biomass (g L−1), μmax is the maximum specific growth rate (h−1) in exponential growth, and t is the cultivation time (h).
μ m a x = l n ( X / X 0 ) t

3. Results

3.1. Fermentative Assay and Batch Experiment

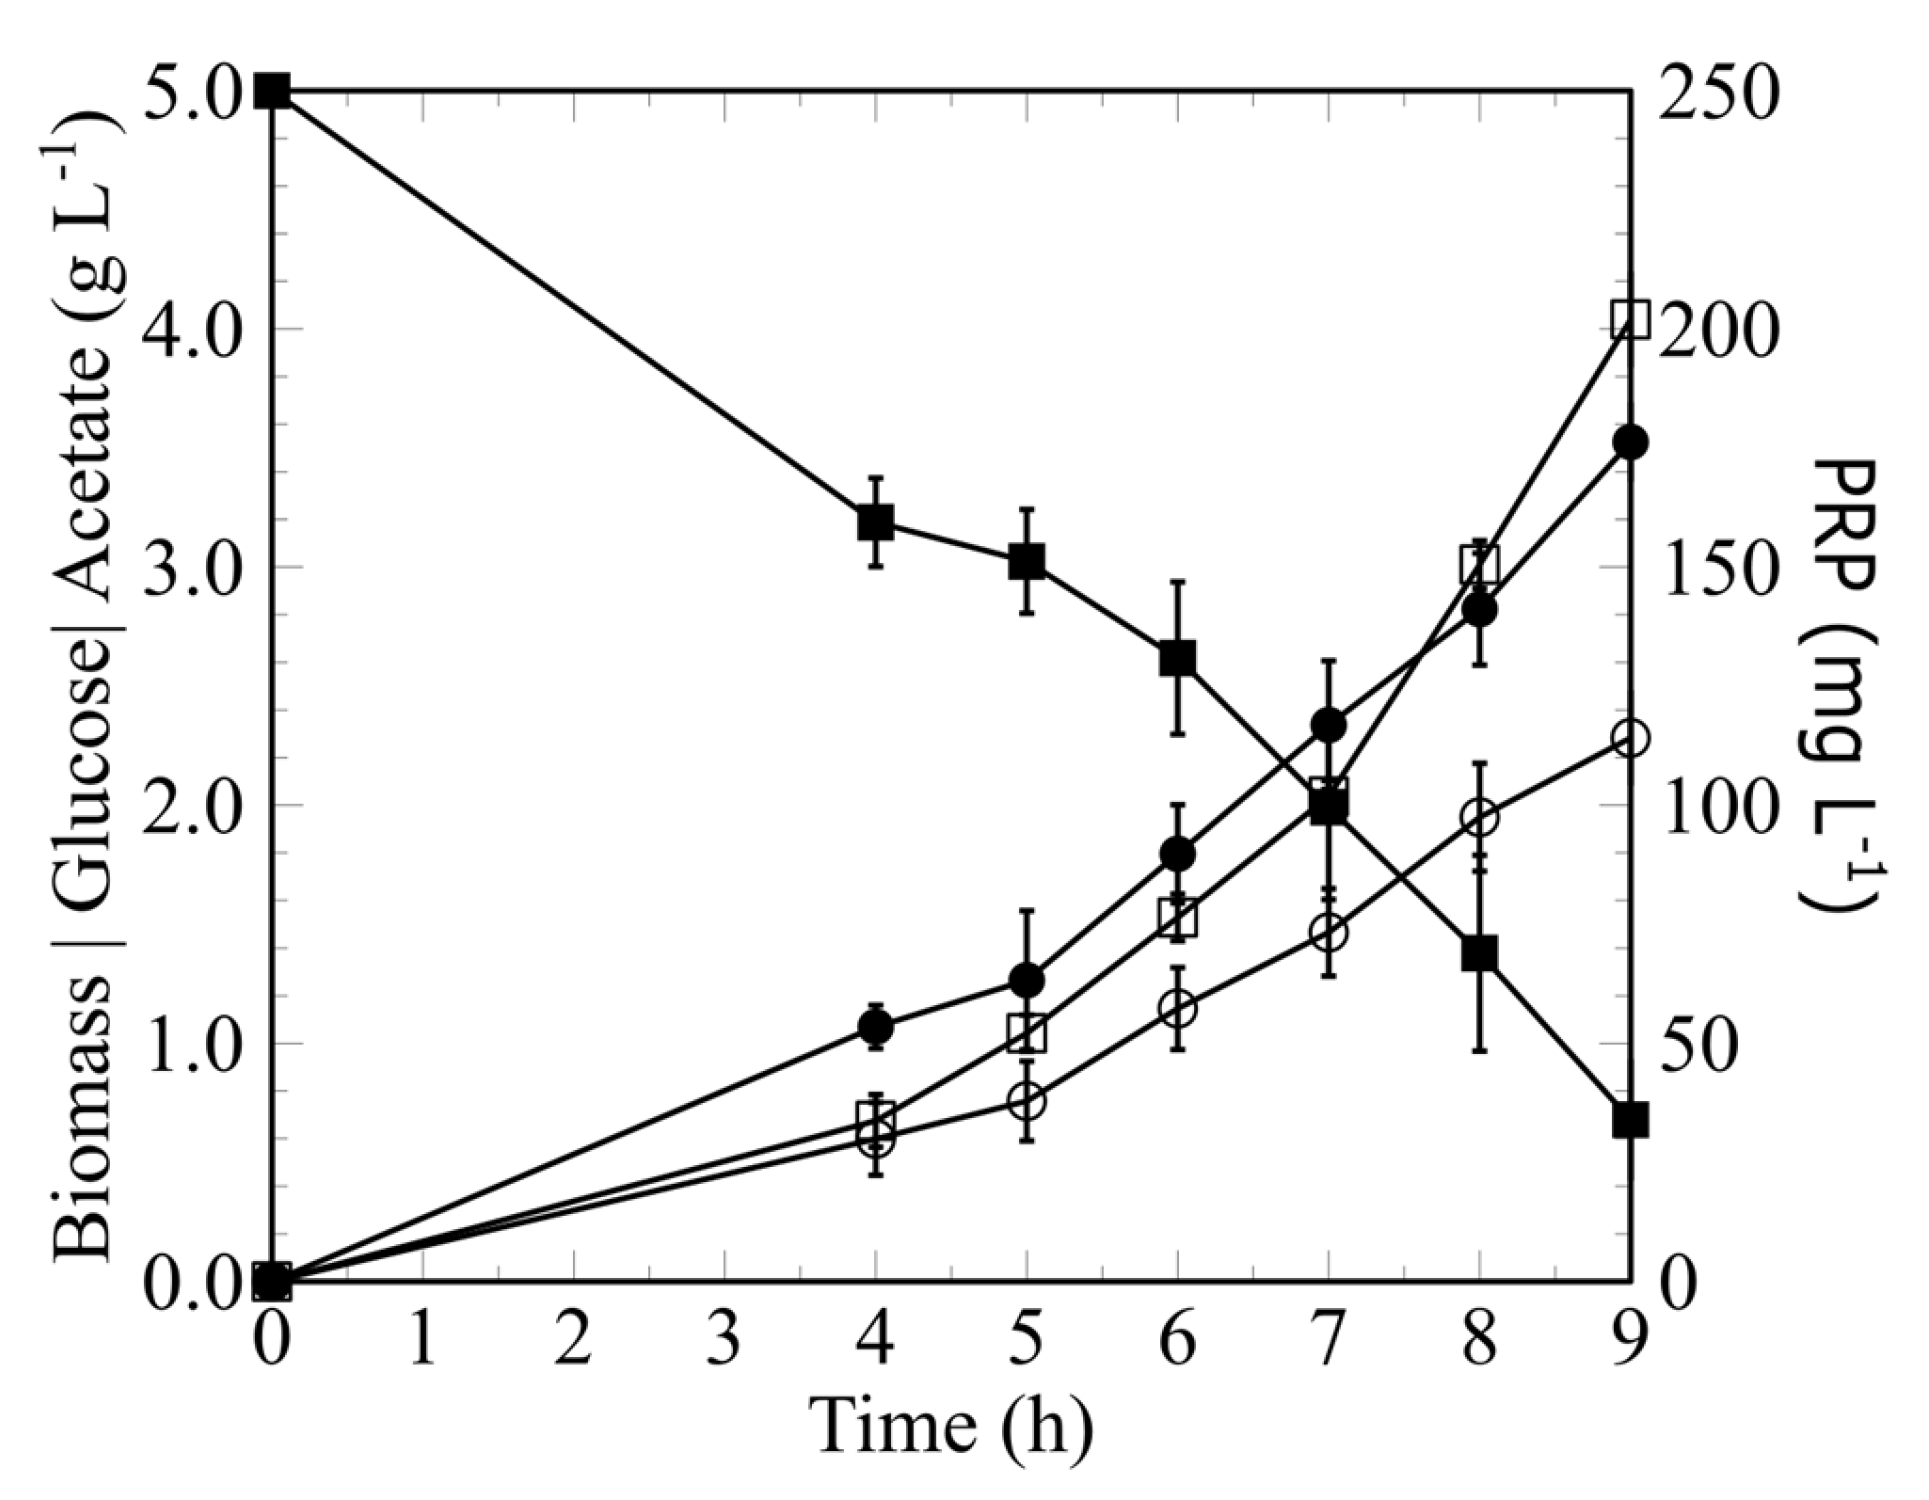
A total of five experiments were conducted, all performed in a single batch. The exponential phase occurred between 4 and 8 h of cultivation. Feeding was initiated in the ninth hour once the glucose concentration dropped below 1 g L−1, ensuring an adaptation period for the cells without substrate limitation at the onset of feeding. Figure 2 illustrates the growth kinetics during this stage.
The average PRP yield obtained during the single-batch step was 202 ± 16 mg L−1, with a productivity of 22.4 ± 1.9 mg L−1 h−1. The average biomass and acetate concentrations reached 3.53 ± 0.23 g L−1 and 2.28 ± 0.29 g L−1, respectively. The conversion ratios were as follows: PRP to substrate (Yp/s), 46.8 mg of PRP per g of glucose; PRP per biomass (Yp/x), 57.3 mg of PRP per g of biomass; and biomass to substrate (Yx/s), 0.82 g of biomass per g of glucose.

3.2. Determination of the Optimal Dilution Rate (D)

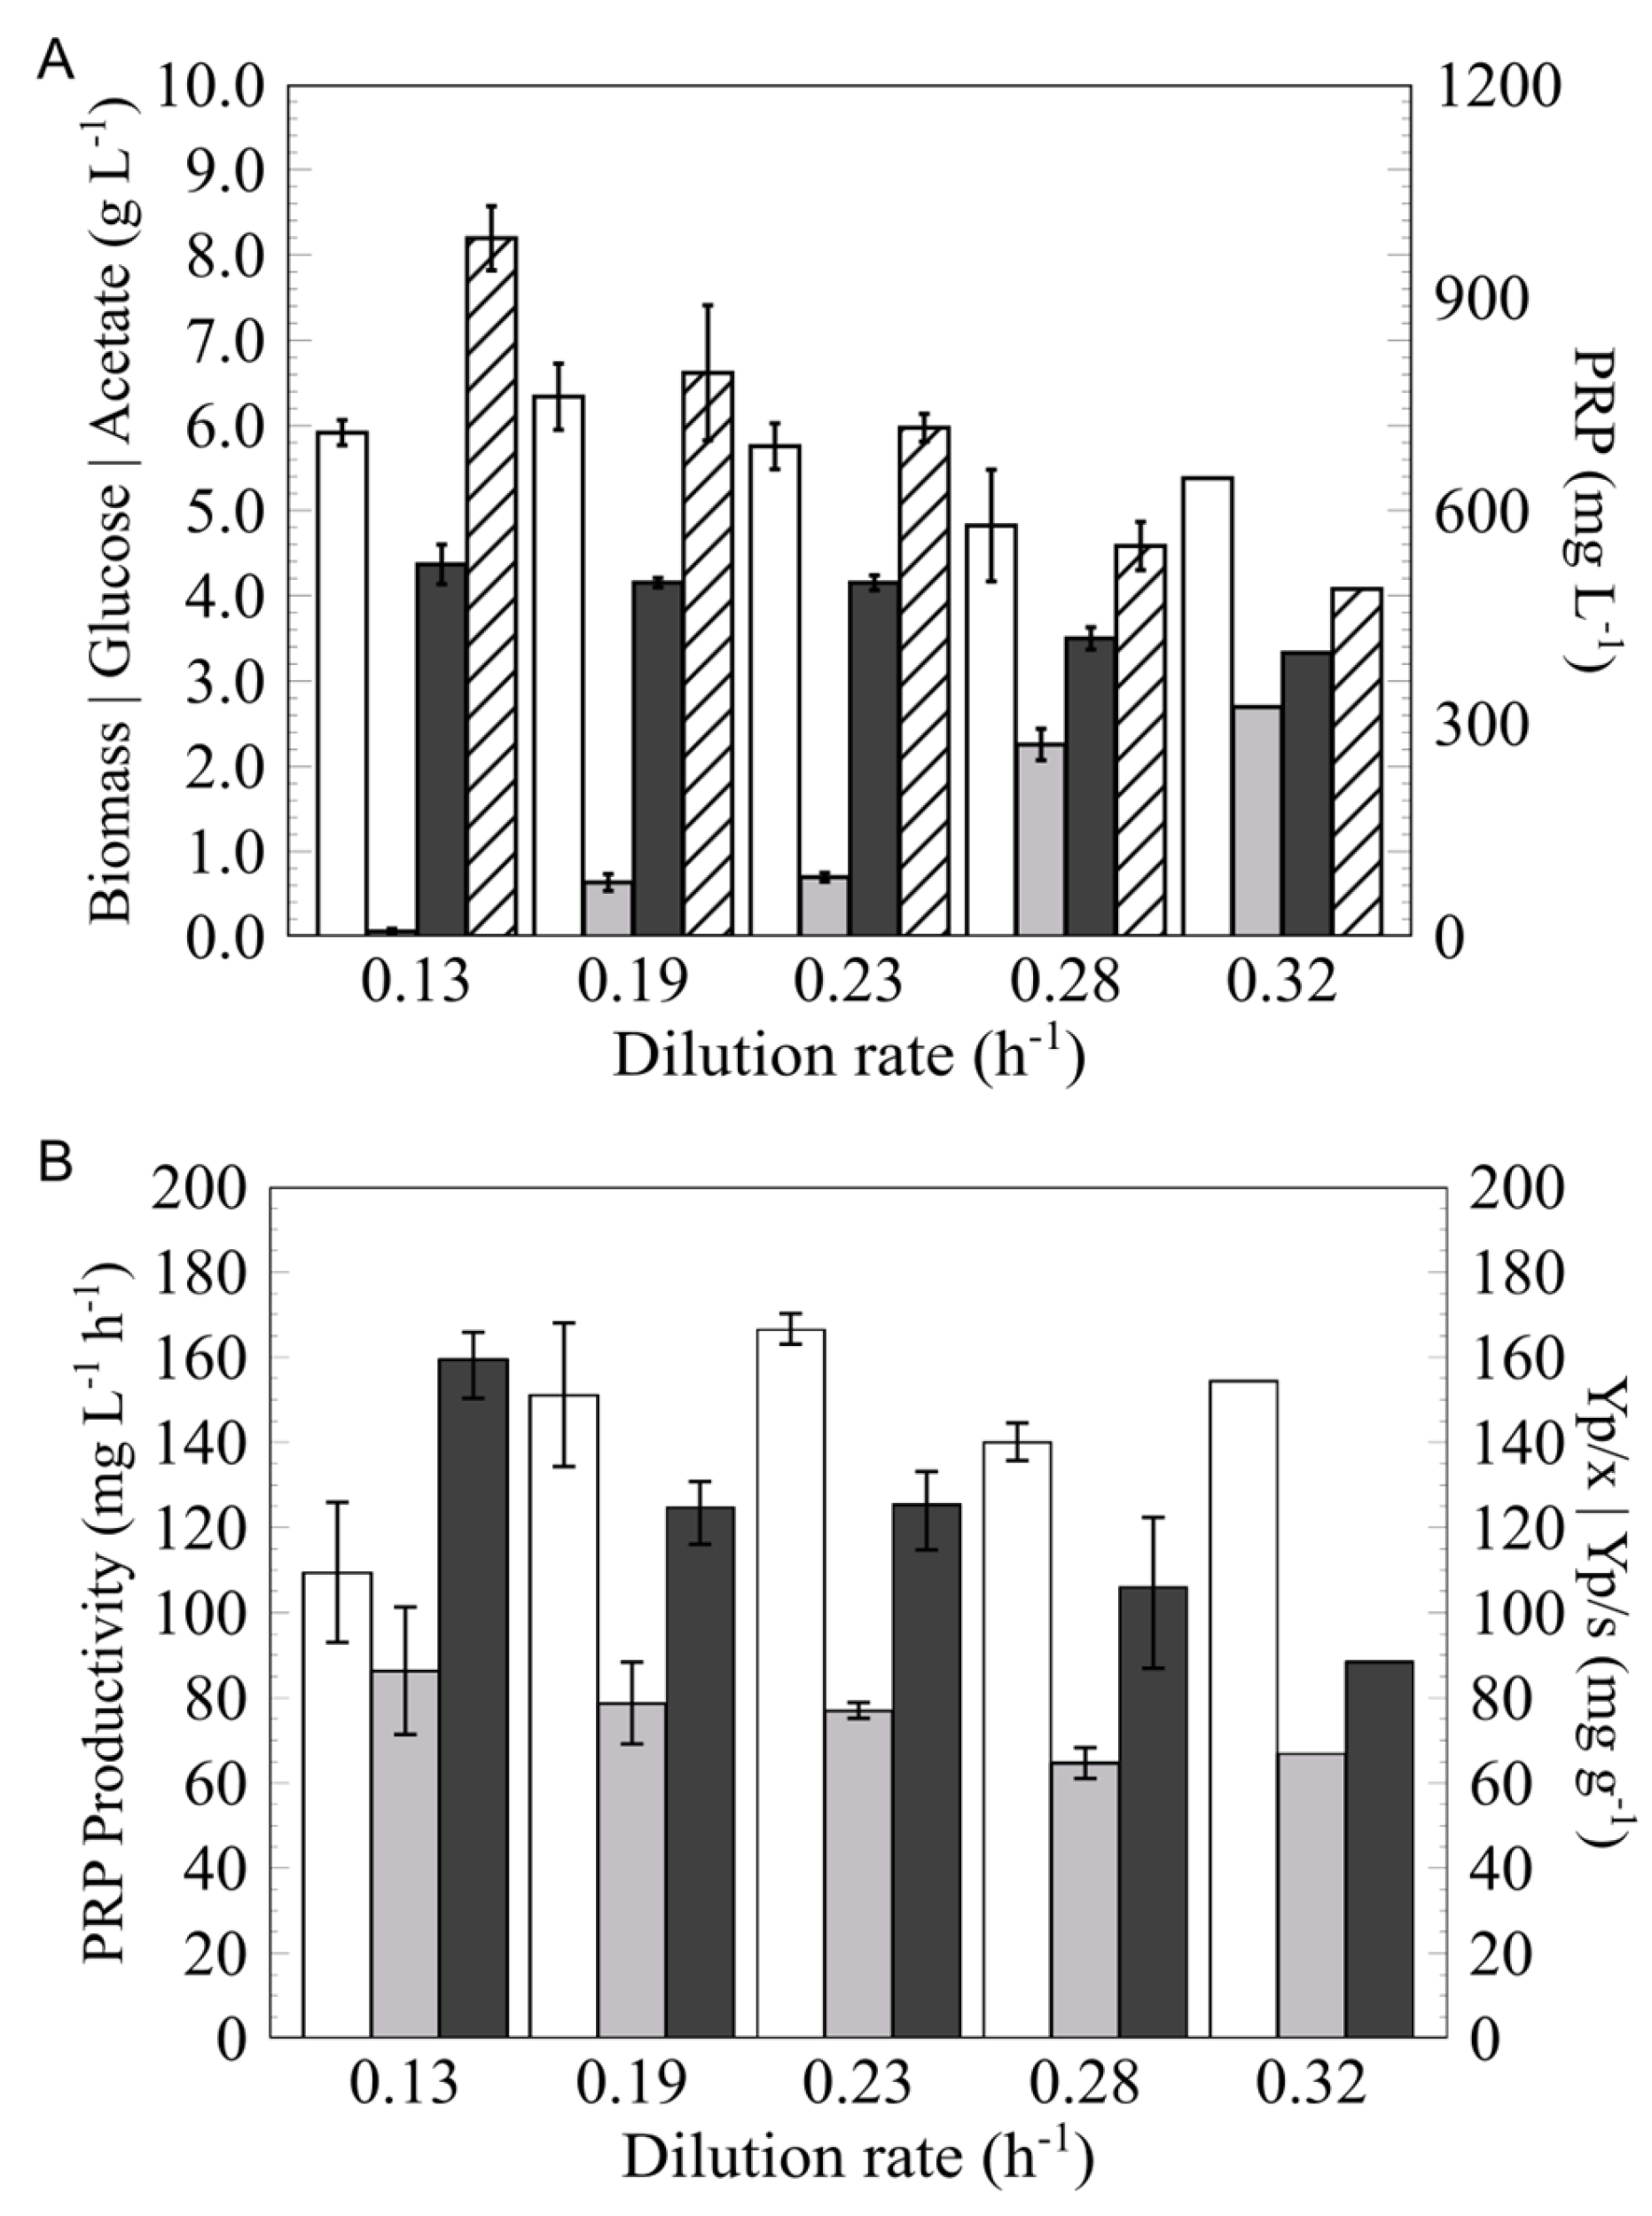
E01 to E04 were used to calculate PRP, biomass, glucose, and acetate values at different dilution rates, as illustrated in Figure 3A. Additionally, Figure 3B presents the conversion coefficients (Yp/s, Yp/x, and Yx/s) and productivity.
As shown in Figure 3A, biomass levels remained nearly constant despite the increasing dilution rate. However, PRP production decreased, while acetate levels remained stable up to a dilution rate (D) of 0.23 h−1. As illustrated in Figure 3B, shorter residence times (i.e., the time each cell remains in the reactor) led to a progressive reduction in product formation per biomass (Yp/x) as D increased. A decrease in the conversion of glucose to PRP (Yp/s) was also observed, likely due to glucose accumulation in the medium and its reduced utilization for product formation.
Regarding productivity, the highest value (167.0 ± 4.8 mg L−1 h−1) was obtained at D = 0.23 h−1, despite the higher average PRP concentrations at D = 0.13 h−1 (986 ± 78 mg L−1) and D = 0.19 h−1 (794 ± 134 mg L−1). Since productivity is directly related to D and PRP concentrations, this dilution rate (D = 0.23 h−1) resulted in the highest productivity. The productivities at D = 0.28 h−1 and 0.32 h−1 were similar, reaching 140 and 154 mgL−1 h−1, respectively. However, D = 0.23 h−1 was selected as the optimal condition, as it provided a higher PRP concentration in the fermentation broth along with improved productivity, which will facilitate the purification step in future studies.

3.3. Cultivation with Fixed D

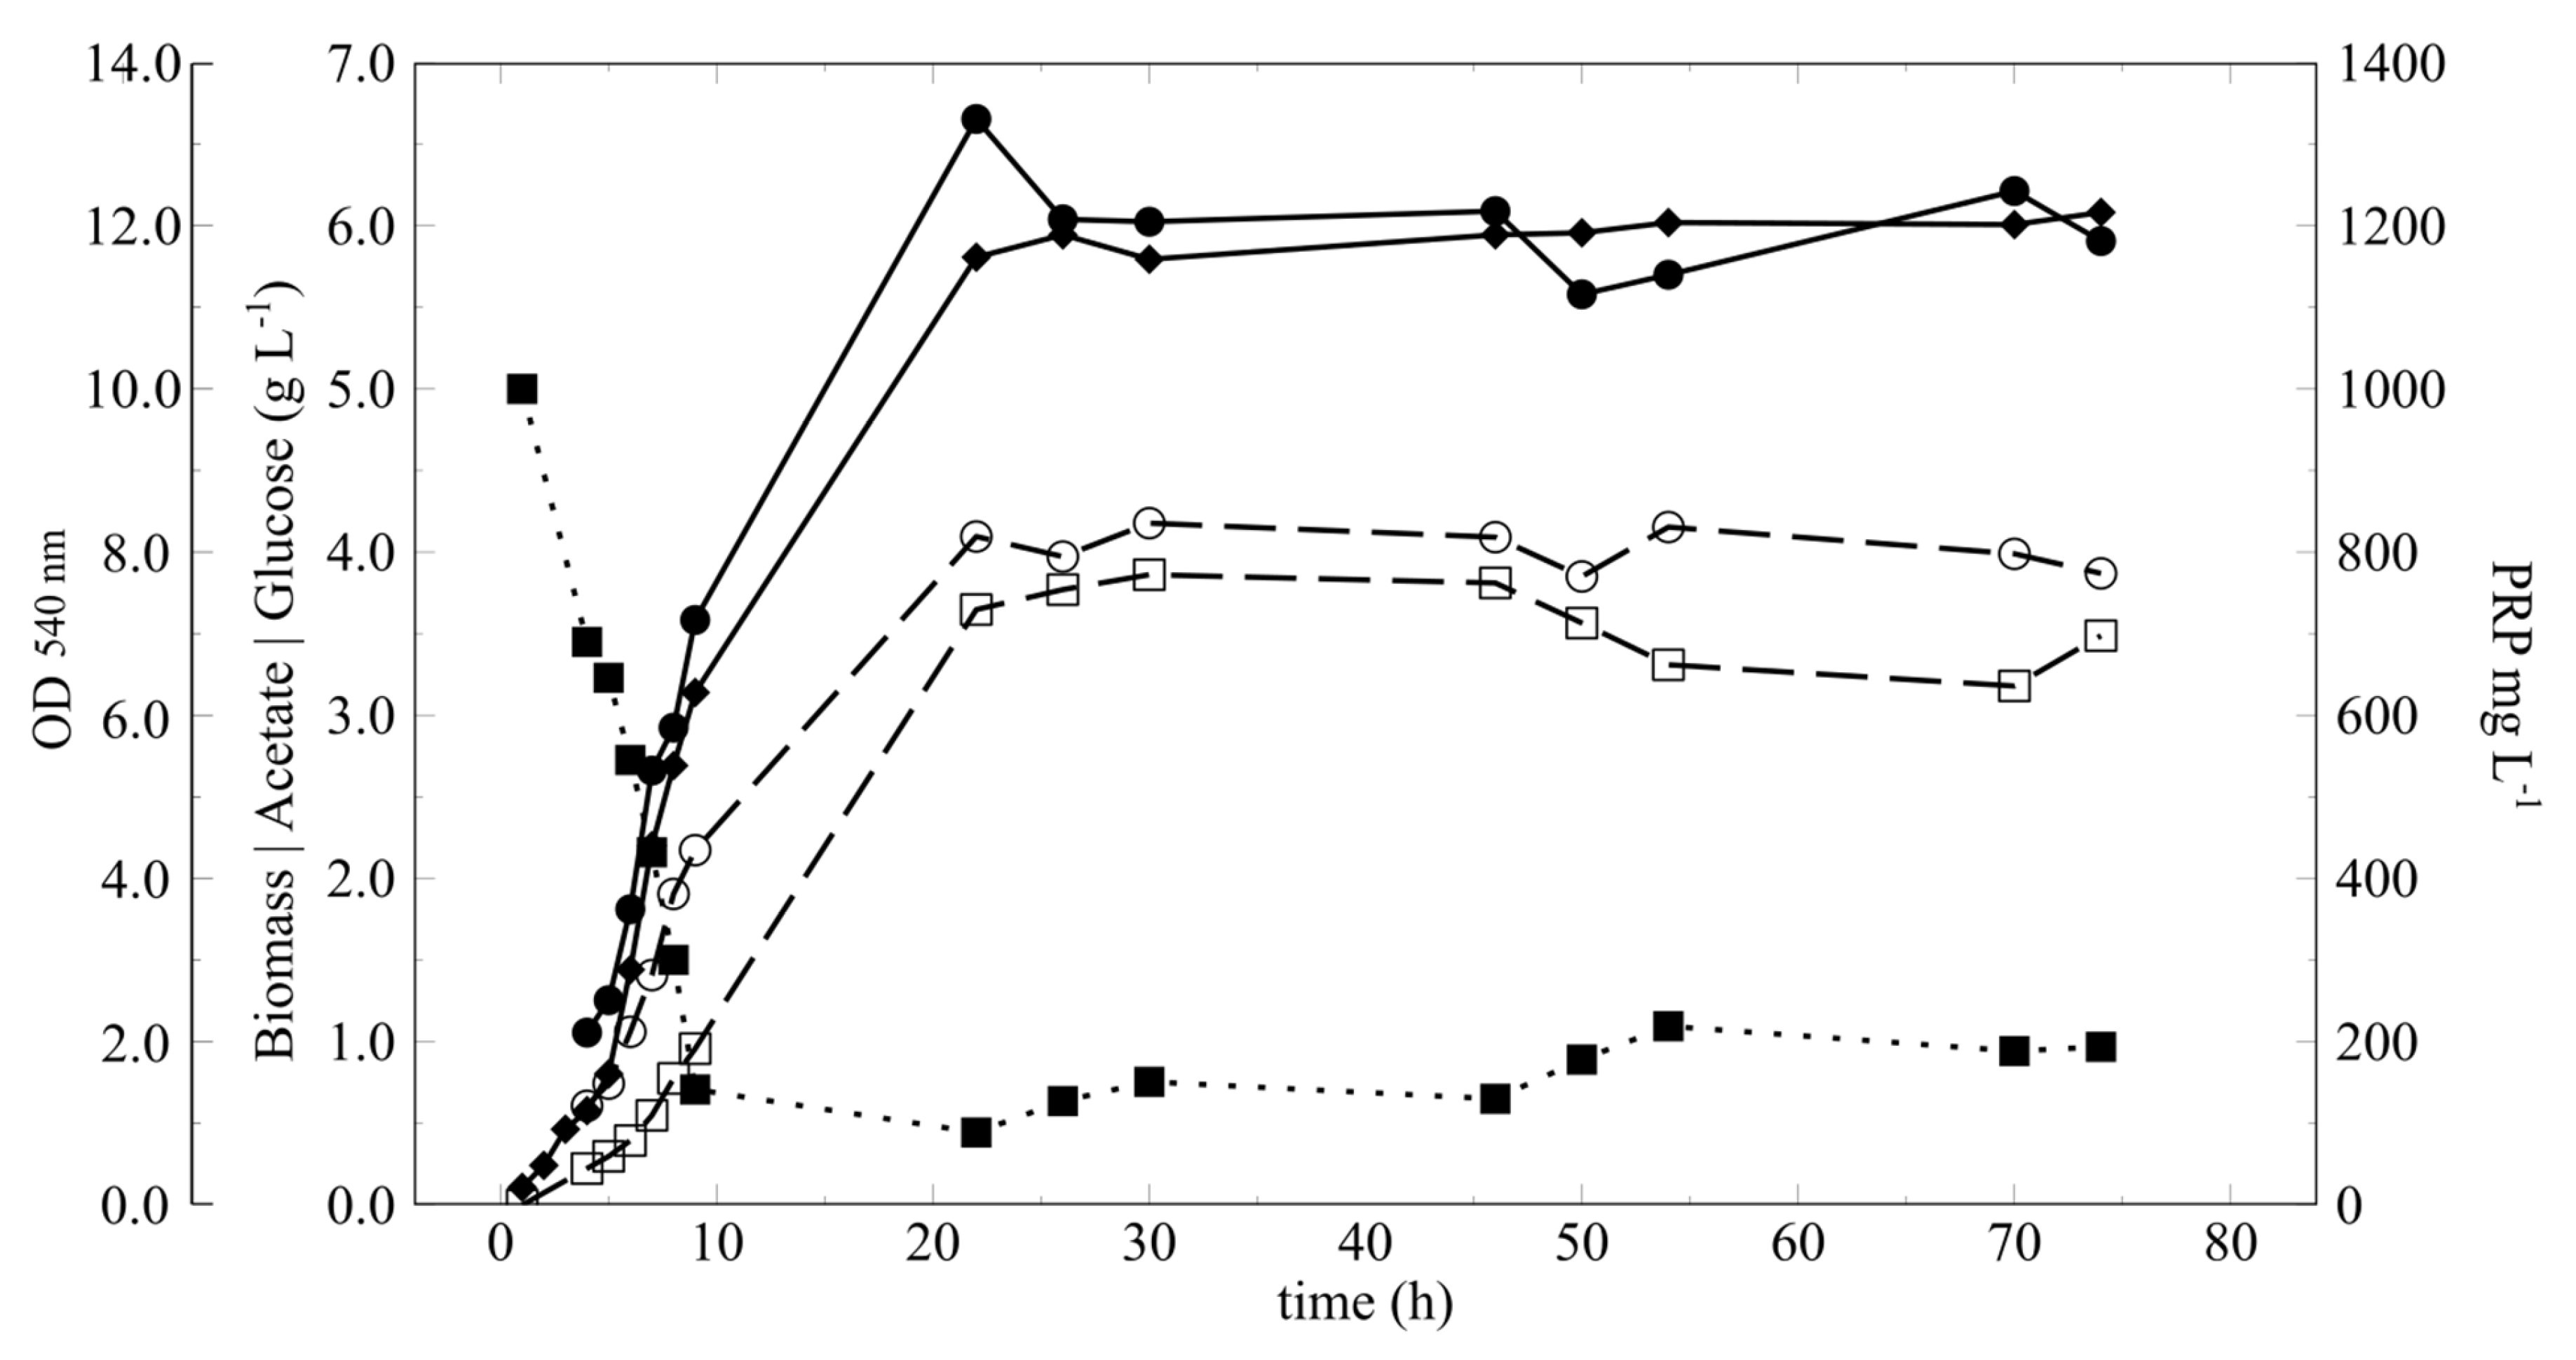
The fixed dilution rate of 0.23 h−1 was maintained for 74 h, of which 65 h were conducted in continuous mode. Figure 4 illustrates the values of cell density, acetate concentration, glucose, and PRP.
As illustrated in Figure 4, the cultivation profile remained stable over time, with a PRP final concentration of 716 ± 49 mg L−1 and a final productivity of 165 mgL−1 h−1, values similar to those obtained in previous assays. The final concentrations of glucose, acetate, and biomass were 0.85 ± 0.17 g L−1, 4.00 ± 0.12 g L−1, and 6.03 ± 0.33 g L−1, respectively.
In addition to determining the metabolites produced and consumed in the bioreactor, the concentrations of these metabolites were also measured in the output, along with the cellular PRP concentration. Unlike free PRP, cellular PRP is associated with the cells, and its average values are shown in Table 2. The bioreactor and output values remained similar, considering the standard deviations of each. The culture duration was 74.4 h, with 65.4 h of feeding, and a total of 12 L of broth was produced at the end.
A similar concentration of free PRP, glucose, and acetate was observed, with most of the PRP (78%) being released rather than remaining associated with the cells. Additionally, molecular mass values of 134 kD were quantified only in the output. Biomass was not determined in the output, but it was measured in the bioreactor at 6.03 g L−1.
In Table 3, the values for products, the substrate, biomass, and kinetic parameters (Yp/s, Yp/x, Yx/s, Qp, Ya/x, and Ya/s) are presented for both the batch phase (Figure 2) and the continuous culture (Figure 4) at a dilution rate of 0.23 h−1.
Comparing batch and continuous cultures, the concentrations of glucose and acetate were lower in the batch culture, with acetate accumulation being nearly twice as high in the continuous culture. The same increase was observed for biomass, which was 3.53 g L−1 in the batch culture and 6.03 g L−1 in the continuous process. This also resulted in an increased PRP concentration, with a threefold increase observed, from 202 to 688 mg L−1. This value was also reflected in the volumetric and specific productivities, which increased sevenfold and fourfold between the two systems. The coefficients showed no significant differences between the cultivation systems, except for PRP per biomass, which increased from 57.3 to 119 mg g−1. Variations were also observed in the substrate-to-product and substrate-to-biomass conversions. These values were expected, given the increased concentration of unused glucose in the medium.

4. Discussion

Numerous recent studies have attempted to enhance the PRP production process, focusing either on optimizing the culture medium or refining culture conditions [14,15,21,22,23,24]. Merritt et al. [22] established the fed-batch cultivation process for Hib, with a constant glucose and yeast extract addition rate. Silva [25] improved productivity by adopting different cultivation strategies, concluding that the optimal approach would be the use of fed-batch culture with a constant flow rate, which was further optimized in order to preserve the quality of PRP using the study by Cintra [15]. However, continuous culture without cell recycling for Hib has not yet been reported in the literature. The adoption of this system could be promising, as demonstrated in Streptococcus pneumoniae polysaccharide production, where a 300% increase in productivity was achieved [12].
Given this scenario, this study aimed to establish continuous Hib culture for PRP production. Different dilution rates were tested, ranging from 0.13 h−1 to 0.32 h−1, across the first four experiments. It was concluded that the optimal dilution rate was 0.23 h−1, yielding a PRP production of 726 ± 30 mg L−1. Although this was lower than the yields at 0.13 h−1 (986 mg L−1) and 0.19 h−1 (794 mg L−1), it achieved a higher volumetric productivity of 167 mg L−1 h−1 compared to 128 mg L−1 h−1 at 0.13 h−1 and 151 mg L−1 h−1 at 0.19 h−1.
The dilution rate that yielded the highest productivity (D = 0.23 h−1) was then selected for a prolonged continuous culture experiment with a fixed dilution rate. This run lasted 74.45 h, producing 12.8 L of fermented broth with an average PRP concentration of 688 mg L−1. Compared to our preliminary batch cultures, the continuous system exhibited a twofold increase in both final acetate and biomass concentrations. Furthermore, this system demonstrated an increased polysaccharide yield per cell (Yp/x) and a higher glucose-to-PRP conversion rate (Yp/s). Notably, PRP volumetric productivity increased by nearly eightfold compared to the batch phase, while specific productivity increased fourfold.
Regarding acetate, as presented for PRP, an increase in both volumetric and specific productivity was observed in continuous cultivation (0.93 ± 0.02 g L−1 h−1 and 0.153 ± 0.006 g g−1 h−1, respectively) compared to simple batch cultivation (0.25 ± 0.03 g L−1 h−1 and 0.072 ± 0.003 g g−1 h−1). Acetate is one of the main by-products of the aerobic metabolism of H. influenzae and is directly related to glucose consumption [26]. Several factors can affect its intracellular production; one hypothesis is the reduction in nitrogen availability under conditions of D = 0.23 h−1. In E. coli, nitrogen limitation leads to increased acetate production [27,28] and can also stimulate the pentose phosphate pathway [27]. In H. influenzae, this pathway is directly associated with PRP production, which may account for the observed increase in volumetric and specific productivity [29]. observed that reducing the ratio of glucose to yeast extract (the nitrogen source) increased PRP production by approximately 20%, which is in agreement with the results of this study. However, further investigation is warranted, as the nitrogen source in the MMP medium is complex, making it difficult to quantify the nitrogen content during the fermentation process.
Acetate accumulation in high levels, obtained in fed-batch cultivation, can reduce the cell growth limiting PRP production. In fed-batch cultures, Pillaca-Pullo et al. [30] observed limitation of growth when acetate reached up to 8.7 g L−1. The effect of high acetate concentration on Hib metabolism remains unclear. However, in E. coli, its intracellular accumulation is thought to disrupt the cell’s anionic balance and impair metabolic activity, leading to a decrease or cessation of growth [31,32,33]. Acetate removal in continuous cultivation was effective in ensuring constant production, limiting the maximum acetate concentration in the fermented broth. Although there was an increase in acetate production per cell, the final concentration remained below that observed in fed-batch, a conventional system used for industrial PRP production.
Considering now the cellular production for simple batch cultivation, the values were consistent with those in the literature. For example, Pillaca-Pullo et al. [30], using 1.5 L reactors, achieved 3.8 g L−1 dry biomass and 360 mg L−1 PRP, about 40% higher than the value obtained in our batch assays. Similarly, Merritt et al. [22] achieved a PRP concentration of 588 mg L−1, more than double that obtained in this study, with a total biomass of 2.8 g L−1 in 1.5 L reactors, using double the concentration of glucose and yeast extract. These differences can be attributed to several factors, including longer fermentation times, optimized nutrient compositions [24], or enhanced oxygen transfer processes [34].
The contrast is more pronounced when comparing our continuous culture results with published fed-batch culture. Merritt et al. [22] obtained 5.3 g L−1 biomass and 1200 mg L−1 PRP in 1.5 L fermenters with constant glucose and yeast extract feeding. In our study, while we achieved a higher biomass concentration (6.0 g L−1), the PRP concentration was significantly lower at 688 mg L−1. Similar high PRP concentrations in fed-batch were reported by Arsang et al. [23] with 1160 mg L−1 and Pillaca-Pullo et al. [30] with 1400 mg L−1 under comparable conditions. Notably, by optimizing oxygen transfer parameters, Pillaca-Pullo et al. [30] reached a higher biomass concentration of 9 g L−1, which is 50% higher than that achieved in our continuous culture. However, when productivity is considered, continuous cultivation stands out. The productivities reported for the fed-batch processes by Merritt et al. [22], Arsang et al. [23], and Pillaca-Pullo et al. [30] were 89.6, 52.7, and 73.7 mg L−1 h−1, respectively. In contrast, our continuous culture achieved a productivity of 165 mg L−1 h−1, which is nearly double the highest productivity (89.6 mg L−1 h−1) reported among these fed-batch studies.
This pattern is consistent with findings in other studies. For the production of butanol and other solvents by Clostridium acetobutylicum, Lipovsky et al. [35] reported that a fed-batch process yielded double the final solvent concentration compared to a continuous culture with immobilized cells; however, the continuous culture’s productivity was nearly three times higher. Similarly, Zhang et al. [36] observed that in L-leucine production by Corynebacterium glutamicum, fed-batch culture achieved a higher final concentration (53 g L−1) than continuous culture (24.8 g L−1), but the continuous culture had a 58% higher productivity than fed-batch culture (1.9 vs. 1.2 g L−1 h−1). Finally, Robert et al. [37] studied a chemostat continuous culture for the recombinant production of lipase B by Candida antarctica; they found that it was 1.5 times more productive than a fed-batch system, despite yielding lower biomass and enzyme concentrations.
However, even with the increased productivity, variations in the molecular mass of PRP were detected. The molecular mass of PRP is a key factor in both purification and vaccine efficacy after conjugation with tetanus toxoid (TT). Pillaca-Pullo et al. [30] reported molecular masses of 330–375 kDa in batch and fed-batch systems, whereas in our study, PRP presented a lower mass of ~134 kDa. PRP molecules are structurally unstable and may undergo self-degradation under a high pH or temperature [38], but this was minimized here through strict process control. Another possible explanation is capsule loss due to genetic alterations during long-term cultivation, previously reported at frequencies of 0.1–0.3% [39]. This represents a critical process variable that should be further investigated.
Importantly, a lower molecular mass does not necessarily impair downstream processing or immunogenicity. Braga et al. [17] and the patent of Hamidi and Beurret [40] showed that purification can be successfully performed with 100 kDa membranes, and the process could be adapted to smaller cutoffs if required. During conjugation, PRP is often depolymerized to molecular weights in the range of 50–100 Da, and even smaller polysaccharides (~10 kDa) have been shown to be capable of producing conjugates with the tetanus toxoid and eliciting strong immune responses [41]. Therefore, despite the reduced molecular mass obtained here, PRP with values below 300 kDa can still be considered viable for vaccine production. Nevertheless, further studies are required to better elucidate the mechanisms underlying PRP size variation and capsule stability during continuous Hib cultivation over extended periods.

5. Conclusions

This study represents the first report evaluating the Haemophilus influenzae type b productivity of capsular polysaccharide (PRP), including the growth and metabolite profiles of PRP under continuous culture without cell recycling. The results demonstrate that continuous cultivation is an efficient strategy for PRP production, yielding higher productivity than traditional batch and fed-batch processes. A 1 L continuous culture system was successfully established, with the optimal dilution rate defined at 0.23 h−1, resulting in a productivity of 165 mg L−1 h−1. This value was approximately twofold higher than fed-batch systems and eightfold higher than simple batch cultivation. Although acetate accumulation was more than double that observed in batch culture, it remained below the levels typically reported for fed-batch and lower than the critical inhibitory levels reported for this process.
However, the PRP produced exhibited a lower molecular mass than that commonly reported in the literature. However, this does not necessarily represent a limitation, as conjugation processes often require polysaccharides within the molecular weight range observed in this study. However, robustness tests at the current scale and subsequent scale-up to 10 L are recommended. In addition, stability assays should be performed to monitor PRP molecular mass throughout cultivation and to establish the maximum feasible culture duration without compromising PRP antigenicity. Overall, continuous cultivation proved to be an efficient and promising alternative for Hib capsular polysaccharide production, offering significant advantages over conventional batch and fed-batch processes.

Author Contributions

L.S.S.: data collection, sample preparation, data analysis, experimental design, and manuscript writing. L.D.V.: chromatographic analysis of glucose, acetate, PRP concentration, and molecular mass determination. M.T.: supervision, conceptualization of experiment, and revision of manuscript. All authors have read and agreed to the published version of the manuscript.

Funding

This study was funded by the Brazilian Development Bank, (Gran No. 11.2.0322.1/2012), Butantan Foundation and National Council for Scientific and Technological Development (CNPq).

Institutional Review Board Statement

Not applicable.

Informed Consent Statement

Not applicable.

Data Availability Statement

The original contributions presented in the study are included in the article, further inquiries can be directed to the corresponding author.

Acknowledgments

We thank Ana Maria Rodriges Soares and Raimunda Ferreira da Silva for their technical support.

Conflicts of Interest

The authors declare no conflict of interest.

Appendix A

Table A1. Different experiments (E01–E05) conducted with varying dilution rates (D), showing the respective cultivation time in hours (h).
ExperimentsDilution
(h−1)
Cultivation Time (h)
E010.130.19-52.0
E020.130.19-51.7
E030.130.2300.2876.9
E040.230.2800.3280.4
E050.2374.45

References

  1. Wenger, J.D.; Hightower, A.W.; Facklam, R.R.; Gaventa, S.; Broome, C.V. Bacterial Meningitis in the United States, 1986: Report of a Multistate Surveillance Study. J. Infect. Dis. 1990, 162, 1316–1323. [Google Scholar] [CrossRef]
  2. Park, J.J.; Narayanan, S.; Tiefenbach, J.; Lukšić, I.; Ale, B.M.; Adeloye, D.; Rudan, I. Estimating the global and regional burden of meningitis in children caused by Haemophilus influenzae type b: A systematic review and meta-analysis. J. Glob. Health 2022, 12, 04014. [Google Scholar] [CrossRef] [PubMed]
  3. Zanella, R.C.; Bokermann, S.; Galhardo, M.; Gava, C.; Almeida, S.C.G.; Pereira, G.A.; de Lemos, A.P.S. Trends in serotype distribution and antimicrobial susceptibility pattern of invasive Haemophilus influenzae isolates from Brazil, 2009–2021. Int. Microbiol. 2024, 28, 157–163. [Google Scholar] [CrossRef] [PubMed]
  4. Slack, M.P.E. Long Term Impact of Conjugate Vaccines on Haemophilus influenzae Meningitis: Narrative Review. Microorganisms 2021, 9, 886. [Google Scholar] [CrossRef] [PubMed]
  5. Crisel, R.M.; Baker, R.S.; Dorman, D.E. Capsular polymer of Haemophilus influenzae, type b. I. Structural characterization of the capsular polymer of strain Eagan. J. Biol. Chem. 1975, 250, 4926–4930. [Google Scholar] [CrossRef]
  6. Gilsdorf, J.R. Hib Vaccines: Their Impact on Haemophilus influenzae Type b Disease. J. Infect. Dis. 2021, 224, S321–S330. [Google Scholar] [CrossRef]
  7. Rienstra, M.S.; Scattergood, E.M.; Sitrin, R.D.; Merck and Co Inc. Process for Removing Bacterial Endotoxin from Gram-Negative Polysaccharides. U.S. Patent 5,039,610, 13 August 1991. [Google Scholar]
  8. Albani, S.M.F.; da Silva, M.R.; Fratelli, F.; Junior, C.P.C.; Iourtov, D.; Cintra, F.d.O.; Takagi, M.; Cabrera-Crespo, J. Polysaccharide purification from Haemophilus influenzae type b through tangential microfiltration. Carbohydr. Polym. 2015, 116, 67–73. [Google Scholar] [CrossRef]
  9. Katoh, S.; Horiuchi, J.-I.; Yoshida, F. Chemical and Biochemical Kinetics. In Biochemical Engineering, 1st ed.; Wiley: Weinheim, Germany, 2015; pp. 27–46. [Google Scholar]
  10. Cintra, F.d.O.; Takagi, M. Selectiom of a mathematical model for the kinetics of Haemophilus influenzae type b using akaike’s information criterion. Braz. J. Chem. Eng. 2018, 35, 1305–1314. [Google Scholar] [CrossRef]
  11. Del Hierro, A.G.; Moreno-Cid, J.A.; Casey, E. Continuous biomanufacturing for sustainable bioeconomy applications. EFB Bioecon. J. 2024, 4, 100071. [Google Scholar] [CrossRef]
  12. Gogola-Kolling, V.M.R.; Zanardo, R.T.; Carmo, T.S.; Zampoli, N.D.; Figueiredo, D.B.; Gonçalves, V.M. Improved capsular polysaccharide production by Streptococcus pneumoniae serotype 14 using continuous cultivation. Biochem. Eng. J. 2014, 91, 16–22. [Google Scholar] [CrossRef]
  13. Gerritzen, M.J.; Stangowez, L.; van de Waterbeemd, B.; Martens, D.E.; Wijffels, R.H.; Stork, M. Continuous production of Neisseria meningitidis outer membrane vesicles. Appl. Microbiol. Biotechnol. 2019, 103, 9401–9410. [Google Scholar] [CrossRef] [PubMed]
  14. Takagi, M.; Cabrera-Crespo, J.; Baruque-Ramos, J.; Zangirolami, T.C.; Raw, I.; Tanizaki, M.M. Characterization of Polysaccharide Production of Haemophilus influenzae Type b and Its Relationship to Bacterial Cell Growth. Appl. Biochem. Biotechnol. 2003, 110, 91–100. [Google Scholar] [CrossRef] [PubMed]
  15. Cintra, F.d.O. Mathematical Modeling and Optimization of Exopolysaccharide Production from Haemophilus influenzae Type b. Master’s Thesis, Universidade de São Paulo, São Paulo, Brazil, 2015. [Google Scholar]
  16. de Haan, A.; van der Put, R.M.F.; Beurret, M. HPAEC-PAD method for the analysis of alkaline hydrolyzates of Haemophilus influenzae type b capsular polysaccharide. Biomed. Chromatogr. 2013, 27, 1137–1142. [Google Scholar] [CrossRef] [PubMed]
  17. Braga, L.; Da Silva, T.; Cintra, F.; Takagi, M. Mathematical model for simultaneous microfiltration and ultrafiltration of Haemophilus influenzae type b to cell separation and polysaccharide recovery. J. Membr. Sci. 2015, 481, 188–194. [Google Scholar] [CrossRef]
  18. Mawas, F.; Bolgiano, B.; Rigsby, P.; Crane, D.; Belgrave, D.; Corbel, M.J. Evaluation of the saccharide content and stability of the first WHO International Standard for Haemophilus influenzae b capsular polysaccharide. Biologicals 2007, 35, 235–245. [Google Scholar] [CrossRef]
  19. Kroll, J.S.; Moxon, E.R. Capsulation and gene copy number at the cap locus of Haemophilus influenzae type b. J. Bacteriol. 1988, 170, 859–864. [Google Scholar] [CrossRef]
  20. Cintra, F.O.; Takagi, M. Comparison among different sample treatment methods for analysis of molecular weight and concentration of exopolysaccharide produced by Haemophilus influenzae type b. In Microbes in Applied Research; WORLD SCIENTIFIC: Singapore, 2012; pp. 513–517. [Google Scholar]
  21. Takagi, M.; Cabrera-Crespo, J.; Zangirolami, T.C.; Raw, I.; Tanizaki, M.M. Improved cultivation conditions for polysaccharide production by H. influenzae type b. J. Chem. Technol. Biotechnol. 2006, 81, 182–188. [Google Scholar] [CrossRef]
  22. Merritt, J.; Allard, G.; O’toole, L.; Swartz, R.; Licari, P. Development and scale-up of a fed-batch process for the production of capsular polysaccharide from Haemophilus influenzae. J. Biotechnol. 2000, 81, 189–197. [Google Scholar] [CrossRef]
  23. Arsang, A.; Tabatabaie, A.; Vaziri, F.; Nejati, M.; Zolfaghari, M.R.; Fateh, A.; Jamnani, F.R.; Bahrmand, A.R.; Siadat, S.D. Optimization of large scale production of Haemophilus influenzae type b polyribosyl-ribitol phosphate. Minerva Biotechnol. Biomol. Res. 2016, 29, 17–23. [Google Scholar] [CrossRef]
  24. da Silva, M.R.; Portela, C.A.F.; Albani, S.M.F.; de Paiva, P.R.; Tanizaki, M.M.; Zangirolami, T.C. Experimental design and metabolic flux analysis tools to optimize industrially relevant Haemophilus influenzae type b growth medium. Biotechnol. Prog. 2017, 33, 1508–1519. [Google Scholar] [CrossRef]
  25. da Silva, M.R. Cultivation Strategies for the Production of Capsular Polysaccharide by Haemophilus influenzae Type b and Determination of Quality Parameters for the Product. Master’s Thesis, Universidade Federal de São Carlos, São Carlos, Brazil, 2010. [Google Scholar]
  26. Othman, D.S.M.P.; Schirra, H.; McEwan, A.G.; Kappler, U. Metabolic versatility in Haemophilus influenzae: A metabolomic and genomic analysis. Front. Microbiol. 2014, 5, 69. [Google Scholar] [CrossRef]
  27. Sauer, U.; Lasko, D.R.; Fiaux, J.; Hochuli, M.; Glaser, R.; Szyperski, T.; Wüthrich, K.; Bailey, J.E. Metabolic Flux Ratio Analysis of Genetic and Environmental Modulations of Escherichia coli Central Carbon Metabolism. J. Bacteriol. 1999, 181, 6679–6688. [Google Scholar] [CrossRef] [PubMed]
  28. Eiteman, M.A.; Altman, E. Overcoming acetate in Escherichia coli recombinant protein fermentations. Trends Biotechnol. 2006, 24, 530–536. [Google Scholar] [CrossRef] [PubMed]
  29. Follens, A.; Veiga-Da-Cunha, M.; Merckx, R.; van Schaftingen, E.; van Eldere, J. acs1 of Haemophilus influenzae Type a Capsulation Locus Region II Encodes a Bifunctional Ribulose 5-Phosphate Reductase– CDP-Ribitol Pyrophosphorylase. J. Bacteriol. 1999, 181, 2001–2007. [Google Scholar] [CrossRef] [PubMed]
  30. Pillaca-Pullo, O.; Vieira, L.D.; Takagi, M. Scale-Up of Capsular Polysaccharide Production Process by Haemophilus influenzae Type b Using kLa Criterion. Bioengineering 2022, 9, 415. [Google Scholar] [CrossRef]
  31. Axe, D.D.; Bailey, J.E. Transport of lactate and acetate through the energized cytoplasmic membrane of Escherichia coli. Biotechnol. Bioeng. 1995, 47, 8–19. [Google Scholar] [CrossRef]
  32. Roe, A.J.; McLaggan, D.; Davidson, I.; O’bYrne, C.; Booth, I.R. Perturbation of Anion Balance during Inhibition of Growth of Escherichia coli by Weak Acids. J. Bacteriol. 1998, 180, 767–772. [Google Scholar] [CrossRef]
  33. Pinhal, S.; Ropers, D.; Geiselmann, J.; de Jong, H. Acetate Metabolism and the Inhibition of Bacterial Growth by Acetate. J. Bacteriol. 2019, 201, 1–19. [Google Scholar] [CrossRef]
  34. Garcia-Ochoa, F.; Gomez, E.; Santos, V.E.; Merchuk, J.C. Oxygen uptake rate in microbial processes: An overview. Biochem. Eng. J. 2010, 49, 289–307. [Google Scholar] [CrossRef]
  35. Lipovsky, J.; Patakova, P.; Paulova, L.; Pokorny, T.; Rychtera, M.; Melzoch, K. Butanol production by Clostridium pasteurianum NRRL B-598 in continuous culture compared to batch and fed-batch systems. Fuel Process. Technol. 2016, 144, 139–144. [Google Scholar] [CrossRef]
  36. Zhang, Y.; Xiong, H.; Chen, Z.; Fu, Y.; Xu, Q.; Chen, N. Effect of fed-batch and chemostat cultivation processes of C. glutamicum CP for L-leucine production. Bioengineered 2021, 12, 426–439. [Google Scholar] [CrossRef]
  37. Robert, J.d.M.; Garcia-Ortega, X.; Montesinos-Seguí, J.L.; Freire, D.M.G.; Valero, F. Continuous operation, a realistic alternative to fed-batch fermentation for the production of recombinant lipase B from Candida antarctica under the constitutive promoter PGK in Pichia pastoris. Biochem. Eng. J. 2019, 147, 39–47. [Google Scholar] [CrossRef]
  38. Cintra, F.d.O.; Takagi, M. Study of the chemical stability of the capsular polysaccharide produced by Haemophilus influenzae type b. Carbohydr. Polym. 2015, 116, 167–172. [Google Scholar] [CrossRef]
  39. Hoiseth, S.K.; Connelly, C.J.; Moxon, E.R. Genetics of spontaneous, high-frequency loss of b capsule expression in Haemophilus influenzae. Infect. Immun. 1985, 49, 389–395. [Google Scholar] [CrossRef]
  40. Hamidi, A.; Beurret, M.F. Patents Process for Producing a Capsular Polysaccharide for Use in Conjugate Vaccines. U.S. Patent 7,582,459, 1 September 2009. [Google Scholar]
  41. Rana, R.; Dalal, J.; Singh, D.; Kumar, N.; Hanif, S.; Joshi, N.; Chhikara, M. Development and characterization of Haemophilus influenzae type b conjugate vaccine prepared using different polysaccharide chain lengths. Vaccine 2015, 33, 2646–2654. [Google Scholar] [CrossRef]
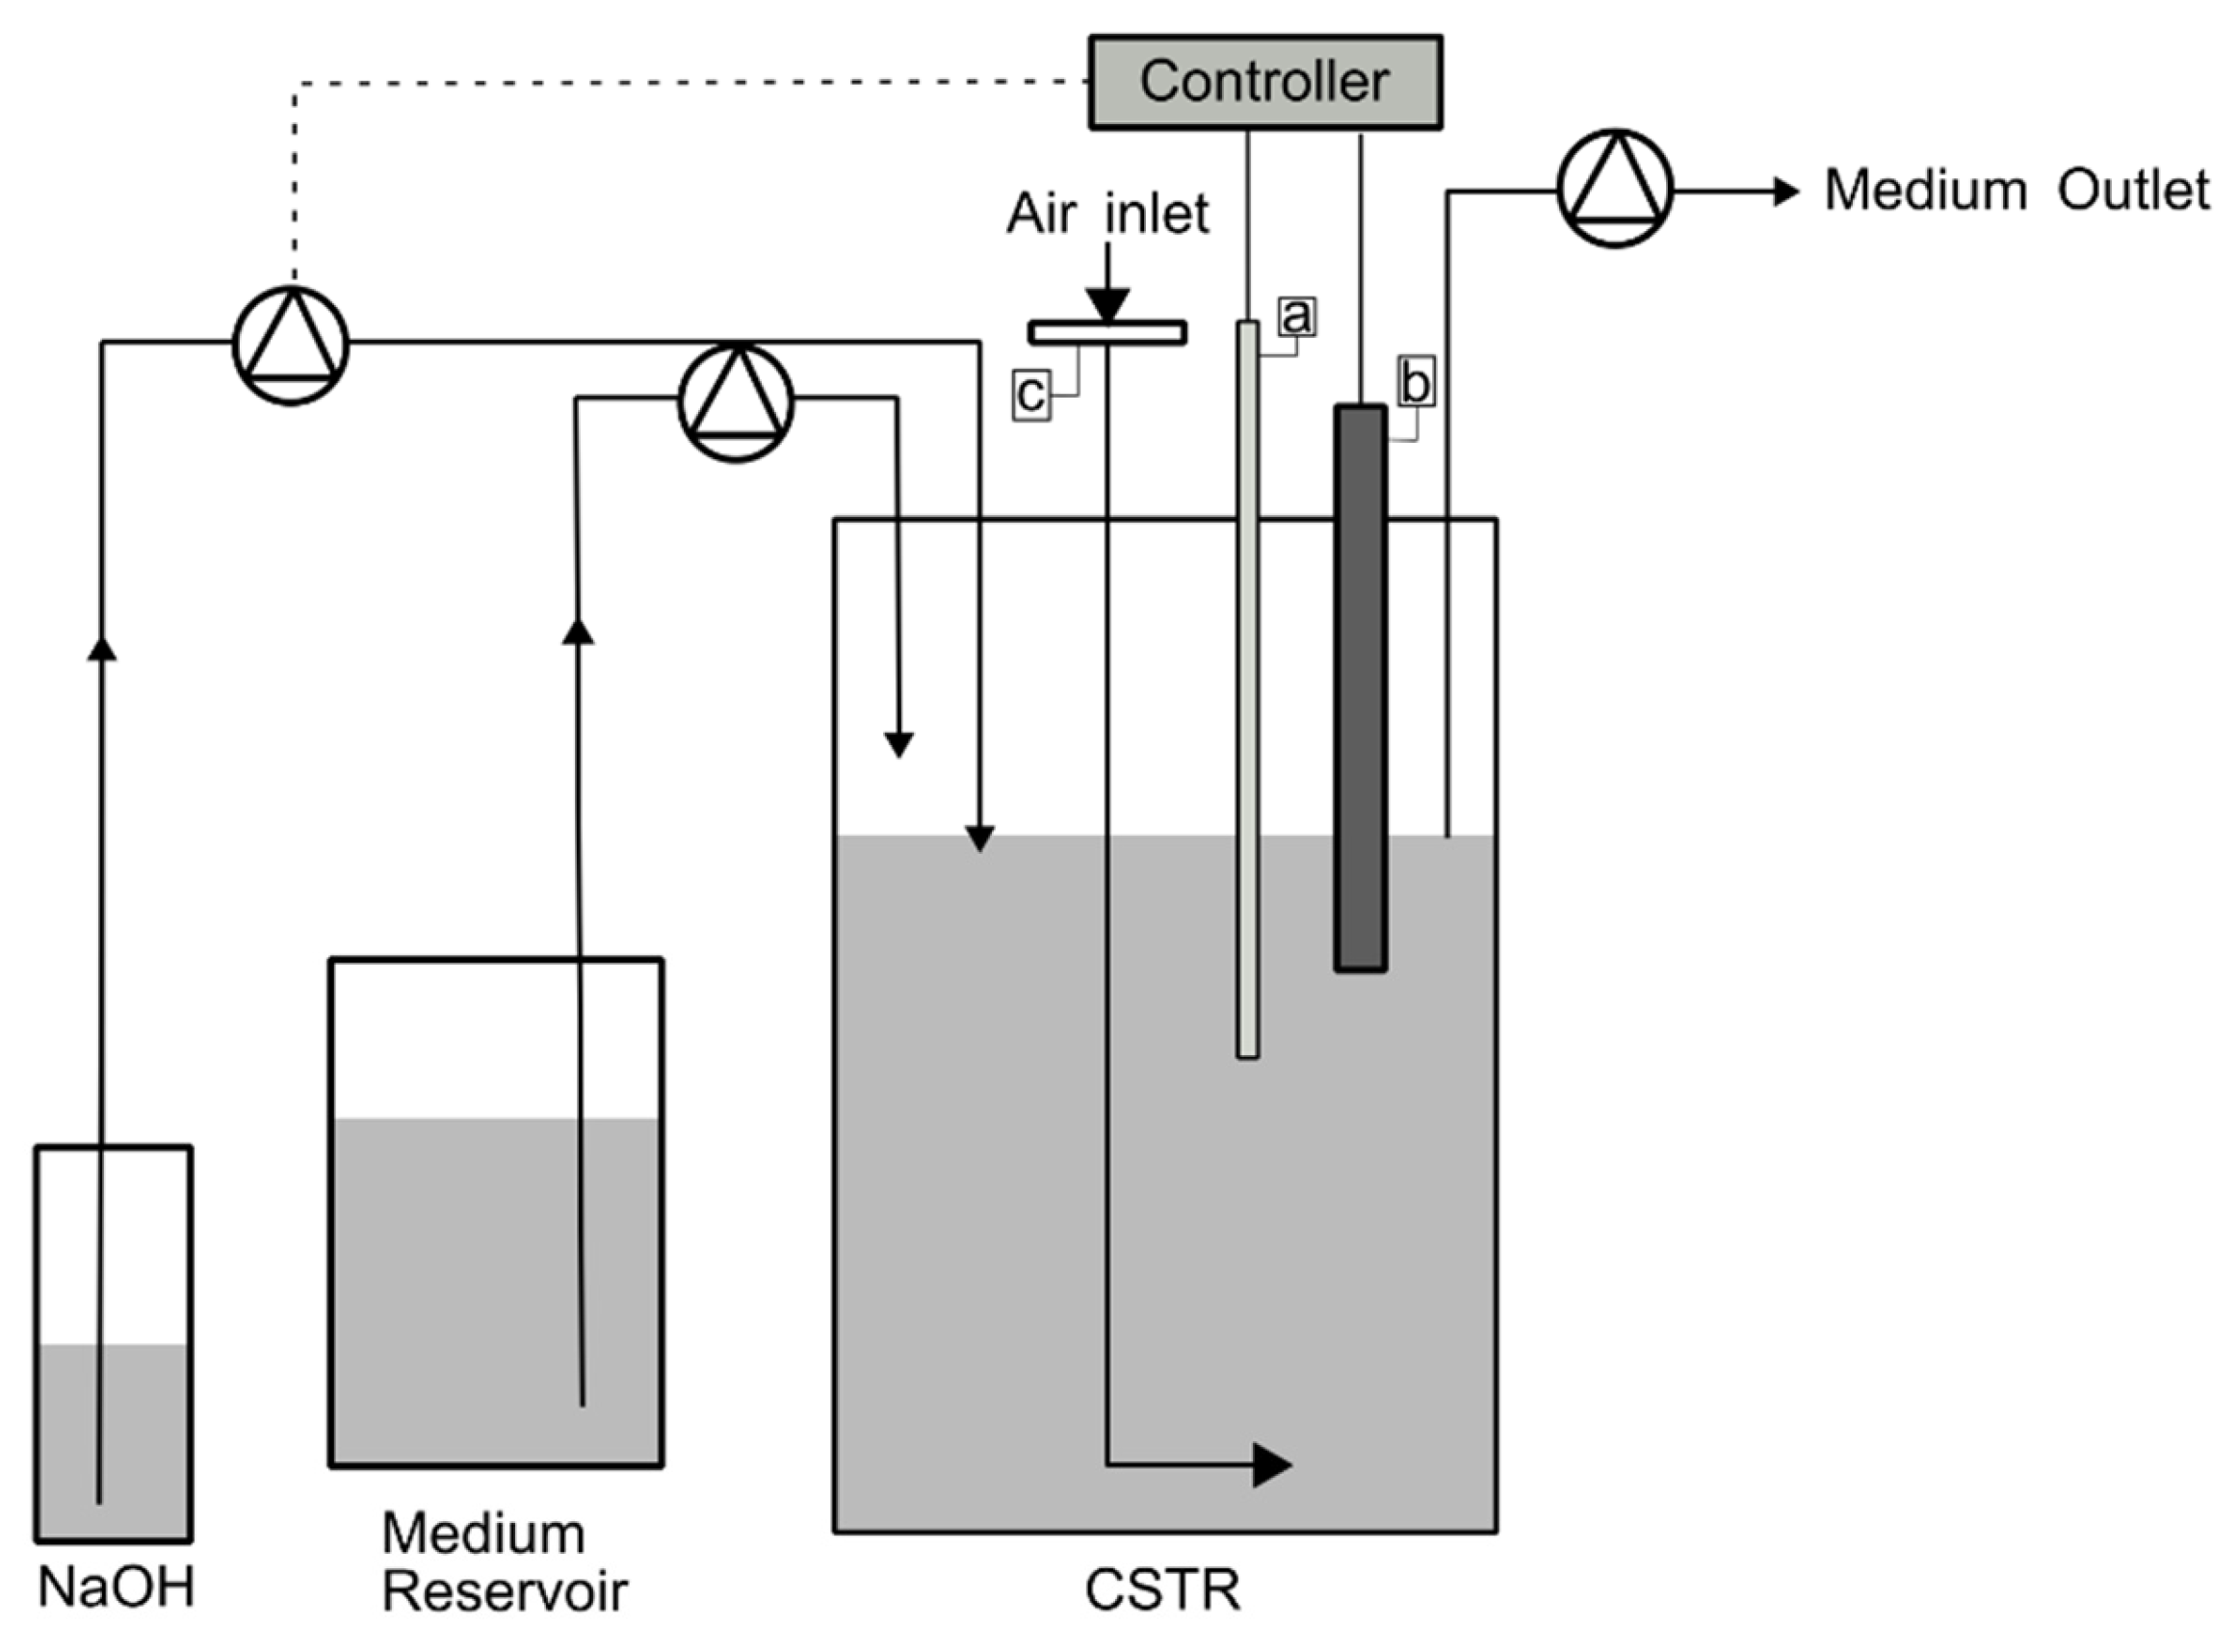
Figure 1. Schematic representation of the continuous stirred tank reactor (CSTR): (a) dissolved oxygen (DO) probe, (b) pH probe, (c) 0.22 µm air filter. The controller was used to maintain pH and pO2 levels.
Fermentation 11 00622 g001
Figure 2. The kinetic profile of cell growth is represented in gL−1 as biomass (●), consumption of the carbon source is glucose (■), formation of the metabolite acetate (○), and in mgL−1 as the production of PRP (□) throughout the batch phase. The points represent the mean values with standard deviations (n = 4).
Fermentation 11 00622 g002
Figure 3. (A) The values of biomass (white bars), glucose (gray bars), and acetate (black bars) in g L−1, while PRP (striped bars) is expressed in mg L−1. (B) The PRP productivity I vcbn mg L−1 h−1 (white bars), conversion coefficients of biomass to product (PRP) (Yp/x) in mg g−1 (gray bars), and substrate to product (Yp/s) in mg g−1 (black bars). Each bar represents the mean value and standard deviation for the respective dilution rate.
Fermentation 11 00622 g003
Figure 4. Fermentation profile of biomass measured as optical density at 540 nm (♦) and in g L−1 (●). Product concentrations, including acetate (○) in g L−1 and PRP (□) in mg L−1, as well as substrate glucose (■) in g L−1, are shown for a dilution rate of 0.23 h−1 and a bioreactor working volume of 800 mL.
Fermentation 11 00622 g004
Table 1. Kinetic parameters for simple batch and continuous cultures, based on Gogola-Kolling et al. [12]. P denotes the PRP concentration (mg L−1), S the glucose concentration (g L−1), X the cellular concentration (g L−1), Ac the acetate concentration (g L−1), and D the dilution rate (h−1).
ParametersSimple BatchContinuous
PRP yield based on glucose consumption (YP/S) (mg g−1) Y P / S = P f P i S i S f Y P / S = P S a S f
PRP yield based on cell growth (YP/X) (mg g−1) Y P / X = P f P i X f X i Y P / X = P X
Growth yield coefficient based on glucose consumption (YX/S) (g g−1) Y X / S = X f X i S i S f Y X / S = X S a S f
Acetate yield based on cell growth (YAc/X) (g g−1) Y A c / X = A c f A c i X f X i Y A c / X = A c X
Acetate yield based on glucose consumption (YAc/S) (g g−1) Y A c / S = A c f A c i S i S f Y A c / S = A c S a S f
Volumetric Productivity ** (Qp) (mg L−1 h−1) Q p = P f P i t f t i Q p = P × D
Specific Productivity ** (Rp) (mg g−1 h−1) R p = P f P i ( t f t i ) × X R p = P X × D
* i subscript indicates the initial concentration value, f subscript indicates the final concentration value, and a subscript indicates the concentration value from the feed. Values without subscripts represent the mean concentration at a steady state. ** For acetate productivity, values in g were considered and reported in units g g−1 h−1.
Table 2. Parameter data for dilution rate of 0.23 h−1: average concentration of free PRP (PRPfree), cellular PRP (Pc), total PRP (Pt), percentage of free PRP (%PRPfree), molecular mass of PRP (MMPRP), glucose, acetate, and biomass.
Continuous Cultivation
BioreactorOutput
Dilution rate (h−1)0.23
Flow rate (L h−1)0.184
PRPfree (mg L−1)688 ± 53680 ± 28
Pc (mg L−1)ND *193 ± 18
Pt (mg L−1)ND873 ± 47
% PRPfreeND77.9 ± 2.0
MMPRP (kD)ND134 ± 32
Glucose (g L−1)0.85 ± 0.170.81 ± 0.15
Acetate (g L−1)4.02 ± 0.123.80 ± 0.21
Biomass (g L−1)6.03 ± 0.33ND *
* ND: not determined. The values represent the mean with standard deviation, with observations recorded throughout the sampling period during the entire cultivation (n = 9).
Table 3. A comparison of the concentrations of PRP, glucose, acetate, biomass, and the following conversion coefficients: glucose to PRP (Yp/s), glucose to acetate (Ya/s), glucose to biomass (Yx/s), biomass to PRP (Yp/x), and biomass to acetate (Ya/x), as well as Volumetric productivity (Qp) and specific productivity (Rp) in batch at the ninth hour and continuous cultures at a steady state.
Kinetic ParametersBatchContinuous Culture
PRP (mg L−1)202 ± 17688 ± 53
Glucose (g L−1)0.11 ± 0.080.85 ± 0.17
Acetate (g L−1)2.28 ± 0.294.02 ± 0.12
Biomass (g L−1)3.53 ± 0.236.03 ± 0.33
Yp/s (mg g−1)46.8 ± 3.377.7 ± 3.2
Yac/s (g g−1)0.63 ± 0.020.44 ± 0.01
Yp/x (mg g−1)57.3 ± 3.0119.0 ± 7.5
Yx/s (g g−1)0.82 ± 0.050.65 ± 0.02
Yac/x (g g−1)0.65 ± 0.050.67 ± 0.03
QpPRP (mg L−1 h−1)22.4 ± 1.9164.6 ± 8.9
RpPRP (mg g−1 h−1)6.37 ± 0.3327.4 ± 1.7
Qpacetate (g L−1 h−1)0.25 ± 0.030.93 ± 0.02
Rpacetate (g g−1 h−1)0.072 ± 0.0050.153 ± 0.006
The values represent the mean with standard deviation, with observations recorded throughout the sampling period during the entire cultivation for continuous culture (n = 9), and the mean across assays conducted for batch cultures (n = 4).
Disclaimer/Publisher’s Note: The statements, opinions and data contained in all publications are solely those of the individual author(s) and contributor(s) and not of MDPI and/or the editor(s). MDPI and/or the editor(s) disclaim responsibility for any injury to people or property resulting from any ideas, methods, instructions or products referred to in the content.