Article

Correlations Between Flavor Profile and Microbial Community Succession in Probiotic-Fermented Burdock Root

1
College of Food and Biology Engineering, Xuzhou University of Technology, Xuzhou 221018, China
2
State Key Laboratory of Discovery and Utilization of Functional Components in Traditional Chinese Medicine, Guizhou Medical University, Guiyang 550014, China
3
Natural Products Research Center of Guizhou Province, Guiyang 550014, China
*
Authors to whom correspondence should be addressed.
These authors contributed equally to this work.
Fermentation 2025, 11(11), 604; https://doi.org/10.3390/fermentation11110604
Submission received: 26 September 2025 / Revised: 18 October 2025 / Accepted: 19 October 2025 / Published: 22 October 2025
(This article belongs to the Special Issue Perspectives on Microbiota of Fermented Foods, 2nd Edition)

Abstract

Fresh burdock (Arctium lappa L.) roots were fermented with probiotic lactic acid bacteria, including Lactobacillus paracasei (L. paracasei), Lactobacillus plantarum (L. plantarum), and Lactobacillus casei (L.casei). The dynamic changes in volatile flavor compounds (VFCs) and microbial community succession were compared during fermentation. Subsequently, correlations between bacteria and characteristic VFCs were analyzed, and potential functions were predicted. The results show that the types of VFCs increased from 25 to 54, and the total content increased from 7.852 ± 1.025 to 48.325 ± 0.624 mg/kg after fermentation for 7 days. Notably, esters and alcohols increased significantly. A total of 42 VFCs were identified as contributors to the overall flavor profile of the fermented burdock root. Among these, ethyl caproate, acetaldehyde, isoamyl acetate, hexaldehyde, phenylacetaldehyde, linalool, and 3-methylbutanol were regarded as the primary characteristic VFCs. Microbial composition analysis revealed three dominant phyla, two dominant genera, and three dominant species. Among them, L. paracasei and L. plantarum were the dominant species during fermentation. L. paracasei was positively correlated with multiple characteristic VFCs and was considered the core functional species in terms of flavor formation. Notably, L. paracasei exhibited a very strong correlation with acetaldehyde (ρ = 0.99). PICRUST2 function prediction further revealed that carbohydrate metabolism and amino acid metabolism were the core pathways of microbial metabolism and important sources of flavor precursors. This study demonstrates that lactic acid bacteria fermentation could markedly improve the flavor quality of burdock roots. Moreover, the formation of VFCs was closely correlated with complex microbial metabolism during fermentation.

1. Introduction

Burdock (Arctium lappa L.), commonly known as “Niubang” in China, is a biennial herbaceous plant of the Compositae family [1,2]. Burdock root is not only a nutritious vegetable, but also an important traditional Chinese medicine, often referred to as “Eastern ginseng” [1]. It is rich in carbohydrates, protein, amino acids, vitamin C, carotenoids, phenols, flavonoids, and other phenolic compounds [1]. These nutritional and bioactive compounds impart functional properties to burdock root. Previous research has demonstrated that encapsulated extracts of burdock root can enhance the viability of probiotics and augment the antioxidant activity of functional foods [3]. Furthermore, burdock root tea drinks can ameliorate liver inflammation and gut dysbiosis in mice fed a high-fat diet [4].
Currently, investigations into burdock root predominantly emphasize its bioactive compounds and functional properties [5,6]. However, its unpleasant flavor has restricted its development and application in the food industry [2,7]. Lactic acid bacteria are a group of microorganisms widely used in fermented food [8]. As probiotics, lactic acid bacteria confer a range of biological health benefits, including the prevention of lactose intolerance, enhancement of gastrointestinal function, facilitation of digestion, inhibition of bacterial and inflammatory responses, suppression of cholesterol metabolism, reduction in blood lipids and blood pressure, mitigation of aging processes, and regulation of the immune system [9,10,11]. Importantly, lactic acid bacteria are also effective in modifying and enhancing the flavor profiles of fermented food. For example, mixed lactic acid bacteria cultures can augment the aromatic qualities of fermented fruit juices by reducing undesirable flavors and amplifying favorable ones [12]. Therefore, probiotic lactic acid fermentation not only enhances the flavor quality, but also offers various health benefits.
Flavor is a critical determinant of food quality, and is intricately linked to the complex microbial evolution during fermentation [12]. For example, during the fermentation of Maotai-flavor liquor, the succession of microbial communities profoundly affects the metabolism of acids, alcohols, and esters, which are essential for the formation of its distinctive flavor [13]. The interactions between microbial communities are pivotal in the fermentation process, and the synergistic effects between different microbial species substantially enhance the flavor quality of fermented food [14,15]. Moreover, the diversity and succession of microbial communities also impact flavor formation. Studies have shown that the initial microbial diversity has a positive impact on the final metabolic pathways, which further promotes the formation of VFCs [16]. Advances in high-throughput sequencing have deepened our understanding of the dynamic interactions between microbial communities and flavor compounds during fermentation, offering theoretical support for process optimization [17,18].
Based on the above, we hypothesized that specific lactic acid bacteria are strongly correlated with key VFCs during burdock root fermentation. In this study, fresh burdock roots were fermented using probiotic lactic acid bacteria. The aims were to (1) determine the dynamic changes in VFCs during fermentation, (2) investigate the succession of the microbial community, (3) analyze the correlations between bacterial community and characteristic VFCs, and (4) predict the potential functions of the involved bacteria.

2. Materials and Methods

2.1. Materials and Chemicals

The fresh burdock roots were collected from Fengxian of Xuzhou City, Jiangsu Province, China. The commercial lactic acid bacteria starter, containing L. paracasei, L. plantarum, and L. casei, was purchased from Shangchuan Biotechnology Co., Ltd. (Shunde, China). Internal standard chemicals, including cyclohexanone (CAS 108-94-1) and methyl nonanoate (CAS 1731-84-6) were purchased from Sigma Aldrich Trading Co., Ltd. (Shanghai, China).

2.2. Burdock Roots Fermented Using Lactic Acid Bacteria

According to the results of preliminary process optimization, the fresh burdock roots were fermented using probiotic lactic acid bacteria. Initially, the fresh burdock roots were selected, washed, promptly peeled, and cut into pieces. These root pieces were then mixed with the color-protecting solution at a ratio of 1:1 to control enzymatic browning. The solution consisted of boiled water and citric acid in a mass ratio of 100: 0.1. Subsequently, 15% (w/w) of white sugar was added, followed by pulping. The compound lactic acid bacteria starter was inoculated at 0.1% (w/w) of the total mass. The mixture underwent sealed fermentation at 32 °C. Finally, samples were collected at intervals of 0 (D0), 1 (D1), 3 (D3), 5 (D5) and 7 days (D7), respectively. After fermentation, the pH decreased from 4.51 (D0) to 3.63 (D7), while the acidity increased from 3.07 mg/mL (D0) to 8.49 mg/mL (D7).

2.3. Determination of VFCs

The VFCs of fermented burdock root were determined using headspace solid-phase microextraction (HS-SPME) in conjunction with gas chromatography–mass spectrometry (GC-MS), as described previously [19] with certain modifications. Briefly, the sample (1.00 g) was placed into a 10 mL solid-phase microextraction vial. Subsequently, 2 μL of a mixed standard solution, consisting of cyclohexanone (2.053 mg/mL), and methyl nonanoate (0.788 mg/mL), was added. After being sealed, it was placed in a water bath at 55 °C and stirred with a magnetic stirrer. Subsequently, a manual sampler equipped with a 2 cm-50/30 μm DVB/CAR/PDMS StableFlex fiber head was used to perform headspace extraction for 45 min, followed by a thermal desorption lasting 5 min. The VFCs analysis was conducted using GC-MS (HP6890/5975C; Agilent Ltd., Santa Clara, CA, USA), which was equipped with an HP-5 MS Ultra Inert column (60 m × 0.25 mm × 0.25 μm; Agilent Technologies, Santa Clara, CA, USA). The initial oven temperature was 40 °C (4 min), followed by an increase to 140 °C at a rate of 3 °C/min and subsequently to 260 °C (50 min) at a rate of 10 °C/min. A split ratio of 5:1 was employed. All other operation conditions were maintained as previously described [19].
VFCs were identified by comparing mass spectra and retention indices with the Wiley275/Nist2014 database. VFCs exhibiting high similarity were further validated by cross-referencing with the existing literature. The concentration of each VFC was calculated using internal standard semi-quantitative peak area ratios. Odor activity values (OAVs) were calculated based on the concentrations of VFCs and their respective odor thresholds in water [20,21].

2.4. Determination of Microbial Diversity

The fermented burdock root was collected at different fermentation times, homogenized in sterilized bags, and promptly frozen at −80 °C. Microbial diversity was determined by high-throughput sequencing, as described in the previous research [20]. Briefly, the total microbial genomic DNA was extracted from fermented burdock root using the E.Z.N.A.® soil DNA Kit (Omega Bio-tek, Norcross, GA, USA). The V3–V4 hypervariable region of the bacterial 16S rRNA gene was amplified utilizing primers 338F and 860R. The purified amplicons were pooled in equimolar amounts and paired-end sequenced on an Illumina Nextseq2000 platform (Illumina, San Diego, CA, USA) according to the standard protocols provided by Majorbio Bio-Pharm Technology Co., Ltd. (Shanghai, China). A bioinformatic analysis of the microbial diversity was carried out using the Majorbio Cloud platform “https://cloud.majorbio.com” (accessed on 22 September 2025) [22].

2.5. Bioinformatic Analysis

Correlation analysis: The correlation heatmap between bacteria (top 5) and primary characteristic VFCs was analyzed using R software (version 3.3.1) [23]. The primary characteristic VFCs (OAVs > 1.00 × 10⁴) included ethyl caproate, acetaldehyde, isoamyl acetate, hexaldehyde, phenylacetaldehyde, linalool, and 3-methylbutanol. The correlation was quantified using the Spearmen correlation coefficient (ρ). The value size was visually displayed by the color depth on the heatmap. Redundancy Analysis (RDA) and Canonical Correspondence Analysis (CCA) were performed with the vegan package in R software (version 2.4.3) [24]. First, Detrended Correspondence Analysis (DCA) was performed to assess the data. If the gradient length of the first axis in the DCA exceeded 3.5, Canonical Correspondence Analysis (CCA) was selected; otherwise, Redundancy Analysis (RDA) was used. Using the bioenv function, the maximum correlation coefficient was determined to identify the main environmental influencers. Subsequently, either CCA or RDA was applied to analyze the correlation between the main bacteria and the primary characteristic VFCs (ethyl caproate, acetaldehyde, isoamyl acetate, and hexaldehyde).
Function prediction analysis [25]: The operational taxonomic unit (OUT) abundance table was normalized using PICRUSt2 “http://huttenhower.sph.harvard.edu/galaxy” (accessed on 21 September 2025)). Each OTU was then linked to its corresponding KEGG Ortholog (KO) information based on GreenGenes identifiers. Based on the information in the KEGG database, KO, pathways, and enzyme commission (EC) were identified, and the abundances of the respective functional categories were calculated according to the OTU abundances. For pathway analysis, PICRUSt2 was applied to obtain metabolic pathways at three levels, along with abundance profiles for each level.

2.6. Statistical Analysis

All experiments, including the determination of VFCs and the analysis of microbial communities, were performed in triplicate (n = 3). The data are expressed as mean values. Statistical analysis was performed using Origin 2018 (64Bit) and the Majorbio Cloud platform “https://cloud.majorbio.com“ (accessed on 22 September 2025) [22]. One-way analysis of variance (ANOVA) followed by Duncan’s multiple range test was used to determine significant differences between means. Spearman’s rank correlation coefficient (ρ) was calculated using R software (version 3.3.1) to assess the correlation between bacteria and primary characteristic VFCs.

3. Results

3.1. Dynamic Changes in VFCs During Fermentation

The dynamic changes in VFCs were analyzed using headspace solid-phase microextraction coupled with gas chromatography–mass spectrometry (HS-SPME-GC-MS). As illustrated in Figure 1 and Table S1, a total of 57 VFCs were identified throughout the fermentation process. Esters, comprising 22 distinct compounds, were found to be the predominant VFCs, followed by alcohols (16 compounds). Additionally, seven aldehydes, five acids, and seven other compounds were detected. The highest diversity was observed after 7 days of fermentation (D7), with 54 compounds identified. The total VFC content increased from 7.852 ± 1.025 mg/kg (D0) to 32.072 ± 0.436 mg/kg (D3), increasing by 4-fold. The maximum content (48.324 mg/kg) was reached after 7 days of fermentation (D7), with alcohols being the most abundant, followed by esters. These findings indicate that both the types and contents of VFCs substantially increased throughout the fermentation process of burdock roots.
Esters were the most abundant VFCs. In D7, a total of 22 esters were detected, with a total content of 8.680 ± 0.432 mg/kg. Among them, ethyl acetate (3.028 ± 0.644 mg/kg), hexyl formate (1.984 ± 0.306 mg/kg), and ethyl caproate (1.273 ± 0.207 mg/kg) were the predominant esters. Alcohols constituted the second largest group, comprising 16 distinct types. Notably, the content of alcohols was much higher than that of esters. The total alcohol content substantially increased from 5.020 ± 0.751 mg/kg (D0) to 33.668 ± 0.766 mg/kg (D7), increasing by 6-fold. Ethanol (9.816 ± 0.636 mg/kg) was the most prevalent alcohol, followed by 3-methylbutanol (8.480 ± 0.501 mg/kg). Collectively, these two compounds accounted for 54% of the total alcohols. It is noteworthy that 1-propanol, isobutyl alcohol, 2-methylbutanol, 2,3-butanediol, and 1-hexanol were also detected in appreciable amounts. In contrast, aldehydes and acids were detected in considerably lower amounts. Specifically, seven aldehydes and five acids were identified, with total contents of 2.730 ± 0.146 and 2.941 ± 0.390 mg/kg in D7, respectively. Acetaldehyde was the predominant aldehyde, while lactic acid was the most abundant acid. Furthermore, seven VFCs were classified as “others”, including 2-heptanone, 2-amylfuran, 2-isobutyl-3-methoxypyrazine, 2-undecanone, 2-tridecanone, and tetradecane. This group had the lowest total content among all the categories, amounting to only 0.305 ± 0.04 mg/kg in D7.

3.2. Analysis of Characteristic VFCs

OAVs, which integrate concentration and sensory thresholds, can provide a more objective assessment of flavor profiles. As indicated in Table 1, a total of 42 VFCs with OAVs ≥ 1 were identified, contributing to the overall flavor profiles of fermented burdock root. Among these, ethyl caproate exhibited the highest OAV (1.95 × 10⁶), followed by acetaldehyde (9.01 × 10⁴). In the study, seven VFCs with OAVs > 1.00 × 10⁴ were regarded as the primary characteristic VFCs, including ethyl caproate (1.95 × 10⁶), acetaldehyde (9.01 × 10⁴), isoamyl acetate (6.75 × 10⁴), hexaldehyde (5.10 × 10⁴), phenylacetaldehyde (1.96 × 10⁴), linalool (1.54 × 10⁴), and 3-methylbutanol (1.15 × 10⁴). Consequently, the distinctive flavor of fermented burdock root is attributed to the synergistic interaction of multiple VFCs.

3.3. Alpha Diversity of Bacterial Community

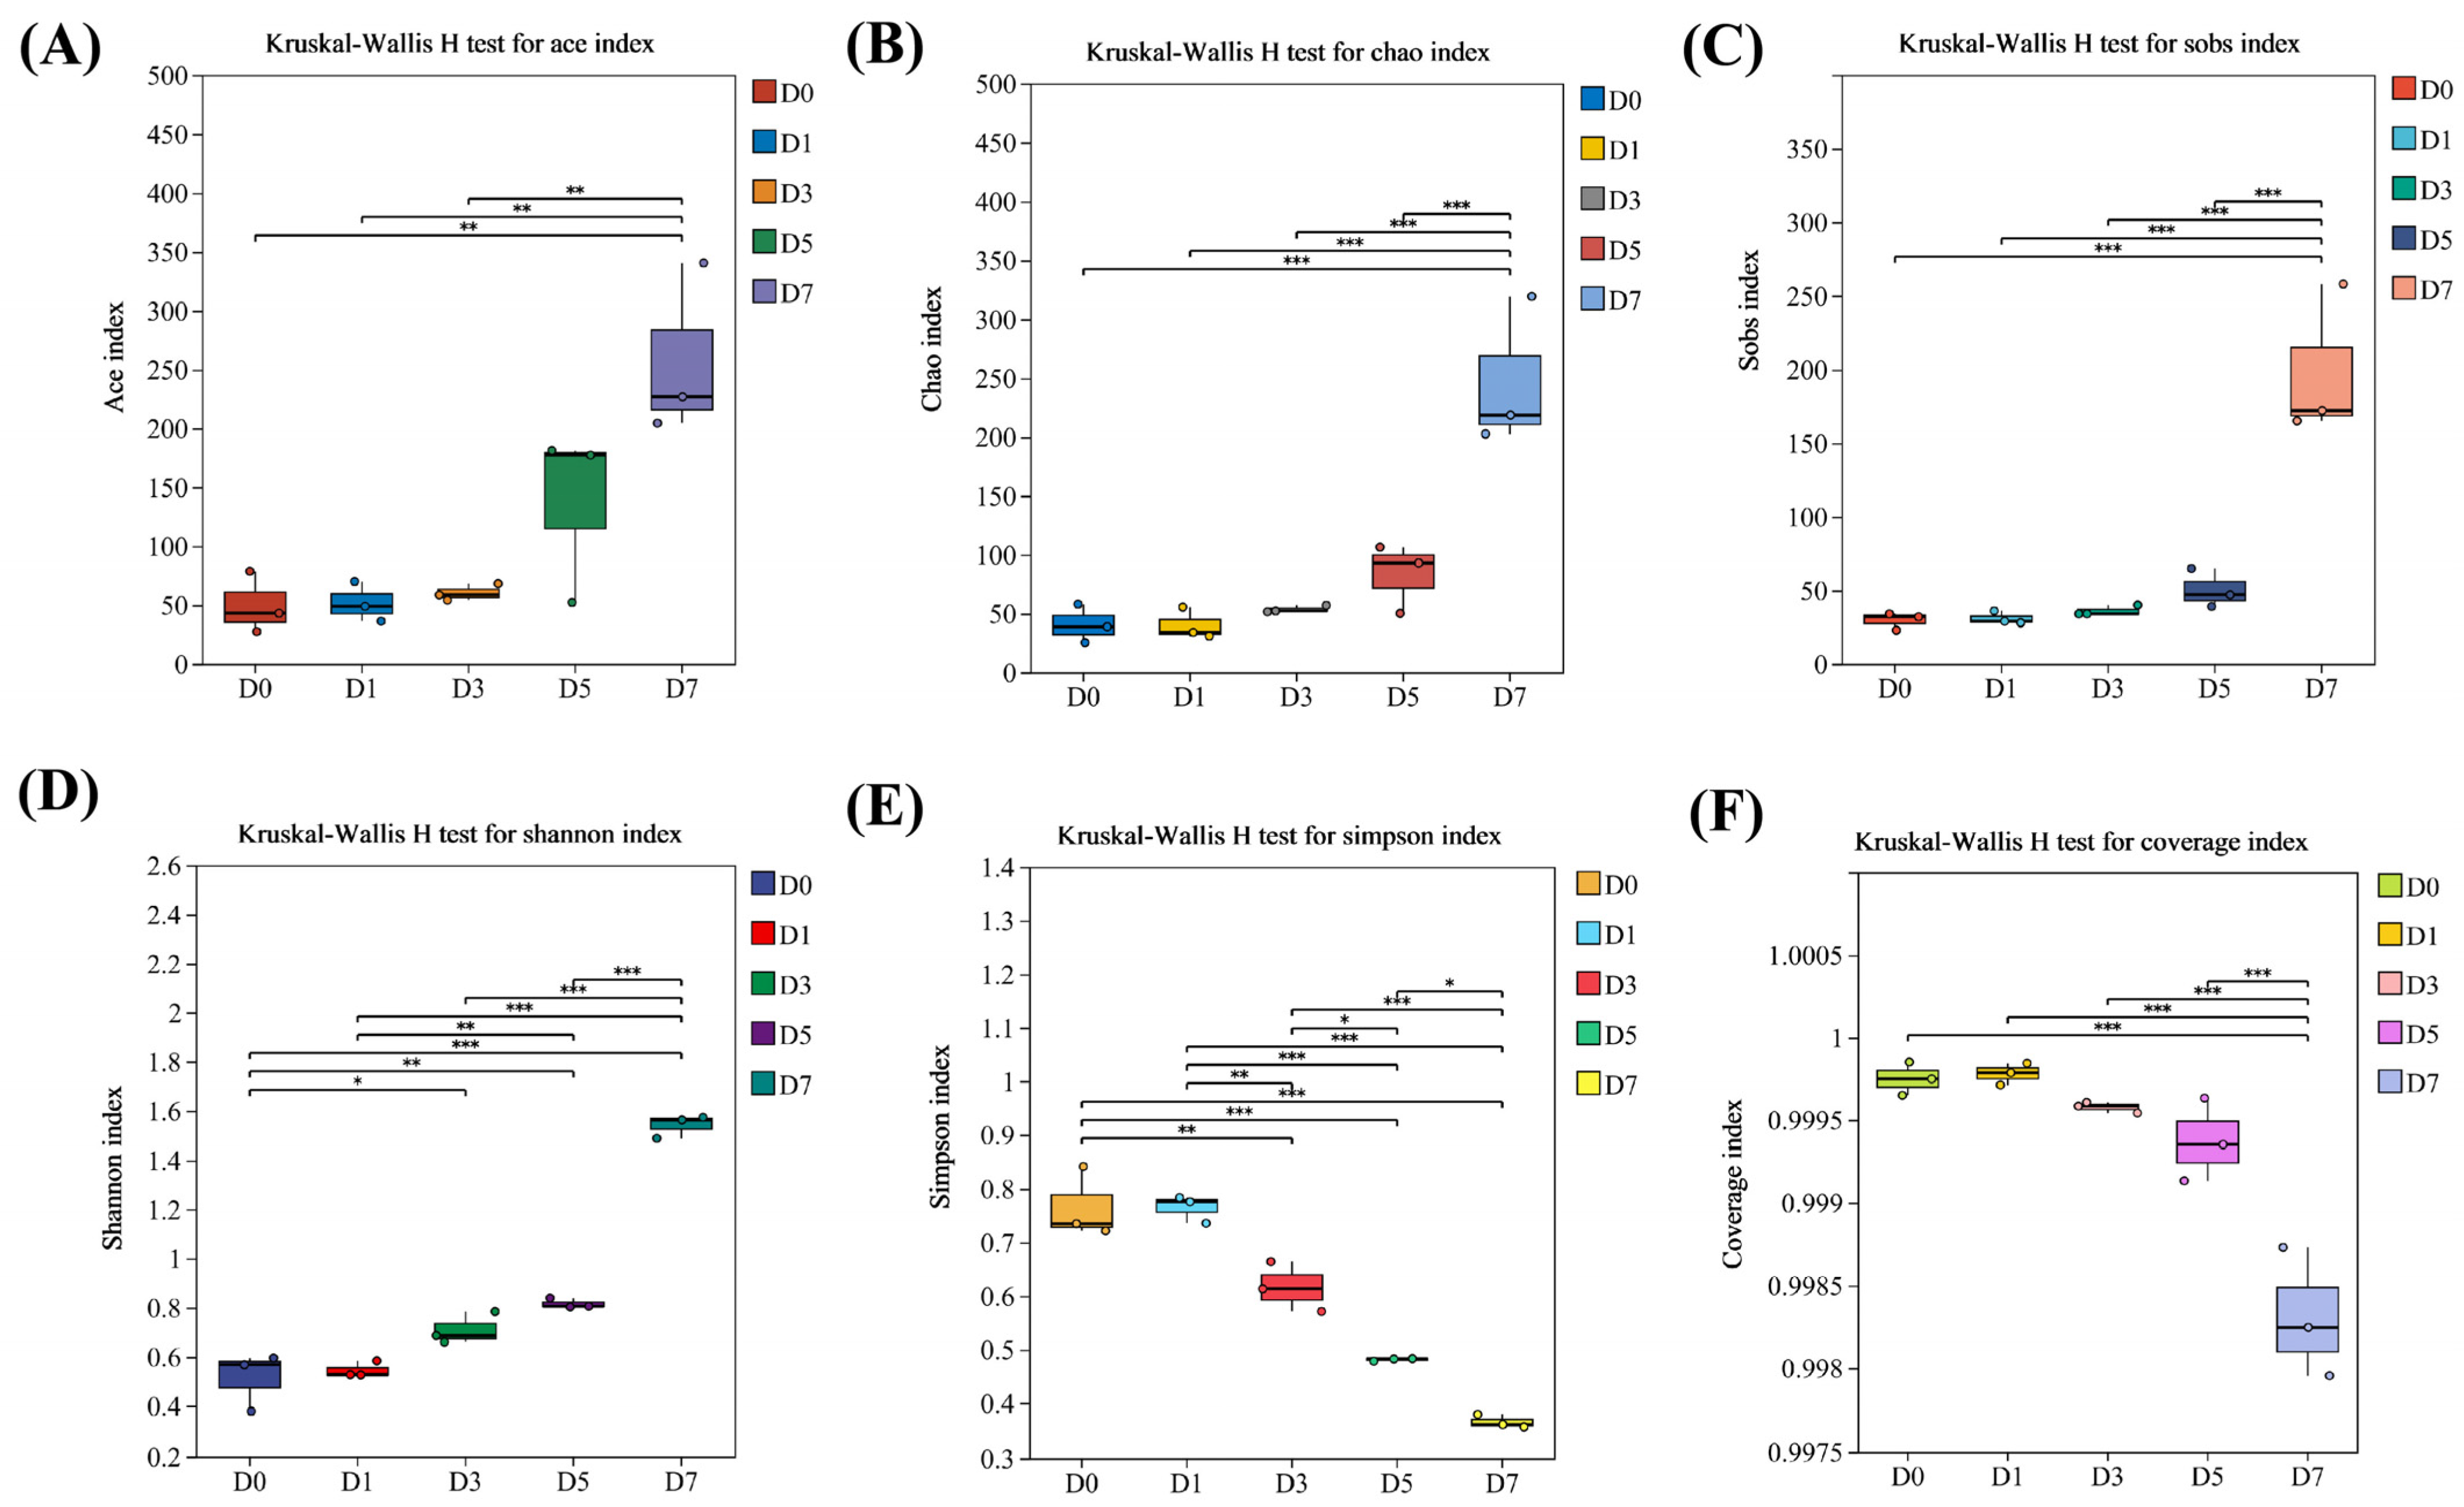
The Illumina MiSeq platform was utilized to investigate the diversity of the bacterial community. Sequencing information on the bacterial community is provided in Table S2. Species richness was estimated using the Ace, Chao, and Sobs indices [26]. As illustrated in Figure 2, all three indices increased throughout the fermentation process. In D7, the indices reached maxima of 299.43, 285.32, and 219.33, respectively. Species diversity was reflected by the Shannon and Simpson indices, where a higher Shannon value and a lower Simpson value indicate greater diversity [27]. The Shannon index increased from 0.52 (D0) to 1.56 (D7), while the Simpson index decreased from 0.77 (D0) to 0.48 (D7). The coverage index reflects the sequencing coverage, indicating the representativeness of the sample and the sequencing depth [28]. The coverage remained at 0.999 throughout the fermentation process, suggesting reliable sequencing data, good sample representativeness, and high credibility of the results.

3.4. Overview of Bacterial Community Composition

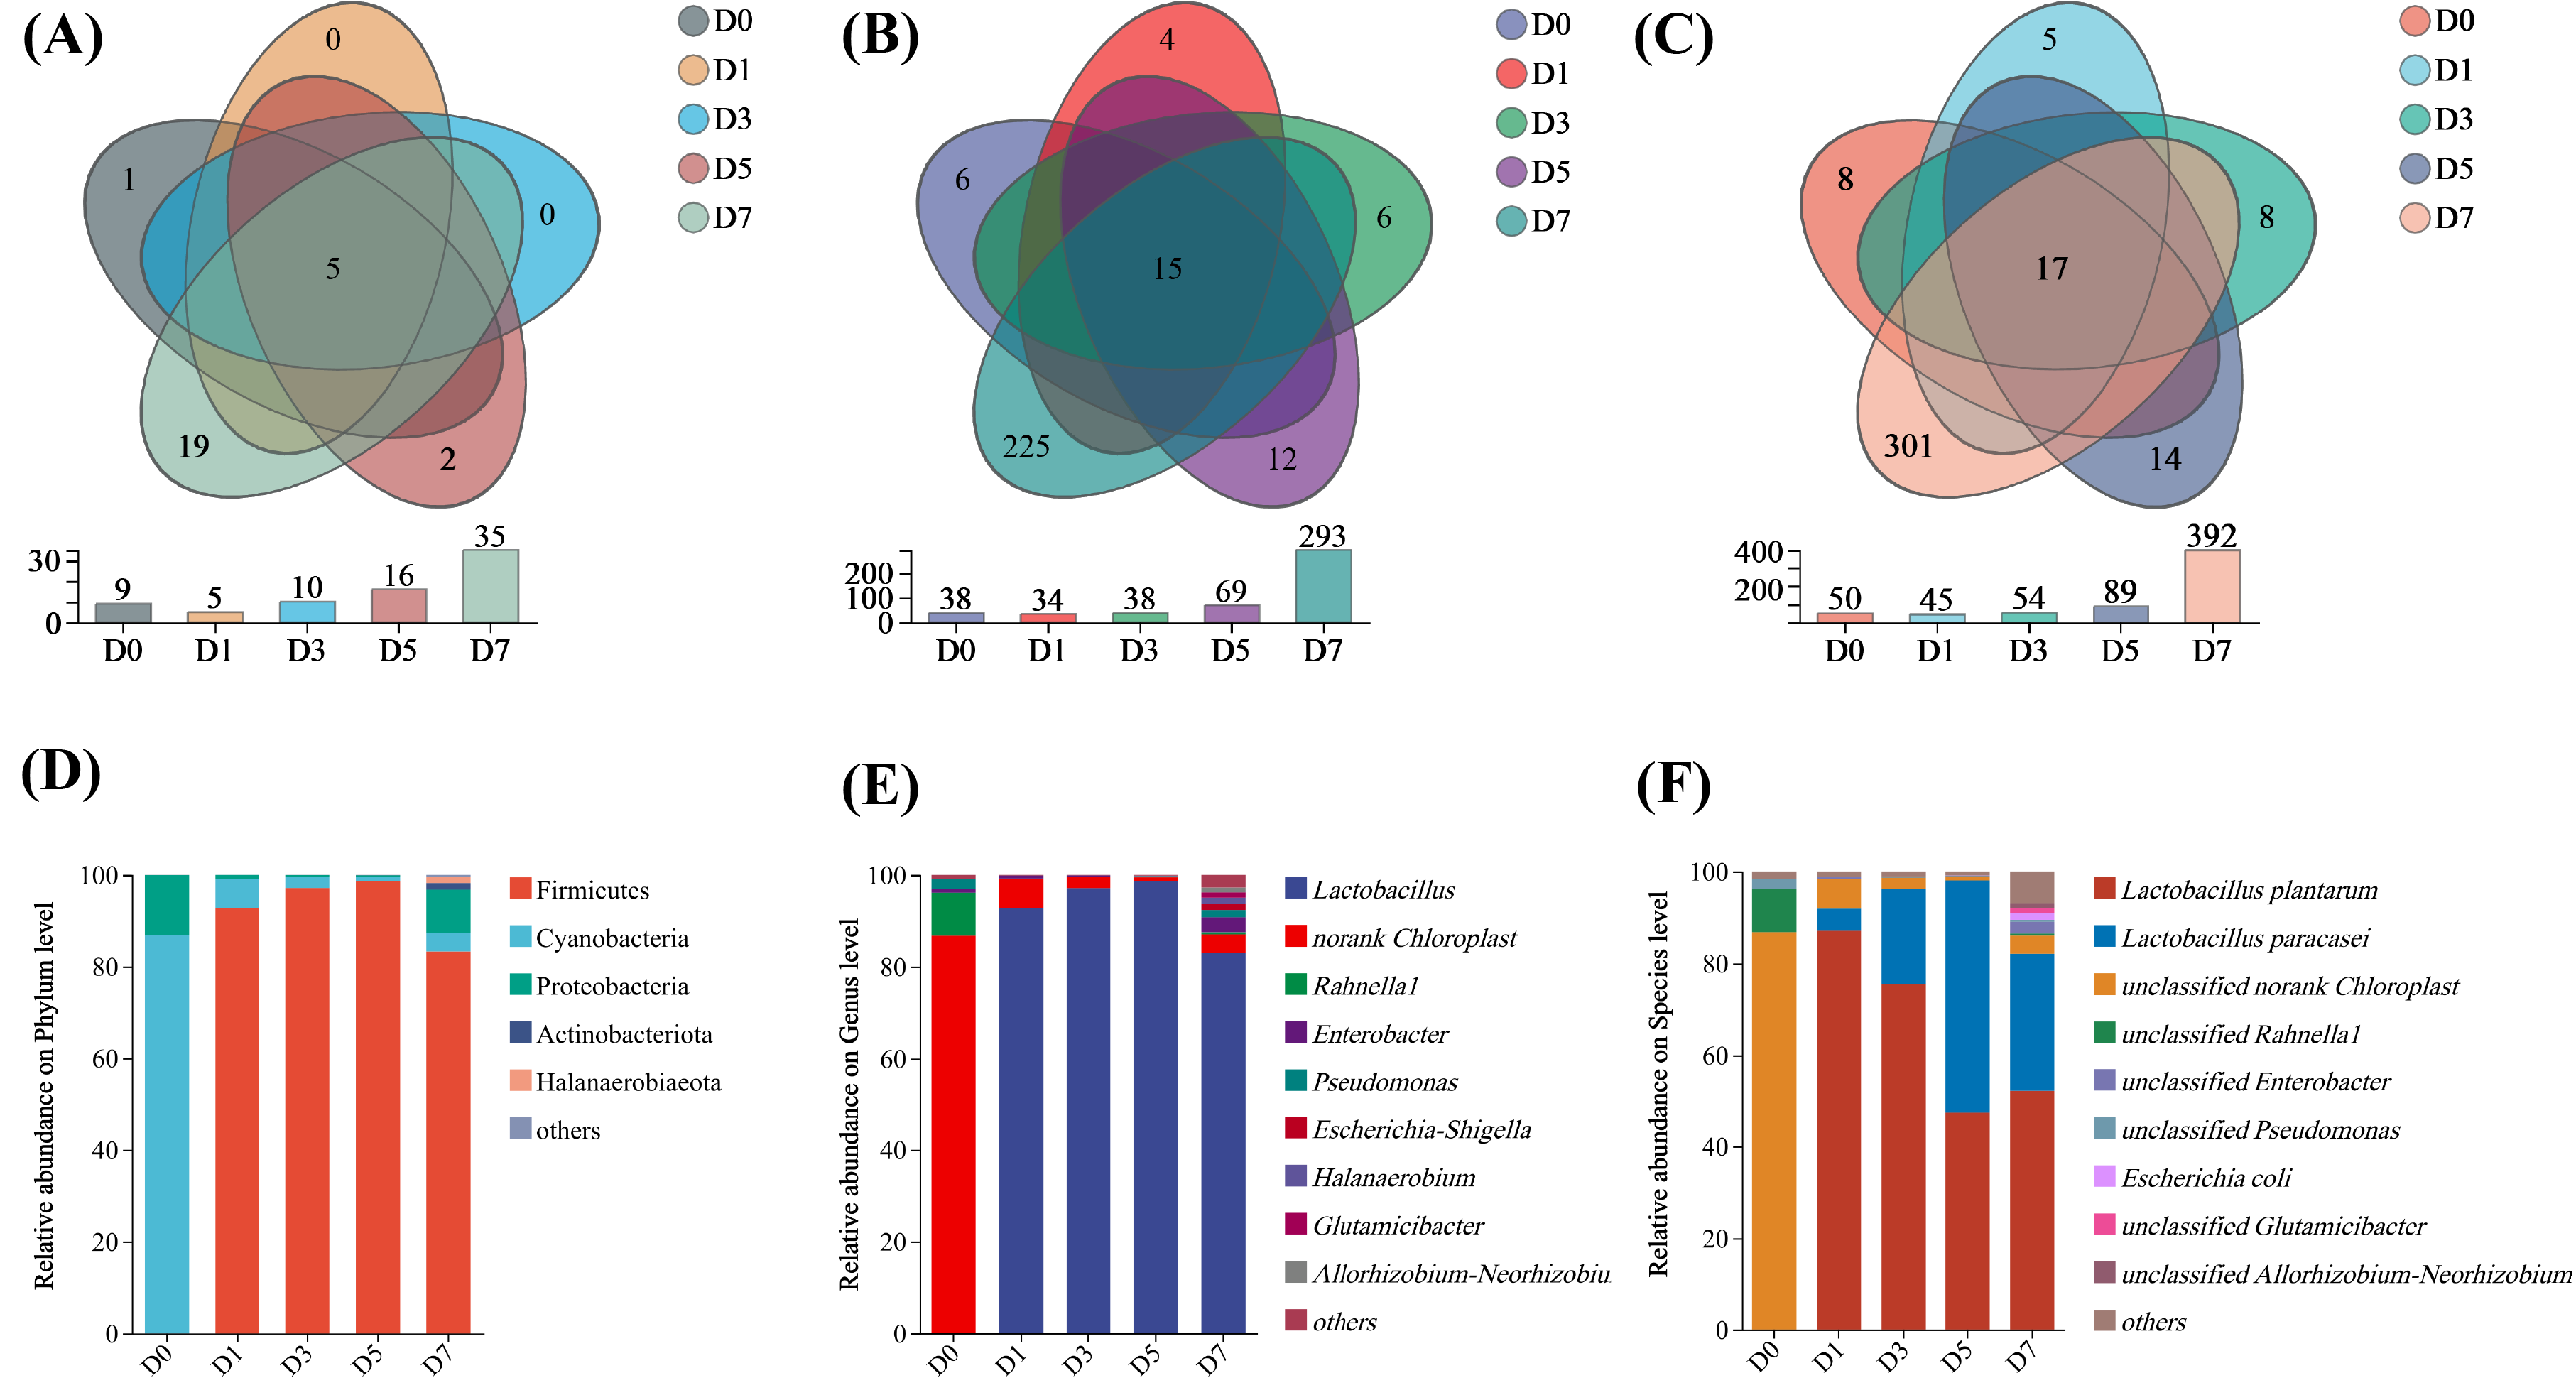
Venn diagrams were utilized to compare shared and unique bacteria [20]. As depicted in Figure 3A–C, the number of bacteria increased throughout the fermentation period. In D7, the number of bacteria was the highest, with 35 (phylum), 293 (genus), and 392 (species), respectively. This trend aligns with the changes in the Ace, Chao, and Sobs indices mentioned above. The number of unique bacteria at the initial fermentation stages (D1) was relatively low, whereas the highest number was found at the end of fermentation (D7). Only 5 phyla, 15 genera, and 17 species were shared throughout the entire burdock root fermentation process.
Elucidating the microbial composition of fermented burdock root is essential for understanding the VFCs formation mechanism involved. In the study, microorganisms with a relative abundance > 10% were defined as dominant bacteria, while those with a relative abundance ≤ 10% were defined as others. Three dominant phyla, two dominant genera, and three dominant species were identified (Figure 3D–F). As illustrated in Figure 3D, Cyanobacteria and Proteobacteria were the dominant bacterial phyla at the initial stage (D0), while Firmicutes was the dominant bacterial phyla throughout the fermentation process (D1–D7). In D0, Cyanobacteria constituted the majority, with 86.78%, followed by Proteobacteria (13.18%). Firmicutes had the highest rate during fermentation, accounting for 92.78% (D1), 97.18% (D3), 98.60% (D5), and 83.31% (D7), respectively. As presented in Figure 3E, two dominant bacterial genera were identified, including Lactobacillus and norank Chloroplast. Lactobacillus was the most prevalent during fermentation, up to 92.71% (D1), 97.15% (D3), 98.57% (D5), and 83.11% (D7), respectively. Norank Chloroplast was the highest in D0 (86.78%), followed by Rahnella1 (9.34%). As presented in Figure 3F, three dominant species were identified, namely L. plantarum, L. paracasei and unclassified norank Chloroplast. L. plantarum was the sole dominant species in D1 (87.07%), resulting from the addition of a lactic acid bacteria starter. As the fermentation process progressed, the relative abundance of L. plantarum gradually decreased, while that of L. paracasei increased correspondingly. In D7, the relative abundances of L. plantarum and L. paracasei were 52.11% and 29.96%, respectively.

3.5. Correlation Analysis Between Bacteria and Characteristic VFCs

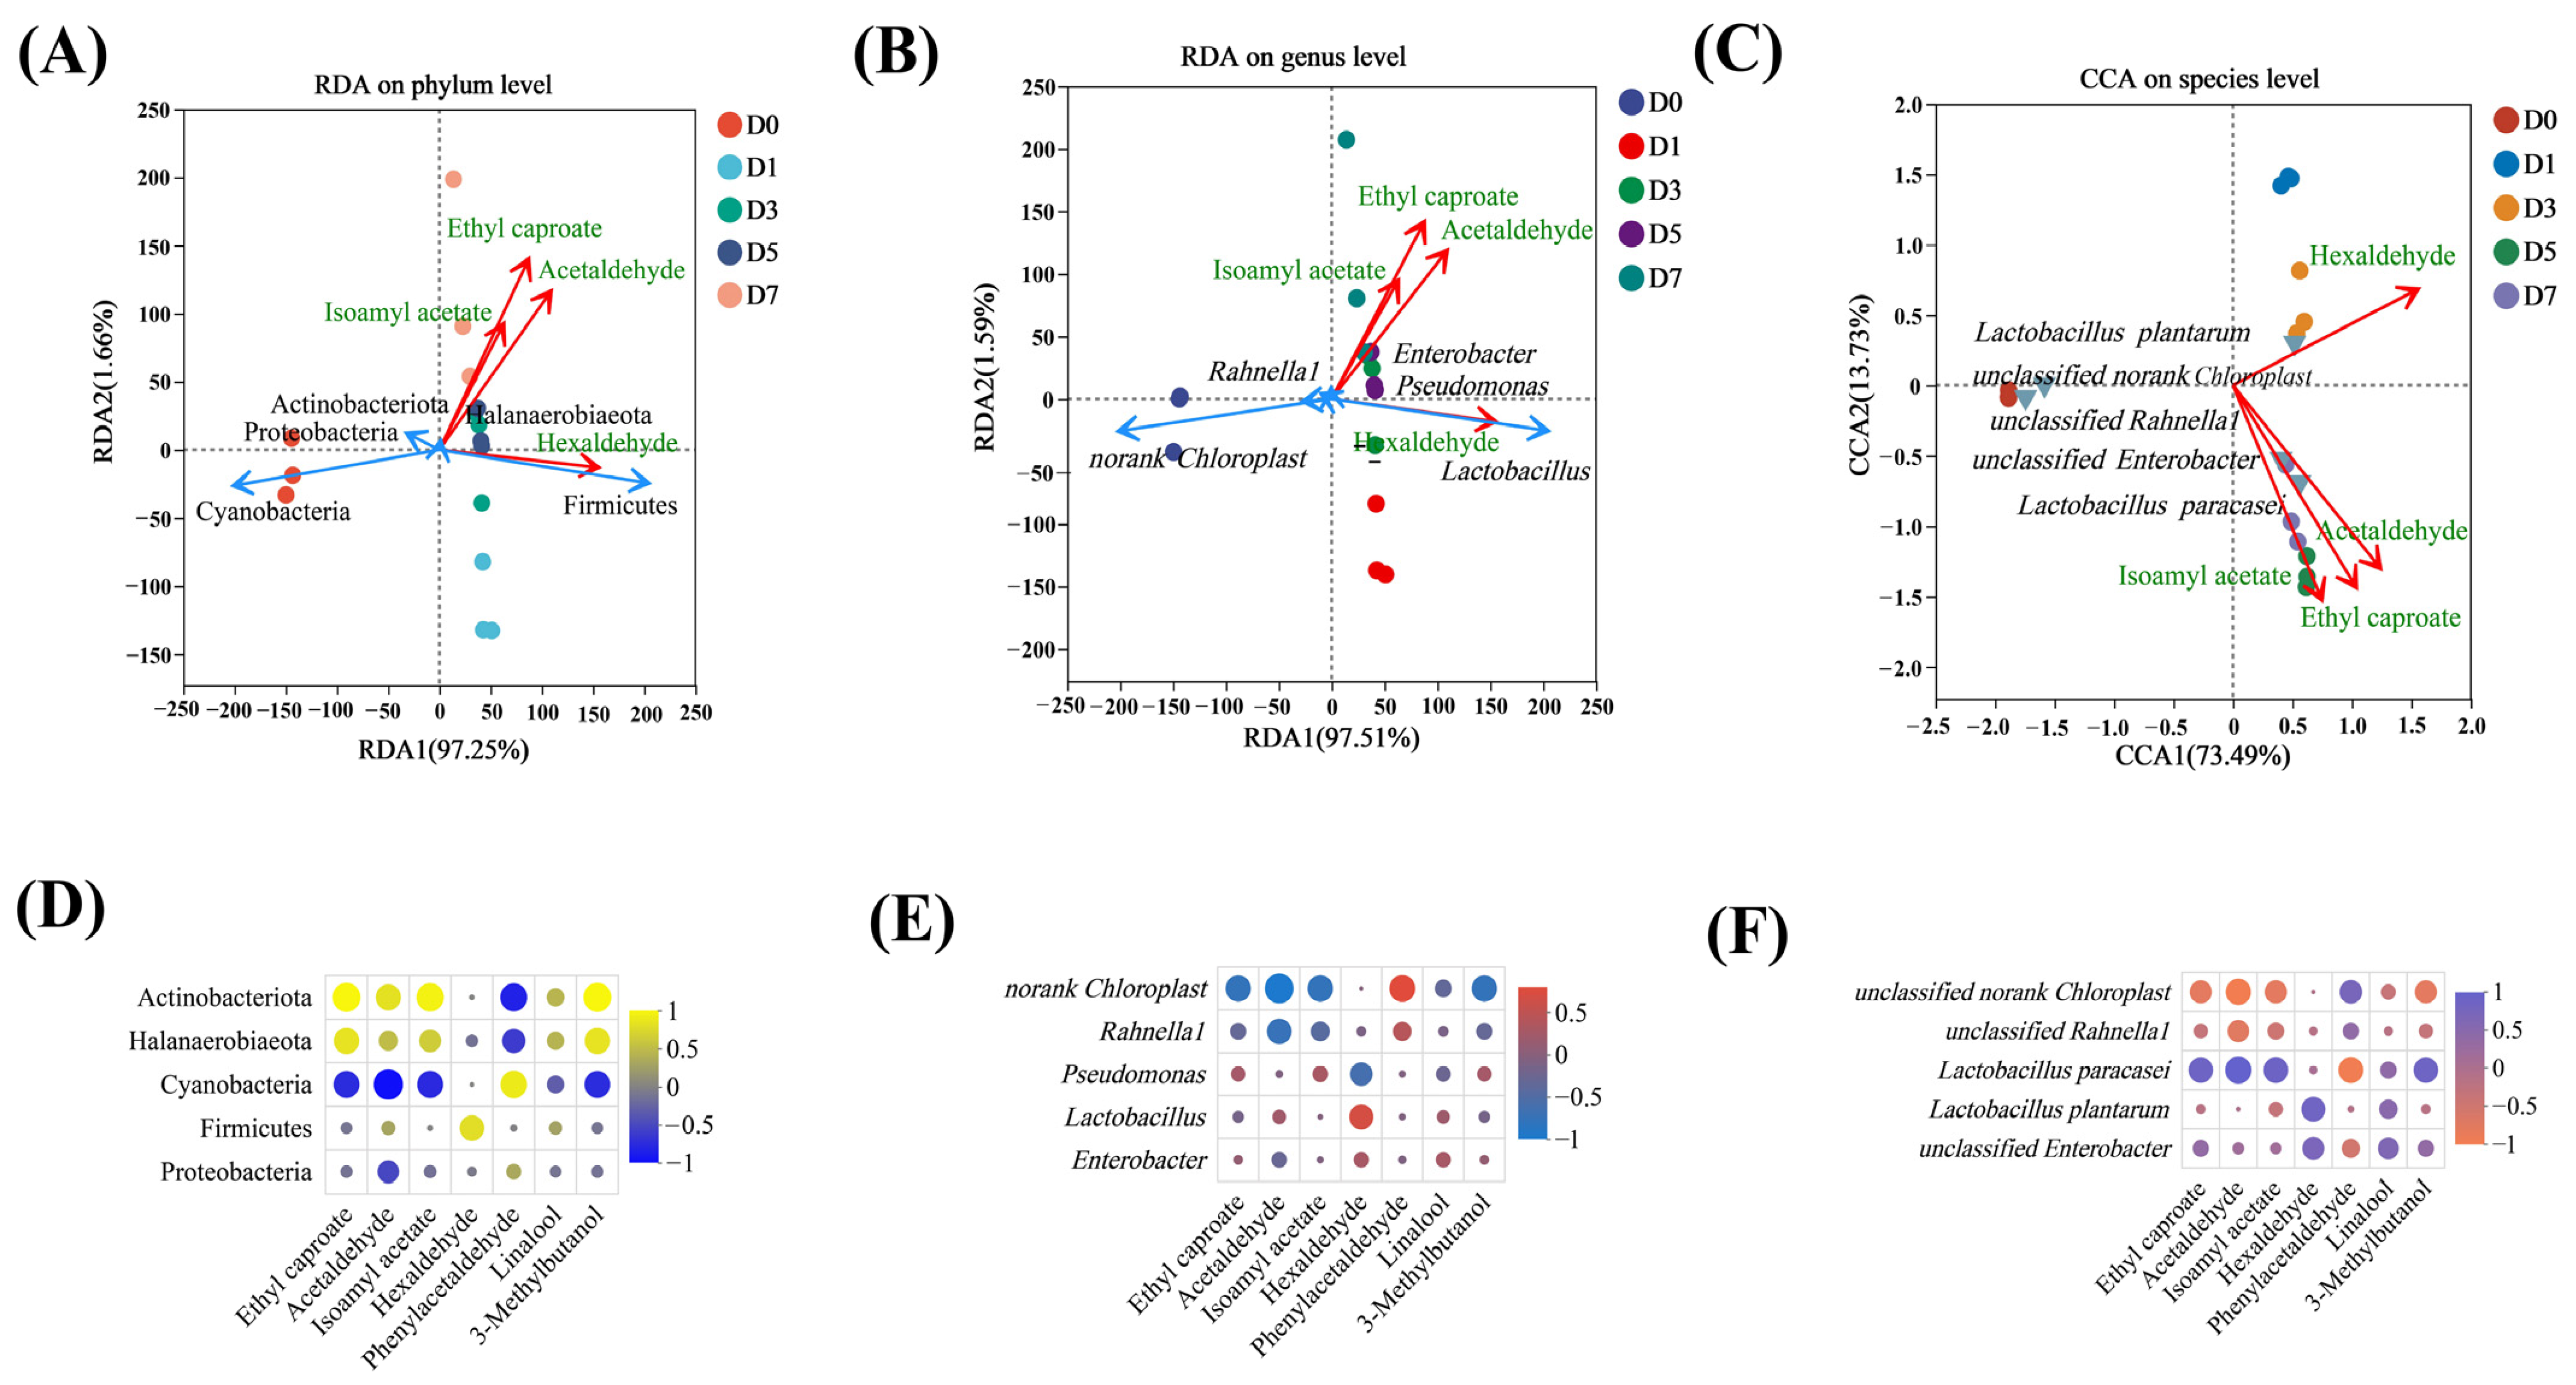
The correlation between bacteria (top 5) and primary characteristic VFCs (OAV > 1.00 × 10⁴) during burdock root fermentation was revealed through RDA and CCA, coupled with a correlation heatmap analysis (Figure 4). RDA is suitable when species exhibit approximately linear responses to environmental variables, whereas CCA is more appropriate for unimodal response models [29]. At the phylum level, RDA1 explained 97.25% of the variance, and RDA2 explained 1.66%. Together, the first two constrained axes accounted for over 98.9% of the bacteria succession, correlated with VFCs (Figure 4A). At the genus level, RDA1 explained 97.51% of the variance and RDA2 explained 1.59%. This was highly consistent with the results at the phylum level, and the first two axes jointly explained over 99% of the variation in community structure (Figure 4B). At the species level, CCA1 explained 73.49% of the variance and CCA2 accounted for 13.73%, together accounting for approximately 87.22% (Figure 4C). This indicates that microbial community succession is closely correlated with the formation of VFCs during burdock root fermentation.
To further elucidate the specific correlation between bacteria and characteristic VFCs, heatmap analysis was performed. At the phylum level, Firmicutes was positively correlated with hexaldehyde and demonstrated weak correlations with other VFCs. Conversely, Proteobacteria was negatively correlated with most VFCs (Figure 4D). At the genus level, Lactobacillus was positively correlated with hexaldehyde, consistent with Firmicutes (Figure 4E). At the species level, L. paracasei exhibited strong correlations with acetaldehyde (ρ = 0.99), isoamyl acetate (ρ = 0.88), ethyl caproate (ρ = 0.86), and 3-methylbutanol (ρ = 0.86). This indicates that L. paracasei is the primary contributor to the formation of characteristic VFCs during burdock root fermentation. In contrast, L. plantarum was positively correlated with hexaldehyde (ρ = 0.82), but negatively correlated with isoamyl acetate (Figure 4F). The results demonstrated significant correlations between characteristic VFCs and bacteria at the phylum, genus, and species levels.

3.6. Function Prediction Analysis

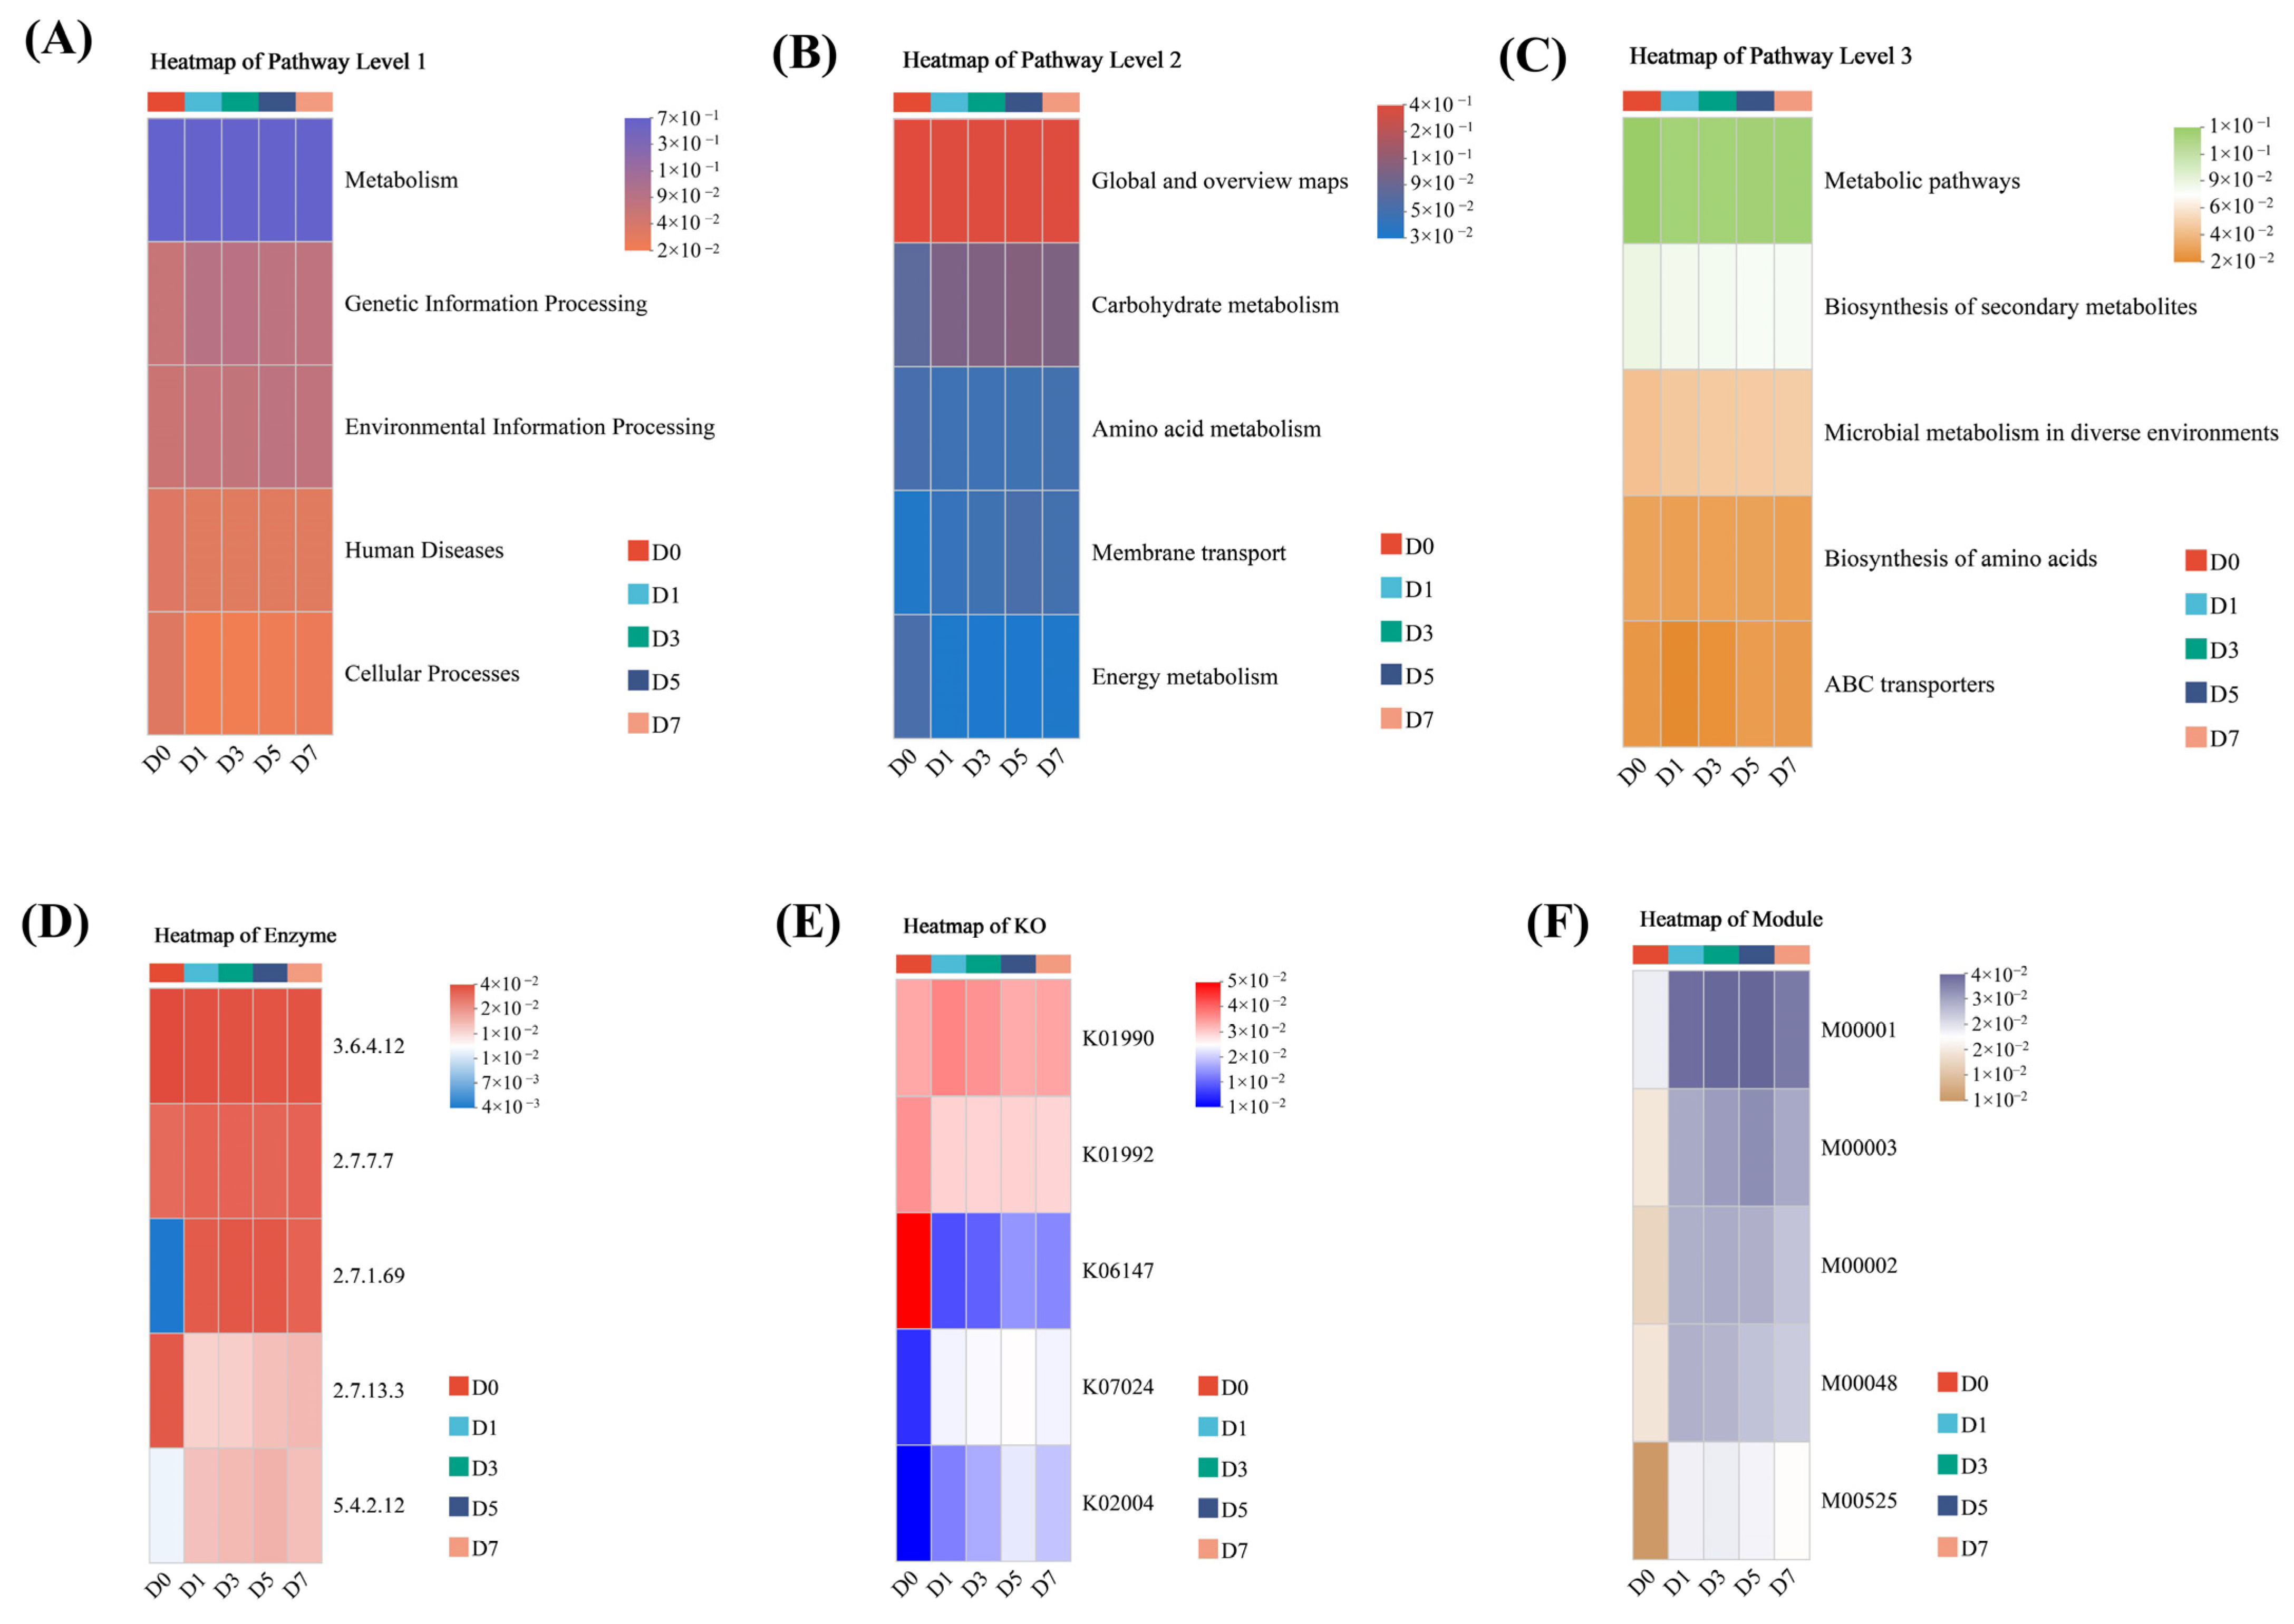
PICRUSt2 was utilized for potential function prediction analysis of the microbial community in fermented burdock root (Figure 5). KEGG function annotation at level 1 revealed that the “metabolism” pathway was the most dominant, followed by “genetic information processing” and “environmental information processing”(Figure 5A). At level 2, “global and overview maps” exhibited the highest abundance, reflecting the integrity and complexity of the metabolic network. “Carbohydrate metabolism” and “amino acid metabolism” ranked second and third, respectively, underscoring the pivotal role of carbon and nitrogen source utilization in community metabolism (Figure 5B). At level 3, the top five metabolic pathways identified were “metabolic pathways”, “biosynthesis of secondary metabolites”, “microbial metabolism in diverse environments”, “biosynthesis of amino acids”, and “ABC transporters” (Figure 5C). These pathways collectively reflect the microbial potential for core energy metabolism, the synthesis of diverse metabolites, and adaptation to environmental changes within the fermentation system. The microbial community also exhibited a high abundance of key enzymes, including EC 3.6.4.12 (DNA helicase), EC 2.7.7.7 (DNA-directed RNA polymerase), EC 2.7.1.69 (protein kinase), EC 2.7.13.3 (histidine kinase), and EC 5.4.2.12 (phosphoglucomutase) (Figure 5D). The high expression levels of these enzymes further corroborate the significant microbial activity involved in maintaining genetic information flow, perceiving environmental signals, and utilizing carbon sources. The KO data were highly consistent with the above metabolic characteristics (Figure 5E). The predominant KO entries, including K01990, K01992, K02004, and K06147, underscore the essential role of material conversion and energy metabolism in defining the functional profile of the microbial community. The metabolic modules showed that the most prevalent modules were M00001 (glycolysis, EMP pathway), M00002 and M00003 (oxidative and non-oxidative of the pentose phosphate pathway), and M00048 (tricarboxylic acid cycle, TCA cycle), emphasizing the central role of carbon metabolism in energy production (Figure 5F).

4. Discussion

Volatile flavor compounds (VFCs) are critical sensory indicators of fermented foods. VFCs formation is closely correlated with complex microbial metabolism during fermentation. In this study, fresh burdock roots were fermented using probiotic lactic acid bacteria. The dynamic changes in VFCs and microbial community were systematically compared throughout the fermentation process. Furthermore, the correlation between bacteria and primary characteristic VFCs was analyzed, and their potential functions were predicted.
Flavor constitutes a multisensory experience, integrating smell, taste, and trigeminal perception [30]. Although VFCs are typically present at trace levels compared with macronutrients, they play a decisive role in the organoleptic properties and consumer acceptability of burdock roots [1]. Fermentation is widely recognized as an effective processing technique for modifying food flavor profiles. In this study, the dynamic changes in VFCs during burdock roots fermentation were systematically investigated. The results revealed that the total content of VFCs increased from 7.852 ± 1.025 mg/kg (D0) to 48.325 ± 0.624 mg/kg (D7). The types also increased from 25 (D0) to 54 (D7). Fermentation significantly enhanced both the diversity and abundance of VFCs in burdock roots. Similar changes have also been reported in other fermented foods, such as sufu [19], soy sauce [31], liquor [32], and fermented fruit juice [33], indicating that fermentation is an effective technological approach for improving flavor quality in food systems [15].
In D7, a total of 22 esters were identified, with a cumulative content of 8.680 ± 0.432 mg/kg. Ethyl acetate, hexyl formate, and ethyl caproate were the predominant esters. Most esters are formed through the esterification of carboxylic acids during fermentation, notably contributing to fruity and floral aromas [34]. Additionally, esters can mask the pungent odors associated with free fatty acids. Sixteen alcohols were detected, with the total content increasing substantially from 5.020 ± 0.751 (D0) to 33.668 ± 0.766 mg/kg (D7). Among these, ethanol and 3-methylbutanol were found to be the most prevalent. Ethanol is primarily produced via glycolysis, while 3-methyl-1-butanol may be generated from leucine through the Ehrlich pathway [34]. These alcohols not only impart wine-like and fruity notes but also exhibit synergistic aroma-enhancing effects [20]. Moreover, alcohols serve as crucial precursors in the synthesis of esters. Aldehydes and acids were present at relatively low contents in D7 (2.730 ± 0.146 and 2.941 ± 0.390 mg/kg, respectively). Aldehydes, as common fermentation intermediates, can be further converted into alcohols or acids; acids contribute sourness and participate in esterification reactions [19]. Other compounds, including ketones, furans, and alkanes, were detected at low levels (0.305 ± 0.049 mg/kg). Nevertheless, certain compounds, such as 2-heptanone and 2-amylfuran, may still significantly influence the overall flavor complexity due to their low odor thresholds [2].
The contents of VFCs may not accurately reflect their contributions to the overall flavor profile. Some VFCs, despite being present at low concentrations, can exert a significant influence on the overall flavor due to their low sensory thresholds [19]. The OAV, which integrates both concentration and threshold, serves as an important indicator for objectively evaluating the flavor contribution [35]. Generally, VFCs with OAVs ≥ 1 are considered to substantially impact the overall flavor profile, with higher OAVs indicating more pronounced contributions [36]. As shown in Table 1, 42 VFCs with OAVs ≥ 1 were identified, demonstrating that the complex flavor of fermented burdock root is primarily driven by the synergistic interaction of multiple VFCs. Among these, seven primary characteristic VFCs (OAVs > 1.00 × 10⁴) formed the core flavor skeleton. Ethyl caproate (1.95 × 10⁶) was the most dominant compound, imparting an intense sweet, fruity, pineapple, and green banana-like aroma. It is also regarded as the most important and indispensable skeleton compound in Baijiu [37]. Acetaldehyde (9.01 × 10⁴) contributes a pungent, slightly fruity sharpness, which can provide an uplifting aroma at low concentrations [38]. Isoamyl acetate (6.75 × 10⁴) exhibits a sweet fruity aroma and acts synergistically with ethyl caproate to make the flavor more attractive [39]. Hexaldehyde (5.10 × 10⁴) contributes a fresh, green, and grassy note, and is likely derived from lipid oxidation in the raw burdock root or microbial metabolism during fermentation [6]. Phenylacetaldehyde is responsible for imparting a sweet, rose, or honey aroma [40]. It is conducive to transforming the flavor into a more sophisticated “composite floral and fruity fragrance”. Linalool (1.54 × 10⁴) is a common terpene alcohol, contributing to a floral, lavender, and citrus odor. It can make the overall flavor profile more rounded and harmonious [41]. Lastly, 3-Methyl-1-butanol (1.15 × 10⁴) typically exhibits a pungent aroma of wine and a spicy flavor [42].
In conclusion, the distinct flavor profile of fermented burdock roots is characterized by a complex system, dominated by fruity notes (ethyl caproate, isoamyl acetate), complemented by green undertones (hexanal), and further enriched by floral aromas (phenylacetaldehyde, linalool) and fermented alcoholic nuances (3-methylbutanol, acetaldehyde). This multi-layered and intense flavor spectrum effectively masks potential off-flavors, such as earthy notes typically present in raw burdock roots. The findings indicate that fermentation is a highly effective method for substantially enhancing the flavor quality of burdock roots.
The fermentation of burdock roots is a complex microbial-driven process, in which the flavor quality is closely correlated with the dynamic evolution of the microbial community. Illumina MiSeq high-throughput sequencing was utilized to investigate the microbial community during the fermentation of burdock roots. Alpha diversity analysis indicated that Ace, Chao, and Sobs increased significantly, suggesting a substantial rise in microbial species richness [26]. The Shannon index gradually increased, while the Simpson index gradually decreased, revealing that the microbial community became more complex in the later stage of fermentation (Figure 2D,E) [27]. Venn diagram analysis demonstrated that the number of bacteria increased as fermentation progressed (Figure 3A–C), consistent with the trends in alpha diversity indices. The number of unique bacteria was relatively low in the early fermentation stage (D1), indicating a comparatively simple and stable community structure at the initial phase. Conversely, the highest number of unique bacteria was observed at the end of fermentation (D7), suggesting that the community gradually became more specialized. This shift may be attributed to the degradation of nutrients, the accumulation of metabolites, and the change in fermentation environment [43]. Only 5 phyla, 15 genera, and 17 species were shared throughout the fermentation process, indicating that these bacteria may be the core functional microbial communities critical for maintaining fermentation stability [44].
VFCs are crucial for the sensory quality of fermented foods, with most originating from complex microbial metabolism. Therefore, investigating the correlation between the microbial community and VFCs is essential for elucidating the microbial-driven mechanism of flavor formation. In this study, the correlation between the bacteria community and VFCs was analyzed through RDA/CCA and heatmap analysis. At the phylum and genus levels, RDA1 and RDA2 collectively accounted for over 98% of the variance, while at the species level, CCA1 and CCA2 together explained more than 87% of the variance. The results indicate that the characteristic VFCs are closely related to changes in the bacterial community [45]. To further explore the correlation between main bacteria and VFCs, a heatmap analysis was conducted. Although both L. paracasei and L. plantarum were the dominant species, they exhibited distinct metabolic properties. L. paracasei was positively correlated with primary characteristic VFCs, including acetaldehyde, isoamyl acetate, and ethyl caproate. These findings suggest that L. paracasei is the pivotal functional strain responsible for the core flavor profile during burdock fermentation. Esters such as ethyl caproate and isoamyl acetate typically impart fruity and sweet notes [34]. This is consistent with the phenomenon observed in apple juice fermentation, in which L. paracasei significantly enhanced the content of fruity esters [46]. In contrast, L. plantarum was positively correlated with hexaldehyde and negatively correlated with isoamyl acetate. These differences reflect variations in metabolic networks between lactic acid bacteria, which fundamentally shape their respective flavor profiles. Previous studies have demonstrated that lactic acid bacteria can increase the concentrations of desirable VFCs such as alcohols, ketones, and terpenes, thereby improving the overall flavor profile of pomegranate juice [47]. Similarly, mixed lactic acid bacteria fermentation has been proven to enrich the aroma of edible mushrooms [13].
PICRUSt2 was employed to predict the potential function of the microbial community during burdock roots’ fermentation (Figure 5). At level 2, “carbohydrate metabolism” and “amino acid metabolism” were identified as pivotal processes in the formation of VFCs (Figure 5B). For instance, carbohydrate metabolism has been proven to generate aldehydes, esters, and alcohols during the natural fermentation of low-salt fish sauce [48]. Similarly, in fermented broad bean paste, amino acid metabolism is considered a key pathway involved in the formation of various VFCs [49]. Furthermore, the metabolism of aromatic amino acids has been demonstrated as a major route for the formation of critical VFCs in stinky tofu brine [50]. As central energy metabolic pathways, glycolysis and the tricarboxylic acid (TCA) cycle may degrade carbohydrates into key intermediate metabolites, such as pyruvate and acetyl-CoA [51]. These intermediates not only provide carbon and energy sources for microbial growth, but also serve as precursors for the synthesis of VFCs, including alcohols, esters, acids, and aldehydes [52]. Through transamination and decarboxylation, amino acids can be converted into important VFCs such as alcohols, aldehydes, and acids [53]. For example, leucine can be transformed into 3-methylbutanol, which imparts a fruity and wine-like aroma [54]. Phenylalanine can be converted into phenylacetaldehyde, contributing a rosy and honey-like aroma [55]. At level 3, the “biosynthesis of secondary metabolites” generally includes the synthesis of esters and terpenoids. Among them, acetyl-CoA and alcohols can be catalyzed by esterases to form ethyl acetate (fruity aroma) and ethyl hexanoate (pineapple aroma), which are major sources of the “ester aroma” in fermented foods [56]. The precursors for linalool (floral aroma) synthesis may originate from the pyruvate metabolic pathway or the pentose phosphate pathway (M00002, M00003). “Genetic information processing” (level 1) and high-abundance enzymes (EC 3.6.4.12 DNA helicase, EC 2.7.7.7 RNA polymerase) indicated that the microorganisms were in a vigorous growth and reproduction period (Figure 5C,D). During this metabolic process, numerous enzymes are synthesized, including various VFCs synthesis-related enzymes. Therefore, the results of the function prediction reveal the potential microbial metabolic mechanism underlying the formation of flavor quality in fermented burdock root. They also prove that microbial metabolism is an important source of the unique flavor profile. Nevertheless, the specific functions, metabolic pathways, and enzymes involved require further experimental validation in a future study.
In summary, lactic acid bacteria fermentation can significantly improve the flavor quality of burdock roots. VFCs formation was closely associated with the complex microbial metabolism within the fermentation system. These findings not only provide a theoretical basis for optimizing the probiotic lactic acid bacteria fermentation of burdock roots, but also enhance our understanding of the microbial-driven flavor formation mechanism in fermented plant-based foods. After fermentation, the enhanced fruity, floral, and fermented notes can effectively mask the inherent earthy off-flavors of raw burdock root. Furthermore, the presence of probiotic lactic acid bacteria not only improves sensory attributes but also adds potential health benefits, including improved gut health and enhanced bioavailability of bioactive compounds. Fermented burdock root could be developed into novel functional foods such as probiotic beverages, fermented vegetable snacks, or natural flavor enhancers for soups, sauces, and ready-to-eat meals. Therefore, this study also provides a scientific basis for the industrial application of fermented burdock root as a natural, health-promoting food ingredient with superior flavor characteristics.

Supplementary Materials

The following supporting information can be downloaded at: https://www.mdpi.com/article/10.3390/fermentation11110604/s1, Table S1: Dynamic changes in the types and contents of VFCs during burdock roots’ fermentation.

Author Contributions

Conceptualization, C.X., H.Y. and J.H.; methodology, C.X. and Y.W.; formal analysis, C.X., H.Y. and S.S.; investigation, C.X., H.Y., S.S., M.X., W.S. and N.Y.; resources, C.X.; writing—original draft preparation, C.X. and H.Y.; writing—review and editing, C.X., H.Y., J.H. and Y.W.; funding acquisition, C.X., J.H. and Y.W. All authors have read and agreed to the published version of the manuscript.

Funding

This work was supported by the Science and Technology Projects of Guizhou Province (QKHJC-ZK [2024]YB639; QKHCG [2024]YB087), and North Jiangsu Science and Technology Project (XZ-SZ202051). This work was also funded by Xuzhou Jingbei Food Co., Ltd. through the project of “Analysis of Garlic Resource Utilization and Development of Key Technologies for Garlic-related Products” and the Subject Direction Team Project of “Food Biotechnology and Functional Food Development”.

Institutional Review Board Statement

Not applicable.

Informed Consent Statement

Not applicable.

Data Availability Statement

The original contributions presented in this study are included in the article, and further inquiries can be directed to the corresponding author.

Conflicts of Interest

The authors declare no conflicts of interest.

References

  1. Xia, J.; Guo, Z.; Fang, S.; Gu, J.; Liang, X. Effect of drying methods on volatile compounds of burdock (Arctium lappa L.) root tea as revealed by gas chromatography mass spectrometry-based metabolomics. Foods 2021, 10, 868. [Google Scholar] [CrossRef]
  2. Zhang, X.; Herrera-Balandrano, D.D.; Huang, W.; Chai, Z.; Beta, T.; Wang, J.; Feng, J.; Li, Y. Comparison of nutritional and nutraceutical properties of burdock roots cultivated in Fengxian and Peixian of China. Foods 2021, 10, 2095. [Google Scholar] [CrossRef] [PubMed]
  3. Esmaeili, F.; Hashemiravan, M.; Eshaghi, M.R.; Gandomi, H. Encapsulation of Arctium lappa L. root extracts by spray-drying and freeze-drying using maltodextrin and Gum Arabic as coating agents and it’s application in synbiotic orange-carrot juice. J. Food Meas. Charact. 2022, 16, 2908–2921. [Google Scholar] [CrossRef]
  4. Azuma, S.; Sato, M.; Nakamura, A.; Takahashi, H.; Inoue, J.; Takayanagi, S.; Nakamura, M.; Kuda, T. Effects of roasted burdock root tea drink on plasma liver injury indices and faecal microbiota in mice fed a high-fat diet. 3 Biotech 2025, 15, 265. [Google Scholar] [CrossRef] [PubMed]
  5. Ferracane, R.; Graziani, G.; Gallo, M.; Fogliano, V.; Ritieni, A. Metabolic profile of the bioactive compounds of burdock (Arctium lappa) seeds, roots and leaves. J. Pharmaceut. Biomed. 2010, 51, 399–404. [Google Scholar] [CrossRef]
  6. Liu, J.; Cai, Y.Z.; Wong, R.N.; Lee, C.K.; Tang, S.C.; Sze, S.C.; Tong, Y.; Zhang, Y. Comparative analysis of caffeoylquinic acids and lignans in roots and seeds among various burdock (Arctium lappa.) genotypes with high antioxidant activity. J. Agric. Food Chem. 2012, 60, 4067–4075. [Google Scholar] [CrossRef]
  7. Cui, L.; Zhao, X.; Zhang, D.; Liu, Y.; Guo, Y.; Feng, J.; Huang, W.; Li, Y. Isolation and identification of lactic acid bacteria and their effects on the off-odor of burdocks. J. Agric. Food Chem. 2023, 71, 7485–7494. [Google Scholar] [CrossRef]
  8. Melkonian, C.; Gottstein, W.; Blasche, S.; Kim, Y.; Abel-Kistrup, M.; Swiegers, H.; Saerens, S.; Edwards, N.; Patil, K.R.; Teusink, B.; et al. Finding functional differences between species in a microbial community: Case studies in wine fermentation and kefir culture. Front. Microbiol. 2019, 10, 1347. [Google Scholar] [CrossRef]
  9. Zang, R.; Zhou, R.; Li, Y.; Wu, H.; Lu, L.; Xu, H. The probiotic Lactobacillus plantarum alleviates colitis by modulating gut microflora to activate PPARgamma and inhibit MAPKs/NF-kappaB. Eur. J. Nutr. 2024, 64, 32. [Google Scholar] [CrossRef]
  10. Sbehat, M.; Mauriello, G.; Altamimi, M. Microencapsulation of probiotics for food functionalization: An update on literature reviews. Microorganisms 2022, 10, 1948. [Google Scholar] [CrossRef]
  11. Hossain, T.J. Functional genomics of the lactic acid bacterium Limosilactobacillus fermentum LAB-1: Metabolic, probiotic and biotechnological perspectives. Heliyon 2022, 8, e11412. [Google Scholar] [CrossRef] [PubMed]
  12. Sun, H.; Du, J.; Yan, X.; Chen, X.; Zhao, L. Dynamic changes in aromas and precursors of edible fungi juice: Mixed lactic acid bacteria fermentation enhances flavor characteristics. J. Sci. Food Agric. 2024, 104, 8541–8552. [Google Scholar] [CrossRef] [PubMed]
  13. Huang, Z.; Zeng, B.; Deng, J.; Ren, Z.; Xie, J.; Wei, C. Succession of microbial community structure in fermented grains during the fermentation of strong-flavor Baijiu and its impact on the metabolism of acids, alcohols, and esters. Food Sci. Biotechnol. 2024, 33, 3501–3513. [Google Scholar] [CrossRef] [PubMed]
  14. Qiu, F.; Li, W.; Chen, X.; Du, B.; Li, X.; Sun, B. Targeted microbial collaboration to enhance key flavor metabolites by inoculating Clostridium tyrobutyricum and Saccharomyces cerevisiae in the strong-flavor Baijiu simulated fermentation system. Food Res. Int. 2024, 190, 114647. [Google Scholar] [CrossRef]
  15. Xu, Y.; Wu, M.; Zhao, D.; Zheng, J.; Dai, M.; Li, X.; Li, W.; Zhang, C.; Sun, B. Simulated fermentation of strong-flavor baijiu through functional microbial combination to realize the stable synthesis of important flavor chemicals. Foods 2023, 12, 644. [Google Scholar] [CrossRef]
  16. Ji, X.; Yu, X.; Wu, Q.; Xu, Y. Initial fungal diversity impacts flavor compounds formation in the spontaneous fermentation of Chinese liquor. Food Res. Int. 2022, 155, 110995. [Google Scholar] [CrossRef]
  17. Wen, L.; Yang, L.; Chen, C.; Li, J.; Fu, J.; Liu, G.; Kan, Q.; Ho, C.T.; Huang, Q.; Lan, Y.; et al. Applications of multi-omics techniques to unravel the fermentation process and the flavor formation mechanism in fermented foods. Crit. Rev. Food Sci. 2024, 64, 8367–8383. [Google Scholar] [CrossRef]
  18. Liu, W.; Tang, Y.; Zhang, J.; Bai, J.; Zhu, Y.; Zhu, L.; Zhao, Y.; Daglia, M.; Xiao, X.; He, Y. Microbial interactions in food fermentation: Interactions, analysis strategies, and quality enhancement. Foods 2025, 14, 2515. [Google Scholar] [CrossRef]
  19. Xie, C.; Qin, L.; Liu, N.; Wen, A.; Zeng, H.; Miao, S. Flavor formation by amino acid catabolism in low-salt sufu paste, a Chinese fermented soybean food. Food Biosci. 2024, 59, 104228. [Google Scholar] [CrossRef]
  20. Xie, C.; Zhou, K.; Ren, J.; Tang, Y.; Yuan, H.; Liu, E.; Wang, Y. Characteristic flavor compounds and bacterial community of different gray sufu, a traditional Chinese fermented soybean curd. Int. J. Food Prop. 2024, 27, 462–477. [Google Scholar] [CrossRef]
  21. Gemert, L.J.V. Compilations of Odour Threshold Values in Air, Water and Other Media (Second Enlarged and Revised Edition); Oliemans, Punter & Partners BV: Zeist, The Netherlands, 2018. [Google Scholar]
  22. Han, C.; Shi, C.; Liu, L.; Han, J.; Yang, Q.; Wang, Y.; Li, X.; Fu, W.; Gao, H.; Huang, H.; et al. Majorbio Cloud 2024: Update single-cell and multiomics workflows. iMeta 2024, 3, e217. [Google Scholar] [CrossRef] [PubMed]
  23. Tanja, O.; Tomislav, P.I. Relationship between milk microbiota, bacterial load, macronutrients, and human cells during lactation. Front. Microbiol. 2016, 7, 492. [Google Scholar] [PubMed]
  24. Huhe; Chen, X.; Hou, F.; Wu, Y.; Cheng, Y. Bacterial and fungal community structures in loess plateau grasslands with different grazing intensities. Front. Microbiol. 2017, 8, 606. [Google Scholar]
  25. Chai, X.; Wang, J.; Li, H.; Gao, C.; Li, S.; Wei, C.; Huang, J.; Tian, Y.; Yuan, J.; Lu, J.; et al. Intratumor microbiome features reveal antitumor potentials of intrahepatic cholangiocarcinoma. Gut Microbes 2023, 15, 2156255. [Google Scholar] [CrossRef] [PubMed]
  26. Yao, D.; Xu, L.; Wu, M.; Wang, X.; Zhu, L.; Wang, C. Effects of microbial community succession on flavor compounds and physicochemical properties during CS sufu fermentation. LWT-Food Sci. Technol. 2021, 152, 112313. [Google Scholar] [CrossRef]
  27. Chen, B.; Teh, B.; Sun, C.; Hu, S.; Lu, X.; Boland, W.; Shao, Y. Biodiversity and activity of the gut microbiota across the life history of the insect herbivore spodoptera littoralis. Sci. Rep. 2016, 6, 29505. [Google Scholar] [CrossRef]
  28. Farag, M.A.; Otify, A.M.; El-Sayed, A.M.; Michel, C.G.; Wessjohann, L.A. Sensory metabolite profiling in a date pit based coffee substitute and in response to roasting as analyzed via mass spectrometry based metabolomics. Molecules 2019, 24, 3377. [Google Scholar] [CrossRef]
  29. Legendre, P.; Gallagher, E.D. Ecologically meaningful transformations for ordination of species data. Oecologia 2001, 129, 271–280. [Google Scholar] [CrossRef]
  30. Christensen, C. Flavor and feeding: Executive summary. Physiol. Behav. 2012, 107, 469–470. [Google Scholar] [CrossRef]
  31. Zhao, G.; Liu, C.; Li, S.; Wang, X.; Yao, Y. Exploring the flavor formation mechanism under osmotic conditions during soy sauce fermentation in Aspergillus oryzae by proteomic analysis. Food Funct. 2020, 11, 640–648. [Google Scholar] [CrossRef]
  32. He, G.; Huang, J.; Zhou, R.; Wu, C.; Jin, Y. Effect of fortified daqu on the microbial community and flavor in Chinese strong-flavor liquor brewing process. Front. Microbiol. 2019, 10, 56. [Google Scholar] [CrossRef] [PubMed]
  33. Cui, S.; Zhao, N.; Lu, W.; Zhao, F.; Zheng, S.; Wang, W.; Chen, W. Effect of different Lactobacillus species on volatile and nonvolatile flavor compounds in juices fermentation. Food Sci. Nutr. 2019, 7, 2214–2223. [Google Scholar] [CrossRef] [PubMed]
  34. Campayo, A.; Serrano De La Hoz, K.; García-Martínez, M.M.; Salinas, M.R.; Alonso, G.L. Spraying ozonated water on bobal grapevines: Effect on wine quality. Biomolecules 2020, 10, 213. [Google Scholar] [CrossRef] [PubMed]
  35. Wang, H.; Ouyang, W.; Yu, Y.; Wang, J.; Yuan, H.; Hua, J.; Jiang, Y. Analysis of non-volatile and volatile metabolites reveals the influence of second-drying heat transfer methods on green tea quality. Food Chem. X 2022, 14, 100354. [Google Scholar] [CrossRef]
  36. Giri, A.; Osako, K.; Okamoto, A.; Ohshima, T. Olfactometric characterization of aroma active compounds in fermented fish paste in comparison with fish sauce, fermented soy paste and sauce products. Food Res. Int. 2010, 43, 1027–1040. [Google Scholar] [CrossRef]
  37. Cai, W.; Wang, Y.; Wang, W.; Shu, N.; Hou, Q.; Tang, F.; Shan, C.; Yang, X.; Guo, Z. Insights into the aroma profile of sauce-flavor baijiu by GC-IMS combined with multivariate statistical analysis. J. Anal. Methods Chem. 2022, 2022, 4614330. [Google Scholar] [CrossRef]
  38. Czerny, M.; Christlbauer, M.; Christlbauer, M.; Fischer, A.; Granvogl, M.; Hammer, M.; Hartl, C.; Hernandez, N.M.; Schieberle, P. Re-investigation on odour thresholds of key food aroma compounds and development of an aroma language based on odour qualities of defined aqueous odorant solutions. Eur. Food Res. Technol. 2008, 228, 265–273. [Google Scholar] [CrossRef]
  39. Xu, J.; Deng, X.; Wu, Y.; Zhou, M.; Du, C.; Wang, Q.; Xia, Y.; He, J.; Yuan, W.; Wu, W.; et al. Characteristic changes and potential markers of flavour in raw Pu-erh tea with different ageing cycles analysed by HPLC, HS-SPME-GC-MS, and OAV. Foods 2025, 14, 829. [Google Scholar]
  40. Farcas, A.C.; Socaci, S.A.; Chis, M.S.; Dulf, F.V.; Podea, P.; Tofana, M. Analysis of fatty acids, amino acids and volatile profile of apple by-products by gas chromatography-mass spectrometry. Molecules 2022, 27, 1987. [Google Scholar] [CrossRef]
  41. Sun, L.; Dong, X.; Ren, Y.; Agarwal, M.; Ren, A.; Ding, Z. Profiling real-time aroma from green tea infusion during brewing. Foods 2022, 11, 684. [Google Scholar] [CrossRef]
  42. Jin, X.; Chen, W.; Chen, H.; Chen, W.; Zhong, Q. Combination of Lactobacillus plantarum and Saccharomyces cerevisiae DV10 as starter culture to produce mango slurry: Microbiological, chemical parameters and antioxidant activity. Molecules 2019, 24, 4349. [Google Scholar] [CrossRef] [PubMed]
  43. Li, D.; Wan, Y.; Zhou, X.; Cheng, J.; Zhang, J.; Cheng, J.; Xu, Y. Dynamic changes in physicochemical properties and microbial diversity during the fermentation of mao-tofu. Foods 2025, 14, 775. [Google Scholar] [CrossRef] [PubMed]
  44. Kim, K.S.; Noh, J.; Kim, B.; Koh, H.; Lee, D. Refining microbiome diversity analysis by concatenating and integrating dual 16S rRNA amplicon reads. NPJ Biofilms Microbiomes 2025, 11, 57. [Google Scholar] [CrossRef]
  45. Liu, S.; Chen, Q.; Zou, H.; Yu, Y.; Zhou, Z.; Mao, J.; Zhang, S. A metagenomic analysis of the relationship between microorganisms and flavor development in Shaoxing mechanized huangjiu fermentation mashes. Int. J. Food Microbiol. 2019, 303, 9–18. [Google Scholar] [CrossRef] [PubMed]
  46. Chen, C.; Lu, Y.; Yu, H.; Chen, Z.; Tian, H. Influence of 4 lactic acid bacteria on the flavor profile of fermented apple juice. Food Biosci. 2019, 27, 30–36. [Google Scholar] [CrossRef]
  47. Di Cagno, R.; Filannino, P.; Gobbetti, M. Lactic acid fermentation drives the optimal volatile flavor-aroma profile of pomegranate juice. Int. J. Food Microbiol. 2017, 248, 56–62. [Google Scholar] [CrossRef]
  48. Li, Y.; Li, W.; Li, C.; Li, L.; Yang, D.; Wang, Y.; Chen, S.; Wang, D.; Wu, Y. Novel insight into flavor and quality formation in naturally fermented low-salt fish sauce based on microbial metabolism. Food Res. Int. 2023, 166, 112586. [Google Scholar] [CrossRef]
  49. Xiang, Y.; Zhou, B.; Jiang, C.; Tang, Z.; Liu, P.; Ding, W.; Lin, H.; Tang, J. Revealing the formation mechanisms of key flavors in fermented broad bean paste. Food Res. Int. 2024, 177, 113880. [Google Scholar] [CrossRef]
  50. Tang, H.; Li, P.; Chen, L.; Ma, J.; Guo, H.; Huang, X.; Zhong, R.; Jing, S.; Jiang, L. The formation mechanisms of key flavor substances in stinky tofu brine based on metabolism of aromatic amino acids. Food Chem. 2022, 392, 133253. [Google Scholar] [CrossRef]
  51. Luo, Q.; Ding, N.; Liu, Y.; Zhang, H.; Fang, Y.; Yin, L. Metabolic engineering of microorganisms to produce pyruvate and derived compounds. Molecules 2023, 28, 1418. [Google Scholar] [CrossRef]
  52. Zhang, S.; Wakai, S.; Sasakura, N.; Tsutsumi, H.; Hata, Y.; Ogino, C.; Kondo, A. Pyruvate metabolism redirection for biological production of commodity chemicals in aerobic fungus Aspergillus oryzae. Metab. Eng. 2020, 61, 225–237. [Google Scholar] [CrossRef]
  53. de L Agüero, N.; Frizzo, L.S.; Ouwehand, A.C.; Aleu, G.; Rosmini, M.R. Technological characterisation of probiotic lactic acid bacteria as starter cultures for dry fermented sausages. Foods 2020, 9, 596. [Google Scholar] [CrossRef]
  54. Mardones, W.; Villarroel, C.A.; Krogerus, K.; Tapia, S.M.; Urbina, K.; Oporto, C.I.; O’Donnell, S.; Minebois, R.; Nespolo, R.; Fischer, G.; et al. Molecular profiling of beer wort fermentation diversity across natural Saccharomyces eubayanus isolates. Microb. Biotechnol. 2020, 13, 1012–1025. [Google Scholar] [CrossRef]
  55. Liu, J.; Bai, Y.; Fan, T.P.; Zheng, X.; Cai, Y. Unveiling the multipath biosynthesis mechanism of 2-phenylethanol in proteus mirabilis. J. Agric. Food Chem. 2020, 68, 7684–7690. [Google Scholar] [CrossRef]
  56. Park, S.M. Acetyl xylan esterase of Aspergillus ficcum catalyzed the synthesis of peracetic acid from ethyl acetate and hydrogen peroxide. J. Biosci. Bioeng. 2011, 112, 473–475. [Google Scholar] [CrossRef]
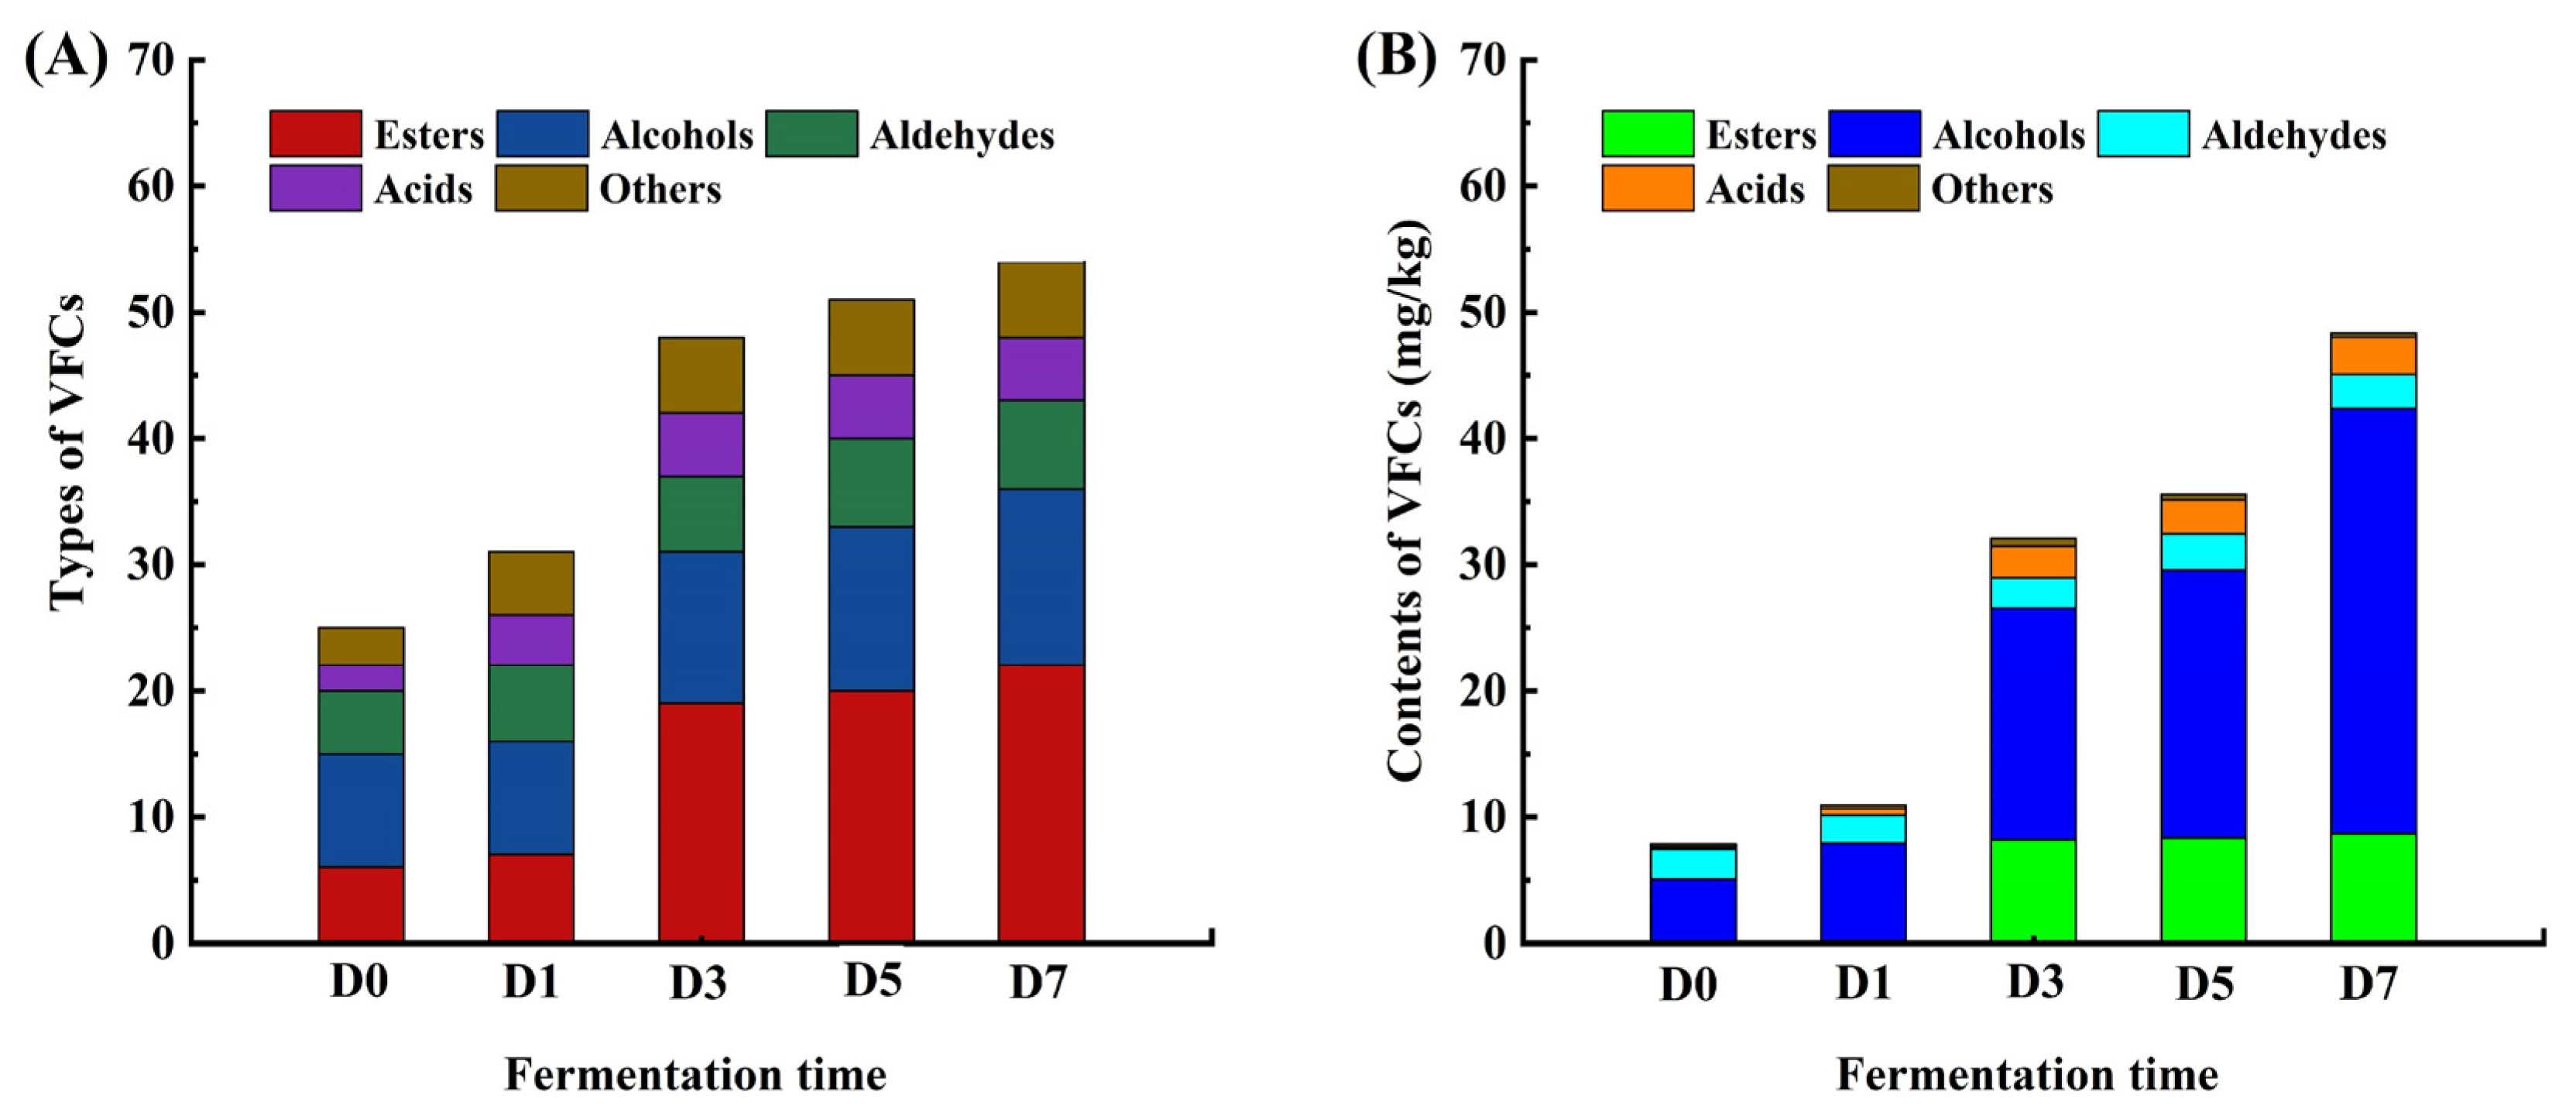
Figure 1. Comparison of the types (A) and contents (B) of VFCs during fermentation.
Fermentation 11 00604 g001
Figure 2. Alpha diversity of bacterial community in fermented burdock root. (A) Ace index; (B) Chao index; (C) Sobs index; (D) Shannon index; (E) Simpson index; (F) Coverage index. * represents p < 0.05, indicating a significant difference. ** represents p < 0.01, indicating a very significant difference. *** represents p < 0.001, indicating an extremely significant difference.
Fermentation 11 00604 g002
Figure 3. The bacterial community composition in fermented burdock root. (A) Venn diagrams at the phylum level; (B) venn diagrams at the genus level; (C) venn diagrams at the species level; (D) bar chart at the phylum level; (E) bar chart at the genus level; (F) bar chart at the species level. Only relative abundance > 1.0% are listed. “Other” indicates the relative abundance of species that are not included but could be identified at a relative level; “unclassified” indicates species that could not be identified.
Fermentation 11 00604 g003
Figure 4. Correlation analysis between bacteria and characteristic VFCs. (A) RDA at the phylum level; (B) RDA at the genus level; (C) CCA at the species level; (D) heatmap at the phylum level; (E) heatmap at the genus level; (F) heatmap at the species level. For RDA/CCA, different colored dots represent different samples; red arrows represent characteristic VFCs and blue arrows represent bacteria; length of arrows represent the correlation strength of the respective characteristic VFCs with the bacteria; angle between vectors indicates the degree of the correlation. For the heatmap, the color changes in heatmap demonstrate a positive or negative correlation between bacteria and characteristic VFCs.
Fermentation 11 00604 g004
Figure 5. Heatmap of PICRUSt2 function prediction analysis. (A) Heatmap of pathway level 1; (B) heatmap of pathway level 2; (C) heatmap of pathway level 3; (D) heatmap of enzyme; (E) heatmap of KO; (F) heatmap of module.
Fermentation 11 00604 g005
Table 1. The contents and thresholds of characteristic VFCs in fermented burdock root (D7).
NO.VFCsThresholds (μg/kg)Contents (mg/kg)OAVs
1Ethyl caproate0.000651.2731.95 × 106
2Acetaldehyde0.0211.8929.01 × 104
3Isoamyl acetate0.00350.2366.75 × 104
4Hexaldehyde0.00690.3525.10 × 104
5Phenylacetaldehyde0.0040.0781.96 × 104
6Linalool0.00530.0811.54 × 104
73-Methylbutanol0.7358.4801.15 × 104
8Ethyl heptanoate0.0190.1678.76 × 103
9Ethyl caprate0.07250.6168.50 × 103
10Nonyl aldehyde0.00360.0277.47 × 103
112-Amylfuran0.00590.0366.13 × 103
122-Nonanol0.070.3575.11 × 103
13Ethyl caprylate0.01930.0864.44 × 103
14Hexyl acetate0.080.3083.85 × 103
152-Methylbutanol1.23.5722.98 × 103
162-Undecanone0.0070.0162.29 × 103
171-Hexanol1.212.6022.15 × 103
181-Octen-3-ol0.04250.0671.58 × 103
192-Heptenal0.0320.0451.41 × 103
202-Heptanone0.140.1971.41 × 103
21Ethyl benzoate0.060.0791.31 × 103
22Ethyl acetate3.293.0289.20 × 102
232-Undecanol0.02480.0145.67 × 102
24Hexylenic aldehyde0.08870.0495.56 × 102
25Isobutyl alcohol4.87762.6295.39 × 102
26Benzaldehyde0.750890.2863.81 × 102
271-Propanol8.50562.6053.06 × 102
28Benzeneethanol10.2642.64 × 102
29Lactic acid91.5621.74 × 102
30Ethyl palmitate20.2781.39 × 102
31Octanoic acid3.00.30099.9
32Phenethyl acetate0.249590.01872.6
33Ethanol1509.81665.4
34Hexanoic acid3.00.19063.2
352,3-Butanediol67.52.95343.8
36Ethyl laurate3.150.09831.2
37Decanoic acid2.5950.07930.3
38Benzyl alcohol8.77310.19822.6
39Tetradecane10.01716.5
40Acetic acid500.81116.2
41Methyl palmitate20.0115.7
42Ethyl lactate1500.1971.3
Note: The thresholds for flavor compounds detected in water media, obtained from the book by Gemert [20].
Disclaimer/Publisher’s Note: The statements, opinions and data contained in all publications are solely those of the individual author(s) and contributor(s) and not of MDPI and/or the editor(s). MDPI and/or the editor(s) disclaim responsibility for any injury to people or property resulting from any ideas, methods, instructions or products referred to in the content.