Article

Fluence Enhanced Optical Response of Ag Implanted Amorphous Carbon Thin Films

by
Shunmugam Ramsamy Naidoo
1,2,3,* and
Abdulsalam Ismaila
1,4
1
School of Physics, University of the Witwatersrand, Private Bag 3, Johannesburg WITS 2050, South Africa
2
DST-NRF Centre of Excellence in Strong Materials, University of the Witwatersrand, Private Bag 3, Johannesburg WITS 2050, South Africa
3
Material Physics Research Institute (MPRI), School of Physics, University of the Witwatersrand, Private Bag 3, Johannesburg Wits 2050, South Africa
4
Department of Physics, Ahmadu Bello University, Community Market, Zaira Nigeria 810211, Nigeria
*
Author to whom correspondence should be addressed.
Submission received: 22 May 2019 / Revised: 5 July 2019 / Accepted: 30 July 2019 / Published: 5 August 2019

Abstract

:
Silver nanoparticles (NPs) are known to exhibit strong interaction with light photons because their surface conduction electrons undergo collective oscillations once photo-excited at specific wavelengths; the so-called surface plasmon resonance (SPR). Their incorporation into carbon-based material is shown to greatly influence the overall optical response of the matrix due to aggregation. In this paper, we studied the optical response of silver-irradiated amorphous carbon films due to varying fluence of 25 keV Ag ions in the range 2.5–3.4 × 10¹⁶ ions/cm2. Raman spectroscopy provided an insight into the microstructural details of the Ag:a-C nanocomposites such that access to bond characteristics of the films is enabled by directly linking the Raman information with sp2/sp3 configurations. Atomic force microscopy (AFM) analysis show significant increase in particle grain size and surface roughness of the films with increasing fluence while transmission electron microscopy (TEM) confirmed fluence-induced particle aggregation due to irradiation. Optical absorption studies revealed that the SPR of Ag NPs occurs in the wavelength range 418–395 nm in the irradiated films. The blue shift in plasmonic wavelength response is explained with respect to the fluence-induced increase in the particulate grain size and particle density as confirmed by AFM and TEM. The optical band gap energy ( E g ) of the pristine carbon film decreased from 1.79 eV to 1.41 eV while Urbach parameter ( E u ) increased from 0.01 eV to 12.0 eV, respectively with increasing fluence. These tunable optical parameters can be tailored into applications in surface coatings and as functional materials for solar cell efficiency enhancement.

Graphical Abstract

1. Introduction

Carbon as a unique material generally exists in two main isotopes (12C and 13C) and is, under normal conditions, highly unreactive despite its versatility in compound formation [1]. In addition to its two well-known allotropes, diamond and graphite, the discoveries of buckminsterfullerene C60 [2] as well as carbon nanotubes (CNTs) [3] added to the family of carbon allotropes and opened up an entirely new era in the field of material science and technology. Much later, the most recent allotrope, graphene, was discovered as a single sheet extract of the three-dimensional graphite structure obtained via micromechanical cleavage techniques [4]. In the last few decades, researchers in carbon and carbon related materials have focused on optimization of applications through combining carbon or its related materials with other elements or particles of other elements (both in micro and nanoscales) to achieve certain improved properties. Thus, much interest is focused towards the development of new materials from carbon; utilizing its unique properties for different applications.
Different forms of carbon-based materials undergo property modification via irradiation with energetic ions [5]. Ion implantation is a materials engineering process and an alternative to diffusion, which is used to produce a shallow surface region of dopant atoms deposited into a target material [6]. The process allows the possibility of modifying the physical, chemical, electrical as well as optical properties of solid materials [7] for various applications ranging from medical [8], optoelectronic [9], photonic devices [10], biosensors [11] and photovoltaics [12]. Several ion species like N, Ti, Cr, Si, Ar, Ag, Cu, and Au etc. have been used with great success in modifying the properties of metals, inorganic materials and polymeric substrates for various research and industrial purposes [13].
Noble metals-containing nanostructured materials have attracted great attention of researchers in the past few decades [14,15,16,17,18,19,20,21] because the metal nanoparticles exhibit a pronounced resonance extinction of visible light due to the collective excitation of quasi free electrons of the metallic system [22,23,24]. This phenomenon causes the absorption and scattering intensities of the metal nanoparticles to be much higher than that of identically sized non-plasmonic nanoparticles [25]. Additionally, under normal operating conditions, maintaining all pristine and inherent properties of the nanoparticles, the optical spectra remains unaffected [23]. However, the geometry (size and shape), local refractive index as well as particle aggregation tremendously affect the optical properties of materials containing these nanoparticles [26].
This paper seeks to study the effect, on the optical response, of thin films of amorphous carbon bombarded with energetic Ag ions via accelerator-based ion implantation. Atomic interactions during ion irradiation cause the accelerated ions to lose energy, via collisions with the electrons of the atoms as well as the nuclei of the target atoms, in two distinct but simultaneous processes of electronic and nuclear stopping [27]. The implanted ions alter the properties of the materials which include the optical, electrical and mechanical characteristics [28,29]. For the implanted carbon films in this study, the Ag ions aggregate to form nanoparticles resulting in Ag-C nanocomposite thin film. The implanted fluence is capable of changing the density and size of the Ag nanoparticles which leads to change in their dielectric properties and consequently the particulate surface plasmon resonance wavelength [5,30].
In this work, we confirm the effects of the particle aggregation/size increase on the overall optical response of the nanocomposites in relation to the observed blue shift in the surface plasmon resonance wavelength.

2. Experimental Details

Floatable amorphous carbon thin films of thickness 40 µg/cm2 were obtained from the YISSUM Research Development Company, Jerusalem, Israel for this work. These films were deposited on glass substrates of dimensions 7.5 cm × 2.5 cm. Preliminary investigations into the optical absorption of the as-deposited films were carried out on three samples (A, B and C) using a Carey 500 UV-VIS-NIR spectrophotometer manufactured by Varian at the School of Physics, University of the Witwatersrand, Johannesburg. The films were irradiated with 25 KeV Ag ions using the Varian 200–20 A2F ion implantation system at iThemba Labs, Gauteng, South Africa. The implanted fluence for the three samples A, B and C were 2.5 ions/cm2, 3.0 ions/cm2 and 3.4 × 10¹⁶ ions/cm2, respectively. The average beam current was 0.55 µA. The predicted range of Ag ions in the carbon film is ~183 A as determined from the SRIM simulation program [31]. Optical absorption measurements was carried out on the implanted films as stand-alone and compared with those of a pristine reference film. Raman spectra were acquired using a 514.5 nm line of a Lexel Model 95 SHG argon ion laser and a Horiba LabRAM HR Raman spectrometer equipped with an Olympus BX41 microscope attachment at the University of the Witwatersrand. The incident laser beam was focused onto the sample using a 100× objective (N.A. = 0.90) and the backscattered light was dispersed via a 600 lines/mm grating onto a liquid nitrogen-cooled charge-coupled device (CCD) detector. The scan range was 100–1900 cm−1 and the laser power at the sample was approximately 0.4 mW in order to minimize localized heating effects. The Raman spectra was able to probe the bond characteristics of the films with the Raman information from the sp2/sp3 configurations. A sub-nanometer Veeco Dimension 3100 atomic force microscope was used to measure the surface morphology of the Ag:a-C nanocomposites. Sections of the nanocomposites were floated onto copper transmission electron microscope (TEM) grids and corresponding micrographs were obtained using a FEI Tecnai G2 Spirit transmission electron microscope at the MMU unit at Wits University. The images were recorded at 120 kV and was ideal for imaging the distribution and size of the nanoparticles embedded in the carbon thin films.

3. Results and Discussion

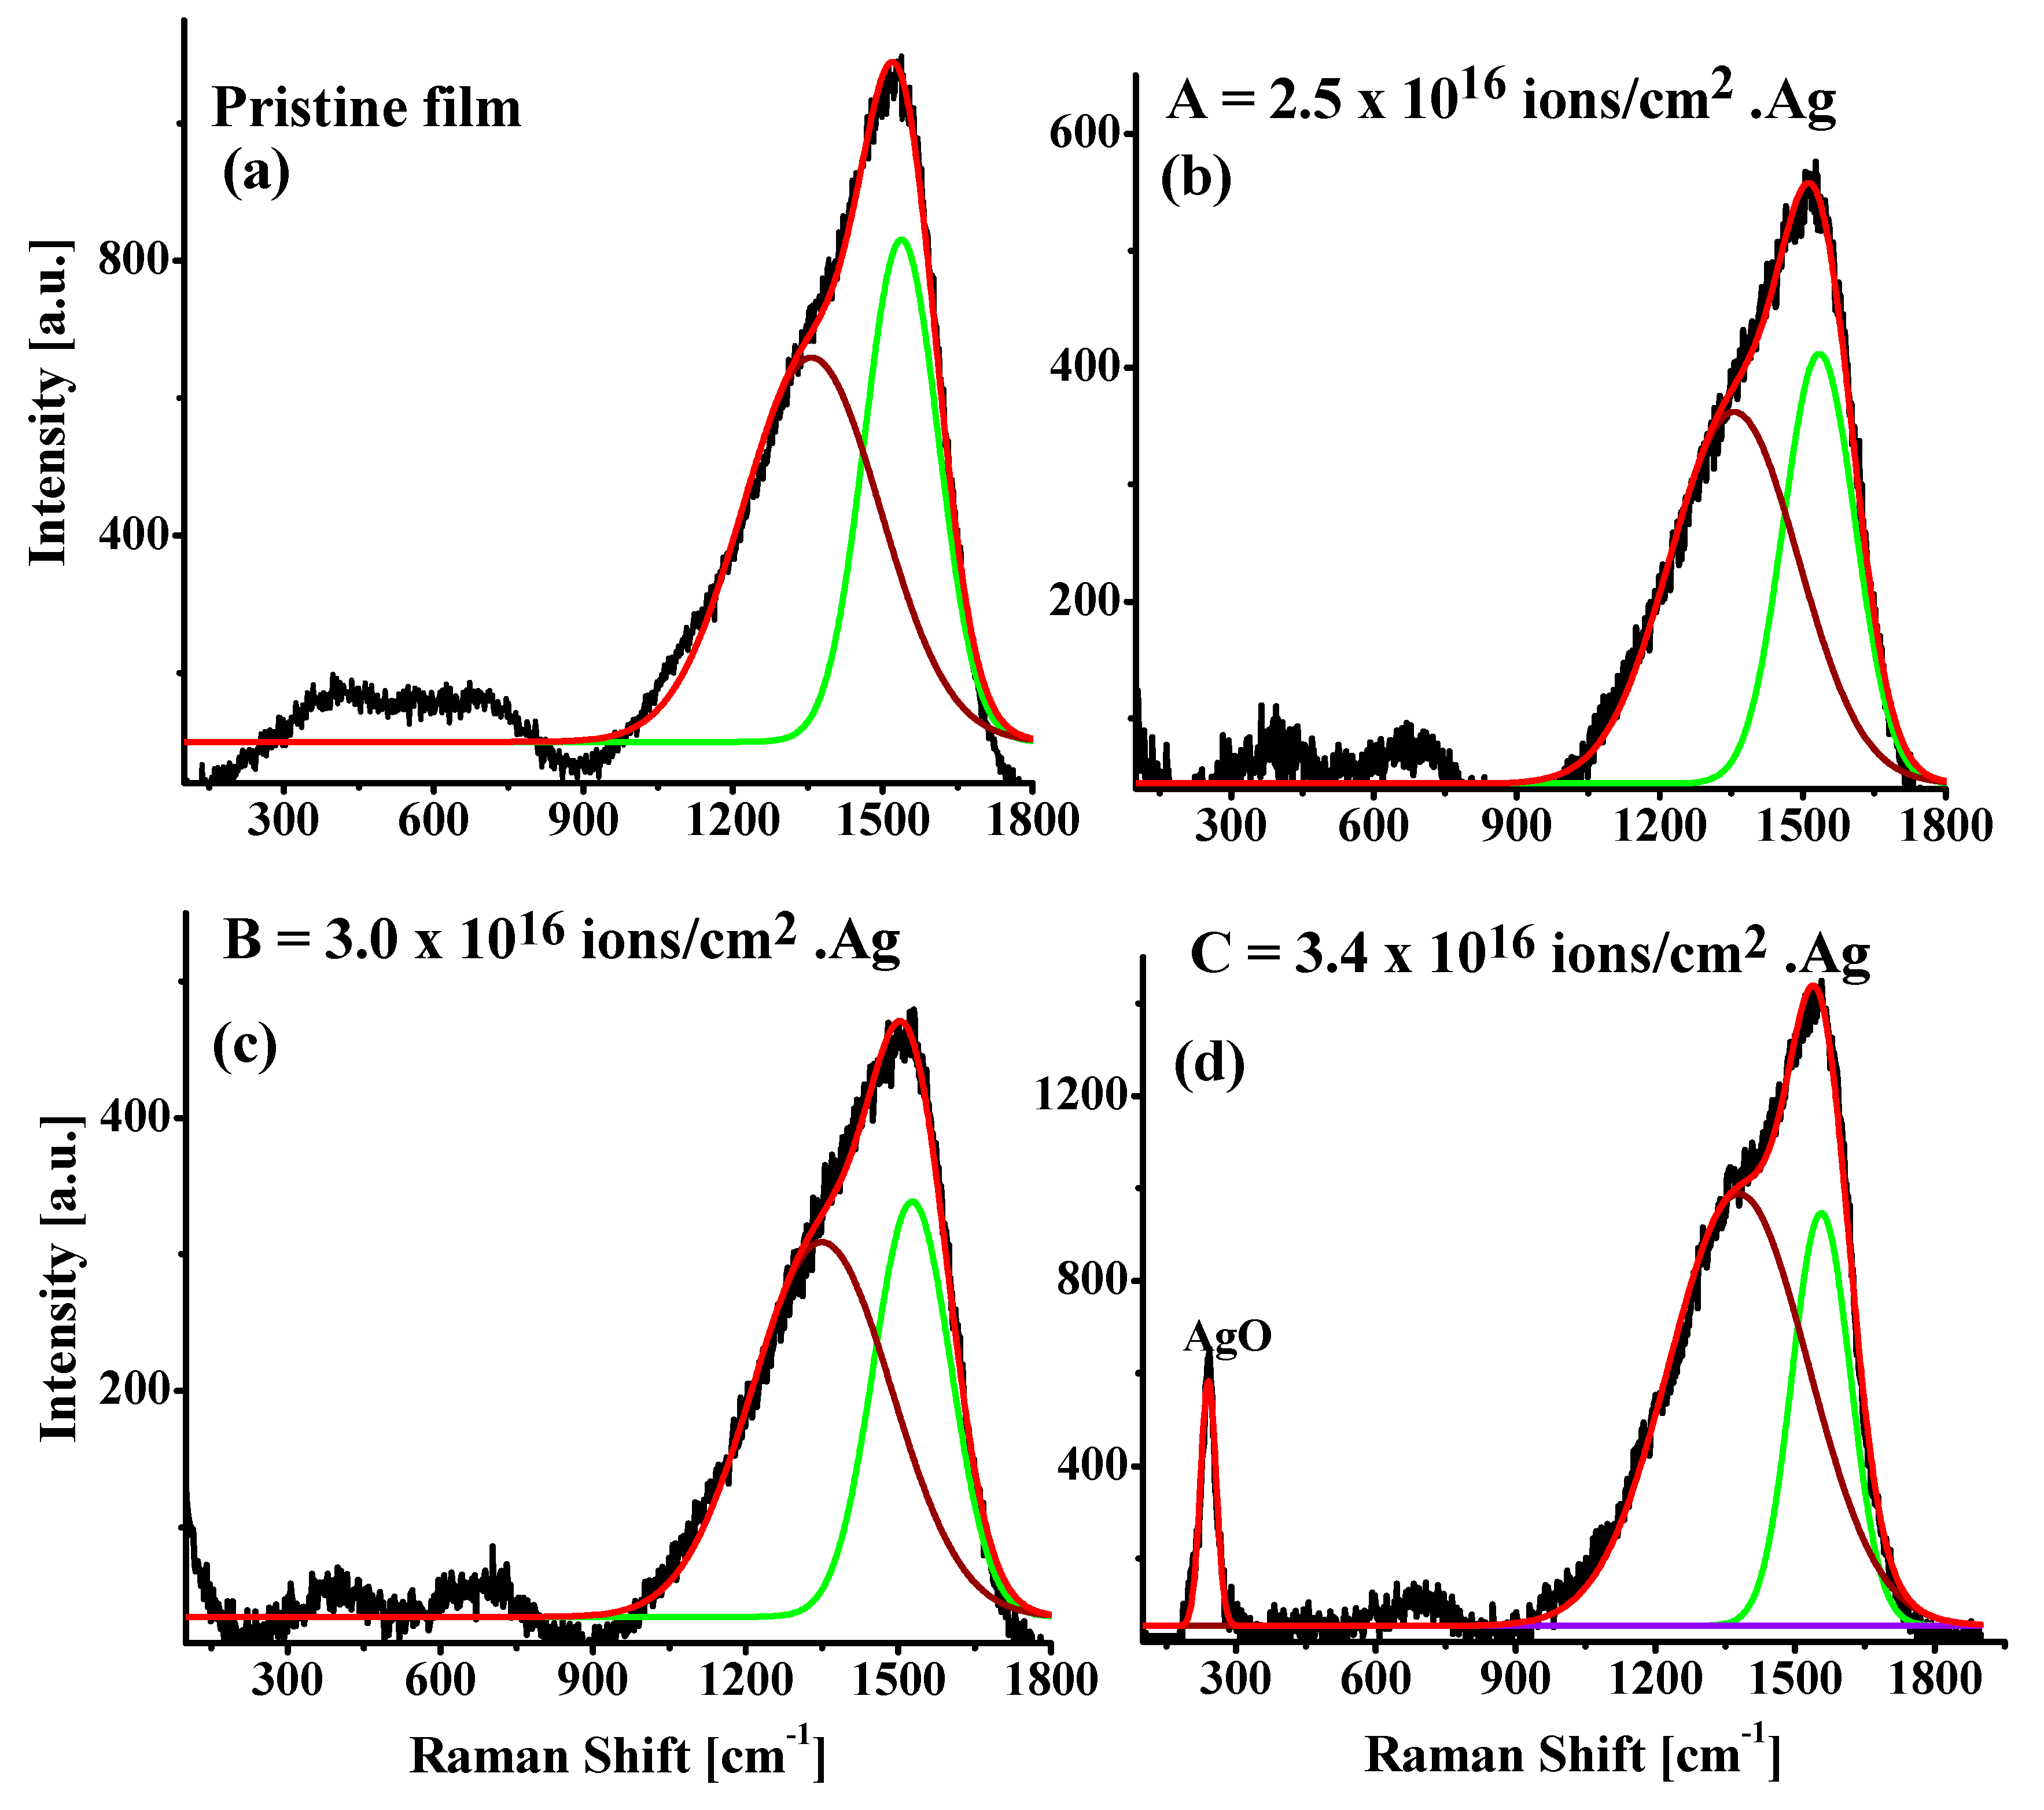
3.1. Raman Spectroscopy

The pristine carbon film displayed similar trend of characteristics as those of microcrystalline graphite showing distinct D and G peaks around 1355 cm−1 and 1575 cm−1, respectively as shown in Figure 1a. Other Raman studies on amorphous carbon films have shown that the 1575 cm−1 is typically referred to as the G band and commonly attributed to the Raman active mode of graphite-like carbon [32,33,34,35,36,37]. Ferrari and Robertson [37] relate the D band (~1355 cm−1) to a breathing mode, involving phonons, that is only active in carbon films with relative disorder and which is absent in perfect graphite materials. Based on the literature, we conclude that the unimplanted film was composed of an amorphous carbon phase with graphitic micro grains. After ion implantation, the D-band and G-band are still prevalent in the implanted material (Figure 1b–d) and their characteristics are summarized in Table 1. At the lower fluences of implantation (2.5–3.0 × 10¹⁶ ions/cm−2), the Ag nanoparticles are well embedded within the amorphous carbon films such that no interactions, due to impurity atoms in the atmosphere, are possible other than the ion-atom interactions within the matrix. At the higher fluence of 3.4 × 10¹⁶ ions/cm−2 however, adequate particle aggregation had taken place so that the near surface Ag nanoparticles formed oxides due to exposure to oxygen atoms in the environment. The observed raman band around 240 cm−1 for the sample implanted with a fluence of 3.4 × 10¹⁶ ions/cm−2 is attributed to the vibrational modes of silver oxide (AgO) phase in the Ag:a-C nanocomposites. This is in concordance with the findings by Raju et al. [38], while reporting on the chemical activity observed on silver colloids synthesized for surface enhanced raman scattering (SERS), which showed the presence of vibrational bands at 230 cm−1 as the position of Raman active silver oxide mode. A similar result was also reported by Débarre et al [39].

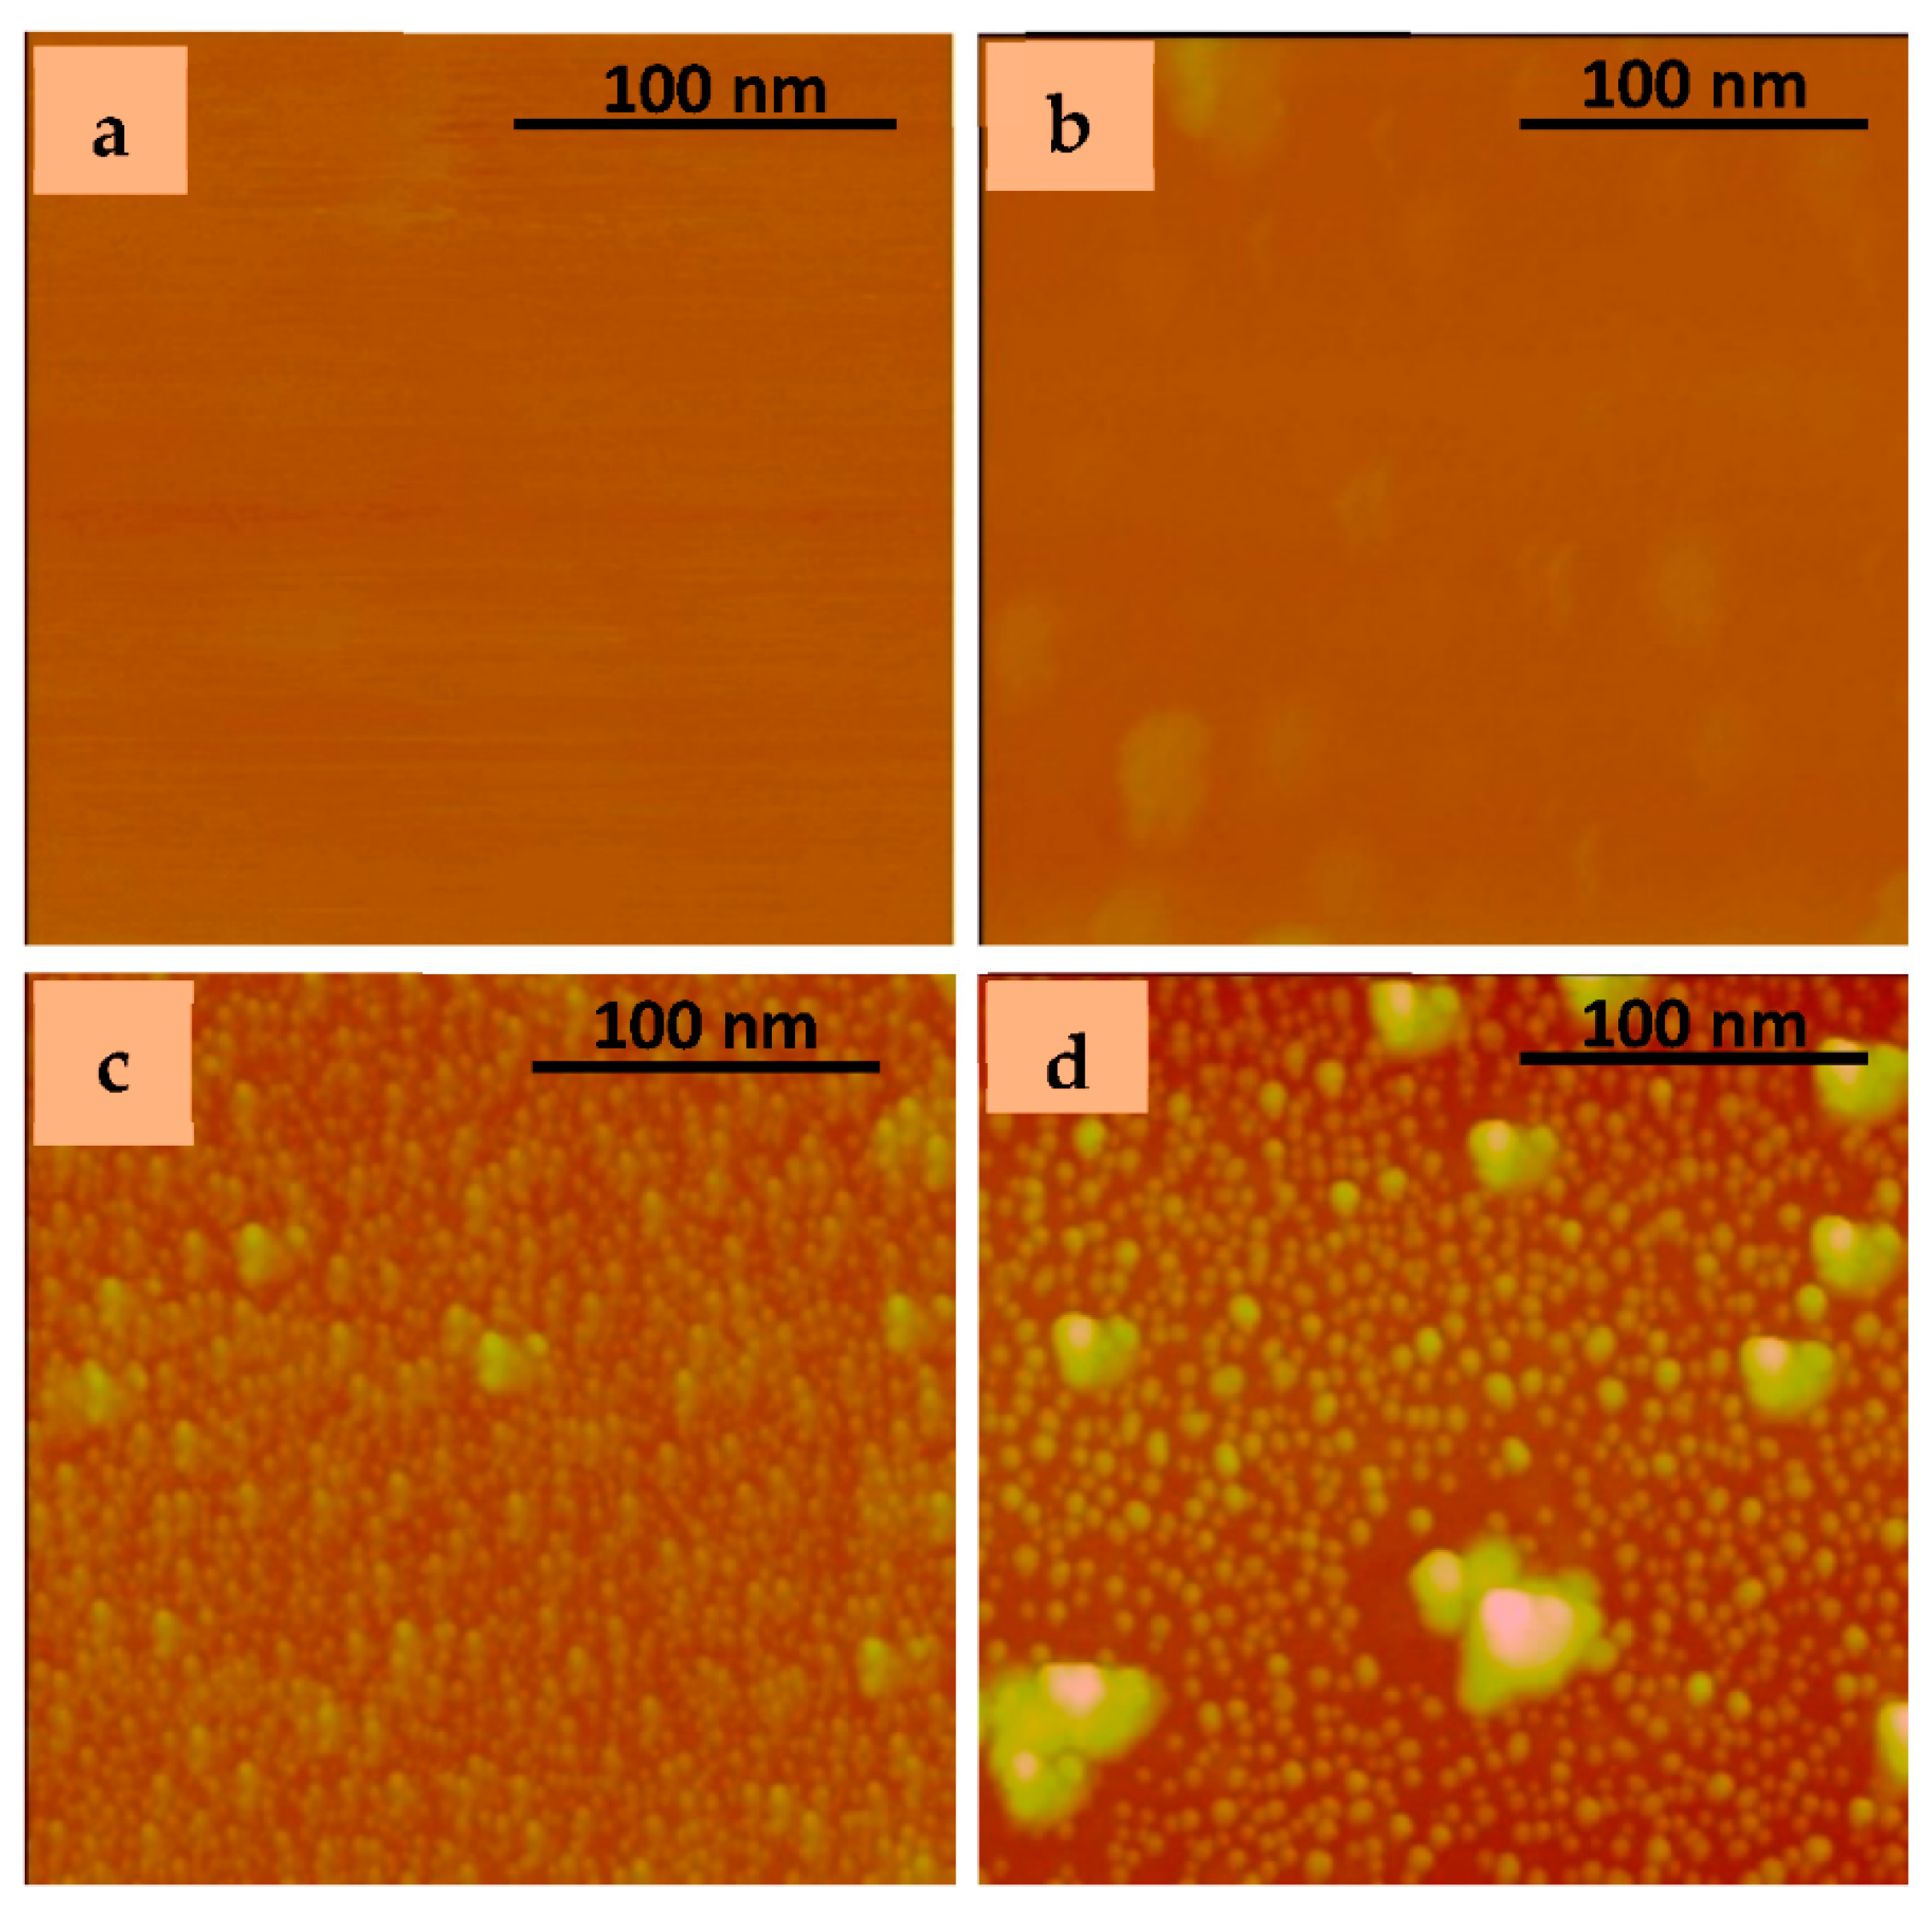
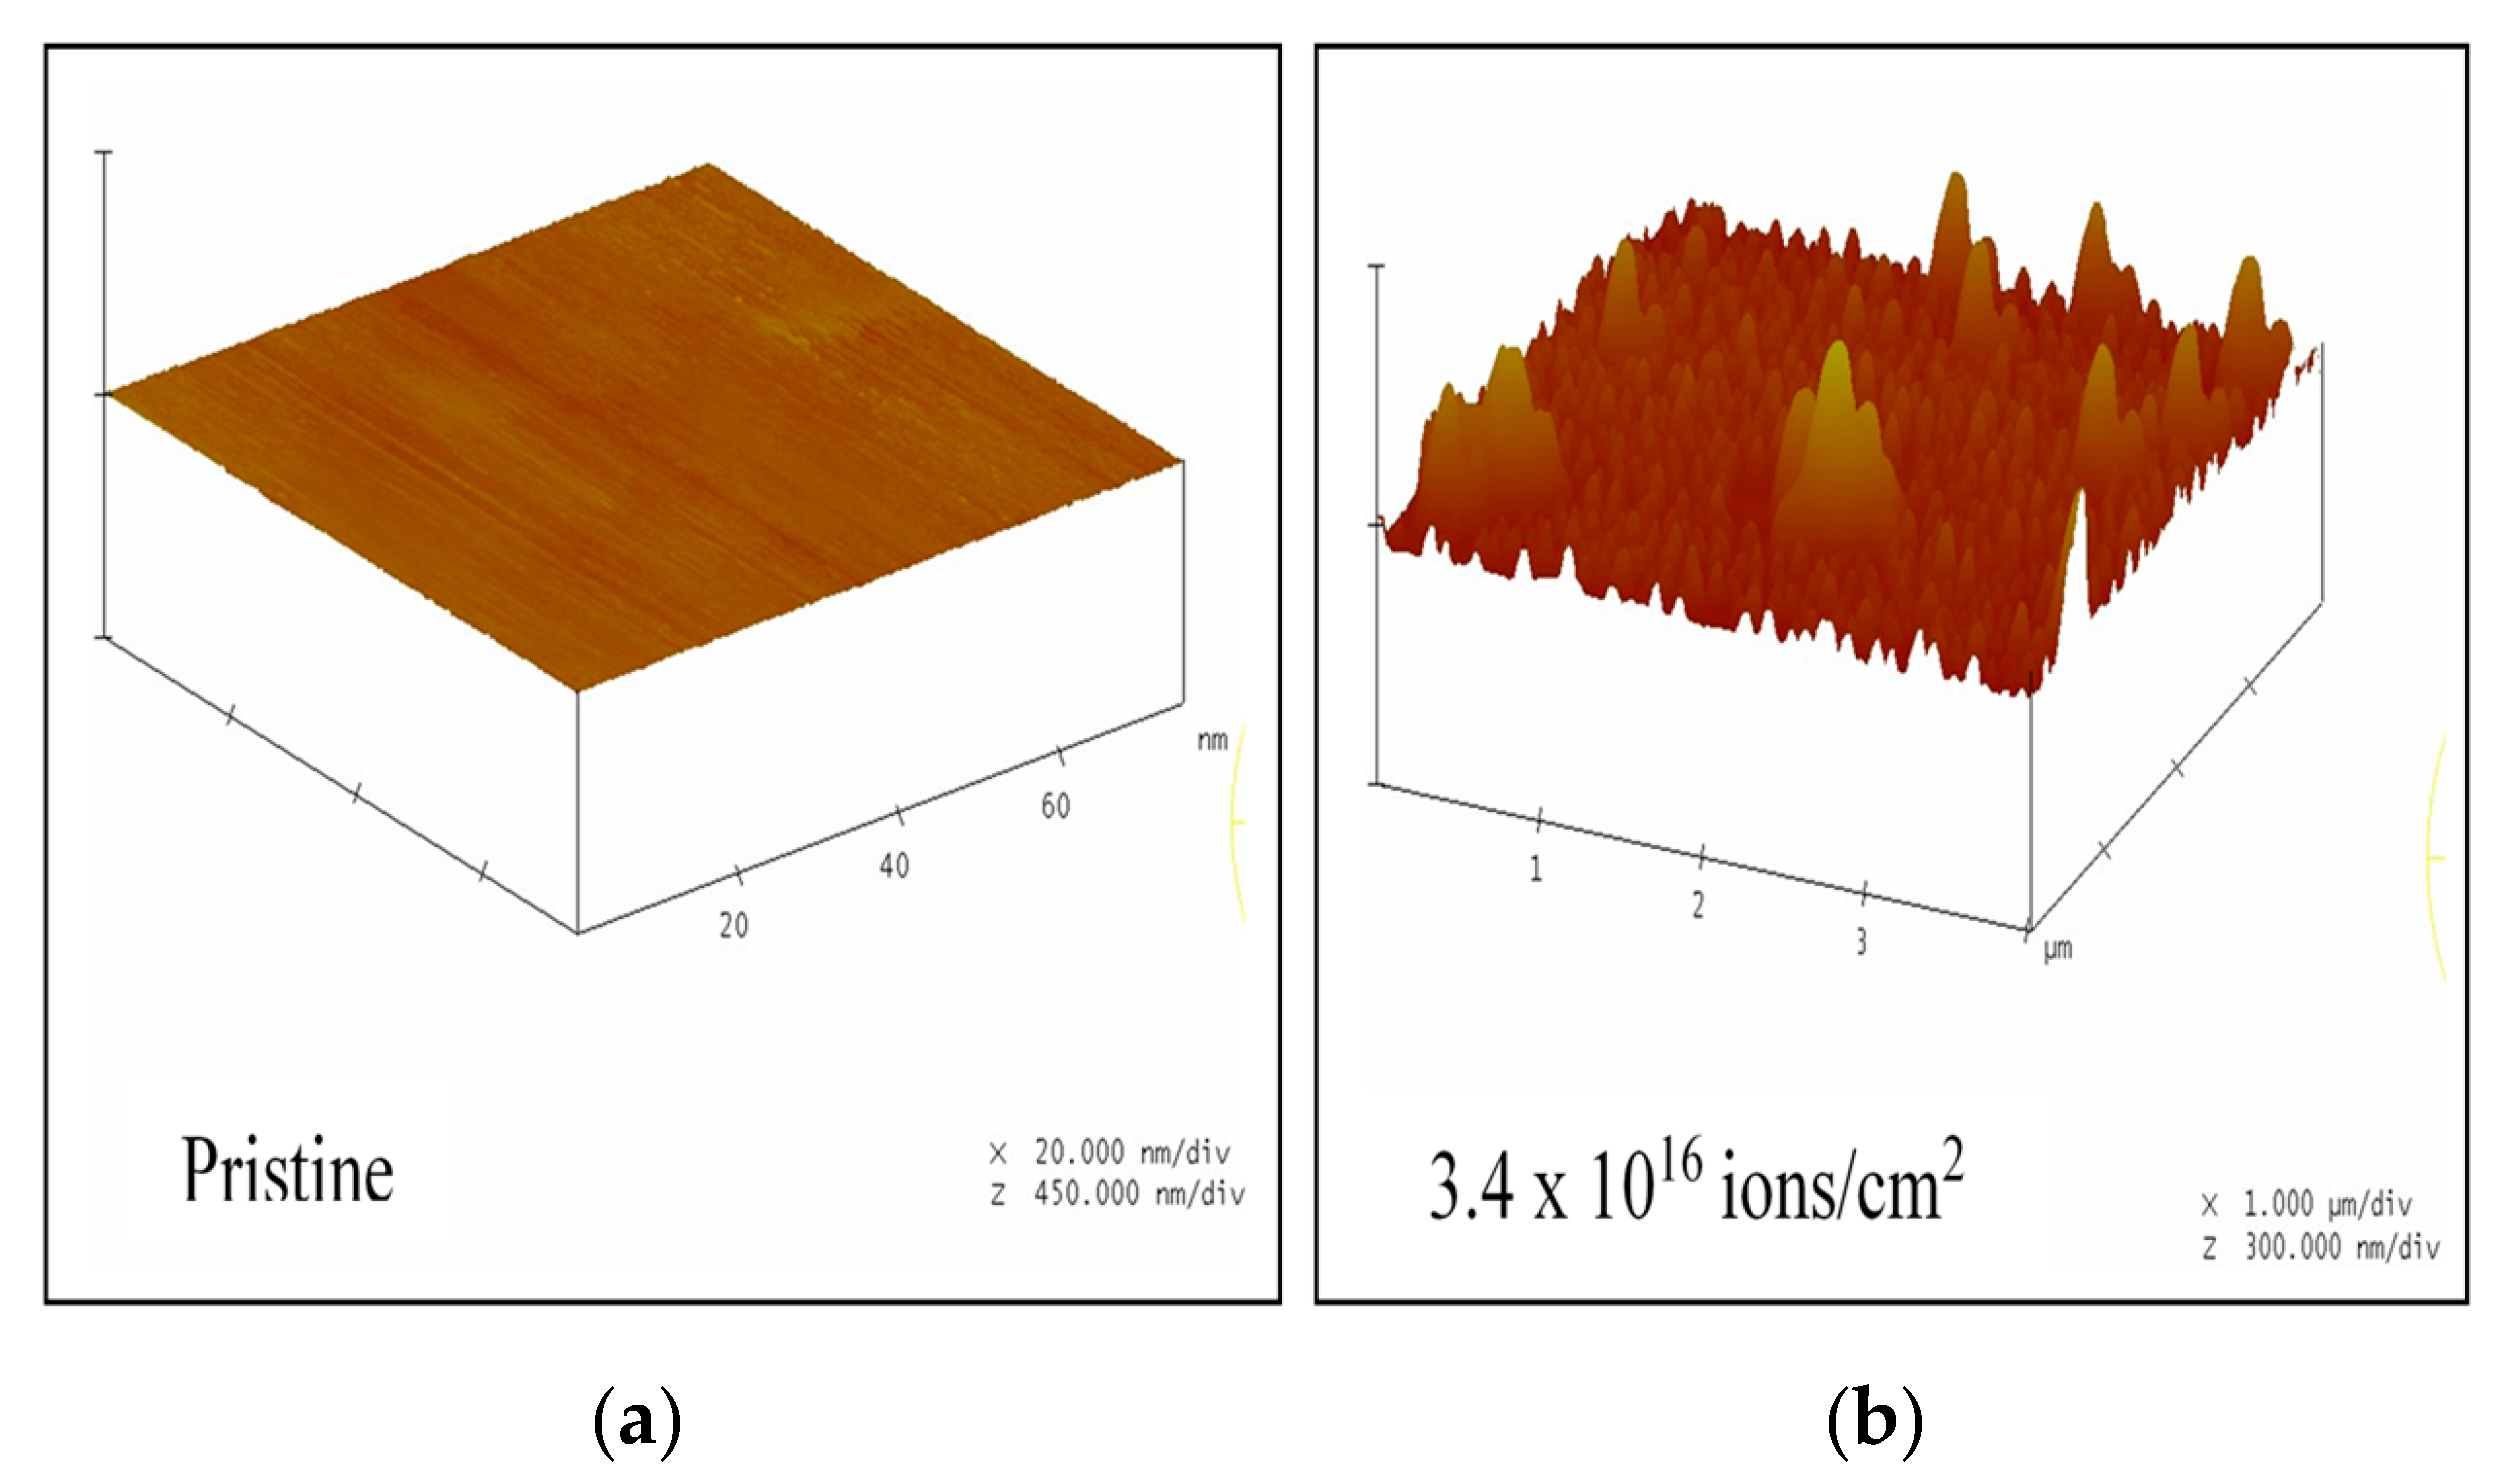
3.2. Atomic Force Microscopy

2D AFM images of pristine and 25 keV Ag irradiated a-C thin films are shown in Figure 2a–d. It is observed that the surface roughness of respective samples increase with the increasing fluence of irradiation. The gradual increment in roughness is attributed to sputtering effects on the surface of the films due to energetic ion bombardment. We also note that for the sample irradiated with highest fluence (3.4 × 10¹⁶ ions/cm2), the roughness is influenced by the agglomeration of Ag nanoparticles. This is in good agreement with the observations by Sharma et al. [40]. The observed increase in average grain size from ~9 nm to ~21 nm for the highest irradiation fluence is attributed to particle agglomeration that has taken place as a result of increased Ag ion concentration. This is due to the high surface free energy of the smaller Ag nanoparticles (high specific surface area) resulting in particle agglomeration which form larger nanoparticles with a lower surface free energy [41,42,43,44,45,46]. The comparative roughness for the pristine and Ag irradiated a-C thin films for the highest fluence are shown in Figure 3a,b.

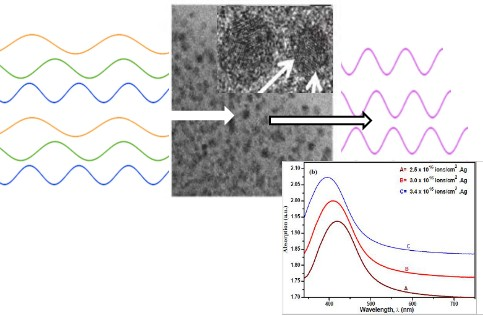
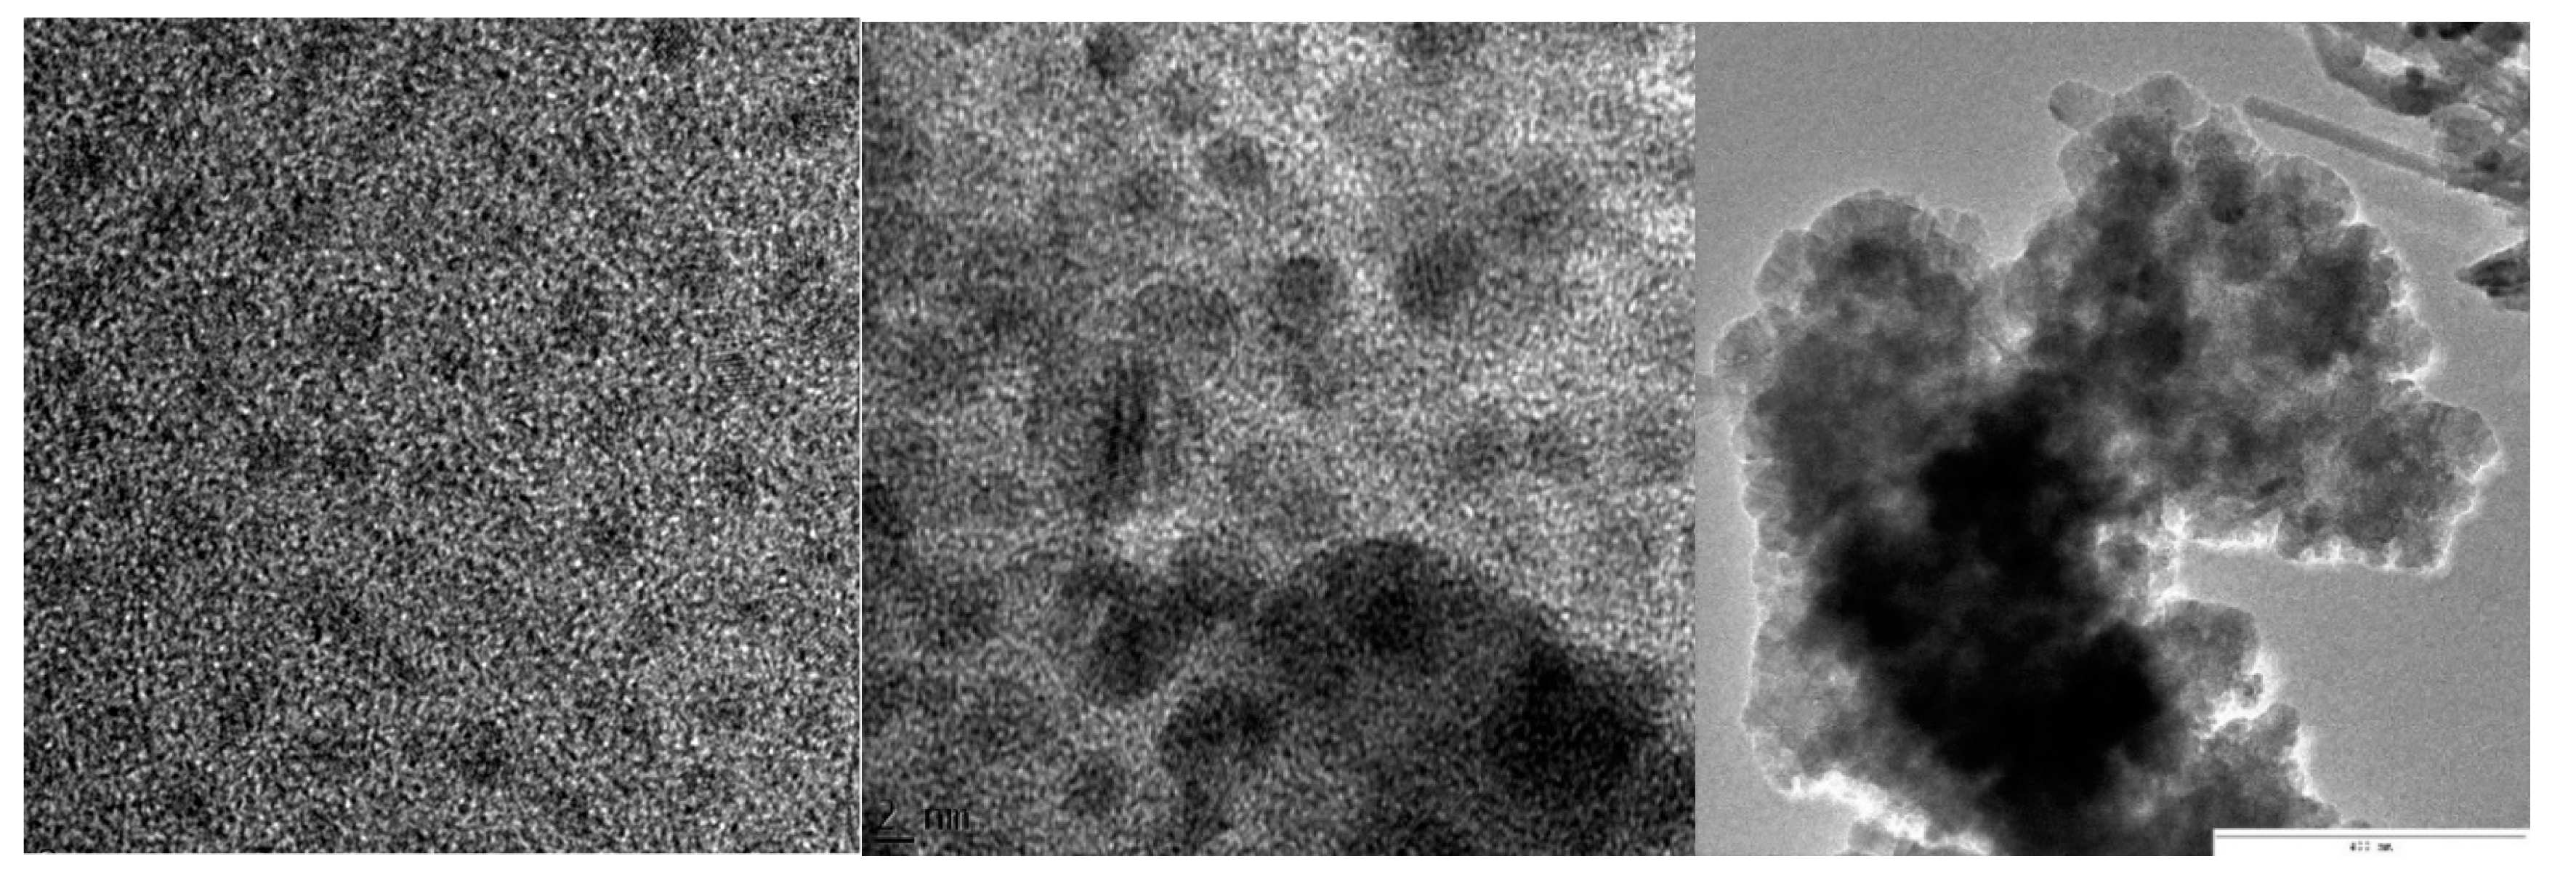
3.3. Transmission Electron Microscopy

Figure 4 shows the TEM images of the implanted films showing an increase (left to right) in particle density/size as a function of implantation fluence. At the highest fluence of implantation (right micrograph), the Ag nanoparticles agglomerated (particle aggregation) into silver-rich regions in the Ag:a-C nanocomposites.

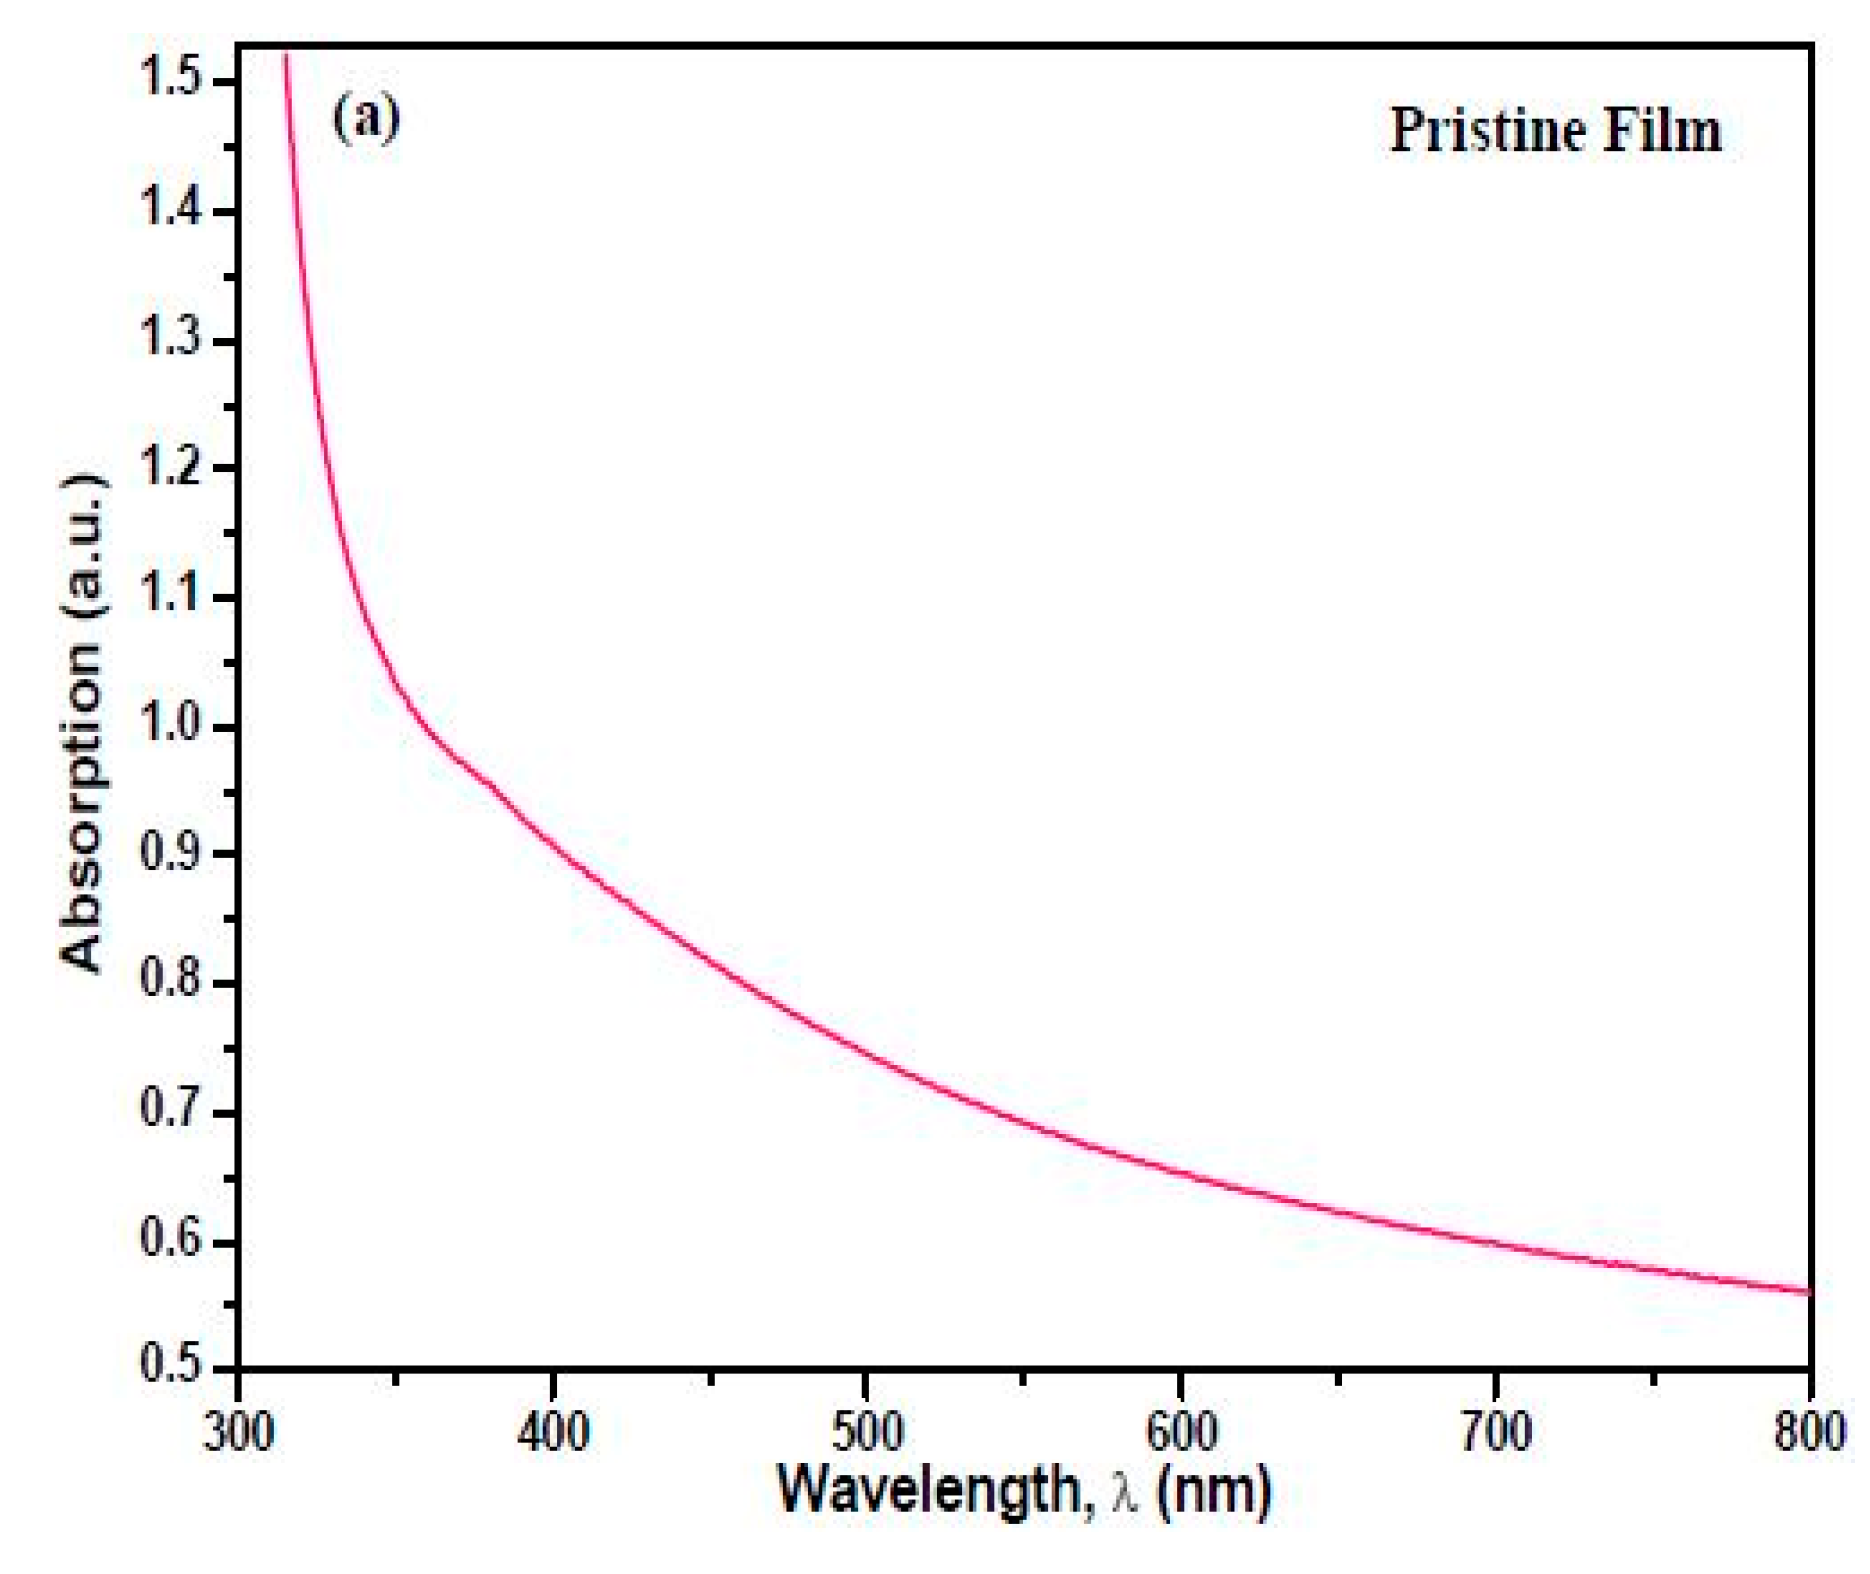
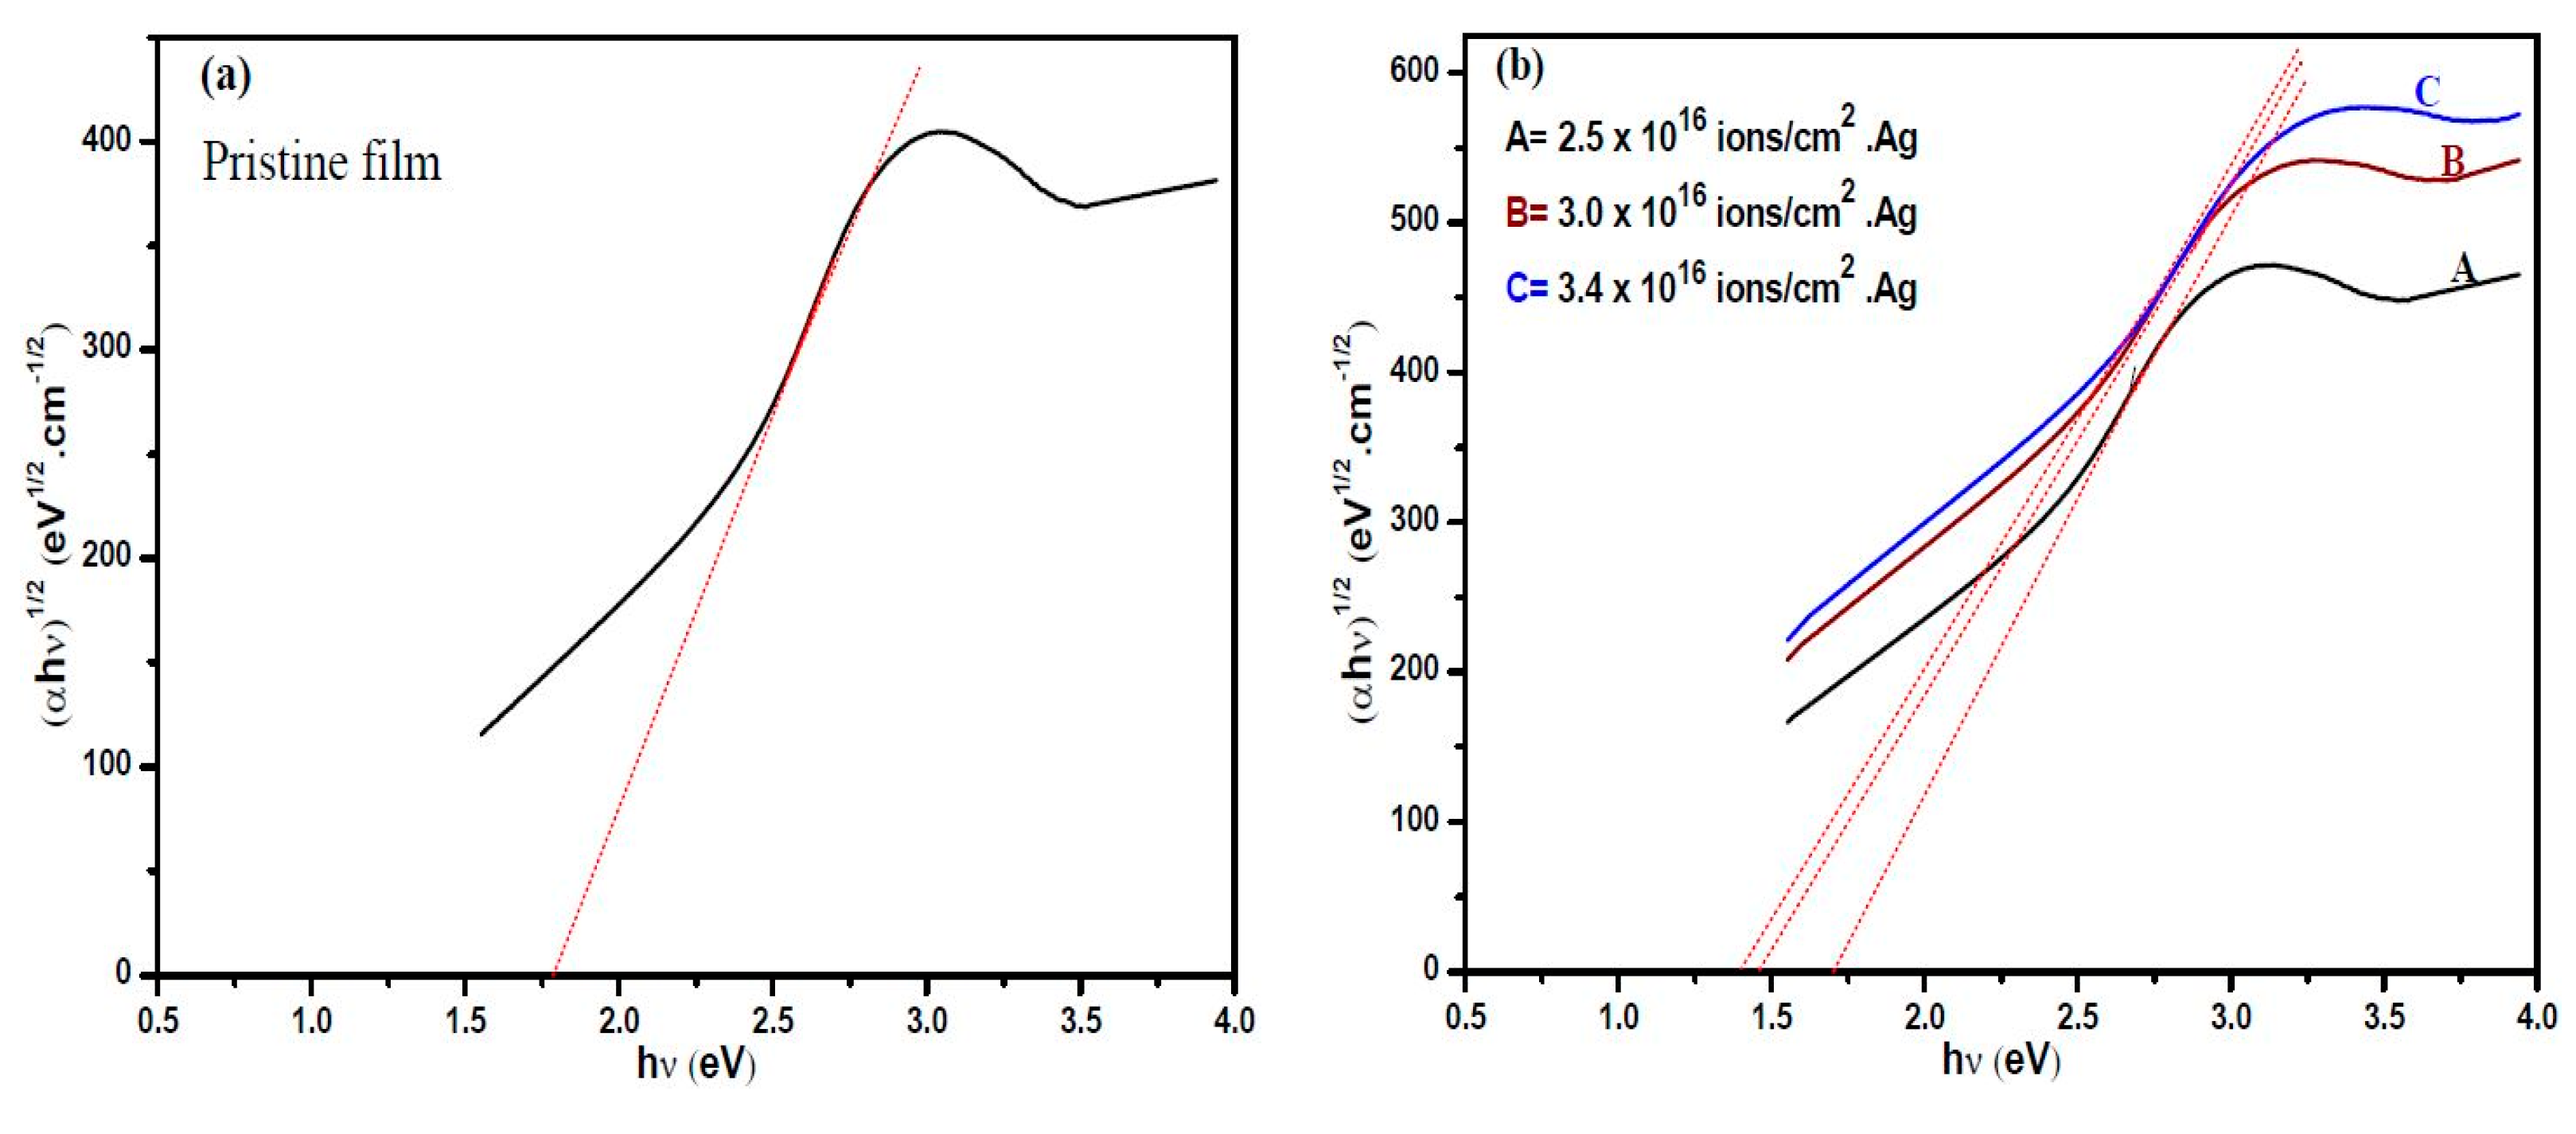
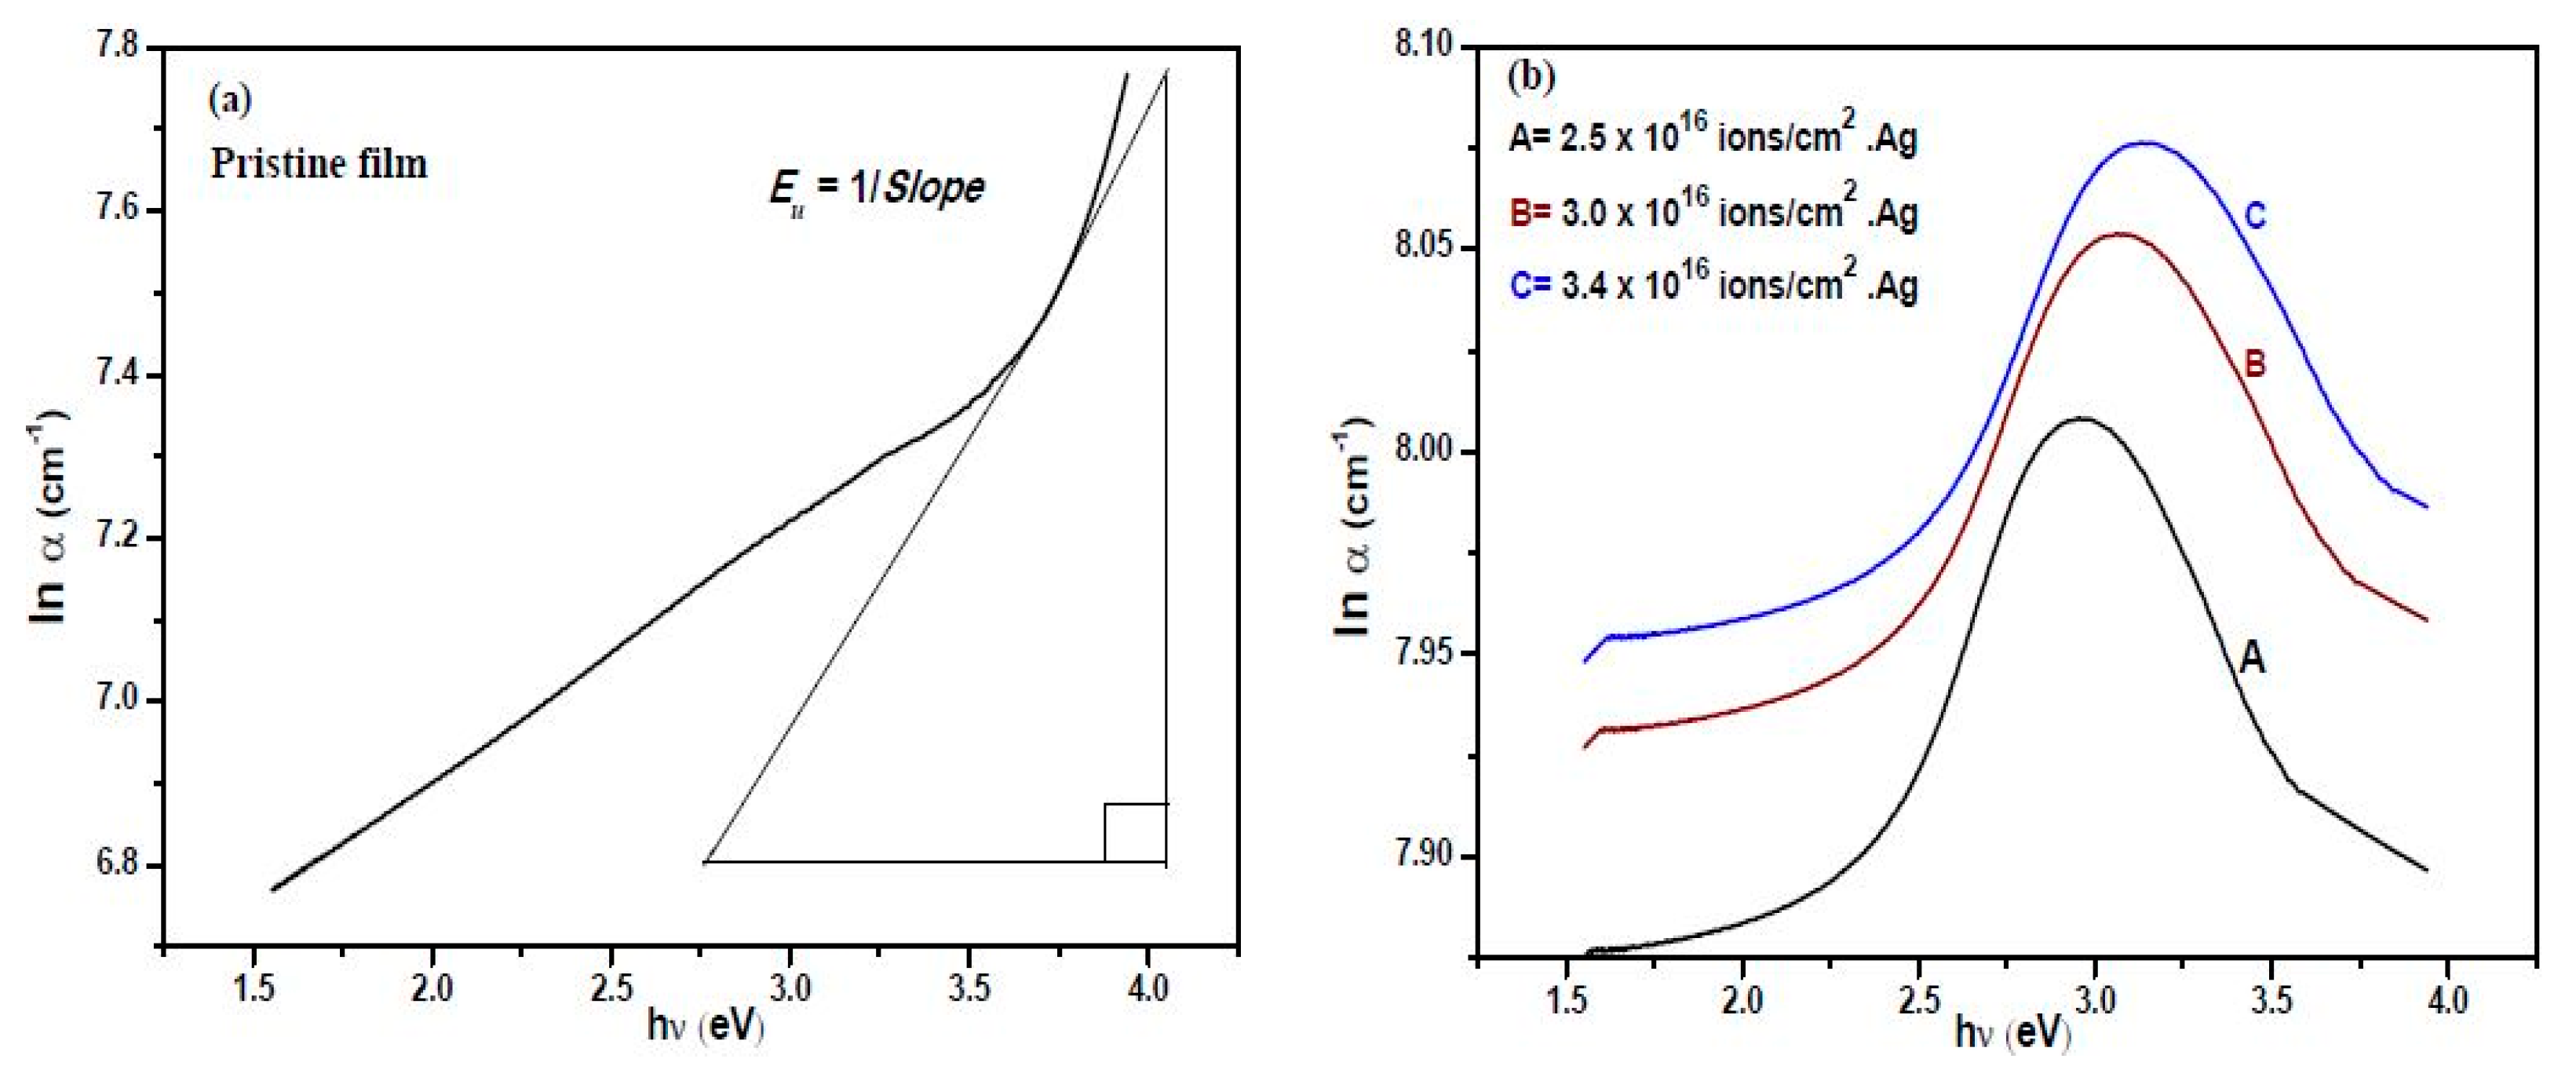
3.4. UV-Visible Absorption Spectroscopy

Figure 5a shows the optical absorption spectrum for the pristine carbon film with reasonable transmission in the infrared and near infrared regions of the spectrum (~27%) but displayed stronger absorption within the visible region. Optical spectra for Ag:a-C nanocomposites show an increase in light absorption within the visible and near infrared regions with respect to the irradiation fluence. Figure 5b shows the combined absorbance spectra of the Ag:a-C nanocomposites analyzed as stand-alone films.
This rapid absorption increase as well as the clearly observed absorption peaks (395–418 nm) is due to the surface plasmon resonance (SPR) of the Ag nanoparticles [26] embedded in the amorphous carbon matrix. The intense and sharp plasmonic resonance responses of the carbon nanomaterials occur because of the variations in the inherent dielectric properties of amorphous carbon leading to small overlaps between the localized SPR of the Ag NPs and their interband transitions that usually start at a wavelength of about 320 nm [45]. Singhal et al. [5] observed similar SPR peaks for C-70 fullerenes irradiated with high energy (120 MeV) and low fluence (~1013 ions/cm2) Ag ions and attributed these to the nanoparticles in the carbon matrix.
In this work, however, particle aggregation occurs after low energy (25 keV) and high fluence (~1016 ions/cm2) implantation of Ag ions. As the particles aggregate, their inter-atomic spacing decreases and the distance between the two corresponding valence bands reduces thereby increasing the frequency of the electromagnetic emission after being laser-excited and consequently a decreased wavelength (blue shifting) [46]. Particle size and morphology dependence of the SPR peak positions of Ag nanoparticles have been extensively discussed in some independent but detailed theoretical works on the metallic particles’ symmetry [47,48]. These works have shown that for uniformly distributed particles, strongly pronounced SPR peaks dominated the optical spectra while broadened peaks with less intensity are prevalent for particles with inconsistent symmetry. Here, the observed SPR peaks are centered within 395–418 nm for the various implantation fluences (Figure 5b). The fluence dependence of the SPR peaks and a summary of this dependency are presented in Figure 5c and Table 2, respectively.
The optical band gaps of the pristine and irradiated amorphous carbon films were determined using the Tauc’s relation given in Equation (1). According to this relation, the fundamental absorption edge plays central roles in the determination of the optical band gap for both direct and indirect interband electronic transitions in the material such that the absorption coefficient (α) as a function of photon energy ( h υ ) is given by [49].
( α h υ ) 1 r = A ( h υ E g )
where A is a constant, h υ defines the photon energy, E g , is the optical band gap energy of the material which represents the energy difference between the valence and conduction bands, respectively, while r is an index having values between 1 2 and 3 depending on the nature of the interband electronic transitions. A plot of ( α h υ ) 1 r versus h υ yields a curve whose extrapolation in the linear portion to the h υ axis (i.e., α = 0 ) gives the optical band gap energy. In this research, the value of r is taken as 2 due to the amorphous nature of the carbon matrix [50].
The Tauc plots in Figure 6 show significant decrease in the optical gap of the films from 1.79 eV for pristine a-C to 1.41 eV for the lowest fluence nanocomposite. A similar trend (i.e., red shifting) has been reported for sp3-rich diamond-like amorphous carbon films doped with varying concentrations of Ag nanoparticles; optical bang gap decreased from 2.55 eV to 1.95 eV [50,51]. This nanoparticle effect is explained based on the carbon sp2 cluster model, by Robertson [52], according to which the bonds in amorphous carbon contain mixtures of sp2 and sp3 bonds such that the sp2 sites form graphitic clusters which are embedded in the sp3 bonded matrix. Relating this model with the suggestion by Robertson and O’Reilly [53] that the π bonds of amorphous carbon are much weaker than the σ bonds, it would imply that the implanted Ag ions will sit in the vicinity of the sp2 sites of weaker π bonds than they would in the vicinity of the sp3 sites of stronger σ bonds. This is because, even as the local electrons in the π bonds are loosely bound together, they would not react with the silver atoms due to collective repulsive effect of the contributing valence electrons of Ag ions resulting in the shifting of sp2 cluster towards the Fermi energy level. In another view, increasing the fluence of Ag results in a more pronounced NP particle aggregation as observed from TEM micrographs of the nanocomposites. The sitting of metal particles occurs on both ends of the energy gap (i.e., the occupied π and unoccupied π* states) linked to the sp2 sites [54] so that the collective effect of the implanted Ag NPs, on the sp2 cluster, becomes enormous in terms of cluster shifting or size increase. In either case, the Fermi energy level is distorted (i.e., reduced in size) and consequently reducing the effective optical band gap of the material.
One of the standards used in measuring the inhomogeneous disorder in amorphous systems is the Urbach energy, E u [55]. The Urbach energy (also called the Urbach parameter) describes the tendency of an amorphous system to convert the characteristic weak bonds in its natural disorder into defects, often described as defect density [55]. The optical absorption coefficient is related to the Urbach parameter [56] as follows;
ln α = 1 E u h υ + ln α 0
A plot of ln α versus photon energy ( h υ ) in Equation (2) was used to determine the Urbach energy, of the nanocomposite by evaluating the inverse of each slope along the linear portions of the respective curves. Figure 7a,b show the Urbach plots for pristine and Ag irradiated a-C films. Respective values of E u were observed to increase in proportion to the increasing fluence of Ag NPs; from 0.01 eV for the pristine film to 12.0 eV for the nanocomposite with the highest irradiation fluence. An increase in E u values demonstrates usefulness in the probing disorder [57] and is attributed to cluster size distribution that helps in evaluating the optical response (particularly absorption) due to defect states in amorphous carbon nanostructures [58]. To this end, absorption edge generation at the extremes of the band gap energy could be attributed to either exciton-phonon or electron-phonon interaction influenced by the Ag ions [57]. The stronger the interaction, the higher the Urbach energy values and more bands’ bending leading to reductions in the optical band gap. In order words, increasing the fluence of Ag nanoparticles increases the Urbach energy and, by extension, reduces the optical band gap energy.

4. Conclusions

The ability of carbon to exist in different stand-alone allotropes makes it an interesting research material. The use of noble metal nanoparticles for property modification of carbon based materials shows promise for research and industrial applications. Accelerator based ion implantation, having an edge over conventional chemical deposition methods, served as an excellent tool in producing carbon nanocomposites with improved properties. In this paper, optical characterization of Ag implanted amorphous carbon films were conducted. The Ag incorporation induced substitutional defects which distorted the materials electronic structure thereby leading to changes in the overall optical transparency and optical band gap. The optical band gap decreases from 1.79 eV to 1.41 eV while Urbach energy increases from 0.01 eV to 12.0 eV. A potential advantage of this tunable band gap can be taken by adequate control of nanoparticle doping for advanced nanoscale materials research and for optimization of applications in areas such as surface coatings and as functional materials for solar cell efficiency enhancement.

Author Contributions

S.R.N. and A.I. conceived the idea of the study, designed and coordinated the experiments; A.I. coordinated the Ion implantation, Raman measurements, TEM measurements, AFM tests, UV-visible absorption measurements and data analysis. Both authors interpreted and discussed the results and critically reviewed/edited the manuscript.

Funding

A.I. is supported financially by the NEEDs Assessment Intervention Fund (2014), Ahmadu Bello University, Zaria, Nigeria and S.R.N. received support from the DST-NRF Center of Excellence in Strong Materials, Wits University, South Africa.

Acknowledgments

The authors would like to thank A.S. Miller, iThemba Labs Gauteng, South Africa for the ion implantation session; R. Erasmus, Wits University, South Africa for the Raman measurements and Manoko Maubane-Nkadimeng at the Microscopy and Microanalysis Unit (MMU), Wits University, South Africa for the TEM and AFM sessions.

Conflicts of Interest

The authors declare no conflict of interest. The funding sponsors had no role in the design of the study; in all experimental procedures; in writing the manuscript, and in the decision to publish the results.

References

  1. Karthik, P.; Himaja, A.; Singh, S.P. Carbon-allotropes: Synthesis methods, applications and future perspectives. Carbon Lett. 2014, 15, 219–237. [Google Scholar] [CrossRef]
  2. Kroto, H. Space, Stars, C60, and Soot. Science 1986, 242, 1139–1145. [Google Scholar] [CrossRef] [PubMed]
  3. Dai, L.; Chang, D.W.; Baek, J.-B.; Lu, W. Carbon nanomaterials for advanced energy conversion and storage. Small 2012, 8, 1130–1166. [Google Scholar] [CrossRef] [PubMed]
  4. Kumar, P.; Kumar, A. Carrier type modulation in current annealed graphene layers. Appl. Phys. Lett. 2014, 104, 083517. [Google Scholar] [CrossRef] [Green Version]
  5. Singhal, R.; Pivin, J.; Chandra, R.; Avasthi, D. Ion irradiation studies of silver/amorphous carbon nanocomposite thin film. Surf. Coat. Technol. 2013, 229, 50–54. [Google Scholar] [CrossRef]
  6. Stepanov, A.L. Synthesis of silver nanoparticles in dielectric matrix by ion implantation: A review. Rev. Adv. Mater. Sci. 2010, 26, 1–29. [Google Scholar]
  7. Zhou, L.; Zhang, C.; Yang, Y.; Li, B.; Zhang, L.; Fu, Y.; Zhang, H. Formation of Au nanoparticles in sapphire by using Ar ion implantation and thermal annealing. Nucl. Instrum. Methods Phys. Res. Sect. B Beam Interact. Mater. Atoms 2009, 267, 58–62. [Google Scholar] [CrossRef]
  8. Choi, H.W.; Dauskardt, R.H.; Lee, S.-C.; Lee, K.-R.; Oh, K.H. Characteristic of silver doped DLC films on surface properties and protein adsorption. Diam. Relat. Mater. 2008, 17, 252–257. [Google Scholar] [CrossRef]
  9. Mak, K.F.; Ju, L.; Wang, F.; Heinz, T.F. Optical spectroscopy of graphene: From the far infrared to the ultraviolet. Solid State Commun. 2012, 152, 1341–1349. [Google Scholar] [CrossRef]
  10. Laidani, N.; Bartali, R.; Gottardi, G.; Anderle, M.; Cheyssac, P. Optical absorption parameters of amorphous carbon films from Forouhi-Bloomer and Tauc-Lorentz models: A comparative study. J. Phys. Condens. Matter 2009, 20, 015216. [Google Scholar] [CrossRef]
  11. Mahmudin, L.; Suharyadi, E.; Utomo, A.B.S.; Abraha, K. Optical Properties of Silver Nanoparticles for Surface Plasmon Resonance (SPR)-Based Biosensor Applications. J. Mod. Phys. 2015, 6, 1071–1076. [Google Scholar] [CrossRef] [Green Version]
  12. Candelaria, S.L.; Shao, Y.; Zhou, W.; Li, X.; Xiao, J.; Zhang, J.-G.; Wang, Y.; Liu, J.; Li, J.; Cao, G. Nanostructured carbon for energy storage and conversion. Nano Energy 2012, 1, 195–220. [Google Scholar] [CrossRef]
  13. Iwaki, M. Progress in ion implantation technology for metal surface treatments and other related topics. In Proceedings of the 1998 International Conference on Ion Implantation Technology. Proceedings (Cat. No. 98EX144), Kyoto, Japan, 22–26 June 1998; Volume 2, pp. 824–826. [Google Scholar]
  14. Amir, O.; Kalish, R. Properties of nitrogen-doped amorphous hydrogenated carbon films. J. Appl. Phys. 1991, 70, 4958–4962. [Google Scholar] [CrossRef]
  15. Amir, O.; Kalish, R. Doping of amorphous-hydrogenated carbon films by ion implantation. Diam. Relat. Mater. 1992, 1, 364–368. [Google Scholar] [CrossRef]
  16. Freire, F.; Achete, C.; Mariotto, G. Nitrogen implantation into amorphous carbon films: XPS, AES and Raman analyses. Nucl. Inst. Methods Phys. Res. Beam. Interact. Mater. Atoms 1995, 99, 606–609. [Google Scholar] [CrossRef]
  17. Jun, Z.; Hui, Z.; Zhi-Hua, W.; Rui-Peng, S. Structure and mechanical properties of tungsten-containing hydrogenated diamond like carbon coatings for space applications. Phys. Procedia 2011, 18, 245–250. [Google Scholar] [CrossRef] [Green Version]
  18. Dimigen, H.; Hubsch, H.; Memming, R. Tribological and electrical properties of metal-containing hydrogenated carbon films. Appl. Phys. Lett. 1987, 50, 1056–1058. [Google Scholar] [CrossRef]
  19. Gerhards, I.; Ronning, C.; Vetter, U.; Hofsäss, H.; Gibhardt, H.; Eckold, G.; Li, Q.; Lee, S.; Huang, Y.; Seibt, M. Ion beam synthesis of amorphous carbon thin films containing metallic nanoclusters. Surf. Coat. Technol. 2002, 158, 114–119. [Google Scholar] [CrossRef]
  20. Constantinou, M.; Nikolaou, P.; Koutsokeras, L.; Avgeropoulos, A.; Moschovas, D.; Varotsis, C.; Patsalas, P.; Kelires, P.; Constantinides, G. Metal (Ag/Ti)-Containing Hydrogenated Amorphous Carbon Nanocomposite Films with Enhanced Nanoscratch Resistance: Hybrid PECVD/PVD System and Microstructural Characteristics. Nanomaterials 2018, 8, 209. [Google Scholar] [CrossRef]
  21. Grischke, H.; Bewilogua, M.; Dimigen, K. Preparation, properties and structure of metal containing amorphous hydrogenated carbon films. Mater. Manufacur. Process. 2007, 8, 407–417. [Google Scholar] [CrossRef]
  22. Szunerits, S.; Castel, X.; Boukherroub, R. Surface Plasmon Resonance Investigation of Silver and Gold Films Coated with Thin Indium Tin Oxide Layers: Influence on Stability and Sensitivity. J. Phys. Chem. C 2008, 112, 15813–15817. [Google Scholar] [CrossRef]
  23. Raza, S.; Yan, W.; Stenger, N.; Wubs, M.; Mortensen, N.A. Blueshift of the surface plasmon resonance in silver nanoparticles: Substrate effects. Opt. Express 2013, 21, 27344–27355. [Google Scholar] [CrossRef] [PubMed]
  24. Singhal, R.; Agarwal, D.C.; Mishra, Y.K.; Singh, F.; Pivin, J.C.; Chandra, R.; Avasthi, D.K. Electronic excitation induced tuning of surface plasmon resonance of Ag nanoparticles in fullerene C70 matrix. J. Phys. D Appl. Phys. 2009, 42, 155103. [Google Scholar] [CrossRef]
  25. Gong, Y.; Zhou, Y.; He, L.; Xie, B.; Song, F.; Han, M.; Wang, G. Systemically tuning the surface plasmon resonance of high-density silver nanoparticle films. Eur. Phys. J. D 2013, 67, 87. [Google Scholar] [CrossRef]
  26. Lee, K.-C.; Lin, S.-J.; Lin, C.-H.; Tsai, C.-S.; Lu, Y.-J. Size effect of Ag nanoparticles on surface plasmon resonance. Surf. Coat. Technol. 2008, 202, 5339–5342. [Google Scholar] [CrossRef]
  27. Xiang, X.; Zu, X.T.; Zhu, S.; Wei, Q.M.; Zhang, C.F.; Sun, K.; Wang, L.M. ZnO nanoparticles embedded in sapphire fabricated by ion implantation and annealing. Nanotechnology 2006, 17, 2636–2640. [Google Scholar] [CrossRef] [PubMed] [Green Version]
  28. Mishra, S.; Bhaumik, S.; Panda, J.K.; Ojha, S.; Dhar, A.; Kabiraj, D.; Roy, A. Strain buildup in GaAs due to 100 MeV Ag ion irradiation. Nucl. Instrum. Methods Phys. Res. Sect. B Beam Interact. Mater. Atoms 2013, 316, 192–197. [Google Scholar] [CrossRef]
  29. Singhal, R.; Agarwal, D.; Mishra, Y.; Mohapatra, S.; Avasthi, D.; Chawla, A.; Chandra, R.; Pivin, J. Swift heavy ion induced modifications of optical and microstructural properties of silver-fullerene C60 nanocomposite. Nucl. Instrum. Methods Phys. Res. Sect. B Beam Interact. Mater. Atoms 2009, 267, 1349–1352. [Google Scholar] [CrossRef]
  30. Yaremchuk, I.; Tamulevičiene, A.; Tamulevičius, T.; Šlapikas, K.; Balevičius, Z.; Tamulevičius, S. Modeling of the plasmonic properties of DLC-Ag nanocomposite films. Phys. Status Solidi Appl. Mater. Sci. 2014, 211, 329–335. [Google Scholar] [CrossRef]
  31. Ziegler, J.F.; Ziegler, M.; Biersack, J. SRIM—The stopping and range of ions in matter (2010). Nucl. Instrum. Methods Phys. Res. Sect. B Beam Interact. Mater. Atoms 2010, 268, 1818–1823. [Google Scholar] [CrossRef]
  32. Nemanich, R.J.; Solin, S. Observation of an anomolously sharp feature in the 2nd order Raman spectrum of graphite. Solid State Commun. 1977, 23, 417–420. [Google Scholar] [CrossRef]
  33. Wang, Y.D.; Alsmeyer, C.; McCreery, R.L. Raman-Spectroscopy of Carbon Materials—Structural Basis of Observed Spectra. Chem. Mater. 1990, 2, 557–563. [Google Scholar] [CrossRef]
  34. Nemanich, R.J.; Solin, S.A. First- and second-order Raman scattering from finite-size crystals of graphite. Phys. Rev. B 1979, 20, 392–401. [Google Scholar] [CrossRef]
  35. Schwan, J.; Ulrich, S.; Batori, V.; Ehrhardt, H.; Silva, S.R.P. Raman spectroscopy on amorphous carbon films. J. Appl. Phys. 1996, 80, 440–447. [Google Scholar] [CrossRef] [Green Version]
  36. Dennison, J.R.; Holtz, M.; Swain, G. Raman Spectroscopy of Carbon Materials. Spectroscopy. 1996, 11, 38–45. [Google Scholar]
  37. Ferrari, A.C.; Robertson, J. Raman spectroscopy of amorphous, nanostructured, diamond-like carbon, and nanodiamond. Philos. Trans. R. Soc. A Math. Phys. Eng. Sci. 2004, 362, 2477–2512. [Google Scholar] [CrossRef] [PubMed]
  38. Raju, N.R.C.; Kumar, K.J.; Subrahmanyam, A.; Champion, P.M.; Ziegler, L.D. Silver oxide (AgO) thin films for Surface Enhanced Raman Scattering (SERS) studies. AIP Conf. Proc. 2010, 1267, 1005–1006. [Google Scholar]
  39. Débarre, A.; Jaffiol, R.; Julien, C.; Tchénio, P.; Mostafavi, M. Raman scattering from single Ag aggregates in presence of EDTA. Chem. Phys. Lett. 2004, 386, 244–247. [Google Scholar] [CrossRef]
  40. Sharma, P.; Singhal, R.; Vishnoi, R.; Agarwal, D.C.; Banerjee, M.K.; Chand, S.; Kanjilal, D.; Avasthi, D.K. Effect of Ag Ion Implantation on SPR of Cu-C60 Nanocomposite Thin Film. Plasmonics 2017, 13, 669–679. [Google Scholar] [CrossRef]
  41. Maisels, A.; Fissan, H.; Stappert, S.; Kruis, F.E.; Nanda, K.K. Higher Surface Energy of Free Nanoparticles. Phys. Rev. Lett. 2003, 91, 106102. [Google Scholar]
  42. Lu, H.M.; Jiang, Q. Size-Dependent Surface Energies of Nanocrystals. J. Phys. Chem. B 2004, 108, 5617–5619. [Google Scholar] [CrossRef]
  43. Medasani, B.; Park, Y.H.; Vasiliev, I. Theoretical study of the surface energy, stress, and lattice contraction of silver nanoparticles. Phys. Rev. B 2007, 75, 235436. [Google Scholar] [CrossRef]
  44. Vollath, D.; Fischer, F.D.; Holec, D. Surface energy of nanoparticles—Influence of particle size and structure. Beilstein J. Nanotechnol. 2018, 9, 2265–2276. [Google Scholar] [CrossRef] [PubMed]
  45. Noguez, C. Surface plasmons on metal nanoparticles: The influence of shape and physical environment. J. Phys. Chem. C 2007, 111, 3606–3619. [Google Scholar] [CrossRef]
  46. Eustis, S.; El-Sayed, M.A. Why gold nanoparticles are more precious than pretty gold: Noble metal surface plasmon resonance and its enhancement of the radiative and nonradiative properties of nanocrystals of different shapes. Chem. Soc. Rev. 2006, 35, 209–217. [Google Scholar] [CrossRef] [PubMed]
  47. Slistan-Grijalva, A.; Herrera-Urbina, R.; Rivas-Silva, J.; Avalos-Borja, M.; Castillón-Barraza, F.; Posada-Amarillas, A. Classical theoretical characterization of the surface plasmon absorption band for silver spherical nanoparticles suspended in water and ethylene glycol. Phys. E Low-Dimens. Syst. NanoStruct. 2005, 27, 104–112. [Google Scholar] [CrossRef]
  48. González, A.L.; Noguez, C. Influence of Morphology on the Optical Properties of Metal Nanoparticles. J. Comput. Theor. Nanosci. 2007, 4, 1249–1252. [Google Scholar] [CrossRef]
  49. Tauc, J.; Grigorovici, R.; Vancu, A. Optical properties and electronic structures of amorphous germanium. Phys. Status Solidi 1966, 15, 627–637. [Google Scholar] [CrossRef]
  50. Ahmed, S.F.; Moon, M.-W.; Lee, K.-R. Enhancement of electron field emission property with silver incorporation into diamond like carbon matrix. Appl. Phys. Lett. 2008, 92, 193502. [Google Scholar] [CrossRef]
  51. Ahmed, S.F.; Moon, M.-W.; Lee, K.-R. Effect of silver doping on optical property of diamond like carbon films. Thin Solid Films 2009, 517, 4035–4038. [Google Scholar] [CrossRef]
  52. Robertson, J. Electronic Structure and Bonding of a-C:H. Mater. Sci. Forum 1990, 52, 125–150. [Google Scholar] [CrossRef]
  53. Robertson, J.; O’Reilly, E. Electronic and atomic structure of amorphous carbon. Phys. Rev. B 1987, 35, 2946–2957. [Google Scholar] [CrossRef]
  54. Robertson, J. Gap states in diamond-like amorphous carbon. Philos. Mag. B Phys. Condens. Matter Stat. Mech. Electron. Opt. Magn. Prop. 1997, 76, 335–350. [Google Scholar] [CrossRef]
  55. Studenyak, I.; Kranj, M.; Kurik, M. Urbach Rule in Solid State Physics. Int. J. Opt. Appl. 2014, 4, 76–83. [Google Scholar]
  56. Urbach, F. The Long-Wavelength Edge of Photographic Sensitivity and of the Electronic Absorption of Solids. Phys. Rev. 1953, 92, 1324. [Google Scholar] [CrossRef]
  57. Patsalas, P. Optical properties of amorphous carbons and their applications and perspectives in photonics. Thin Solid Films 2011, 519, 3990–3996. [Google Scholar] [CrossRef]
  58. Robertson, J. Diamond-like amorphous carbon. Mater. Sci. Eng. R Rep. 2002, 37, 129–281. [Google Scholar] [CrossRef] [Green Version]
Figure 1. Raman spectra for (a) pristine a-C and (bd) Ag:a-C nanocomposites at various fluences.
Carbon 05 00045 g001
Figure 2. 2D Atomic Force Microscopy (AFM) images of (a) pristine a-C and (bd) Ag:a-C nanocomposites at varying fluence of 2.5 ions/cm2, 3.0 ions/cm2 and 3.4 × 10¹⁶ ions/cm2, respectively.
Carbon 05 00045 g002
Figure 3. Surface roughness for (a) pristine and (b) Ag irradiated a-C thin film.
Carbon 05 00045 g003
Figure 4. TEM micrograph of Ag:a-C thin films with varying fluence: sample A 2.5 × 10¹⁶ ions/cm2 (left), sample B 3.0 × 10¹⁶ ions/cm2 (center) and sample C 3.4 × 10¹⁶ ions/cm2 (right).
Carbon 05 00045 g004
Figure 5. (a) Optical absorption spectra for pristine a-C, (b) combined spectra for Ag:a-C nanocomposites and (c) dependence of surface plasmon resonance (SPR) peak position on fluence of irradiation.
Carbon 05 00045 g005aCarbon 05 00045 g005b
Figure 6. Tauc plots for (a) pristine and (b) combined Ag:a-C nanocomposites showing respective optical bang gap energies.
Carbon 05 00045 g006
Figure 7. Urbach plots for (a) pristine a-C and (b) Ag:a-C nanocomposites showing respective Urbach parameters.
Carbon 05 00045 g007
Table 1. Summary of Raman parameters for pristine and Ag irradiated amorphous carbon films.
Pristine FilmABC
G-Peak position (cm−1)1541153515441557
D-Peak position (cm−1)1360135513641380
G-Peak intensity, (cm−1)732368493895
D-Peak intensity, (cm−1)559318478930
Intensity ratio,0.760.860.971.04
FWHM (G) (±4.0)148.0151.1155.1125.9
Cluster size, (nm)5.85.14.54.2
Table 2. Summary of major optical parameters for pristine a-C and the respective Ag:a-C films.
Optical ParametersPristine FilmABC
Optical band gap energy, (eV) (±0.03)1.791.711.481.41
Urbach energy, (eV) (±0.2)0.019.710.912.0
SPR peak position, (nm)-418401395

