Article

Flexible Carbon Aerogels

Institute of Materials Research, German Aerospace Center, Linder Höhe, Cologne 51147, Germany
*
Author to whom correspondence should be addressed.
Submission received: 24 June 2016 / Revised: 17 August 2016 / Accepted: 18 August 2016 / Published: 6 September 2016
(This article belongs to the Special Issue Graphene Aerogels)

Abstract

:
Carbon aerogels are highly porous materials with a large inner surface area. Due to their high electrical conductivity they are excellent electrode materials in supercapacitors. Their brittleness, however, imposes certain limitations in terms of applicability. In that context, novel carbon aerogels with varying degree of flexibility have been developed. These highly porous, light aerogels are characterized by a high surface area and possess pore structures in the micrometer range, allowing for a reversible deformation of the aerogel network. A high ratio of pore size to particle size was found to be crucial for high flexibility. For dynamic microstructural analysis, compression tests were performed in-situ within a scanning electron microscope allowing us to directly visualize the microstructural flexibility of an aerogel. The flexible carbon aerogels were found to withstand between 15% and 30% of uniaxial compression in a reversible fashion. These findings might stimulate further research and new application fields directed towards flexible supercapacitors and batteries.

Graphical Abstract

1. Introduction

Carbon aerogels are open-porous materials with a three-dimensional micro- and mesoporous network. They can be obtained by carbonization of organic aerogels under an inert atmosphere, for instance those consisting of nitrogen or argon [1]. Due to many excellent properties, such as a large surface area, a tunable, high porosity, and a low bulk density, carbon aerogels are promising materials for hydrogen storage or as a radiation adsorption material [2,3]. Combined with their high electrical conductivity, they are ideally suited for electrochemical double layer capacitors [4,5,6,7].
Organic aerogels are generally synthesized via sol-gel processes using various organic precursors such as resorcinol-formaldehyde [8], cresol-resorcinol-formaldehyde [9], and others [10]. Organic resorcinol-formaldehyde (RF) aerogels can be produced via polycondensation of resorcinol and formaldehyde in water treated with a base (as pioneered by Pekala [11]) or acid (as initially described by the Ehrburger-Dolle and Merzbacher groups, respectively [12,13]). Several research teams have shown the influence of the pH value of the sol [7,14], the molar ratio of resorcinol to catalyst (R/Cat) [15], the catalyst type [16,17], and the drying method [18,19] on the morphology of RF aerogels and, consequently, of carbon aerogels. Moreover, the temperature of carbonization and its duration influences the final microstructure [20,21,22]. It has been reported that the significant shrinkage during carbonization leads to an increase in surface area and in the bulk density.
Pekala et al. investigated the influence of microstructure on the mechanical properties of carbon aerogels [23]. They observed that the compressive modulus and the compressive strength of aerogels are both strongly dependent on the bulk density. The observation that the stiffness of carbon aerogels is ten times higher than that of their uncarbonized RF analogs was explained by an improved degree of interconnection between particles during carbonization. While compressive moduli were in the range of 0.1–20 MPa, the corresponding carbon aerogels exhibited a compressive modulus that was 50 times higher.
In the literature, carbon aerogels are consistently described as robust, glassy, and brittle. They are reported to possess a great stiffness and strength, yet no ductility. They are commonly prepared using brittle RF precursors. Our research group has recently succeeded in preparing RF gels with varying degree of stiffness, spanning from brittle, to rubber-like, to super flexible [24,25]. Innovative flexible devices such as touch screens, roll-up displays, implantable medical devices, and wearable sensors induce a rapid development of flexible electronics. The flexibility of energy storage devices enables forming, shaping, and mechanical stability of the components of electronic tools [26]. Due to high interest in flexible electrode materials and new demands on energy storage systems [27], an improvement to provide flexible carbon aerogels is of great importance. In the present paper, we report our studies on the carbonization of flexible RF aerogels. The flexibility of the resulting carbon aerogels is investigated by in-situ compression within a scanning electron microscope (SEM). The technique allows the in-situ observation of the structural evolution of the porous aerogel network during loading-unloading. The group of Sun et al. utilized this method to visualize the compression-release process of carbon aerogels produced from carbon nanotubes (CNTs) [28]. They showed the macroscopic changes of the aerogel samples. In this study we visualize, with the help of this technique, the deformation of individual pores (pore size in the range of 2–20 µm) in the 3D network.

2. Results and Discussion

2.1. Classification of Aerogels

For our study we produced two types of RF aerogels and pyrolized them to carbon aerogels. The first type is termed low-flexible (lf-RF) RF aerogel and its carbonized form lf-C (low-flexible carbon) aerogel. A second type, super-flexible RF (sf-RF), resulted in carbonized sf-C aerogels.

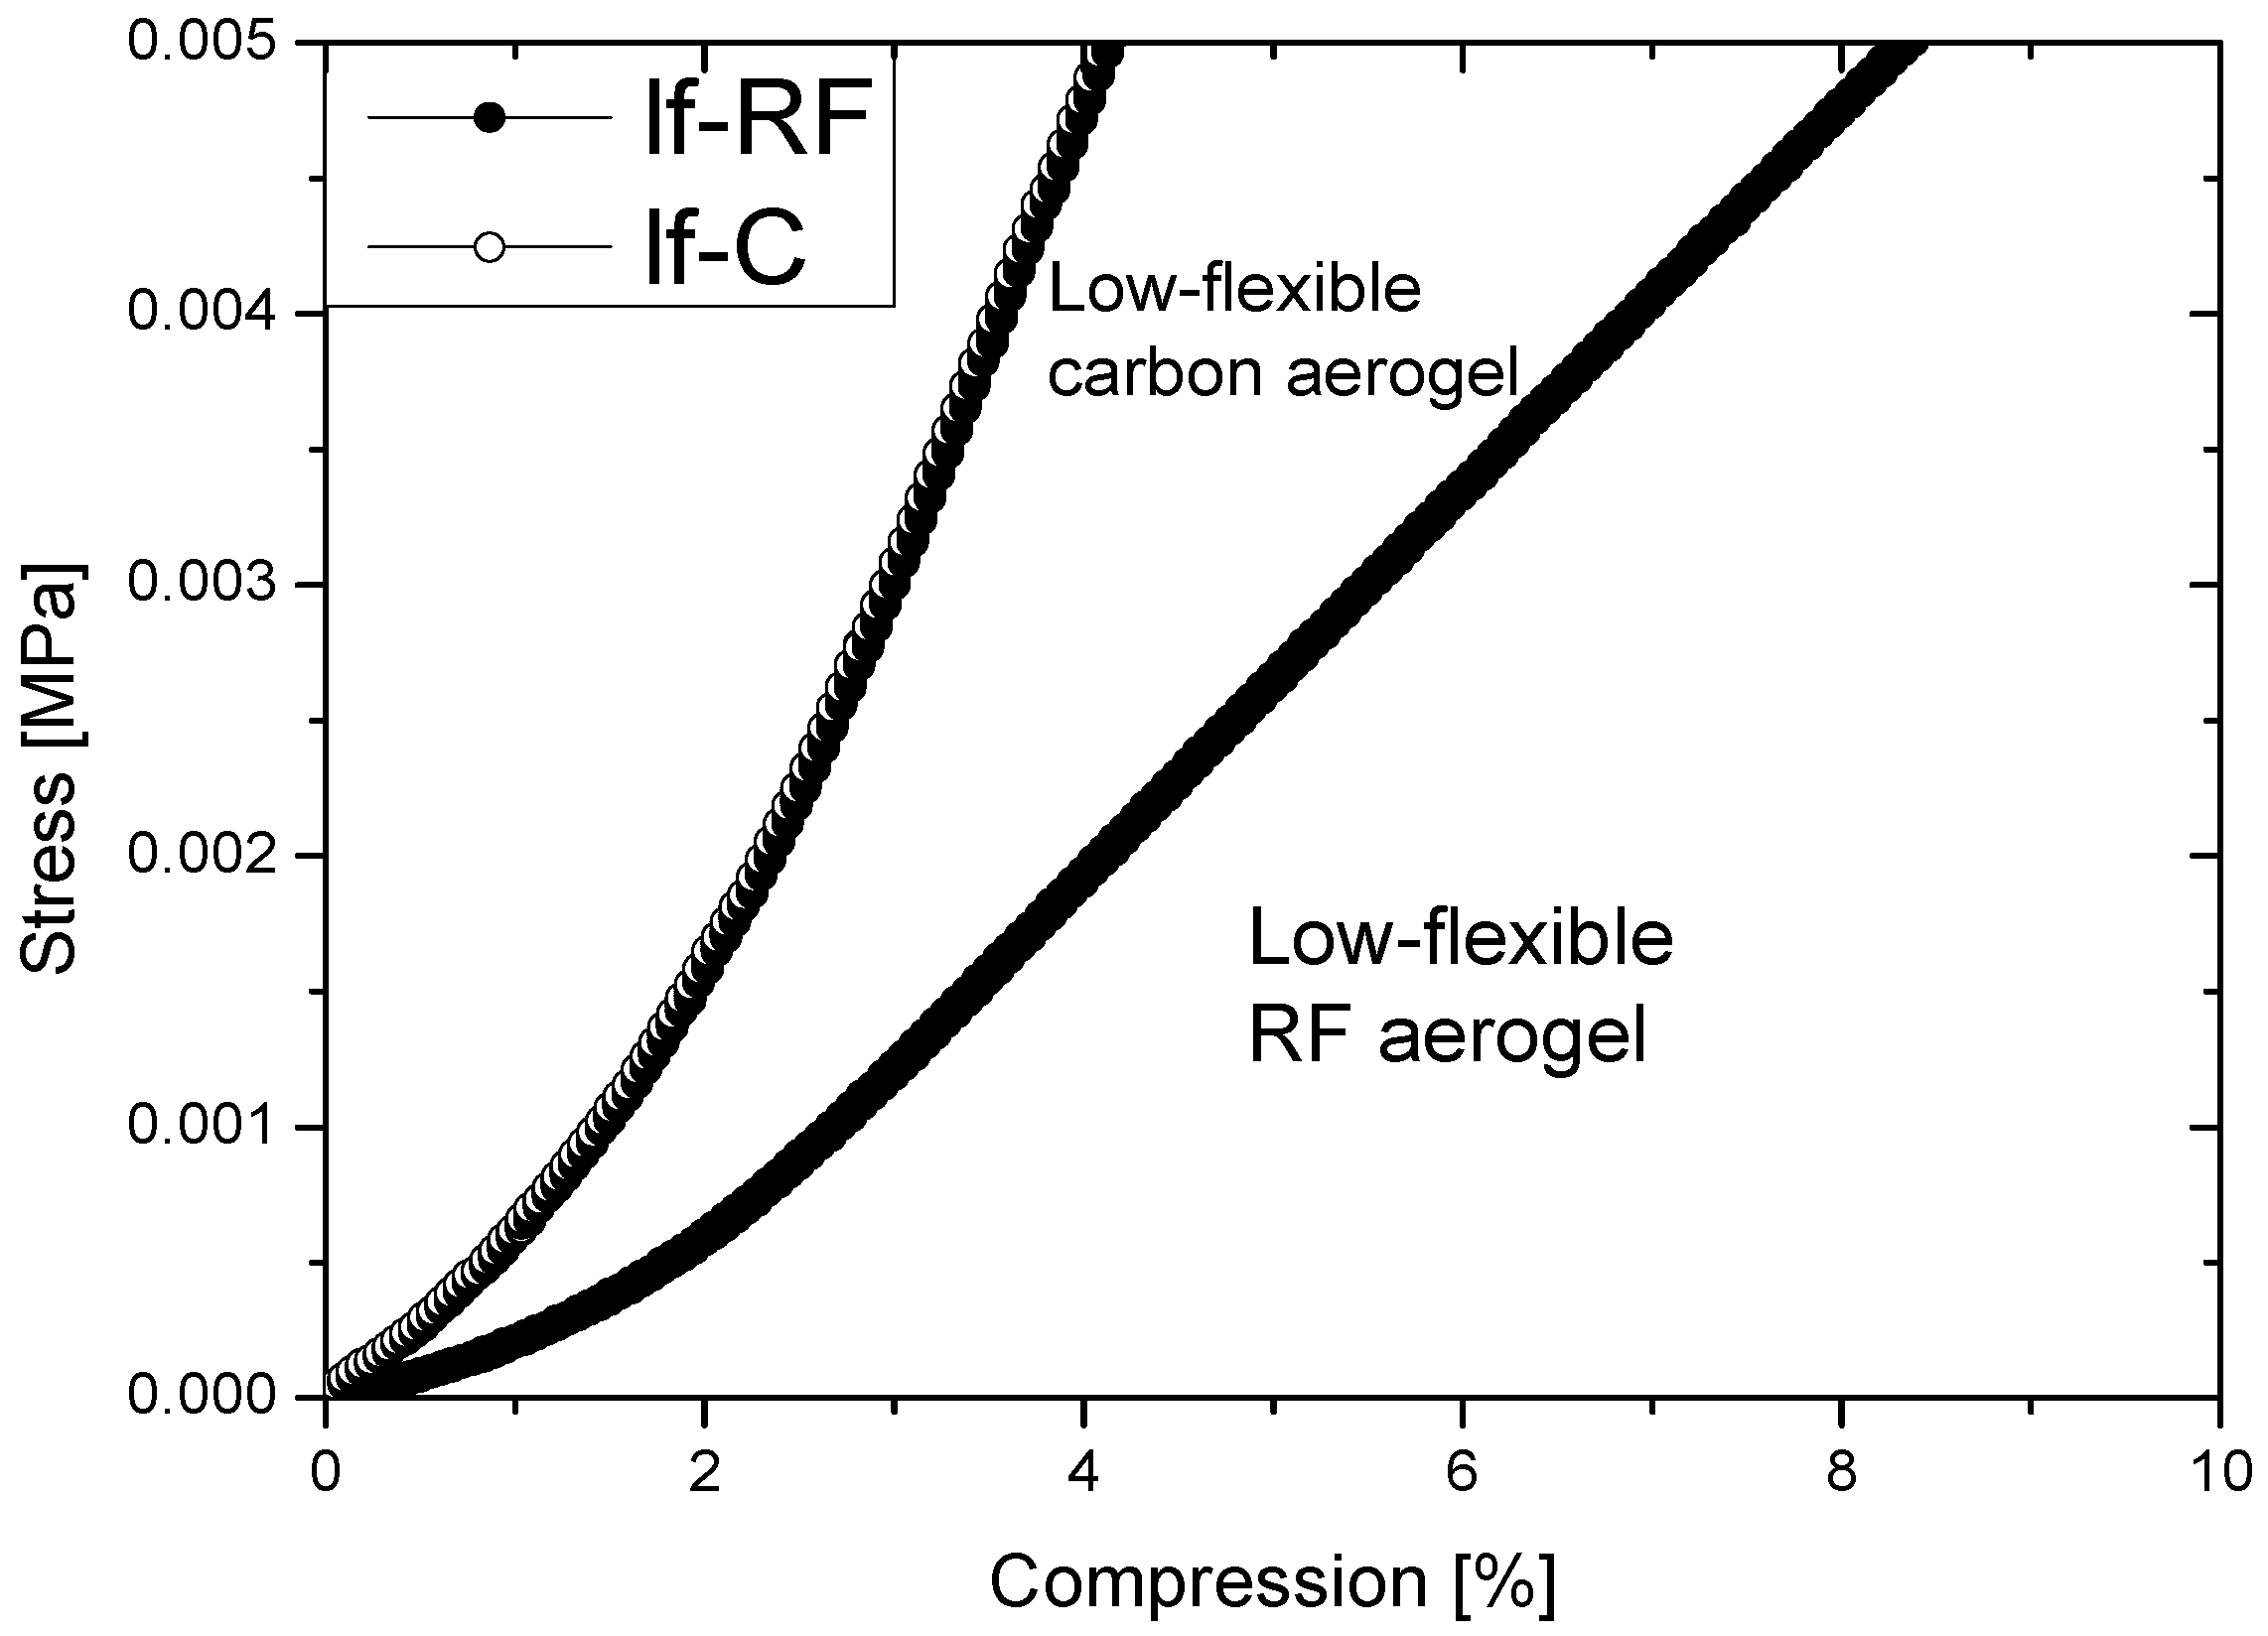
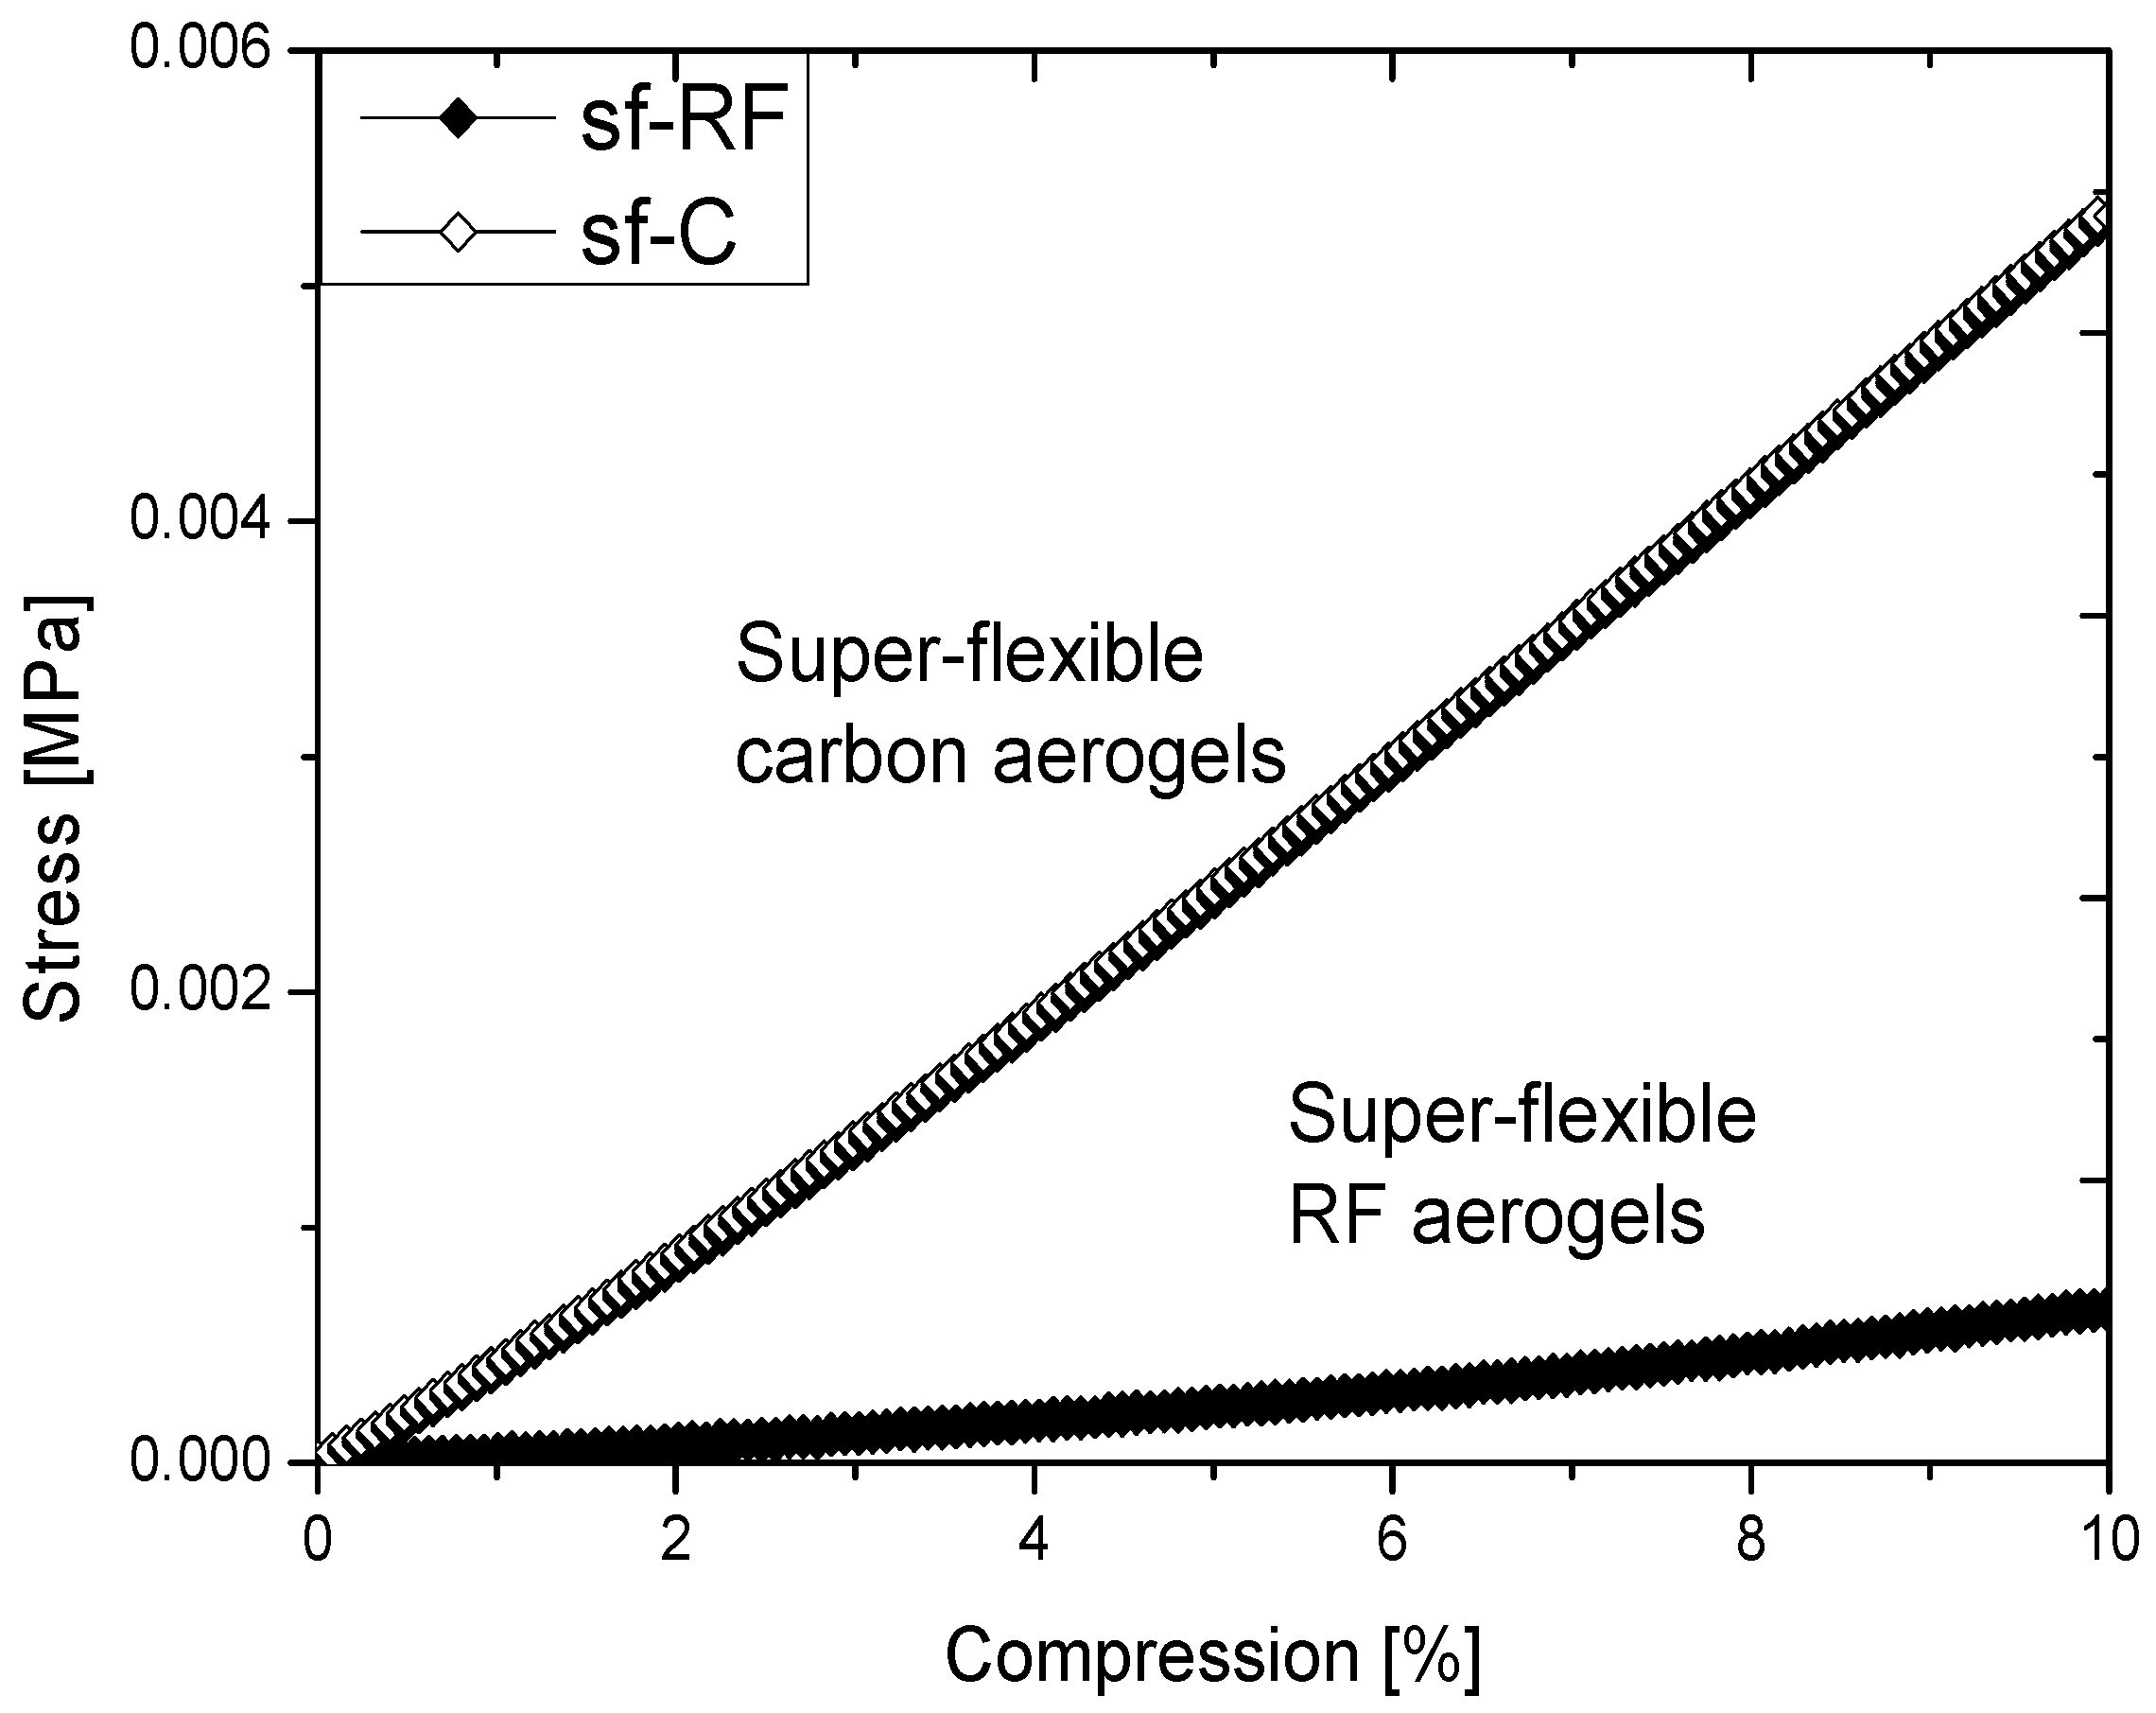
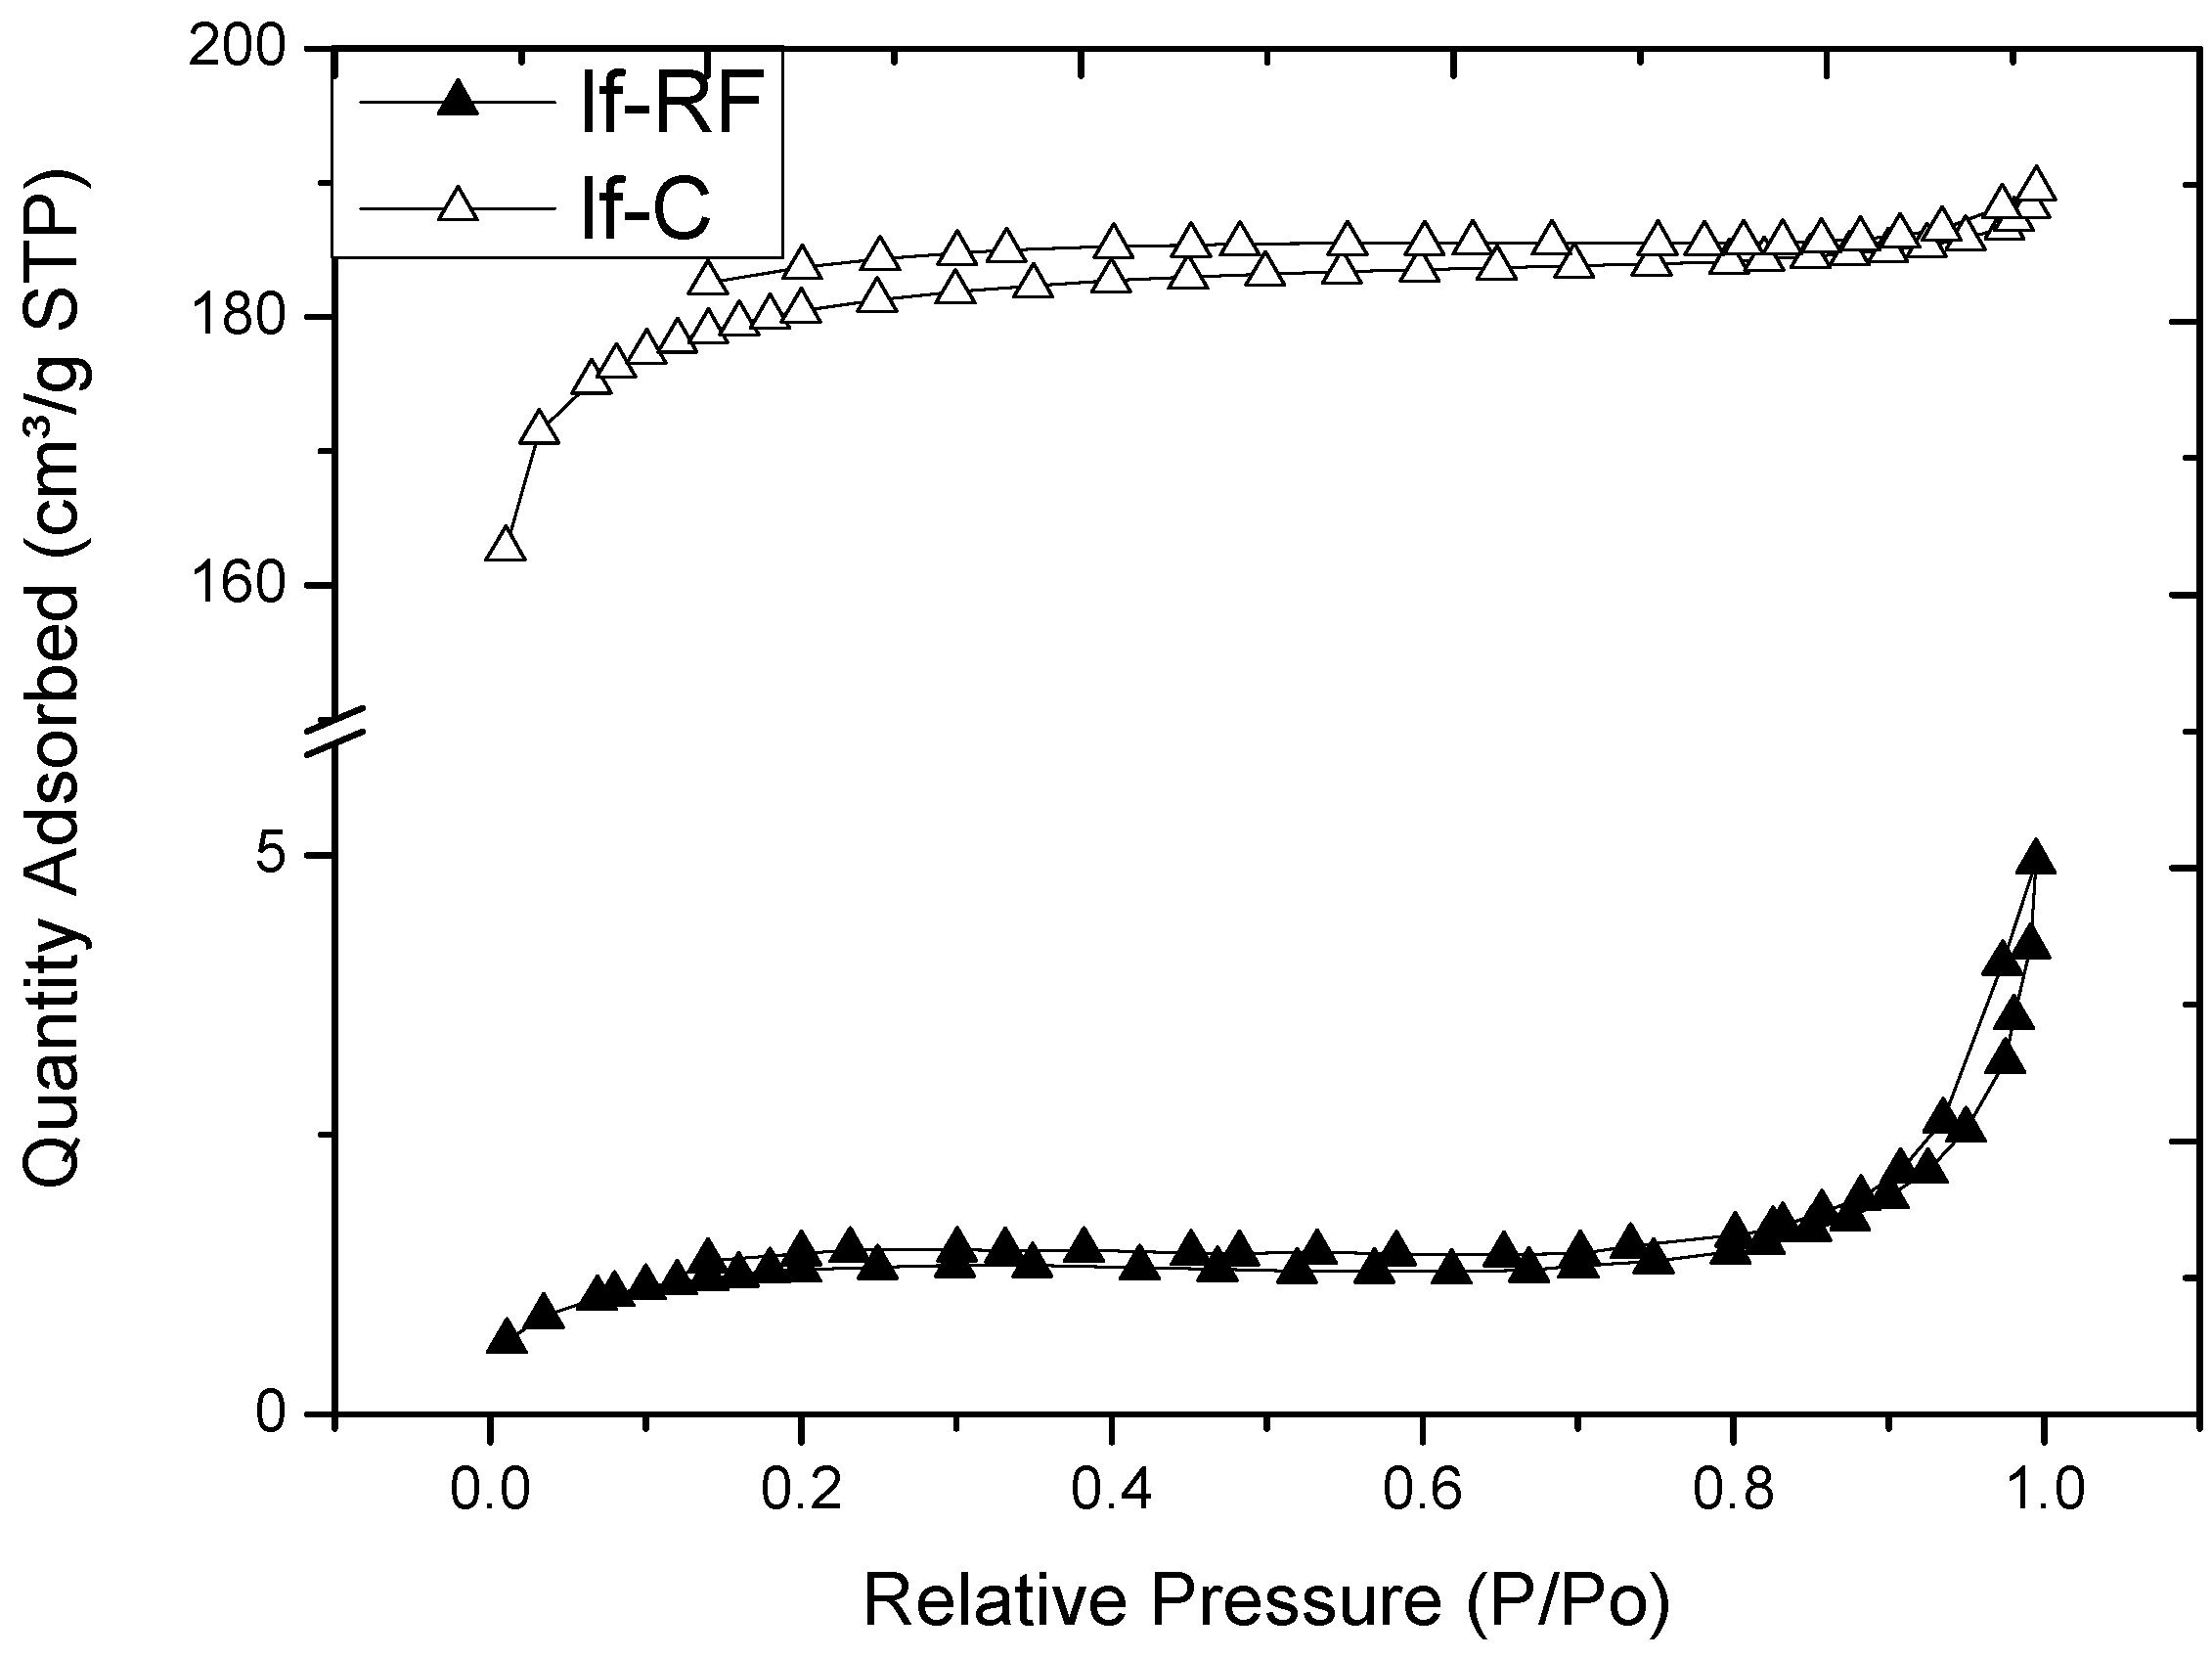
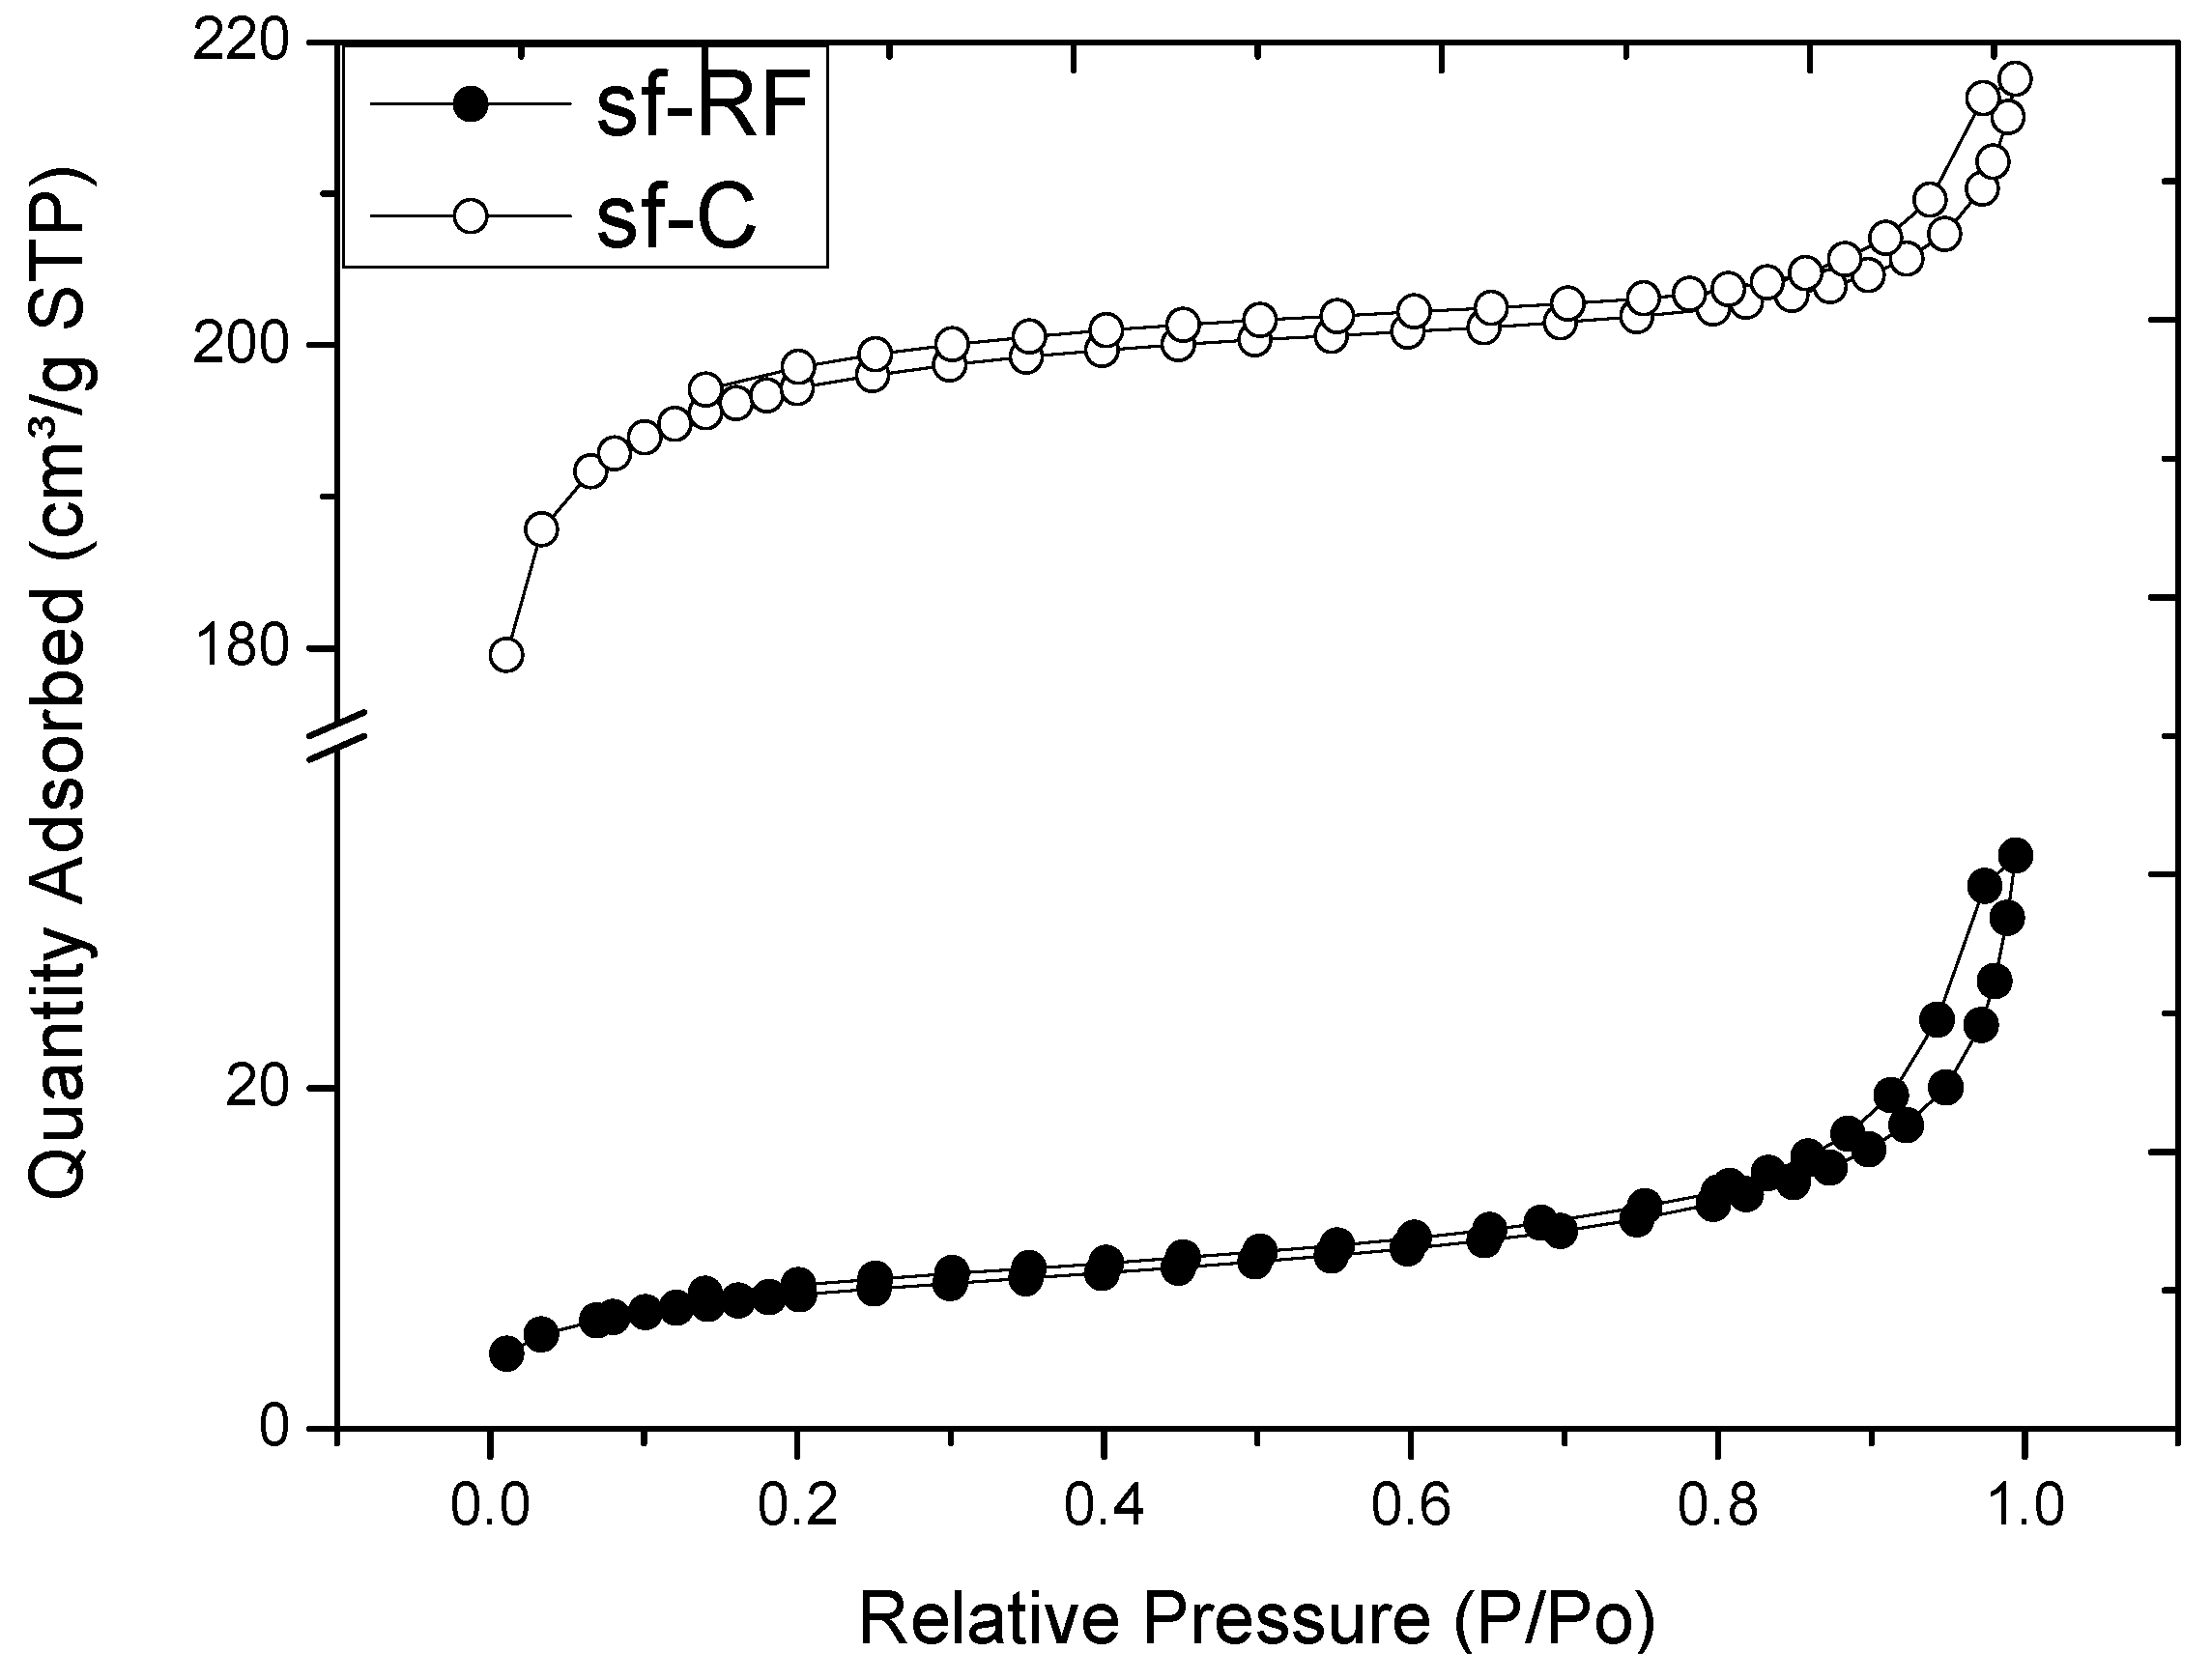
2.2. Properties of Flexible Resorcinol-Formaldehyde and Carbon Aerogels

The general properties of the aerogels produced are given in Table 1. Low density, high porosity, and low thermal conductivity distinguish the two flexible RF aerogels. Their carbonization caused a high shrinkage and a decrease in the bulk density ρb, due to a release of volatile matter, such as water, carbon dioxide, and hydrocarbons [29]. The porosity increases slightly; the specific surface area rose abruptly. The skeletal densities ρs also increased to 1.99–2.12 g·cm−3, which corresponds to a narrowing or closure of micropores and which approaches the density of pure graphite (2.25 g·cm−3) [30].
The thermal conductivity of low-flexible RF aerogels is about 6.8% higher than that of super-flexible ones. Since their solid content is identical, the difference can be caused by different heat transfer via the gaseous phase, which is characterized by the Knudsen number Kn, the ratio of the mean free path of an air molecule under given temperature and pressure conditions to the pore size [31]. The effective thermal conductivity λ eff via the gas phase is often described by a simple relation
λ eff = λ 0 1 + 2 β Kn
with λ 0 representing the diffuse thermal conductivity of the gas under standard conditions, and constant β is approximately 2 for nitrogen [32,33]. Smaller pores correspond to a higher Knudsen number, and therefore a lower heat transfer via gaseous phase. To prove our assumption, we calculated with Equations (2) and (3) the average pore size of the RF aerogels.
The specific pore volume vpore is given by
v p o r e = 1 ρ b 1 ρ s
and can be used to calculate the average pore size dav using specific surface area SBET [34]
d a v = 4 v p o r e S B E T
Average pore sizes of 8.5 µm and 1.8 µm were calculated for lf-RF and sf-RF aerogels, respectively. At room temperature and normal pressure, the mean free path of an air molecule is 69 nm, and thus we have in lf-RF a Knudsen number of 0.008 and in sf-RF a value of 0.039. Assuming β ≈ 2, we have in sf-RF aerogels a reduction of the gas thermal conductivity by around 13%, while in lf-RF aerogels this contribution is around 3%. The thermal conductivity of corresponding carbon aerogels increased slightly, probably caused by the electronic contribution. This effect was discussed by Fricke and coworkers, who showed that in the electrically well conducting carbon aerogels the electronic contribution, calculated with the Wiedemann-Franz law, is only a few percent of the phonon contribution [35]. Assuming a similar phonon contribution in the RF and C aerogels, this electronic effect could account for the difference.
The carbonization of RF aerogels led to stronger materials: their compressive moduli nearly doubled, which is in agreement with previous work [23].
The electrical conductivity of lf-C is two times higher than that of sf-C, which is in agreement with the work of Lu et al. [36]. Their results showed that electrical conductivity increases with envelope density.

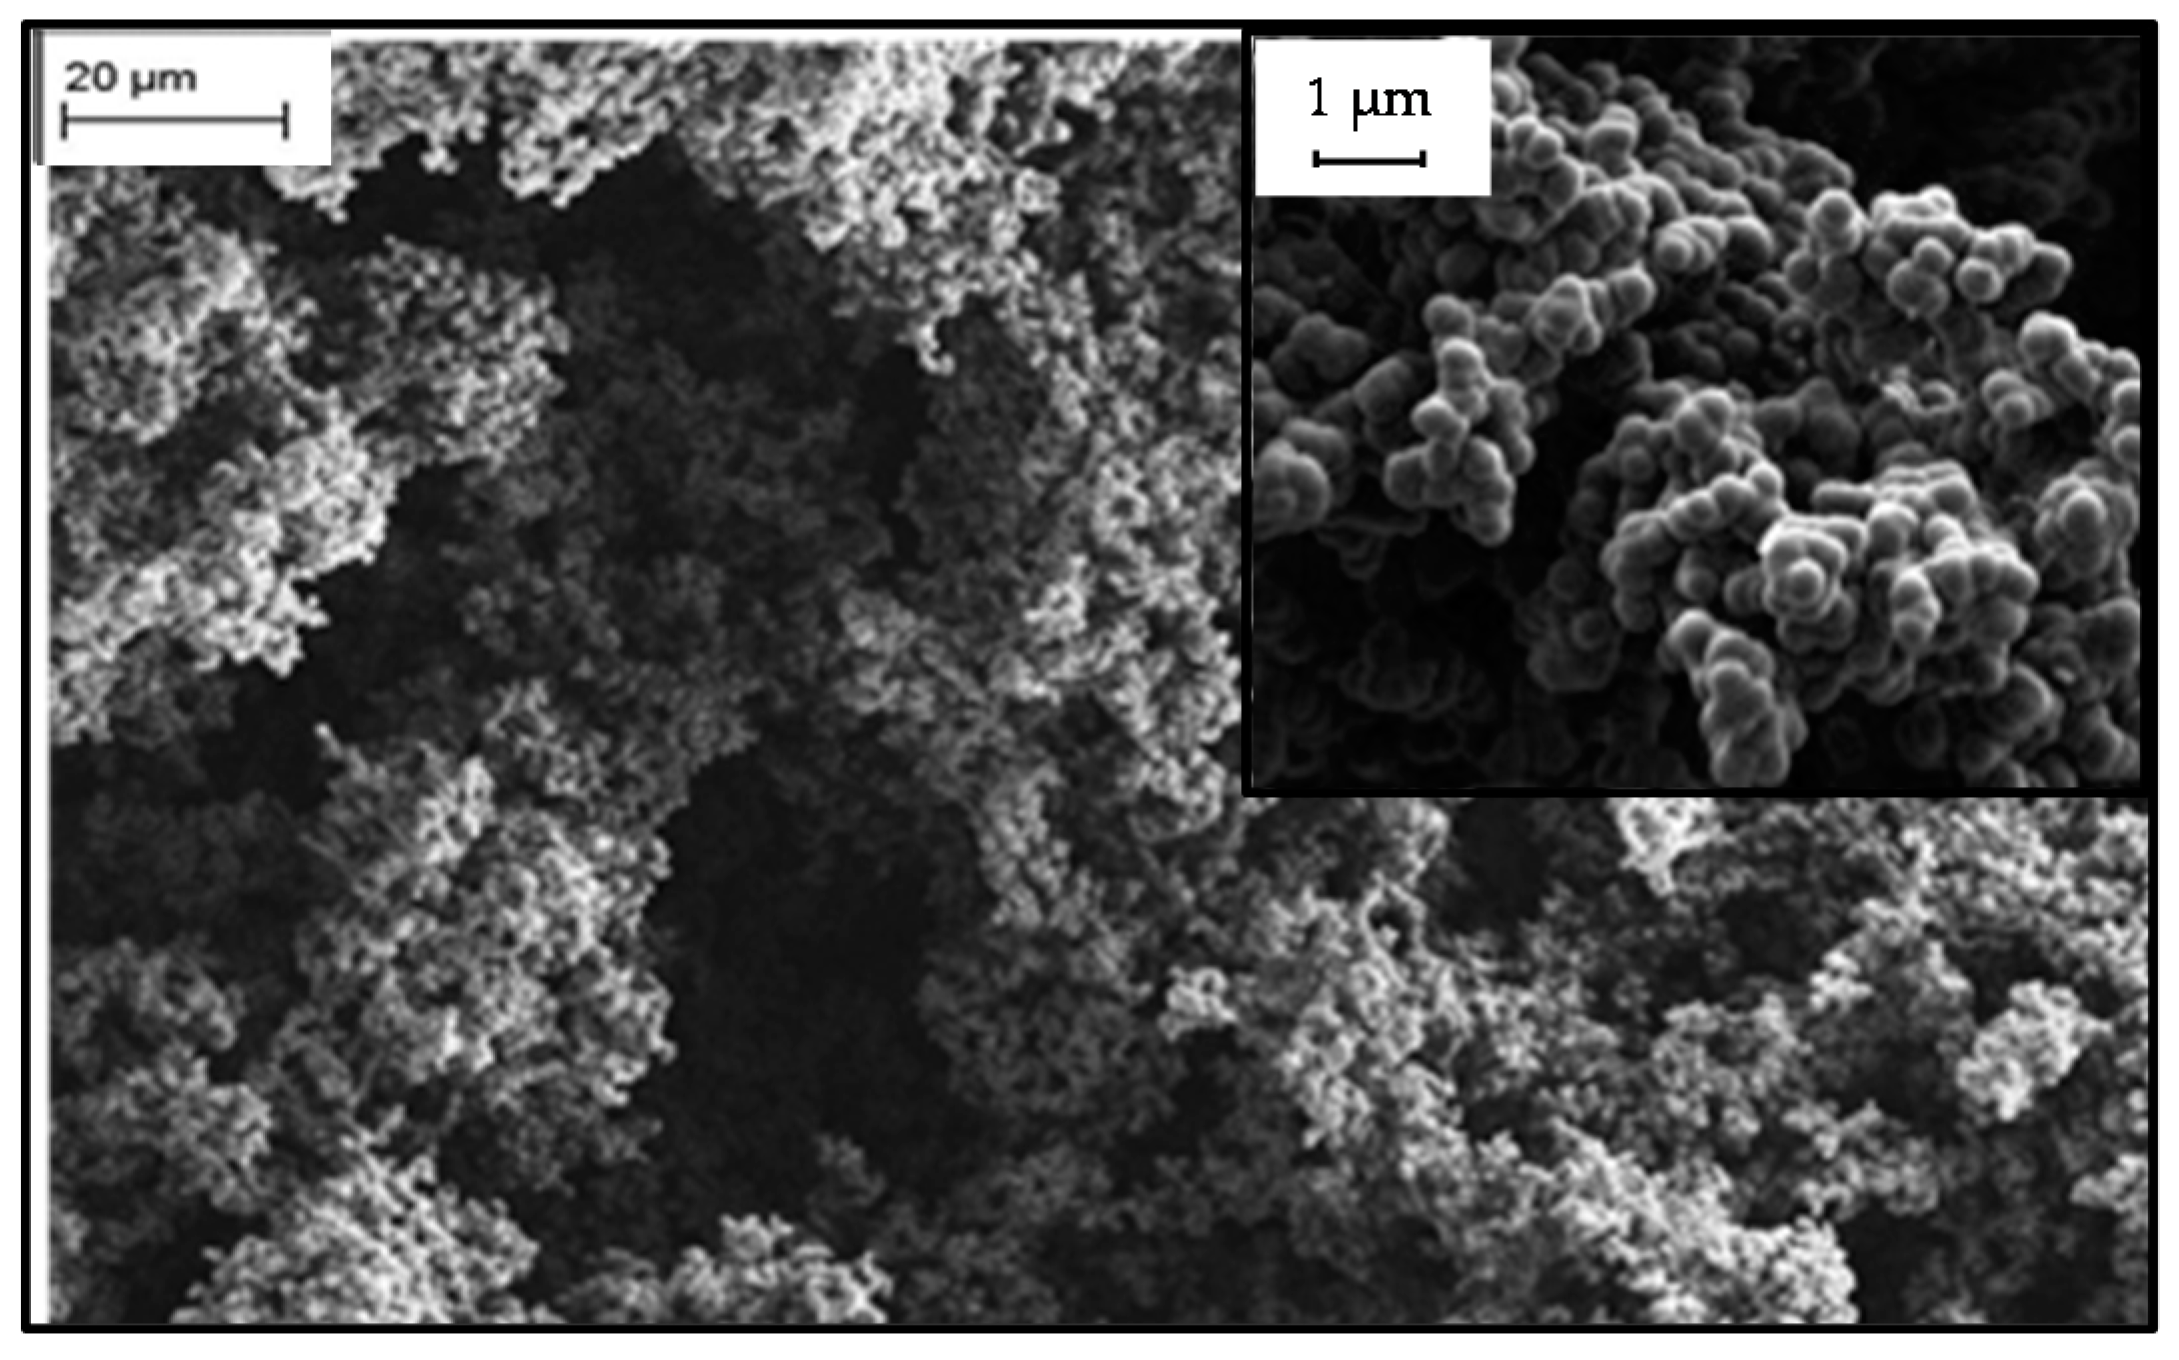
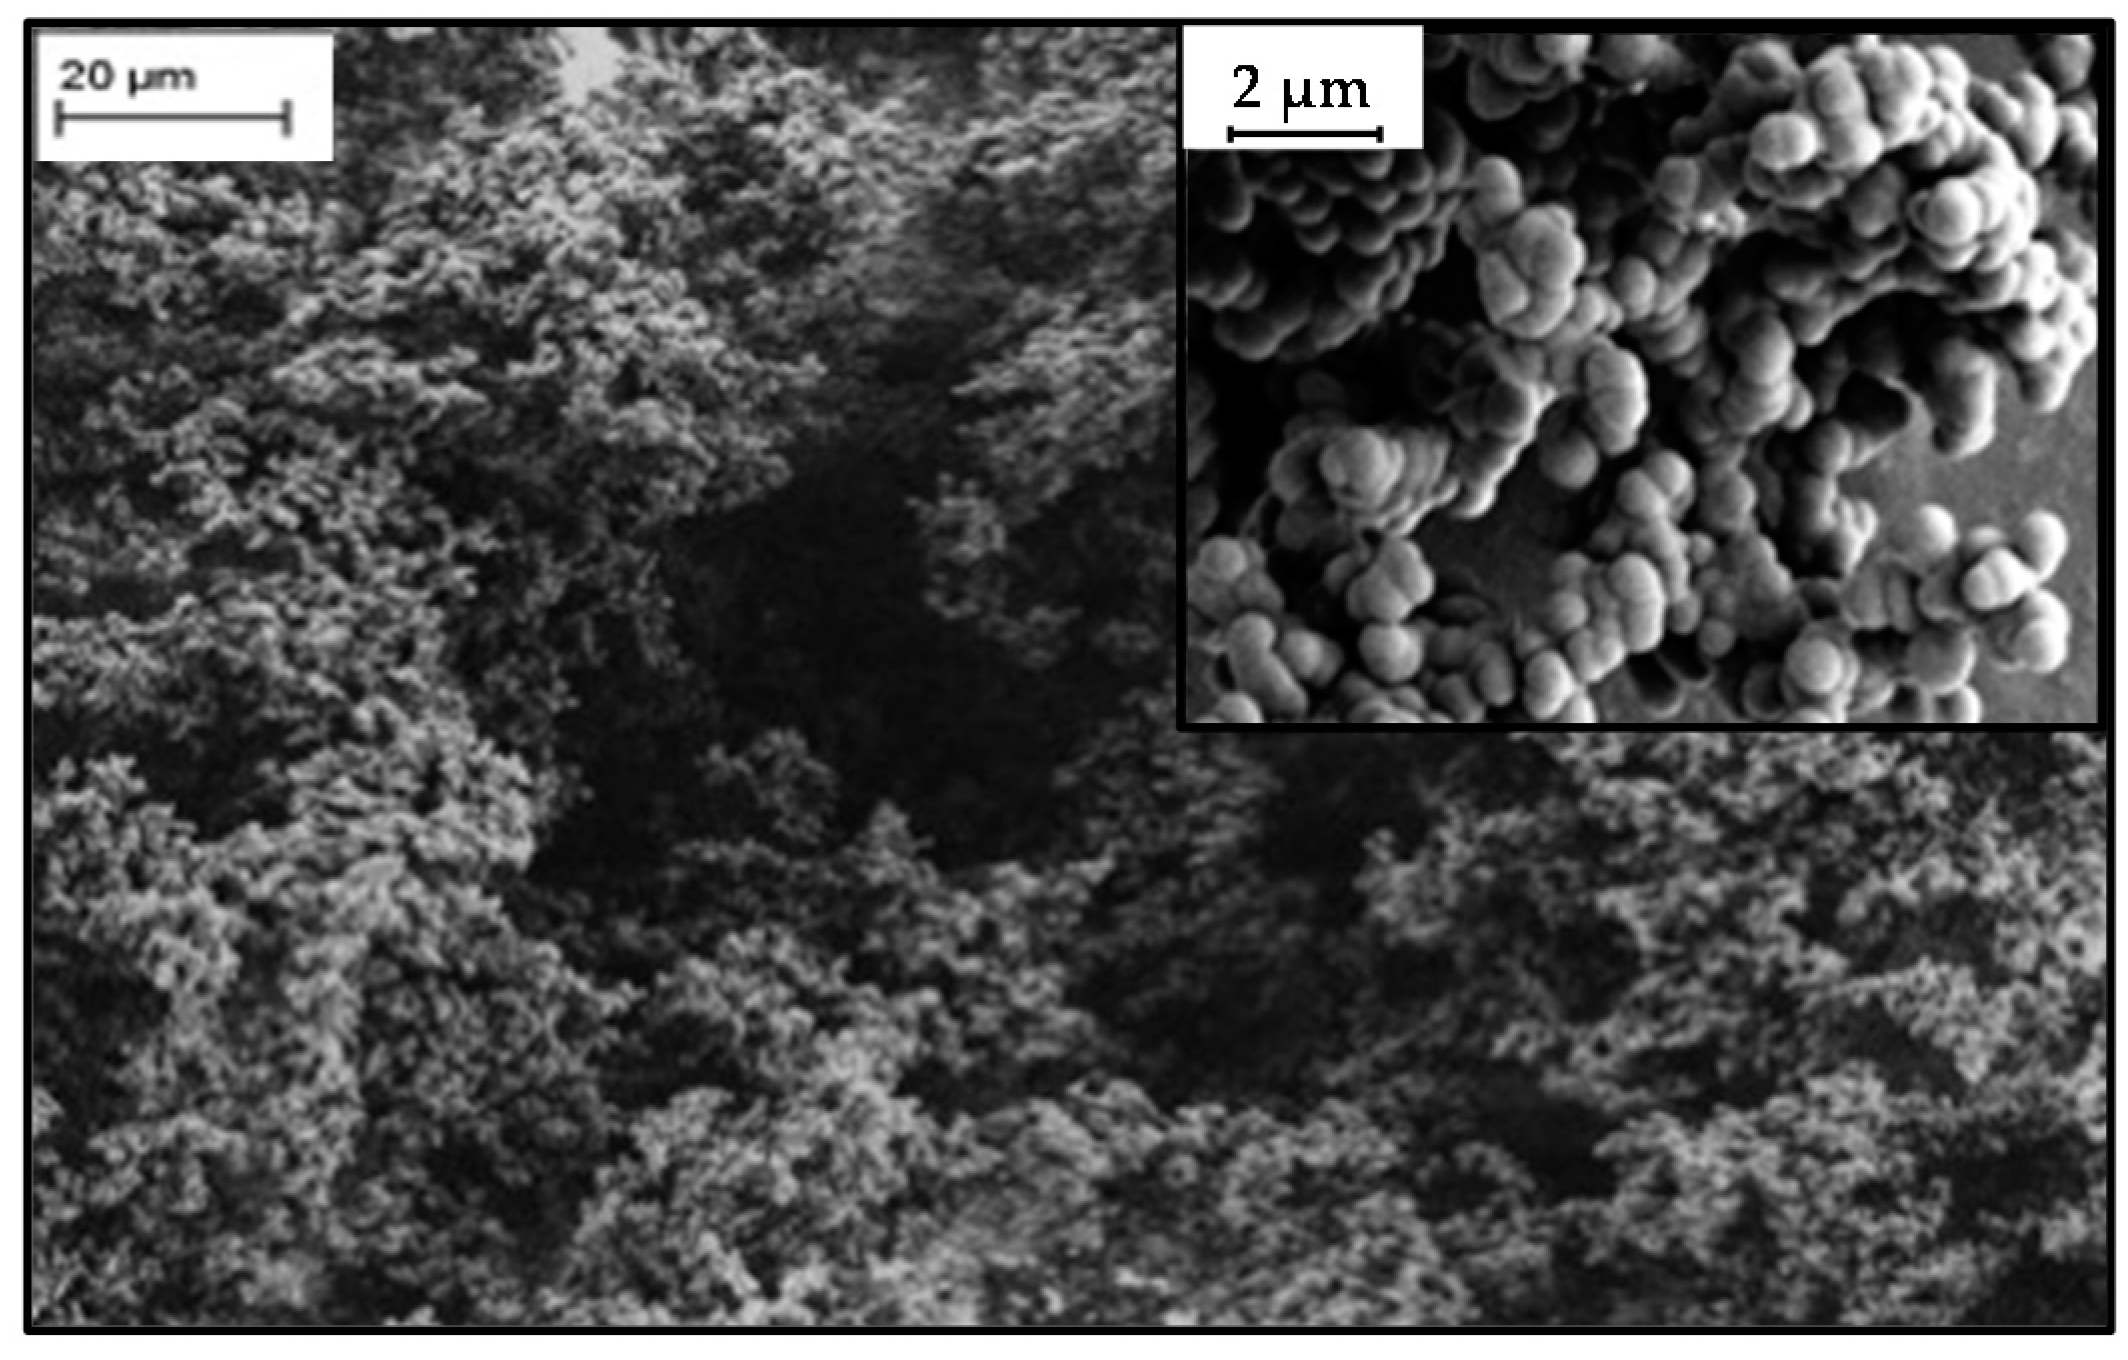
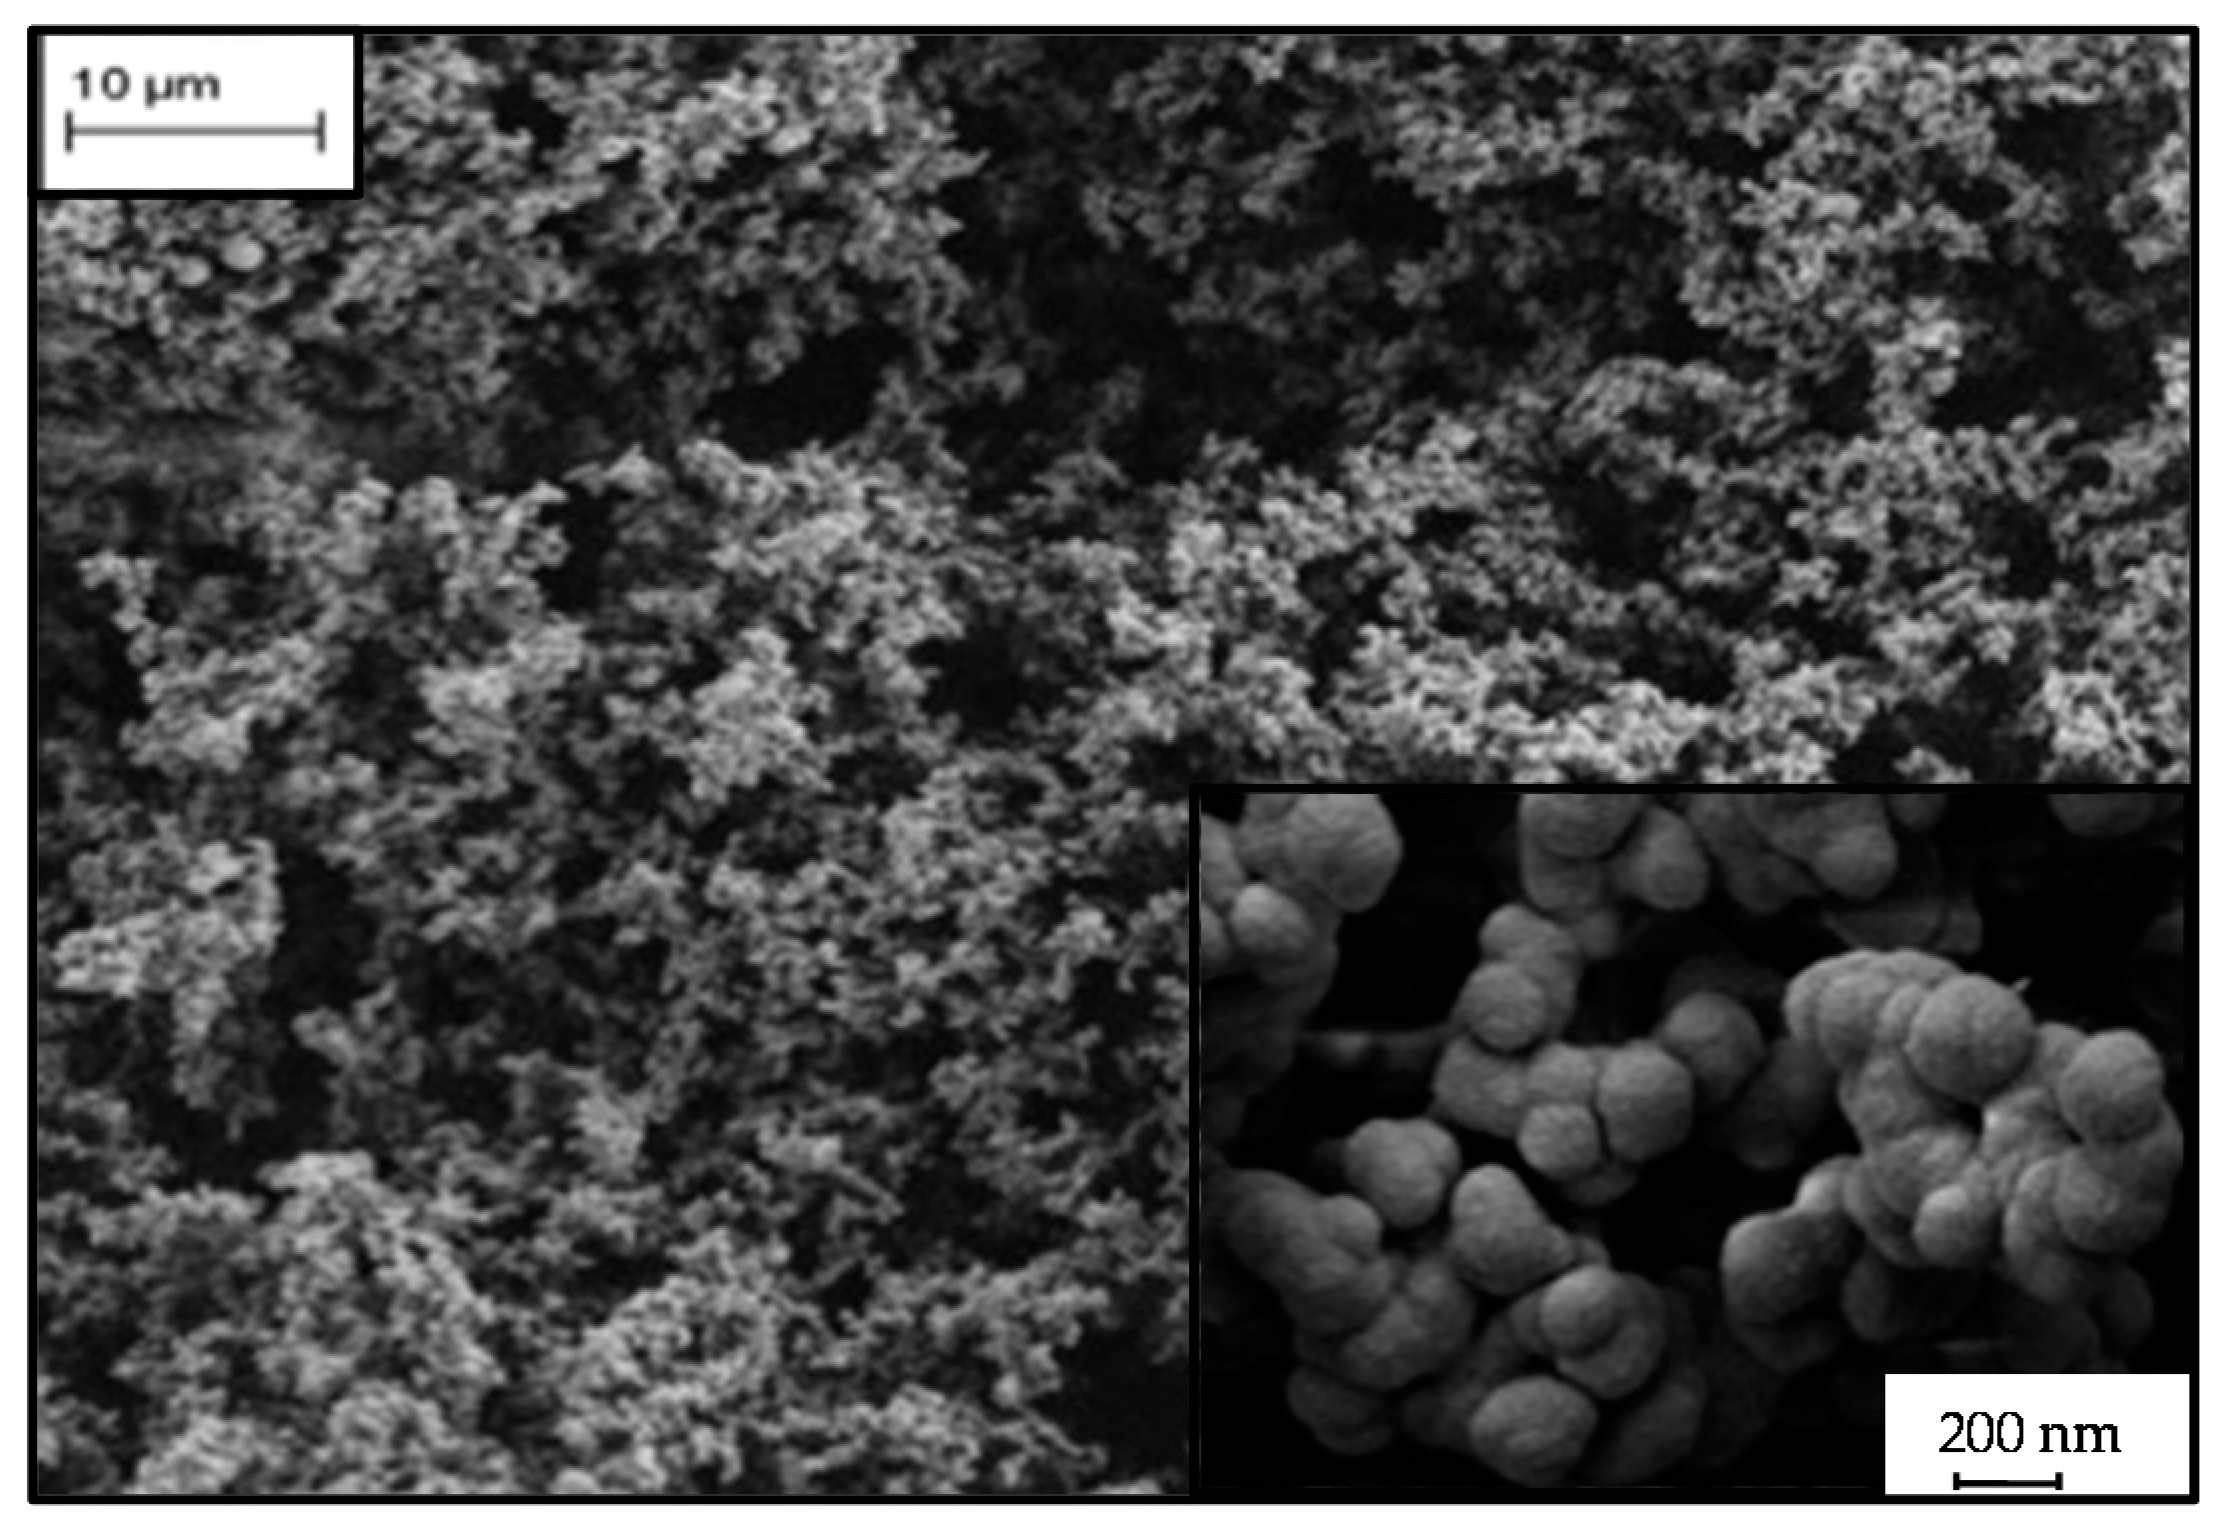
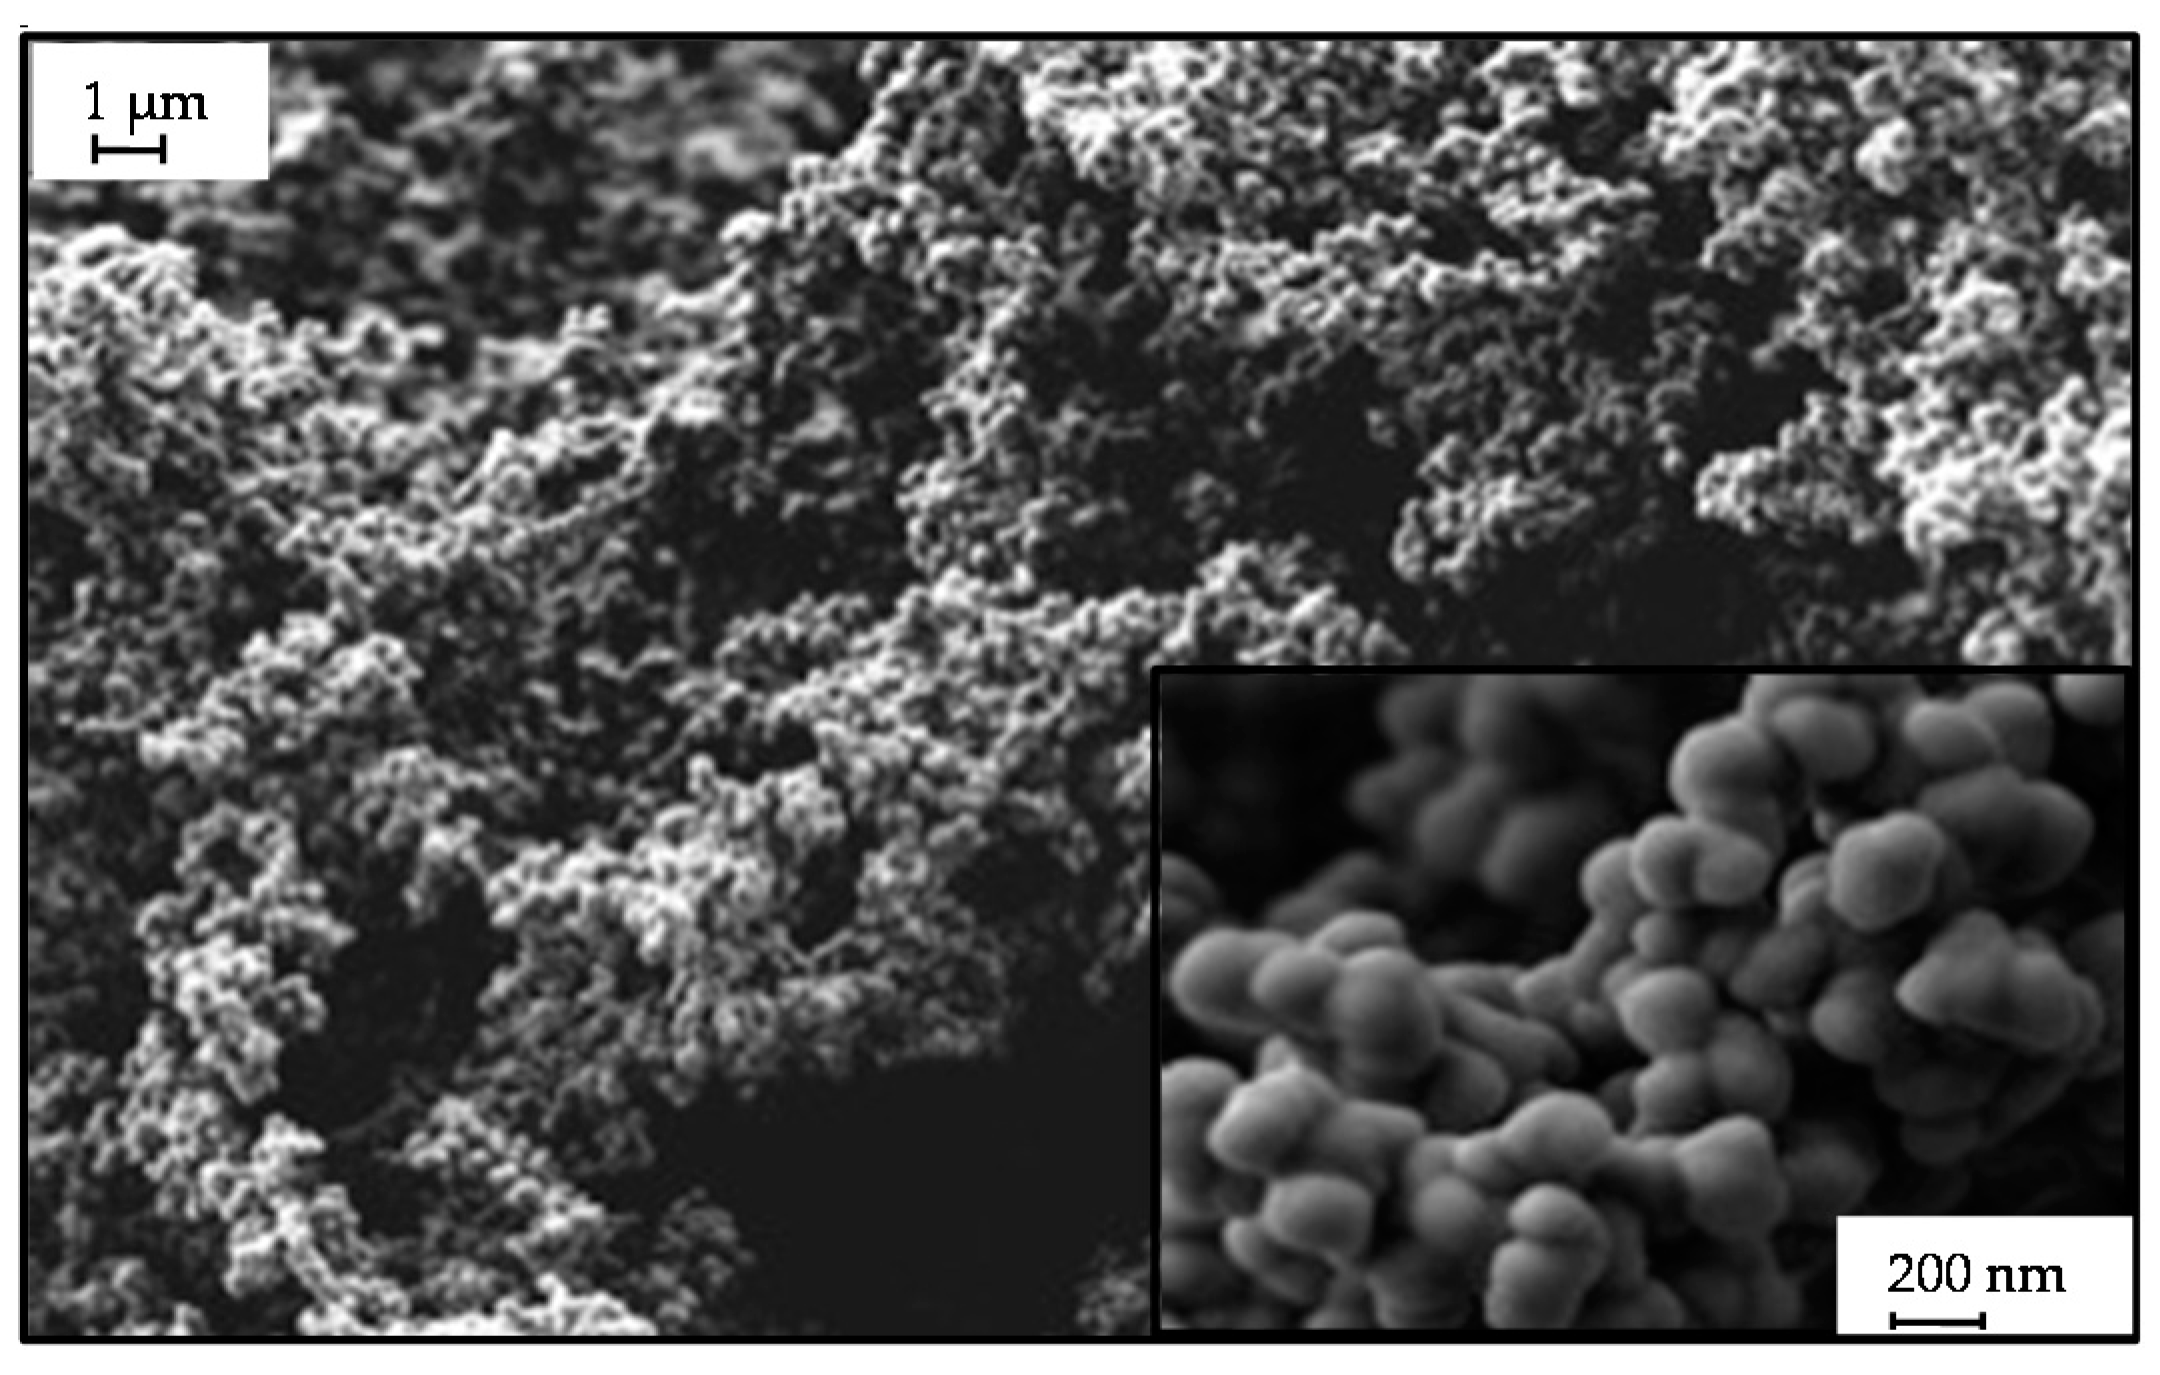
2.3. Microstructure of Resorcinol-Formaldehyde and Corresponding Carbon Aerogels

The network of a low-flexible RF aerogel is shown in Figure 1. We would like to point out the large pores in the structure that allow for ambient drying, since the capillary stresses are inversely proportional to the pore radius and thus the stress on the solid network during evaporation is reduced. One other important function of the relatively large pores compared to the particle size is the flexibility. Sufficient space between pore walls ensures elastic deformation of the network. As we can see in Figure 2, the carbonized structure of lf-RF is similar: large pores and small particles. We calculated the particle size of both aerogels from SEM images with high magnification (see the insets). Due to the carbonization the particles of lf-C are 20% smaller than that of lf-RF.
The structures of super-flexible RF and carbon aerogels possess smaller particles and pores than low-flexible aerogels. Also here we point out that the large pores play a crucial role for their flexibility. As shown in the Figure 3 and Figure 4, the particle size was reduced after carbonization. The reduction of approximately 23% is similar to that of low-flexible aerogels.
The mass loss Δm during pyrolysis, which can be measured by thermogravimetric analysis (TGA), can be used to calculate the particle size of the carbonized aerogel. We assume that
m C = m R F m
where mC is the mass of the carbon aerogel particle and mRF of the RF aerogel. The mRF can be expressed as
m R F = V R F   P a r t i c l e · ρ R F s
where VRF is the volume of a spherical RF particle and ρsRF is the skeletal density of RF aerogel. It can be also expressed as
m R F   = 4 π 3 · r R F   P a r t i c l e 3 · ρ R F s
where rRF is the radius of the RF particle.
The radius of the carbon aerogel particle can be then calculated with Equation (7):
r C = ( 3 m C 4 π ρ C s ) 1 / 3
The calculated particle sizes are summarized in Table 2. The differences of the two methods are 16% for lf-C and 21% for sf-C. They are, in our opinion, caused by inaccuracy from the linear extension of the particles between their boundaries. The difficulty of this method is that the boundaries between particles are partly not well visible and SEM images do not give the complete information about their true 3D structure.
Remarkable for both kinds of aerogels is the change of connectivity between the particles. One can see that carbonized structures possess thicker necks and on some places they are not visible anymore. The chains of particles are denser, and they are merged closer together. These changes are reminiscent of coarsening processes, by which the structure is compacted [37]. First, the surface curvature differences modify diffusion and evaporation, such that material is transported from highly curved areas to those with smaller or negative curvature. In total the surface energy in the sample is reduced [38]. We speculate that these morphological changes during pyrolysis occur as follows: In the initial stage of pyrolysis, additional intermolecular bonds are formed between aromatic rings. In the later stages, the crosslinks begin to break, while solid is transported to the pores. The filling of pores leads to compaction of the material and to a partly closed-porous structure, which explains the increase of the bulk and skeletal densities. The compaction of the material is followed by a reduction of the particle boundary interface area and coarsening of the structure. In the last stage of pyrolysis, at high temperature the evolution of hydrogen takes place as a result from splitting of hydrogen atoms directly bonded to benzene rings. The final structure consists of coalesced rings [39]. Congruent with this picture is the change in the particle’s surface morphology. During pyrolysis they became smoother, as if they have a cover on their surface. This process was described by Gruber [38], treating quite generally the smoothing of rough surfaces by curvature driven mass transport. Previous investigations show that this kind of structural modifications (merging or smoothing) cause a strengthening of the aerogels [40,41].
The load-deformation curves are shown in Figure 5 and Figure 6. The slopes in the Hookean regions of carbon aerogels are steeper than that of the corresponding RF aerogels. In that region, we calculated the compressive modulus with a linear fit. The compressive moduli of carbonized aerogels are greater by a factor of two. Additionally, a higher slope for the low-flexible aerogels when compared to the super-flexible ones can be observed and explained by higher stiffness (or lower flexibility) of the aerogels.
The change in the pore structure was investigated with the help of nitrogen absorption isotherms at 77 K shown in Figure 7 and Figure 8. According to IUPAC classification, all the isotherms are of type IV [42], although without a marked plateau at higher pressures. We observe a special kind of hysteresis between adsorption and desorption. In contrast to many aerogels, which exhibit a type H4 hysteresis, in all cases reported here the difference between the adsorption and desorption branch extends to the lowest pressures we could measure. This is discussed in the literature as having two possible causes: first, there could be bottleneck pores with an entrance in the range of the adsorbent size, which would lead to a delayed desorption. Second, there could be a swelling or irreversible deformation of the solid-skeleton due to capillary condensation at higher nitrogen pressures. Such an irreversible deformation might be possible for these aerogels, since their elastic modulus is low and the capillary stresses during evaporation could deform locally on a microscopic scale of the solid skeleton. A further clarification of this might be possible using different adsorbents and techniques, which allow better resolution of the isotherms at lower pressures. Another striking feature of the isotherms is the steep increase at low relative pressure, which is much higher for carbon aerogels than for RF, indicating the presence of micropores. The increase of microporosity caused a significant rise in surface area up to about 659 m2·g−1. Comparing these data with the SEM images shown before, the result might be astonishing, since there we observed smooth particles. One should, however, take into account that micropores are in the range of 2 nm and thus cannot be seen in those SEM images.

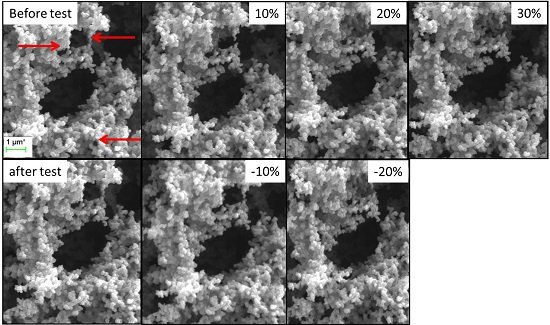
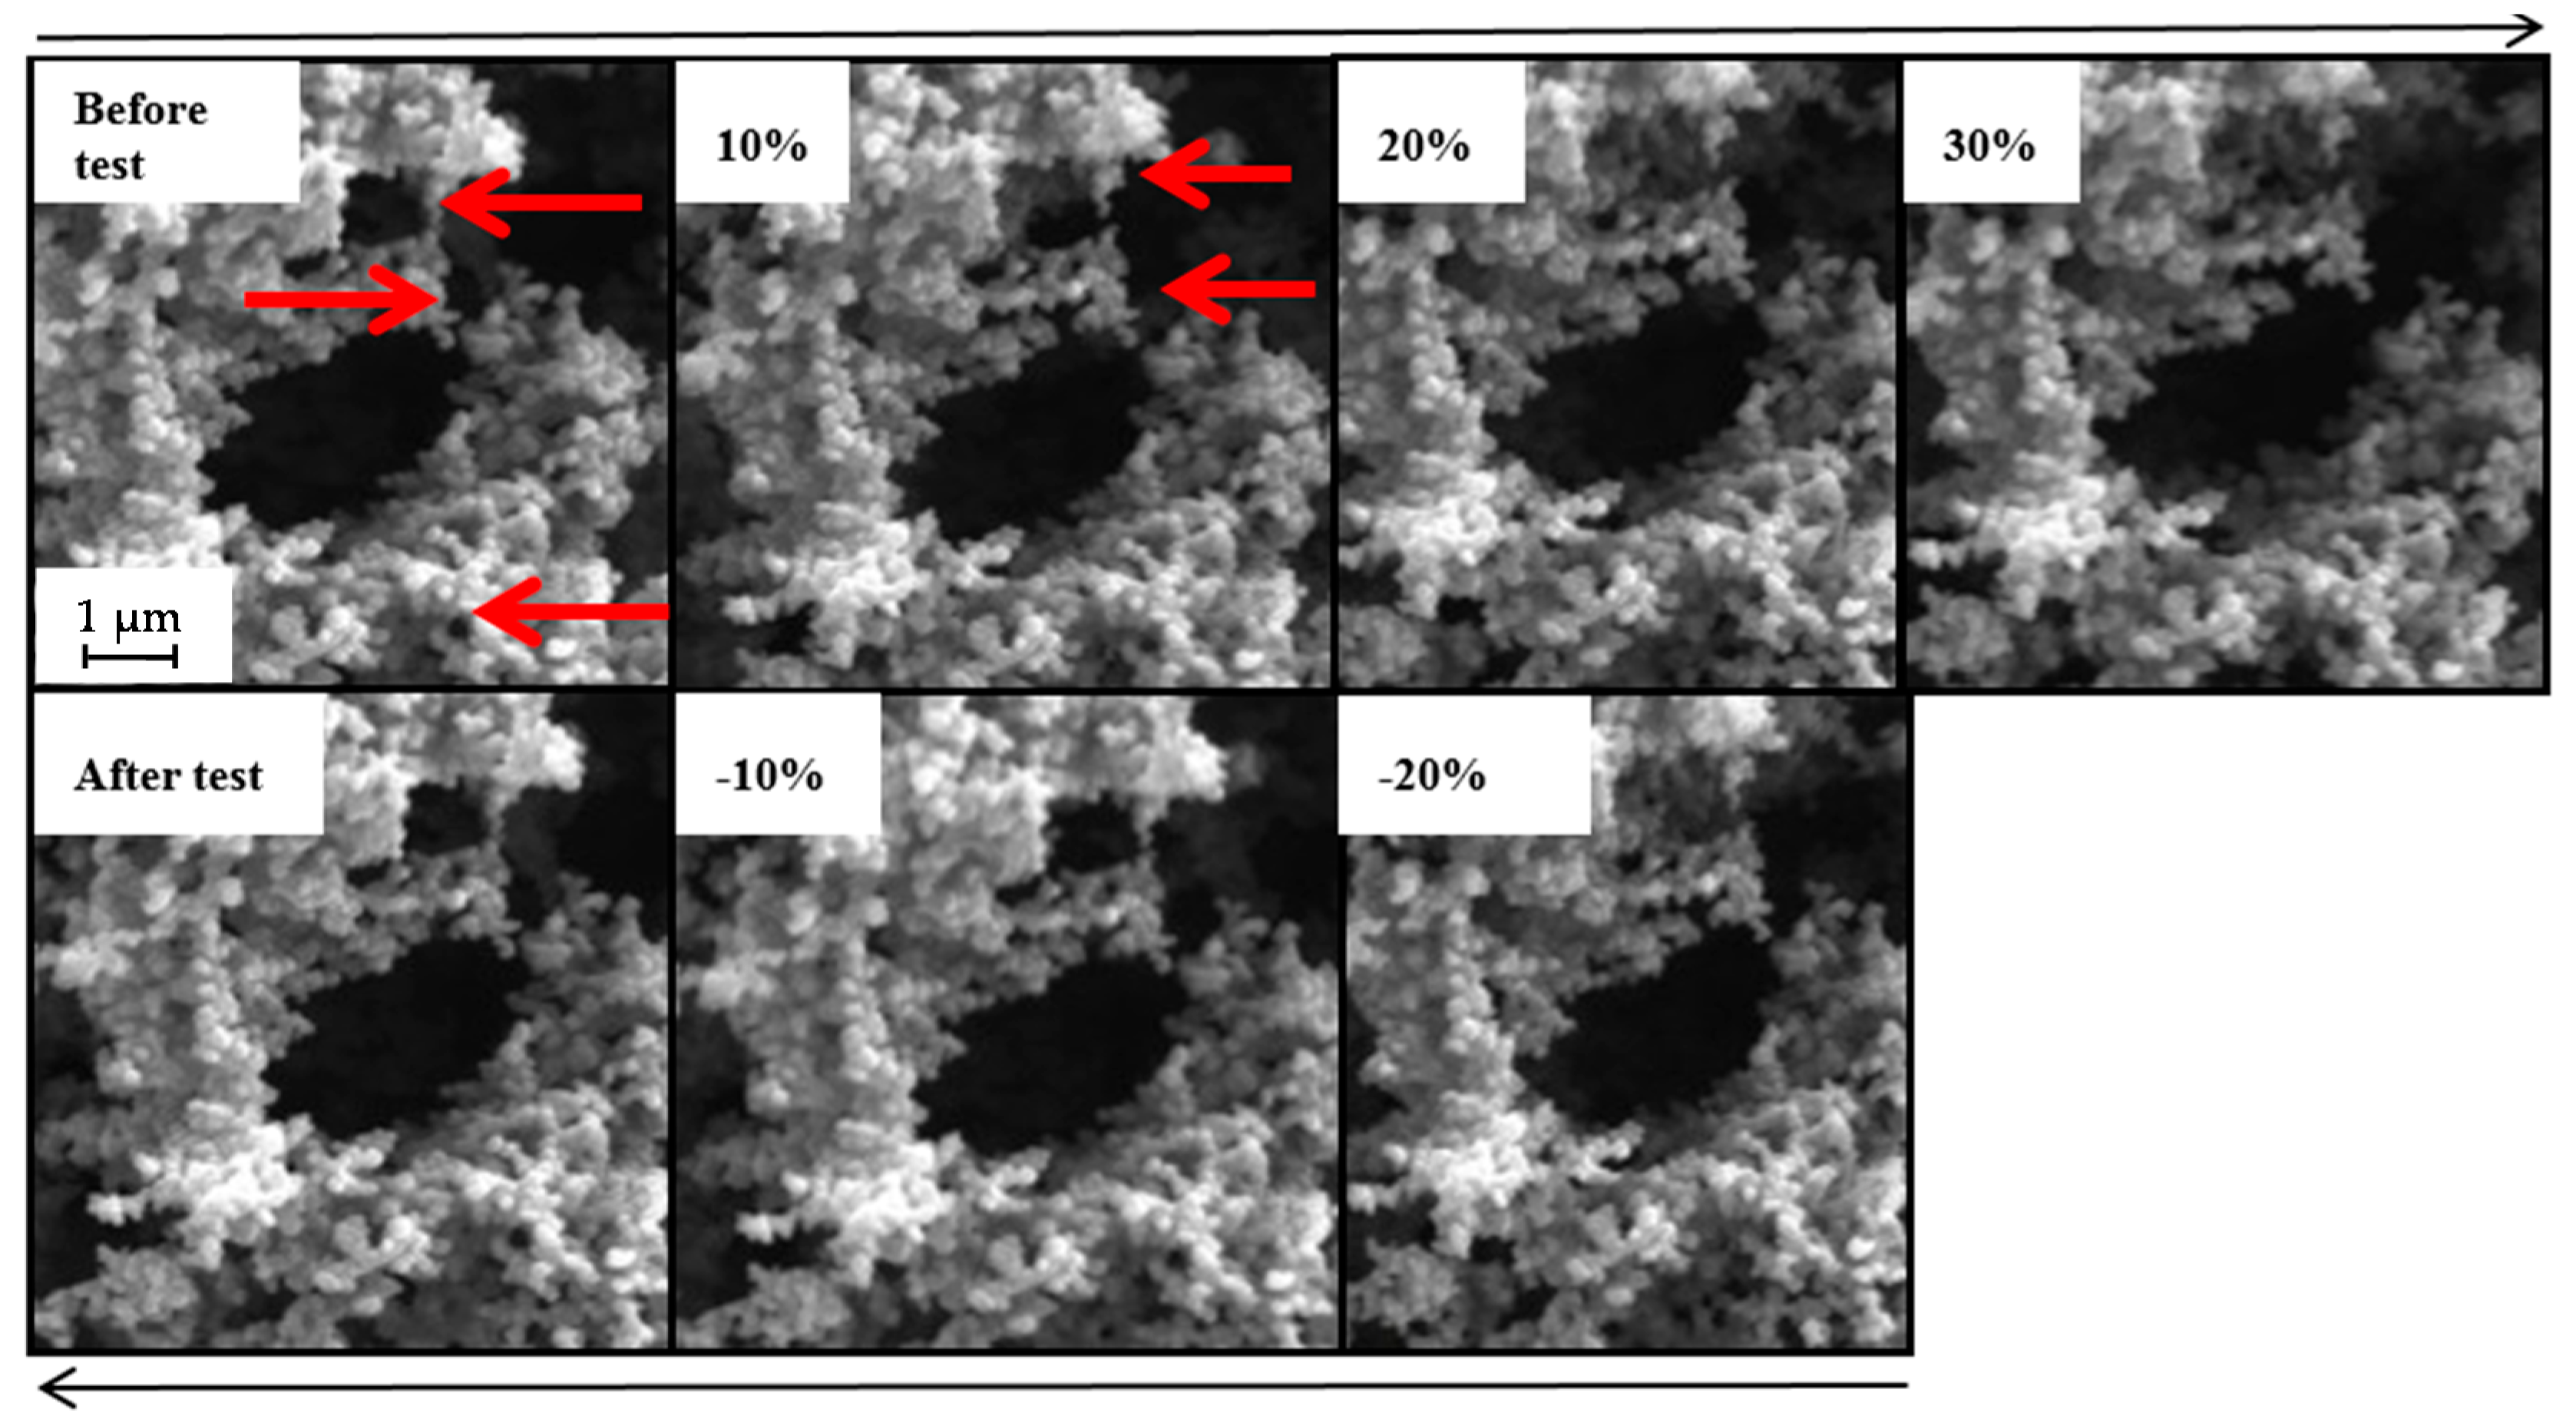
2.4. SEM with In-Situ Compression Test of Low-Flexible and Super-Flexible Carbon Aerogels

We utilized SEM to observe in-situ the microscopic structural evolution of flexible carbon aerogels during compression-release tests in order to probe the mechanism of their elasticity. We cut the samples into cubes for measuring the degree of relative compression. The compression test was performed after a sufficiently large pore was found in the structure of the aerogel. Upon loading the observed pore (or several pores) was deformed and recovered to its original shape once the loading was released.

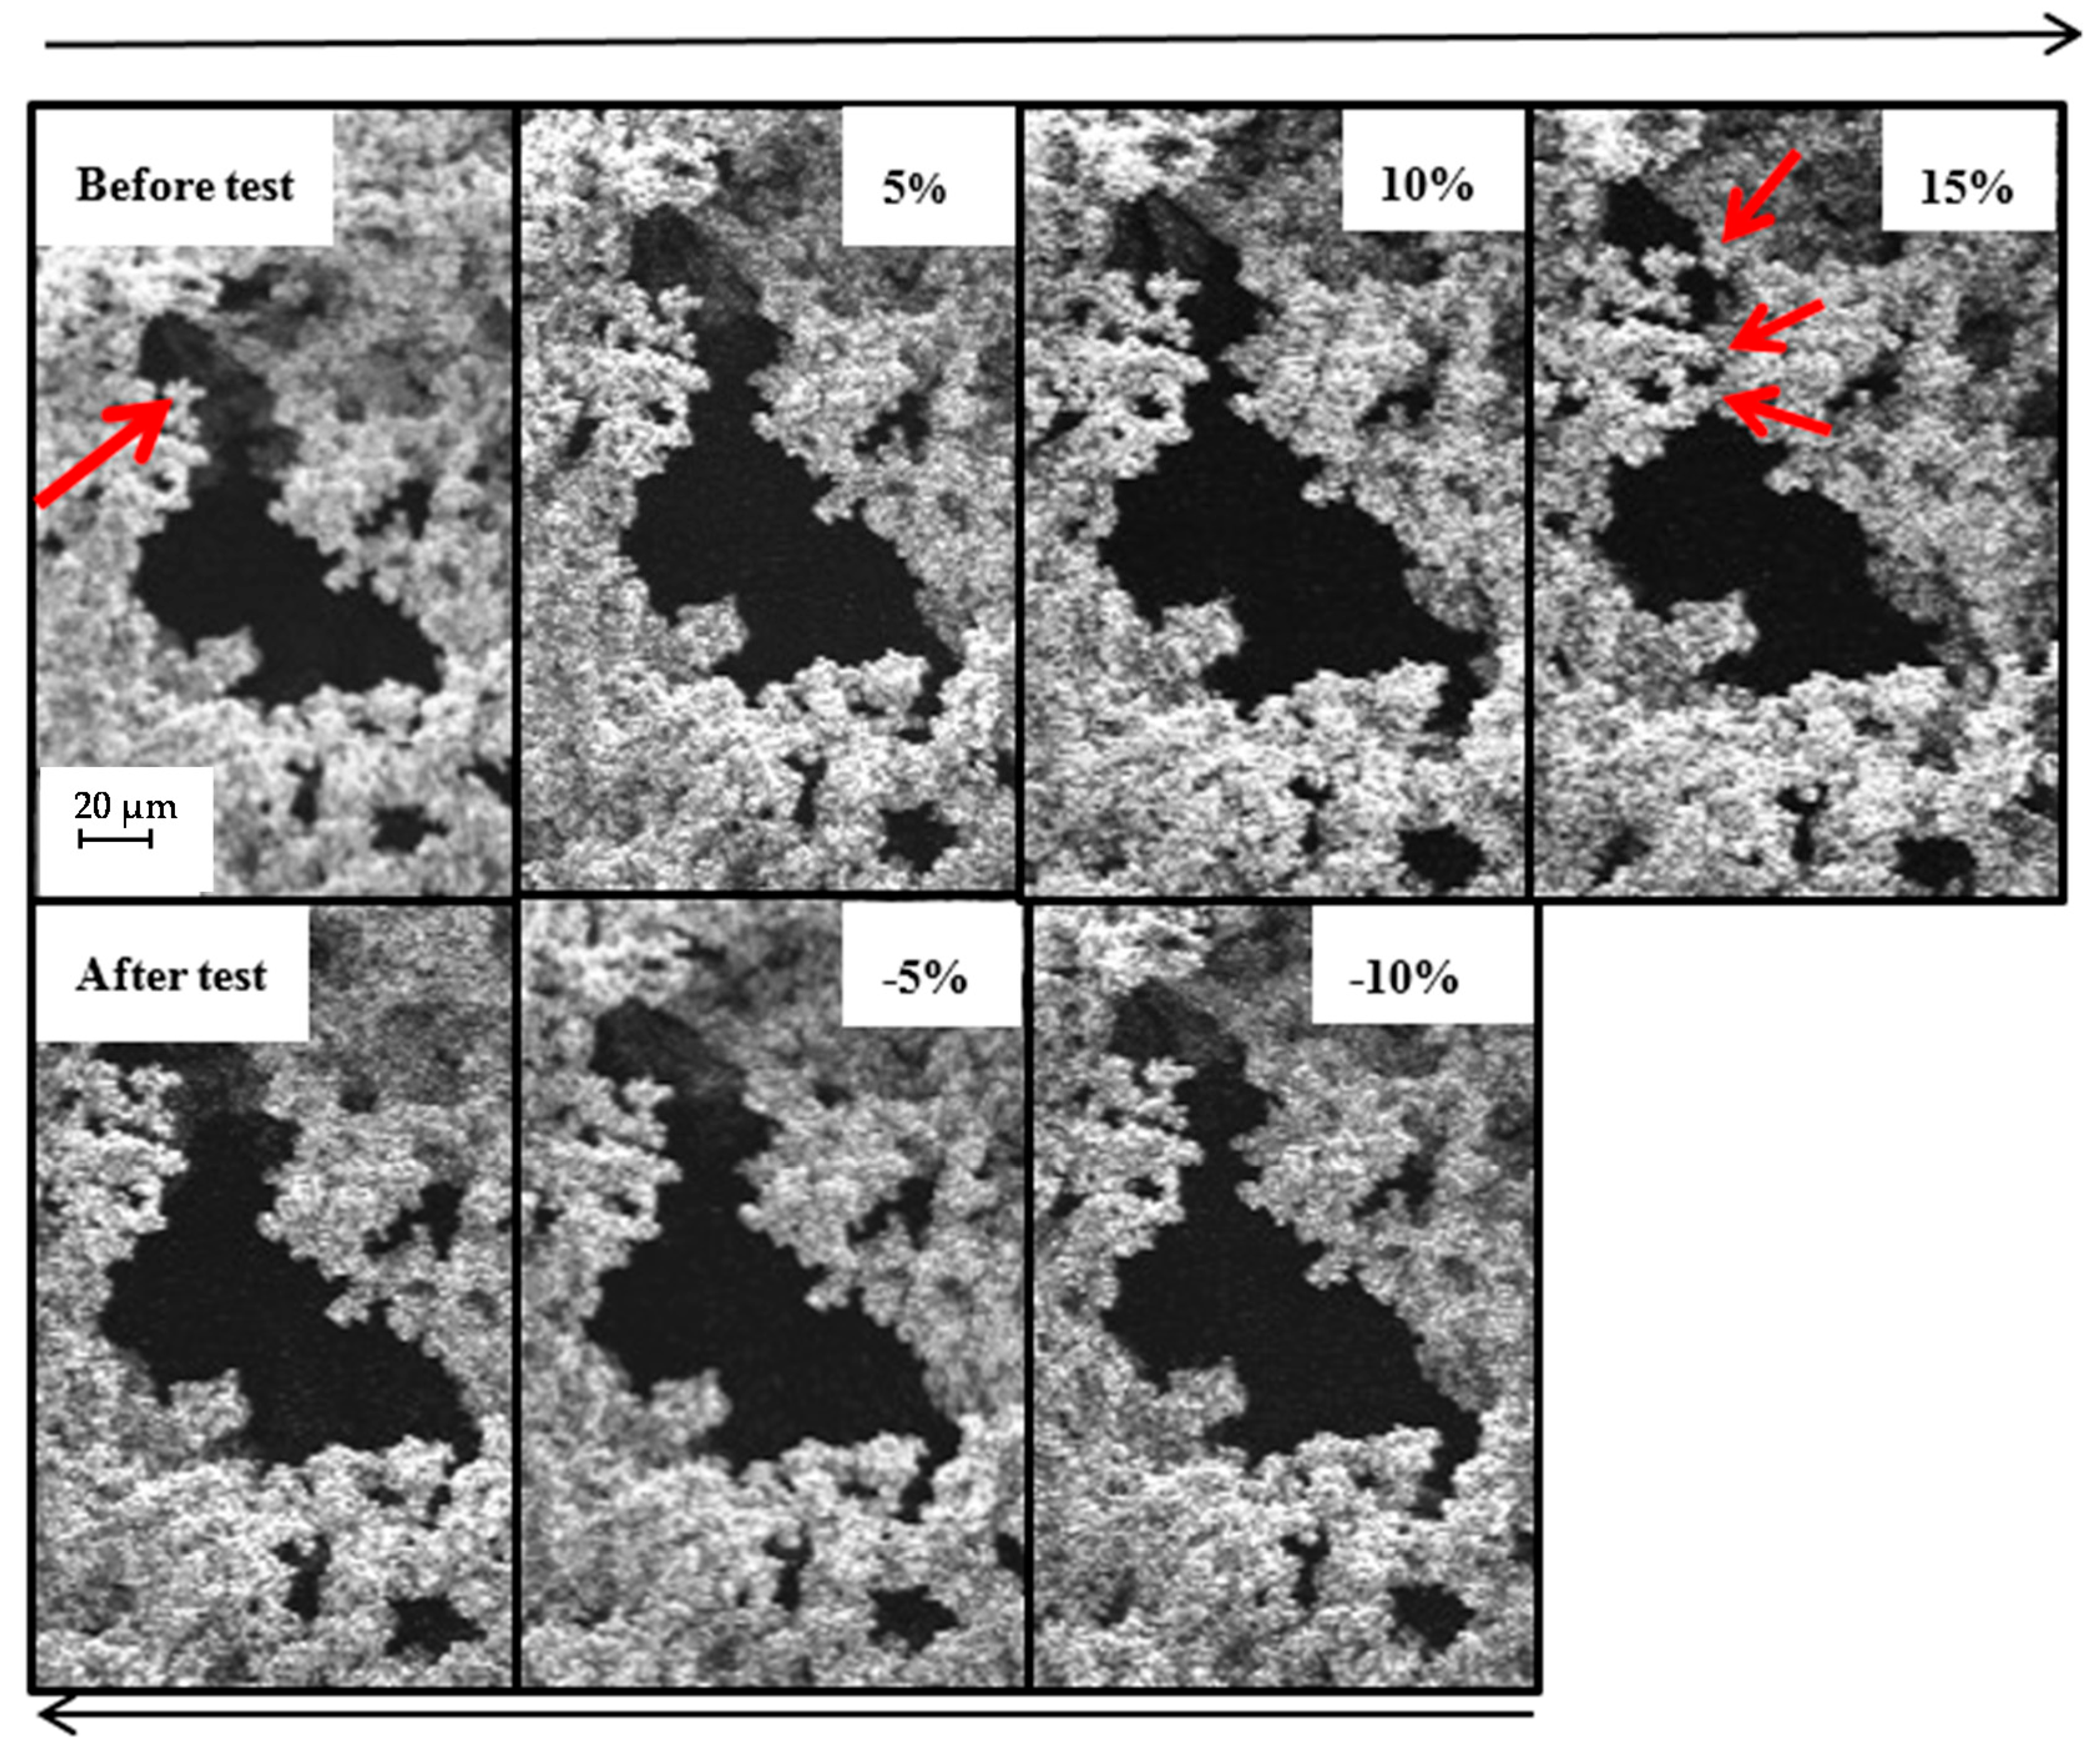
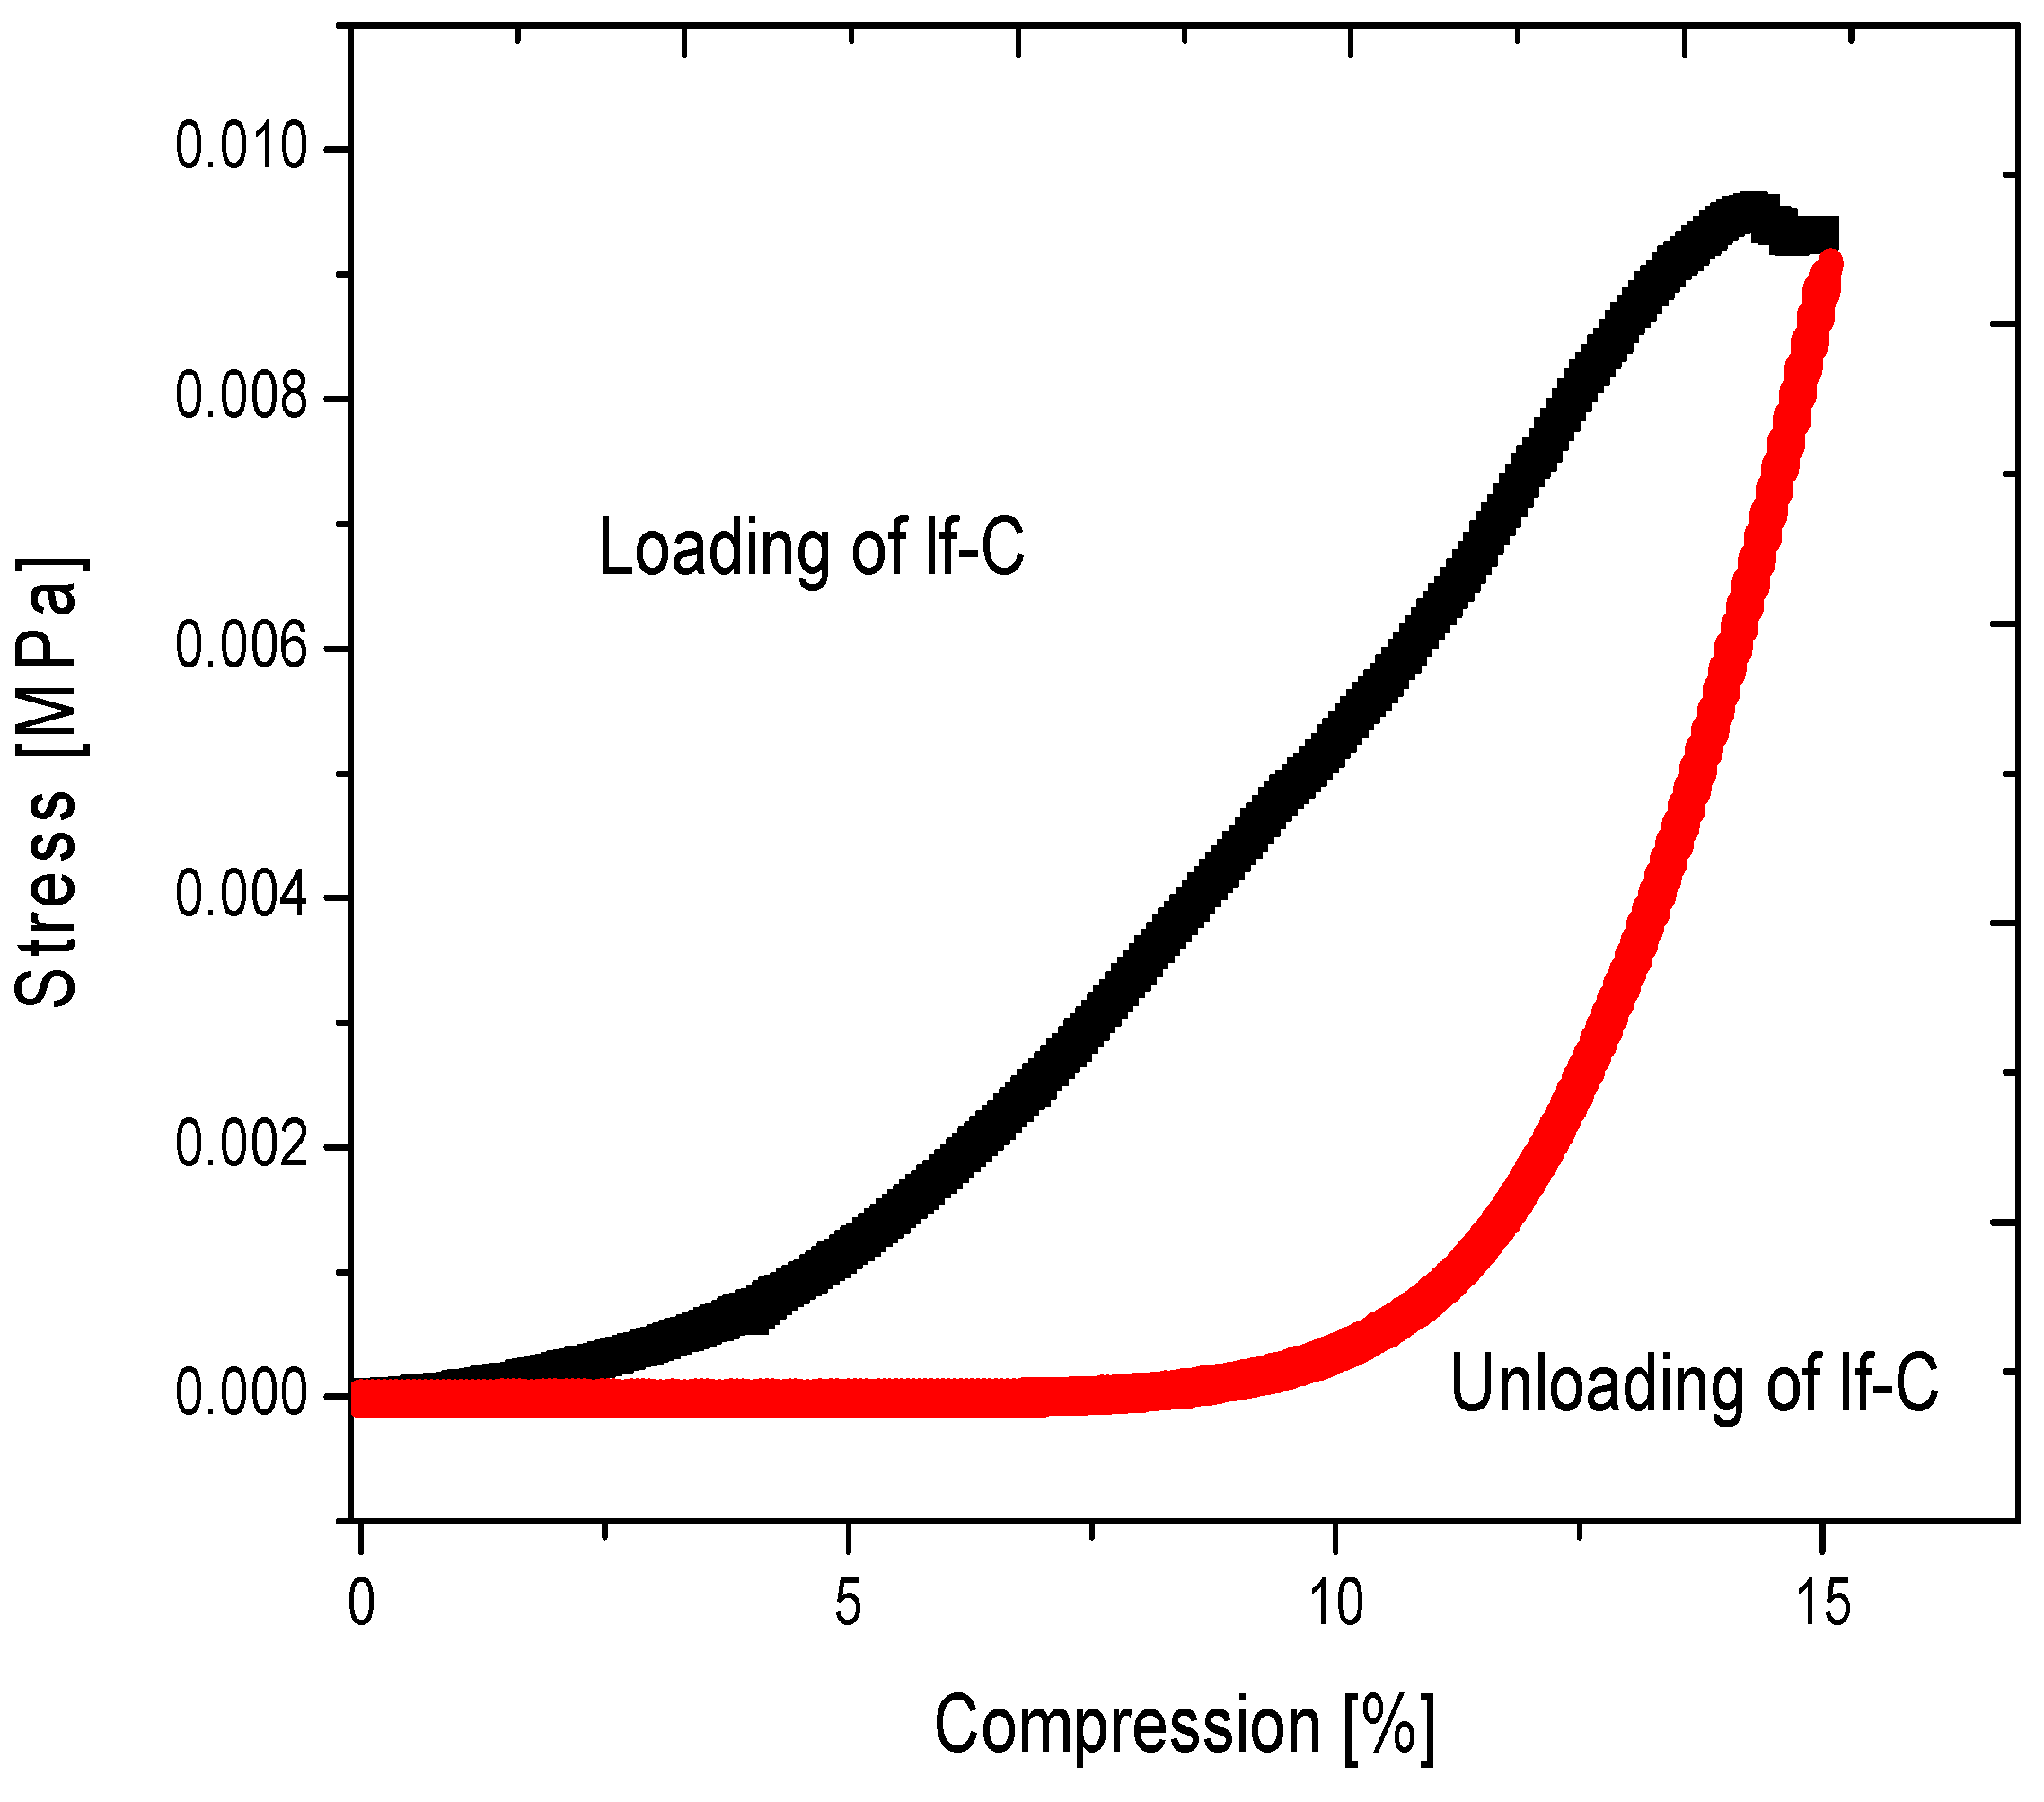
2.4.1. Low-Flexible Carbon Aerogel

In the structure of the low-flexible carbon aerogel, shown in Figure 9 “Before test”, we found a large, elongated pore that was approximately 100 µm long and 20 µm thick. We observed the deformation of the whole pore and especially of the location marked with an arrow. After 5% of relative compression, one can see the pore walls come closer together, and the distance becomes almost half its original width. After a further 5% of compression, the distance is reduced again. Finally, after 15% of compression the pore walls touch each other. We marked with three arrows the new contact places. In the upper part, the particles are so near that they almost closed the pore. Upon the removal of the load we observed the “reopening” of the pore: the pore walls moved back to their initial position. The pore possessed the same shape and approximately an equal size as before deformation.
The curves of the compression test are shown in Figure 10. As already mentioned, due to the non-perfect shape of the sample, in the first stage up to 2.5% of compression, the force increased very slightly and in a non-linear fashion. Once the sample was oriented in the loading cell, the force rose almost linearly. After reaching 14.4% a slight decrease of the stress was observed, indicating the ultimate strain of rupture, where the porous structure collapses. The large hysteresis loop between the loading and unloading curves confirms the partly irreversible nature of the deformation occurring in the material. It should be noted that during the compression tests a formation of dust around the sample was observed. Also some very small crumbs of the sample were found after the in-situ compression in the loading cell.

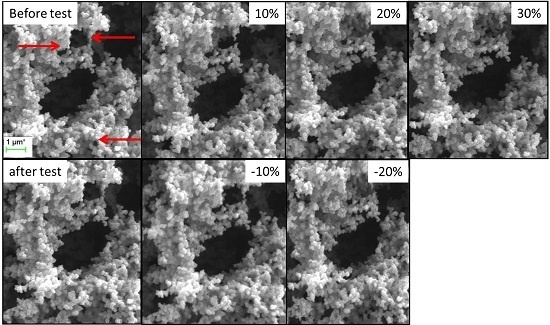
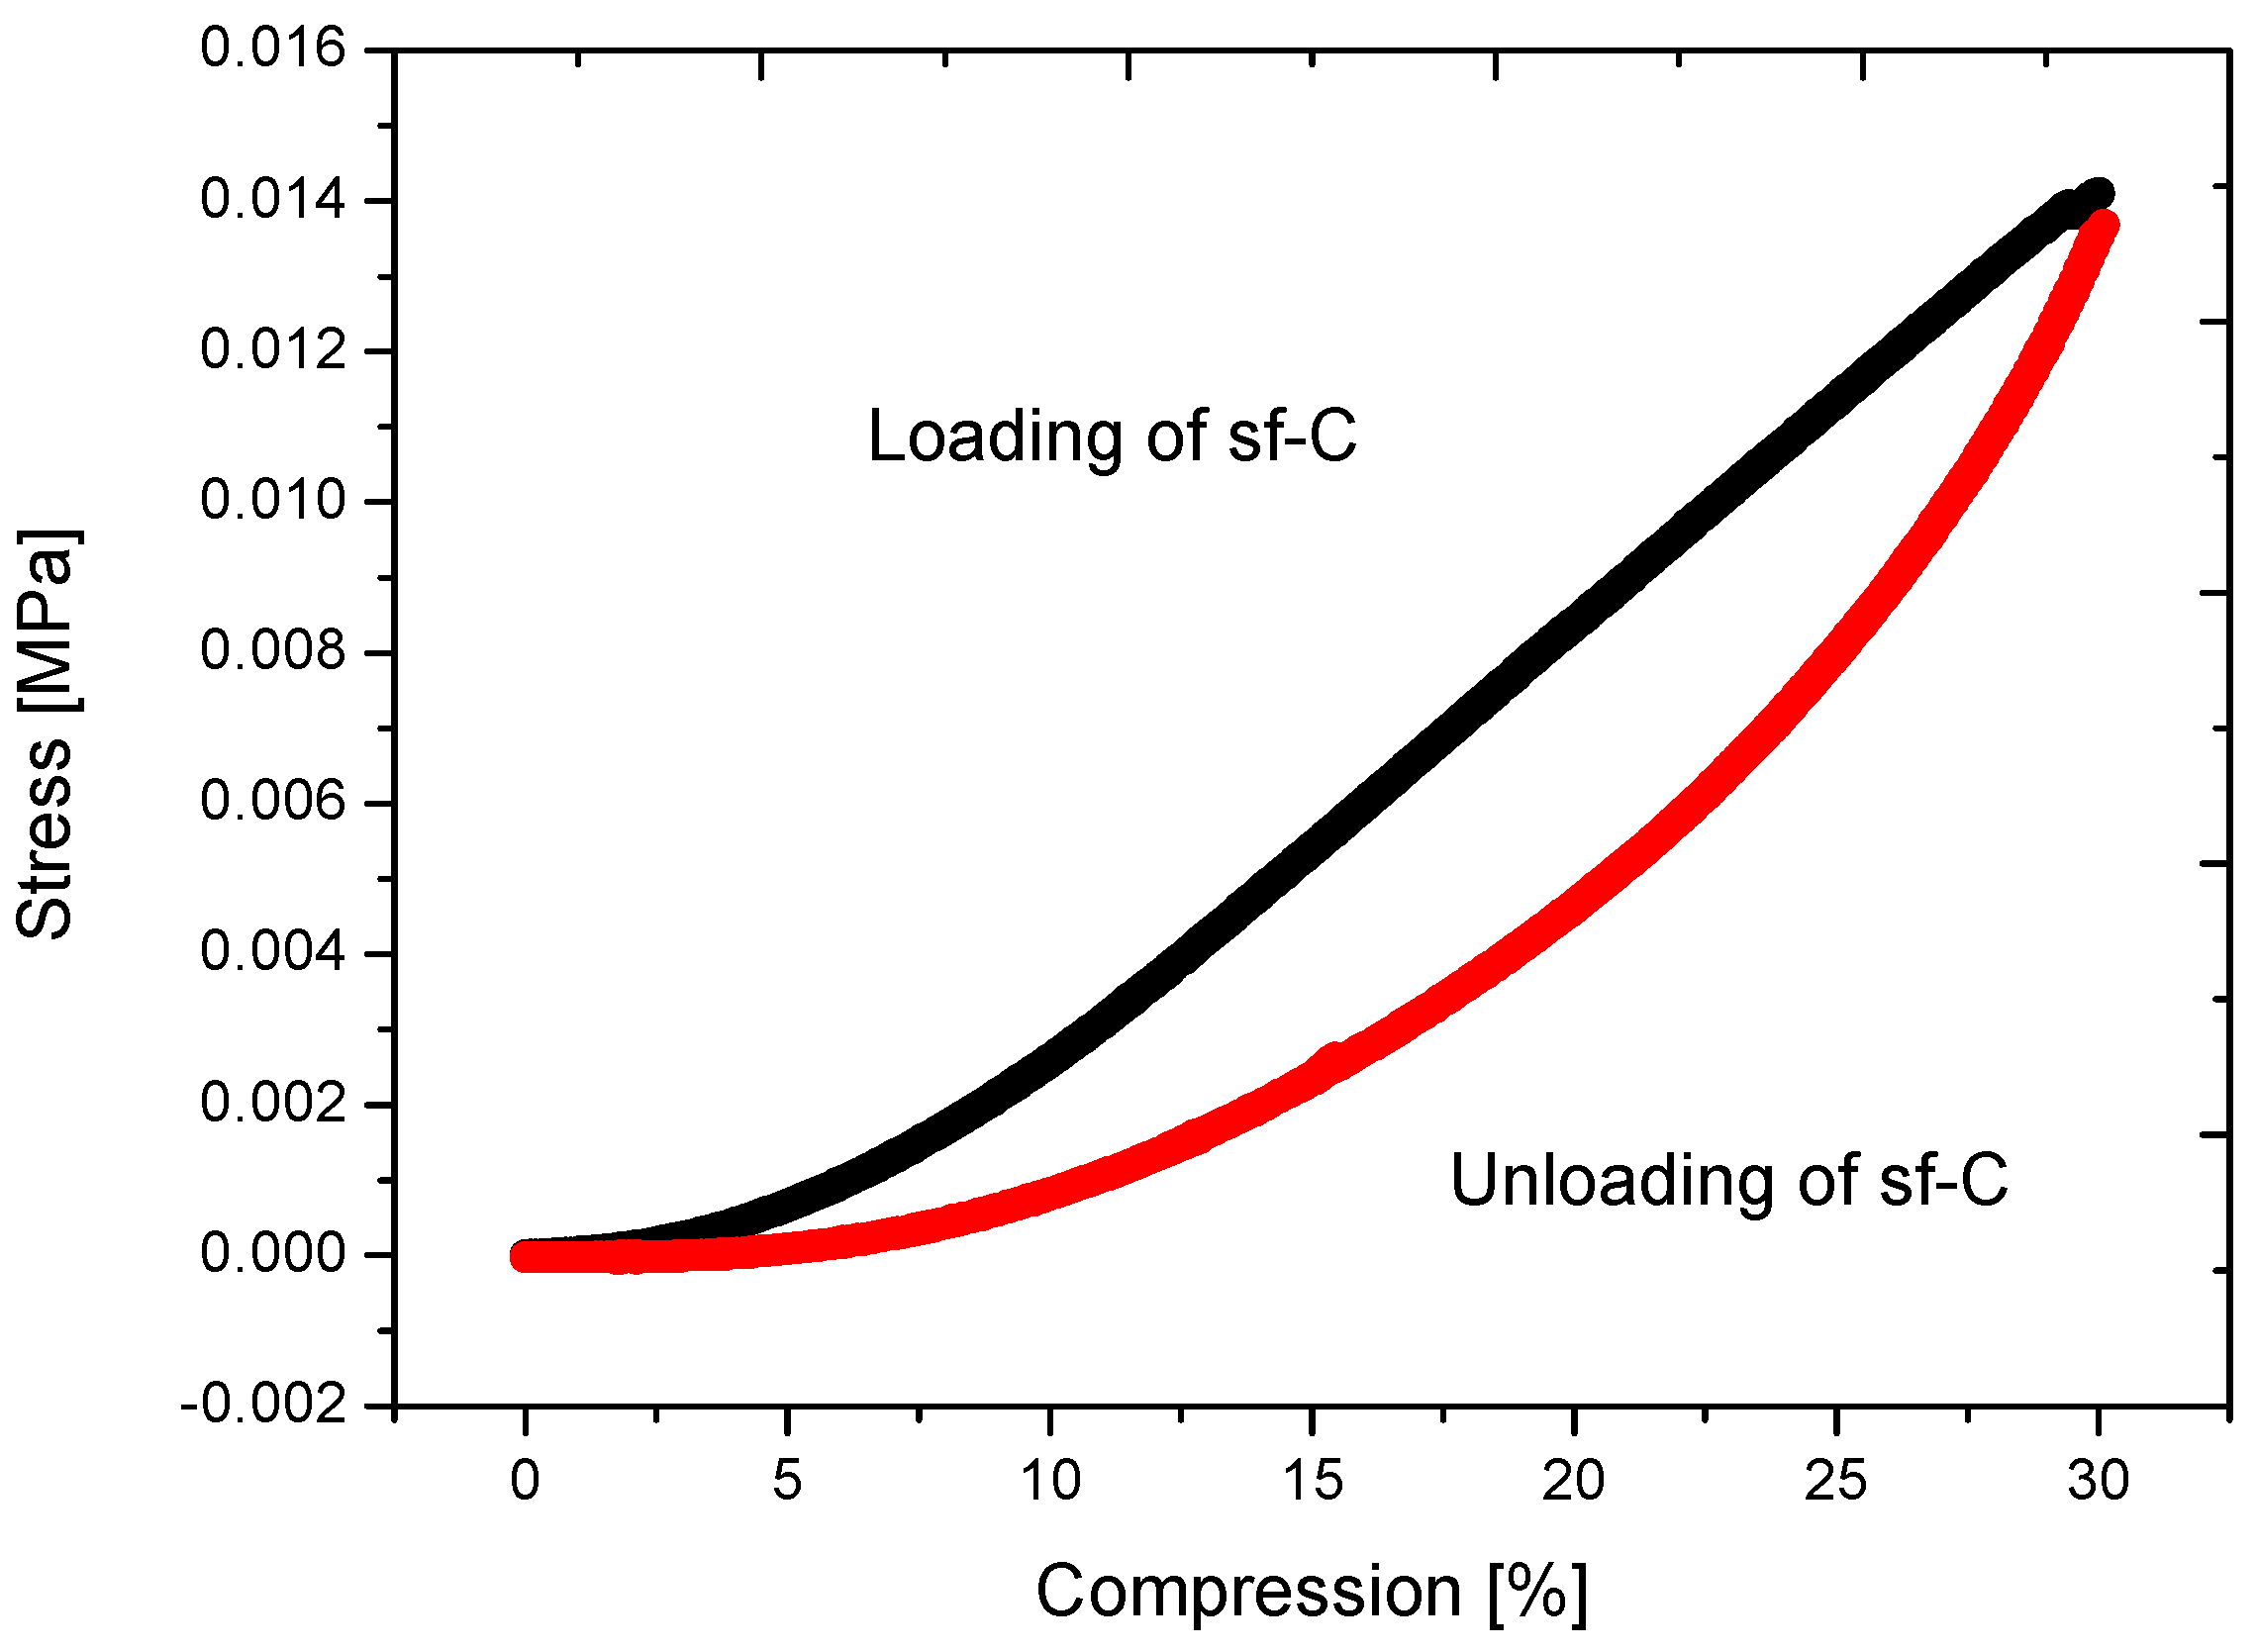
2.4.2. Super-Flexible Carbon Aerogel

The compression test of the super-flexible carbon aerogels was carried out similarly to that of the low-flexible aerogels. Since we know that these aerogels are more flexible, we compressed them twice as much as the low-flexible carbon aerogels. A large, oval pore and an adjacent small, round pore, shown in Figure 11, were chosen. A third, tiny, pore at the bottom right of Figure 11 was also tracked. Upon 10% of compression several changes in the structure were detected: First, the tiny pore in the corner disappeared. Second, the larger pore opened and two formerly connected particle chains disconnected. Third, the distance marked with an arrow between particles of the large oval pore increased as the compression progressed. After 20% of relative compression new particles and parts of the network previously in the background became visible. Finally, after 30% of compression the shape of the oval pore changes, and the round pore above could not be clearly identified anymore. The subsequent unloading gradually led back to the initial position of the pore walls, and also the shape of the pores was restored. The tiny pore in the corner reappeared, and the round pore obtained its initial shape. The network which came up from the background disappears. Certainly, the contact in the broken chain was not rebuilt, but the ends of the chains came back into very close proximity.
The compression curves form a small hysteresis loop, shown in the Figure 12, confirming a high degree of flexibility for this material. After 30% compression one can see that the sample is still in Hooke’s region. The deformation is elastically reversible.
Our investigations demonstrate the flexibility of the two types of carbon aerogels. With the help of SEM images it is possible to follow the reversible deformation of pore walls. We can see that large pores are crucial for a bending deformation of the walls without breaking. Pore walls formed with small particles such as sf-C possess a higher degree of flexibility. The pore walls of low-flexible carbon aerogels consist of larger particles with consequentially lower flexibility.
Since the porous structure is completely dependent on the synthesis route of the RF aerogels, the flexibility is tunable. A structure with as small as possible particles and as large as possible pores will possesses the highest ability for reversible deformation. Such a structure could be formed in highly diluted sol-solutions (with low resorcinol amount) and with a high amount of catalyst.
Nevertheless, the flexibility of carbon aerogels is limited. Due to the stiffness of the particles attained during pyrolysis, their flexibility is almost two times lower than that of the corresponding RF aerogels.

3. Materials and Methods

3.1. Materials and Methods

Anhydrous sodium carbonate and resorcinol (purity ≥ 98%) were purchased from Aldrich, aqueous solution of formaldehyde (37% w/w, stabilized with 10% methanol) from Merck, Germany. Acetone (pure, technical grade) was purchased from Th. Geyer, Germany. The pH values were continuously measured by means of a SevenEasy pH device with relative accuracy of ±0.01 and the pH electrode InLab® Expert Pro (Mettler Toledo, Giessen, Germany). The standardized aqueous solution of nitric acid (2.0 M) was supplied by Alfa Aesar, Karlsruhe, Germany. Deionized water was used for the synthesis and was obtained using a TKA DI 2000 water purification system (TKA, Niederelbert, Germany), which was regenerated by Evoqua Water Technologies GmbH (Günzburg, Germany). Sealable polypropylene containers of 180 mL for gelation (with screw-cap) and 400 mL containers for washing (press-on lid) were purchased from VWR, Darmstadt, Germany. Continuous supercritical drying was carried out using an autoclave with a 12 L volume (Eurotechnica, Bargteheide, Germany) using carbon dioxide 4.5 (purity ≥ 99.995%) from Praxair, Hürth, Germany. The ambient drying took place in a drying cabinet (Memmert GmbH, Schwabach, Germany). Carbonizations were carried out in an electric furnace (Standardofen “F(A)”, Gero Hochtemperaturöfen GmbH, Neuhausen, Germany). As inert gas, argon 4.6 (purity ≥ 99.996%) from Praxair (Düsseldorf, Germany) was used.

3.2. Synthesis of Aerogels

At room temperature, resorcinol (R) was dissolved in deionized water (W) and stirred at 150 rpm using a cross-magnetic stirring bar. Then, an aqueous solution of formaldehyde (F) and solid sodium carbonate (Cat) were added subsequently to the stirred resorcinol solution. After 5 min, the pH was adjusted to 5.4–5.6 by dropwise addition of 2N nitric acid solution. The stirring at room temperature was continued (lf-RF: 30 min; sf-RF: 60 min), and the homogeneous transparent solution was placed in a sealable polypropylene container for seven days in an oven at 80 °C (see Table 3). During gelation and curing the lf-RF gels became dark-brown, while sf-RF appeared beige or brown beige, due to different particle sizes in the structure of gels. After seven days of gelation and aging the wet lf-RF gel was dried for one day at 80 °C in a drying cabinet. The sf-RF gels were cooled down to the room temperature and transferred into an acetone bath in order to remove residual reagents and to exchange water by acetone being soluble in supercritical carbon dioxide. The acetone washing was repeated six times. The supercritical drying was carried out with CO2 in an autoclave of 12 L volume (Eurotechnica, Bargteheide, Germany) at 45 °C and 83 bars for 5 days (circa 32 h). The degassing rate was adjusted to 0.1 bars per minute.
One half of the resulting RF aerogels were subjected to pyrolysis. The aerogels were placed in the furnace, purged three times with argon, and heated to the carbonization temperature of 1000 °C. The heating rate was adjusted to 6–7 K·min−1, and argon was passed through the furnace applying a pressure of 4 bar. The samples were maintained at these conditions for 60 min and then cooled down to room temperature under a flow of argon.

3.3. Characterization

The bulk density and the linear shrinkage were calculated from measured volume and weight of an aerogel piece. The skeletal density was measured with AccuPyc (Micromeritics, Aachen, Germany). The thermal conductivity was determined at ambient conditions by the Transient Plane Source method with HotDisk 2500 S with a sensor 5501 (radius 6.403 mm) (Hot Disk, Goeteborg, Sweden). Surface area and pore size distribution of aerogels were determined by the nitrogen adsorption-desorption method BET/BJH (TriStarII, Micromeritics, Aachen, Germany). Before analysis, the samples were outgassed for 6 h at 110 °C and 0.1 mbar. The microstructure of the aerogels was investigated using a scanning electron microscope (Zeiss, Merlin, Germany). Non-conductive resorcinol-formaldehyde aerogels were coated with gold before microscopy. For all materials, compression tests were performed according to EN ISO 604 on a universal testing machine (Latzke, Wiehl, Germany) and using load cells of 100 N with a rate of compression of 1 mm per minute [43]. For the thermogravimetric analysis (TGA) the analyzer Netzsch-TGA 209 F1 Iris was used (Netzsch, Selb, Germany). The heating rate was adjusted to 10 K·min−1 under argon atmosphere with a flow rate of 40 mL·min−1.
The in-situ compression tests were performed with carbon aerogels cut to 10 mm × 10 mm × 5 mm samples and a rate of compression of 5 µm per minute. The measurements were carried out by means of a Kamrath & Weiss Deformation Devices System (DDS) machine (Dortmund, Germany) and a Zeiss Ultra 55 scanning electron microscope (Zeiss, Oberkochen, Germany). At the beginning of the measurements, one large pore in the structure of an aerogel was chosen, and its size was measured. During compression the selected pore was observed permanently, and after every 5% of relative compression the loading cell was stopped and a SEM image was taken. When the maximum relative compression was reached the sample was gradually unloaded, and, again, SEM images were taken every 5% of relative compression until reaching the initial position. The measurements showed that using a higher speed of compression leads to a too fast movement of the investigated pore, so that the pore under investigation was lost. Therefore, a relatively low speed of deformation given above was selected. The RF aerogels could not be investigated with this technique due to charging of the samples even during the first minutes of measurements. Due to manual cutting of the sample with a scalpel, the main uncertainty in these measurements originates from the size and shape of the sample. The not perfect parallelepiped shape of the samples is reflected in the compression curves, where the force starts to rise non-linearly until 1%–3% of compression.
The average particle size was calculated from SEM images from the linear extension of the particles between their boundaries [44], which is also applicable for aerogels as long as they possess a particulate structure.
The electrical conductivity of carbon aerogels was measured with the HTS Sigma II facility using a four-probe inline technique at room temperature [45].

4. Conclusions

Low- and super-flexible carbon aerogels were synthetized from flexible resorcinol-formaldehyde aerogels. Since there is a need for flexible structures for energy storage devices, developed aerogels could be suitable candidate for such materials. Properties of both RF and carbon aerogels are discussed in this work. The microstructure of the aerogels plays a decisive role in achieving their flexibility. With help of SEM in-situ compression tests we could for the first time visualize the flexibility in the network of carbon aerogels. This technique allows us an insight into the deformation of flexible aerogels and opens new possibilities in the characterization of flexible porous material. The low-flexible carbon aerogel (lf-C) was compressed up to 15%, and the super-flexible (sf-C) was compressed up to 30%. Both samples recovered almost completely back to initial size and shape after unloading.

Acknowledgments

We acknowledge the group of Marion Bartsch, Liudmila Chernova, and Philipp Watermeyer for great support with the in-situ measurements in SEM. We also thank colleagues from our department (Benjamin Ignatzi and Adam Barowski) for help in synthesis and pyrolysis. Our thanks also go to Johannes de Boor for great support with the measurements of electrical conductivity.

Author Contributions

The manuscript has not been submitted to other journal for simultaneous consideration. The manuscript has not been published previously. No data have been fabricated or manipulated (including images) to support our conclusions. Consent to submit has been received explicitly from all co-authors before the work is submitted. Authors whose names appear on the submission have contributed sufficiently to the scientific work and therefore share collective responsibility and accountability for the results.

Conflicts of Interest

The authors declare no conflict of interest.

Abbreviations

The following abbreviations are used in this manuscript:
RFResorcinol-Formaldehyde
WWater
CCarbon
sfsuper-flexible
lflow-flexible

References

  1. Pekala, R.W. Organic Carbon Aerogels from the Sol-Gel Polymerization of Phenolic-Furfural Mixtures. U.S. Patent 5744510A, 1998. [Google Scholar]
  2. Biener, J.; Stadermann, M.; Suss, M.; Worsley, M.A.; Biener, M.M.; Rose, K.A.; Baumann, T.F. Advanced carbon aerogels for energy applications. Energy Environ. Sci. 2011, 4, 656–667. [Google Scholar] [CrossRef]
  3. Zhang, S.Q.; Huang, C.G.; Zhou, Z.Y.; Li, Z. Investigation of the microwave absorbing properties of carbon aerogels. Mater. Sci. Eng. B Solid State Mater. Adv. Technol. 2002, 90, 38–41. [Google Scholar] [CrossRef]
  4. Hrubesh, L.W. Aerogel applications. J. Noncryst. Solids 1998, 225, 335–342. [Google Scholar] [CrossRef]
  5. Pekala, R.W.; Farmer, J.C.; Alviso, C.T.; Tran, T.D.; Mayer, S.T.; Miller, J.M.; Dunn, B. Carbon aerogels for electrochemical applications. J. Noncryst. Solids 1998, 225, 74–80. [Google Scholar] [CrossRef]
  6. Saliger, R.; Fischer, U.; Herta, C.; Fricke, J. High surface area carbon aerogels for supercapacitors. J. Noncryst. Solids 1998, 225, 81–85. [Google Scholar] [CrossRef]
  7. Hwang, S.-W.; Hyun, S.-H. Capacitance control of carbon aerogel electrodes. J. Noncryst. Solids 2004, 347, 238–245. [Google Scholar] [CrossRef]
  8. Pekala, R.W.; Alviso, C.T. Carbon Aerogels and Xerogels; MRS Online Proceedings Library: San Francisco, CA, USA, 1992; p. 3. [Google Scholar]
  9. Li, W.; Reichenauer, G.; Fricke, J. Carbon aerogels derived from cresol–resorcinol–formaldehyde for supercapacitors. Carbon 2002, 40, 2955–2959. [Google Scholar] [CrossRef]
  10. Tao, Y.; Endo, M.; Kaneko, K. A review of synthesis and nanopore structures of organic polymer aerogels and carbon aerogels. Recent Pat. Chem. Eng. 2008, 1, 192–200. [Google Scholar] [CrossRef]
  11. Pekala, R.W. Organic aerogels from the polycondensation of resorcinol with formaldehyde. J. Mater. Sci. 1989, 24, 3221–3227. [Google Scholar] [CrossRef]
  12. Barbieri, O.; Ehrburger-Dolle, F.; Rieker, T.P.; Pajonk, G.M.; Pinto, N.; Venkateswara Rao, A. Small-angle X-ray scattering of a new series of organic aerogels. J. Noncryst. Solids 2001, 285, 109–115. [Google Scholar] [CrossRef]
  13. Merzbacher, C.I.; Meier, S.R.; Pierce, J.R.; Korwin, M.L. Carbon aerogels as broadband non-reflective materials. J. Noncryst. Solids 2001, 285, 210–215. [Google Scholar] [CrossRef]
  14. Lin, C.; Ritter, J. Effect of synthesis pH on the structure of carbon xerogels. Carbon 1997, 35, 1271–1278. [Google Scholar] [CrossRef]
  15. Saliger, R.; Bock, V.; Petricevic, R.; Tillotson, T.; Geis, S.; Fricke, J. Carbon aerogels from dilute catalysis of resorcinol with formaldehyde. J. Noncryst. Solids 1997, 221, 144–150. [Google Scholar] [CrossRef]
  16. Horikawa, T.; Hayashi, J.I.; Muroyama, K. Controllability of pore characteristics of resorcinol–formaldehyde carbon aerogel. Carbon 2004, 42, 1625–1633. [Google Scholar] [CrossRef]
  17. Reuß, M.; Ratke, L. Subcritically dried RF-aerogels catalysed by hydrochloric acid. J. Sol-Gel Sci. Technol. 2008, 47, 74–80. [Google Scholar] [CrossRef]
  18. Yamamoto, T.; Nishimura, T.; Suzuki, T.; Tamon, H. Control of mesoporosity of carbon gels prepared by sol-gel polycondensation and freeze drying. J. Noncryst. Solids 2001, 288, 46–55. [Google Scholar] [CrossRef]
  19. Czakkel, O.; Marthi, K.; Geissler, E.; László, K. Influence of drying on the morphology of resorcinol–formaldehyde-based carbon gels. Microporous Mesoporous Mater. 2005, 86, 124–133. [Google Scholar] [CrossRef]
  20. Zhang, S.; Wang, J.; Shen, J.; Deng, Z.; Lai, Z.; Zhou, B.; Attia, S.; Chen, L. The investigation of the adsorption character of carbon aerogels. Nanostruct. Mater. 1999, 11, 375–381. [Google Scholar] [CrossRef]
  21. Hanzawa, Y.; Hatori, H.; Yoshizawa, N.; Yamada, Y. Structural changes in carbon aerogels with high temperature treatment. Carbon 2002, 40, 575–581. [Google Scholar] [CrossRef]
  22. Zanto, E.J.; Al-Muhtaseb, S.A.; Ritter, J.A. Sol-gel-derived carbon aerogels and xerogels: Design of experiments approach to materials synthesis. Ind. Eng. Chem. Res. 2002, 41, 3151–3162. [Google Scholar] [CrossRef]
  23. Pekala, R.W.; Alviso, C.T.; LeMay, J.D. Organic aerogels: Microstructural dependence of mechanical properties in compression. J. Noncryst. Solids 1990, 125, 67–75. [Google Scholar] [CrossRef]
  24. Schwan, M.; Ratke, L. Flexibilisation of resorcinol-formaldehyde aerogels. J. Mater. Chem. A 2013, 1, 13462–13468. [Google Scholar] [CrossRef]
  25. Schwan, M.; Tannert, R.; Ratke, L. New soft and spongy resorcinol–formaldehyde aerogels. J. Supercrit. Fluids 2016, 107, 201–208. [Google Scholar] [CrossRef]
  26. Zhou, G.; Li, F.; Cheng, H.-M. Progress in flexible lithium batteries and future prospects. Energy Environ. Sci. 2014, 7, 1307–1338. [Google Scholar] [CrossRef]
  27. Wang, C.; Wallace, G.G. Flexible electrodes and electrolytes for energy storage. Electrochim. Acta 2015, 175, 87–95. [Google Scholar] [CrossRef]
  28. Sun, H.; Xu, Z.; Gao, C. Multifunctional, ultra-flyweight, synergistically assembled carbon aerogels. Adv. Mater. 2013, 25, 2554–2560. [Google Scholar] [CrossRef] [PubMed]
  29. Bonijoly, M.; Oberlin, M.; Oberlin, A. A possible mechanism for natural graphite formation. Int. J. Coal Geol. 1982, 1, 283–312. [Google Scholar] [CrossRef]
  30. Lin, C.; Ritter, J.A. Carbonization and activation of sol–gel derived carbon xerogels. Carbon 2000, 38, 849–861. [Google Scholar] [CrossRef]
  31. Hrubesh, L.W.; Pekala, R.W. Thermal properties of organic and inorganic aerogels. J. Mater. Res. 1994, 9, 731–738. [Google Scholar] [CrossRef]
  32. Schwab, H. Vakuumisolationspaneele-Gas- und Feuchteeintrag Sowie Feuchte- und Wärmetransport. Ph.D. Thesis, Bayerische Julius-Maximilians-Universität Würzburg, Würzburg, Germany, 2004. [Google Scholar]
  33. Raed, K. Investigation of Knudsen and Gas-Atmosphere Effects on Effective Thermal Conductivity of Porous Media. Ph.D. Thesis, TU Bergakademie Freiberg, Freiberg, Germany, 2013. [Google Scholar]
  34. Reichenauer, G. Structural characterization of aerogels. In Aerogels Handbook; Aegerter, M.A., Leventis, N., Koebel, M.M., Eds.; Springer: New York, NY, USA, 2011; pp. 449–498. [Google Scholar]
  35. Lu, X.; Caps, R.; Fricke, J.; Alviso, C.T.; Pekala, R.W. Correlation between structure and thermal conductivity of organic aerogels. J. Noncryst. Solids 1995, 188, 226–234. [Google Scholar] [CrossRef]
  36. Lu, X.; Nilsson, O.; Fricke, J.; Pekala, R.W. Thermal and electrical conductivity of monolithic carbon aerogels. J. Appl. Phys. 1993, 73, 581–584. [Google Scholar] [CrossRef]
  37. Kang, S.-J.L. Initial stage sintering. In Sintering; Kang, S.-J.L., Ed.; Butterworth-Heinemann: Oxford, UK, 2005; pp. 39–55. [Google Scholar]
  38. Gruber, E.E.; Mullins, W.W. Extended analysis of surface scratch smoothing. Acta Metall. 1966, 14, 397–403. [Google Scholar] [CrossRef]
  39. Trick, K.A.; Saliba, T.E. Mechanisms of the pyrolysis of phenolic resin in a carbon/phenolic composite. Carbon 1995, 33, 1509–1515. [Google Scholar] [CrossRef]
  40. Mulik, S.; Sotiriou-Leventis, C.; Churu, G.; Lu, H.; Leventis, N. Cross-linking 3D assemblies of nanoparticles into mechanically strong aerogels by surface-initiated free-radical polymerization. Chem. Mater. 2008, 20, 5035–5046. [Google Scholar] [CrossRef]
  41. Yang, J.; Li, S.; Yan, L.; Liu, J.; Wang, F. Compressive behaviors and morphological changes of resorcinol—Formaldehyde aerogel at high strain rates. Microporous Mesoporous Mater. 2010, 133, 134–140. [Google Scholar] [CrossRef]
  42. Sing, K.S.W. Reporting physisorption data for gas/solid systems with special reference to the determination of surface area and porosity (provisional). Pure Appl. Chem. 1982, 54, 2201–2218. [Google Scholar] [CrossRef]
  43. National Standards Authority of Ireland (NSAI). ISO 844: 2014(e) Rigid Cellular Plastics-Determination of Compression Properties; NSAI: Dublin, Ireland, 2014. [Google Scholar]
  44. DIN EN ISO 643:2013-05. Stahl—Mikrophotographische Bestimmung der Erkennbaren Korngröße (ISO 643:2012), German version ENISO643:2012.
  45. De Boor, J.; Stiewe, C.; Ziolkowski, P.; Dasgupta, T.; Karpinski, G.; Lenz, E.; Edler, F.; Mueller, E. High-temperature measurement of seebeck coefficient and electrical conductivity. J. Electron. Mater. 2013, 42, 1711–1718. [Google Scholar] [CrossRef]
Figure 1. Microstructure of lf-RF aerogel with an average particle size of 0.45 µm and large pores of about 8.5 µm.
Carbon 02 00022 g001
Figure 2. Microstructure of lf-C aerogel with an average particle size of about 0.36 µm and average pore size of about 71 nm.
Carbon 02 00022 g002
Figure 3. Microstructure of sf-RF aerogel with particles of about 0.12 µm and an average pore size of about 1.8 µm.
Carbon 02 00022 g003
Figure 4. Microstructure of sf-C aerogel with an average particle size of 0.09 µm and an average pore size of about 104 nm.
Carbon 02 00022 g004
Figure 5. Compression curves of low-flexible aerogels.
Carbon 02 00022 g005
Figure 6. Compression curves of super-flexible aerogels.
Carbon 02 00022 g006
Figure 7. Adsorption and desorption isotherms of lf-RF and lf-C aerogels.
Carbon 02 00022 g007
Figure 8. Adsorption and desorption isotherms of sf-RF and sf-C aerogels.
Carbon 02 00022 g008
Figure 9. In-situ compression test in SEM of the low-flexible carbon aerogel. Sample was compressed until 15% of initial width and unloaded. The red arrows show the area of most visible deformation during test. A closing of the pore in the upper part and reopening after unloading can be observed.
Carbon 02 00022 g009
Figure 10. Loading and unloading curves of the low-flexible carbon aerogel. The large hysteresis speaks for the deformation of the sample.
Carbon 02 00022 g010
Figure 11. In-situ compression test in SEM of the super-flexible carbon aerogel. The deformation of the sample up to 30% is completely elastic. Three positions, marked with red arrows, show opening, closing, and deformation of pores. After unloading the pores of different size come back to the initial size and shape.
Carbon 02 00022 g011
Figure 12. Loading and unloading curves of the super-flexible carbon aerogel showing reversible deformation after 30% compression.
Carbon 02 00022 g012
Table 1. General properties of synthesized aerogels.
SampleBulk DensitySkeletal Density aPorosity bElectrical Conductivity cSBETThermal Conductivity dCompressive Modulus
(g·cm−3)(g·cm−3)(%)(S·cm−1)(m2·g−1)(W·m−1·K−1)(MPa)
lf-RF0.0931.51 ± 0.00794-50.044 ± 0.00020.07
lf-C0.0891.99 ± 0.010950.21 ± 0.0156040.050 ± 0.00070.16
sf-RF0.0741.46 ± 0.00795-280.041 ± 0.00090.02
sf-C0.0572.12 ± 0.033970.11 ± 0.0156590.069 ± 0.00170.06
a,c,d Standard deviations were determined after multiple measurements of the samples: 10 measurments for a; 4 for c,d; b The porosity was calculated from bulk and skeletal densities.
Table 2. Comparison of two methods for the calculation of particle size.
SampleParticle Size Determined from SEM Image, µmParticle Size Calculated from TGA, µm
lf-C0.360.30
sf-C0.090.07
Table 3. Synthesis parameters of low-flexible and super-flexible resorcinol-formaldehyde and carbon aerogels.
Type of AerogelR:Cat Molar RatioR:W Molar RatioR:F Molar RatioStirring Time (Min)Drying ConditionsPyrolysis Conditions
lf-RF500.0080.530Ambient pressure, 80 °C, 1 day-
lf-C500.0080.530Ambient pressure, 80 °C, 1 day1000 °C, one hour, with Ar
sf-RF500.0080.560With super-critical CO2-
sf-C500.0080.560With super-critical CO21000 °C, one hour, with Ar

