Article

Pulsed Laser Annealing of Deposited Amorphous Carbon Films

by
Arianna D. Rivera
1,*,
Eitan Hershkovitz
1,
Panagiotis Panoutsopoulos
1,
Manny X. de Jesus Lopez
1,
Bradley Simpson
1,
Honggyu Kim
1,
Rajaram Narayanan
2,
Jesse Johnson
3 and
Kevin S. Jones
1,*
1
Department of Materials Science and Engineering, University of Florida, Gainesville, FL 32611, USA
2
Applied Materials, Santa Clara, CA 95054, USA
3
Mainstream Engineering Corporation, Rockledge, FL 32955, USA
*
Authors to whom correspondence should be addressed.
Submission received: 20 June 2025 / Revised: 18 July 2025 / Accepted: 4 August 2025 / Published: 8 August 2025
(This article belongs to the Special Issue Carbon Functionalization: From Synthesis to Applications)

Abstract

Pulsed laser annealing (PLA) was performed on a 0.3 μm thick hydrogenated amorphous carbon (a-C:H) film deposited on silicon substrate by plasma-enhanced chemical vapor deposition (PECVD). The 532 nm, 32 ns PLA ranged in fluence from 0.2 to 0.94 J cm−2. There were no visible signs of film delamination over the entire fluence range for a single pulse. As the fluence increased, graphitization of the amorphous film bulk was observed. However, at the near surface of the film, there was a concomitant increase in sp3 content. The sp3 bonding observed is the result of the formation of a thin diamond-like layer on the surface of the carbon film. Along with increasing laser fluence, the film swelled by 75% up to 0.6 J cm−2. In addition, carbon fiber formation was observed at 0.6 J cm−2, increasing in size and depth up through 0.94 J cm−2. The origin of this transformation may be associated with a rapid outgassing of hydrogen from the amorphous carbon during the PLA step. Additionally, there was a dramatic increase in the visible light absorption of these thin films with increasing laser fluence, despite the films being less than a micron thick. These results suggest that PLA of a-C:H film is a useful method for modifying the surface structure for optical or electrochemical applications without film ablation.

1. Introduction

Carbon thin films have been an area of study for many years because of the various atomic structures that can be created, from amorphous states to graphitic and diamond like states [1,2,3,4]. Its different allotropes, such as fullerenes, nanotubes, and diamond-like carbon (DLC), as well as hybridizations, have applications ranging from battery anodes to thermally conducting thin films for heat dissipation. Hydrogenated amorphous carbon films (a-C:H) have been the focus of many studies due to their unique mechanical, electrical, chemical, and optical properties [2,5,6,7,8,9,10,11,12]. As opposed to non-hydrogenated carbon films, hydrogen content can be substantial (upwards of 37 at%) and relieves internal stress within the film [13]. These films can be used as masking films for reactive ion etching, coatings for mechanical wear, in solar cells, or in other applications [14,15,16,17,18]. Annealing of a-C:H films has been widely studied as an effective method for modifying the microstructure and hybridization, in turn affecting film characteristics like hardness [19,20,21,22,23]. In general, it has been observed that conventional furnace annealing leads to the formation of graphitic clusters and, subsequently, an increase in the amount of sp2 bonding present in the carbon film with increasing temperature [24,25]. However, the peak temperature of these anneals is limited by furnace materials and long durations can be problematic in manufacturing, so there is a rising interest in alternative surface annealing techniques to modify the films [26,27,28,29]. In contrast to traditional annealing techniques, laser annealing is a surface-confined high-temperature process which can be used to treat thin films while maintaining the substrate bulk at near ambient temperatures due to the high thermal gradient.
It has been found that amorphous carbon films such as DLC and tetrahedral amorphous carbon (ta-C) can be transformed into diamond and “Q-carbon” by ultraviolet (UV) nanosecond pulsed laser annealing (PLA) [30,31]. Interestingly, modification of the amorphous film into Q-carbon yields a new phase harder than diamond. Amorphous carbon films typically start with a high sp3 content (>50%) and laser annealing is observed to increase the sp3 content to over 80% [23]. This increase in sp3 content during annealing is thought to be associated with the formation of phase-separated non uniform regions of diamond and Q-carbon phases [32,33].
Since film properties vary with laser wavelength, pulse duration, and the number of pulses, a fixed visible wavelength laser at a single pulse with varying fluence was studied in an effort to broaden understandings of laser annealing of a-C:H films [20,34,35]. There are no reported studies of visible wavelength (532 nm) laser annealing on low-sp3-content amorphous carbon films at higher fluences (>0.25 J cm−2) because of the ablation issue [20]. The films in these previous studies were deposited using pulsed laser deposition (PLD) and contained no residual hydrogen. The goal of this study is to investigate PLA on a-C:H films deposited by plasma-enhanced chemical vapor deposition (PECVD) rather than PLD to determine the effect on the microstructure of these low-sp3-content films.

2. Materials and Methods

A 0.3 μm thick a-C:H film was deposited on a 300 mm (001) silicon wafer using PECVD. The growth condition specifics of the a-C:H films are discussed elsewhere [36,37]. All samples studied in this investigation were diced from this single wafer. Irradiation of the samples was carried out using a double Nd:YAG laser system producing a 532 nm wavelength beam. To achieve the optimal distribution of energy for a uniform annealing area, i.e., a top-hat profile, the laser setup replicated that described by Adams et al., where the beam path follows the subsequent optics setup: pulse stretcher assembly, beam homogenizer assembly, micro-lens arrays, and finally sample exposition in the processing chamber [38]. All the experiments performed herein investigated the effects after a 32 ns single laser pulse. Using a square aperture, the beam shaping optics produced a 7 × 7 mm2 annealing window at the processing chamber. The annealing fluence used to process the samples ranged from 0.2 to 0.94 J cm−2. The process chamber, where samples were placed for annealing, was set under a vacuum using a roughing pump, achieving a pressure of approximately 0.7 kPa.
The carbon films were subsequently characterized by Raman spectroscopy, X-ray photoelectron spectroscopy (XPS), scanning electron microscopy (SEM), transmission electron microscopy (TEM) and UV-Vis spectroscopy. SEM was performed on a FEI Nova 430 SEM. TEM was carried out using the FEI Talos F200i TEM, as well as the Themis Z aberration corrected S/TEM using an operating voltage of 200 keV for both microscopes. Prior to TEM sample preparation, a 3 nm thick HfO2 layer was deposited using atomic layer deposition (ALD) for protection and distinction from the standard Pt capping layer. Cross-sectional TEM samples were prepared using a FEI Helios Nanolab 600i Dual Beam focused ion beam system, where Pt capping layer was deposited to protect the surface from ion beam exposure and milling. Energy dispersive spectroscopy (EDS) within the TEM was also employed after HfO2 deposition on as-deposited and PLA samples, which was collected using a four-quadrant Super-X EDS detector.
Raman spectroscopy was performed using a Horiba LabRAM ARAMIS, collected at 532 nm excitation wavelength. Spectra data were collected over the range of 300–3000 cm−1 to capture common spectral peaks associated with both graphitic and amorphous carbon. The resulting curves from initial runs were normalized with respect to their peak intensity before deconvolution with Origin Pro. XPS was performed using an Ulvac-PHI Versaprobe II. The C1s, O1s, and a survey were performed on every sample. Overall, 30 sweeps were performed for the C1s spectra, 15 sweeps for the O1s spectra, and 1 sweep for the survey. The number of sweeps for the C1s spectrum was increased to aid in the subsequent peak deconvolution. The pass energy for the C1s and O1s spectra was set to 23.5 eV and the survey spectrum used a pass energy of 93 eV. Peak deconvolution was performed using PHI MultiPak Spectrum software version 9.9.0.8. The Shirley method was used to remove the background signal for baseline correction and, subsequently, three Gaussian curves were fit to the C1s spectrum corresponding to sp2 bonds, sp3 bonds, and C-O contamination bonds [8,39,40,41]. Depth profiling was completed with the in situ sputter gun built into the chamber. Samples were studied over various sputter durations from 1 min to 35 min utilizing 1 kV Ar ions. In addition, UV-Vis spectroscopy was carried out to investigate the light absorbance of these thin films using the Perkin-Elmer Lambda 800 in the visible light wavelength range.
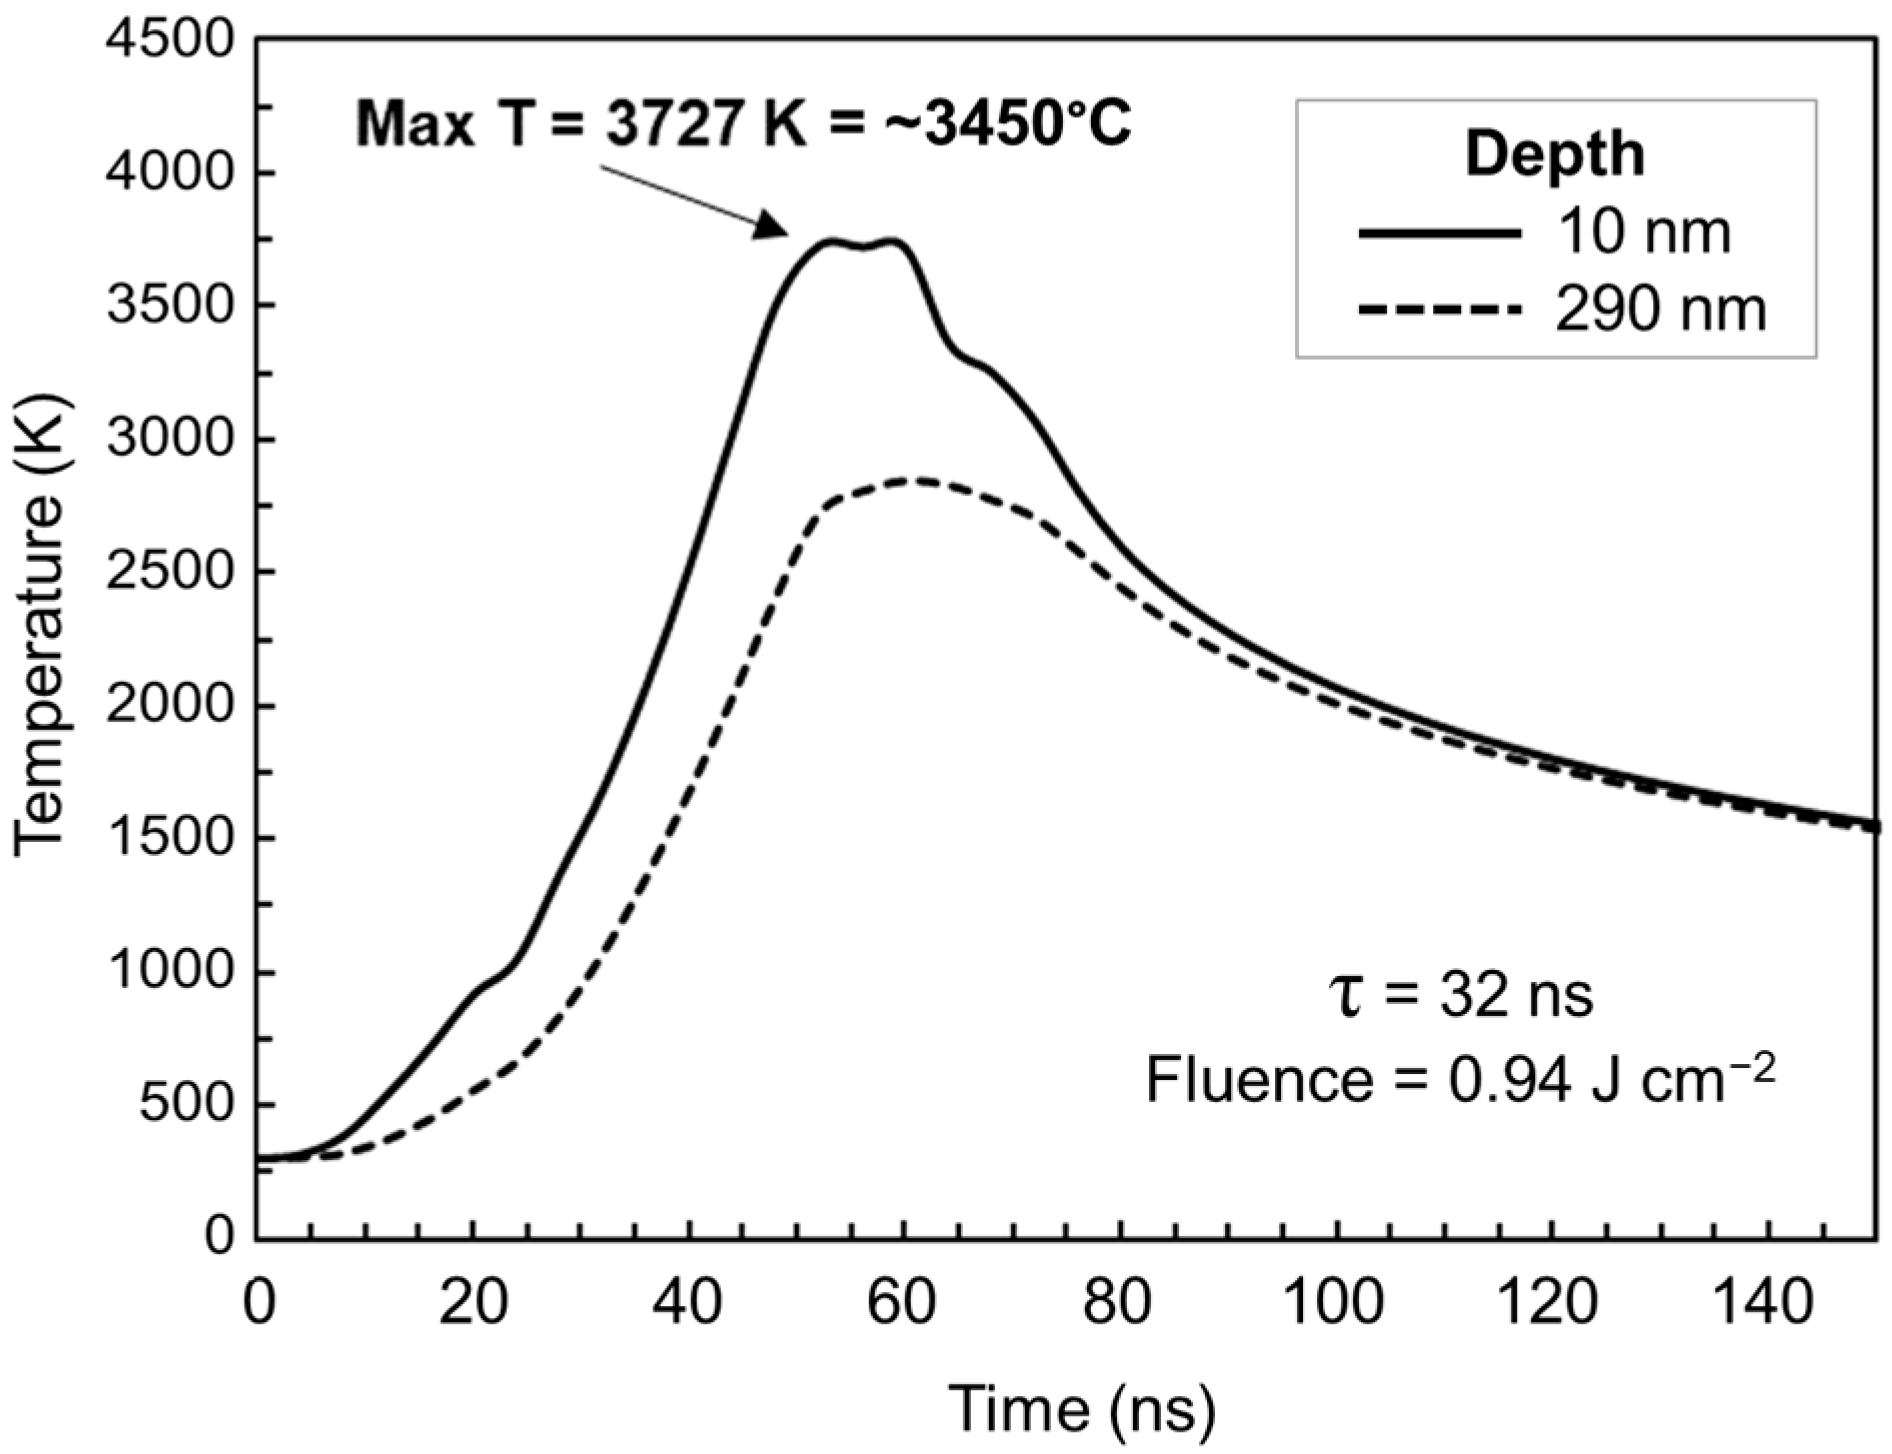
Simulations to better understand the maximum temperature of the carbon film during the laser annealing process were performed using the Laser Induced Melting Prediction Simulator of One-Dimensional Heat Flow During Pulsed Laser Melting of Thin Films (LIMPS).

3. Results

3.1. Inspection of Carbon Film Delamination

SEM images for different laser fluences are shown in Figure 1. The surface shows no visible signs of delamination post-anneal with a single pulse in Figure 1b,c, indicating that laser annealing with higher fluence leaves a uniform carbon film grown by PECVD. Spallation, where the film exfoliates initiating at the surface and eventually leads to ablation upon further processing, is also absent, indicating film and surface integrity after PLA at the microscopic scale. With a single pulse PLA, no delamination was observed for the range of fluences. However, when the number of pulses is increased to 10 pulses, as observed in Figure 1d,e, film spallation occurs. No further characterization was completed on the 10 pulse samples.

3.2. Chemical Bonding States of a-C:H Film After PLA

Raman spectroscopy is very useful in carbon studies for helping decipher the local atomic structure, as well as disorder. The Raman spectra, shown in Figure 2, depict the results as laser fluence increases, which was offset along the y-axis in order from as-deposited to the highest annealing fluence, shown from top to bottom, respectively. The spectrum shows the D-band at 1350 cm−1, where its intensity is inversely proportional to long-range order, i.e., describes the amount of disorder in the film [42]. The G band arises at 1560 cm−1, purely from sp2 bonding and is known as the graphite band, where carbon bonds in the lattice are stretched. The 2D band is found around 2700 cm−1, approximately double the wavenumber of the D peak, and is indicative of sp2 bonding and graphene. Other peaks also present in the Raman spectra are discussed later.
The as-deposited sample, represented as the black curve in Figure 2, displays the familiar characteristics of amorphous carbon, with a broad D peak and the G peak shifted to a lower wavenumber [3]. The 0.2 J cm−2 sample shows an increase in intensity and a broadening of the D peak. Increasing to 0.3 J cm−2 yields a more graphite-like carbon film, with an increase in the sp2 G peak in the spectrum. The D peak is no longer broad and clearly exhibits a peak centered at 1350 cm−1.
After a fluence of 0.4 J cm−2, it appears that graphitization is abundant in the film, as the right shoulder of the G peak is apparent with the D’ peak. The latter peak, located at 1620 cm−1, describes sp2-hybridized carbon. More evidence of predominant sp2 character is the discernable intensity of both the 2D band and D + G band found at 2700 cm−1 and 2935 cm−1, respectively. The former band—the 2D peak—becomes more pronounced with increasing fluence. The appearance of the 2D band in conjunction with the distinct G peak is a typical attribute of graphitic materials [43]. These aforementioned Raman peaks are attributed to sp2-hybridized carbon materials, belonging to the second-order region of carbon vibrational modes. A characteristic nitrogen peak around 2330 cm−1 is observed in all samples, as Raman characterization was performed under ambient conditions [44]. This may be due to the slight variability of nitrogen that adsorbs onto the surface prior to characterization.
A peak at 520 cm−1 is related to the Si substrate, present in the as-deposited sample and the lowest fluence samples. It is no longer detectable at fluences of ≥0.3 J cm−2 and greater. Even after a single pulse, it was observed that the visible light was absorbed much more effectively after laser annealing. This may have impacted the ability to observe the Si substrate using Raman with visible wavelength, thus decreasing the Si signal with increasing laser fluence.
Deconvolution of the Raman spectra was performed by fitting two Gaussian curves with the peaks centered at the D and G band position [41]. The ratio of the two peaks was evaluated through the height intensity ratio rather than the area ratio, as this provides more stability and practicality in reporting the peak ratio analysis [41,45]. As described in Figure 3, the increase in the D to G band peak ratios with increasing fluence suggests that there is graphitization of the film, arranging the amorphous film to an ordered structure. The increase in the wavenumber of the G band at fluences ≥ 0.4 J cm−2 also supports the amorphous to graphitic ordering [2]. The G peak, distinctive of all sp2 bonded carbon substrates, represents the E2g vibrational mode where carbon bonds stretch in plane. However, it is not possible to singularly quantify the sp2:sp3 bonding ratio from the Raman data alone, especially since visible light Raman spectra are dominated by sp2 vibrations [41,46]. XPS was used on the PLA samples to further discern the difference in bonding type and complement the Raman data.
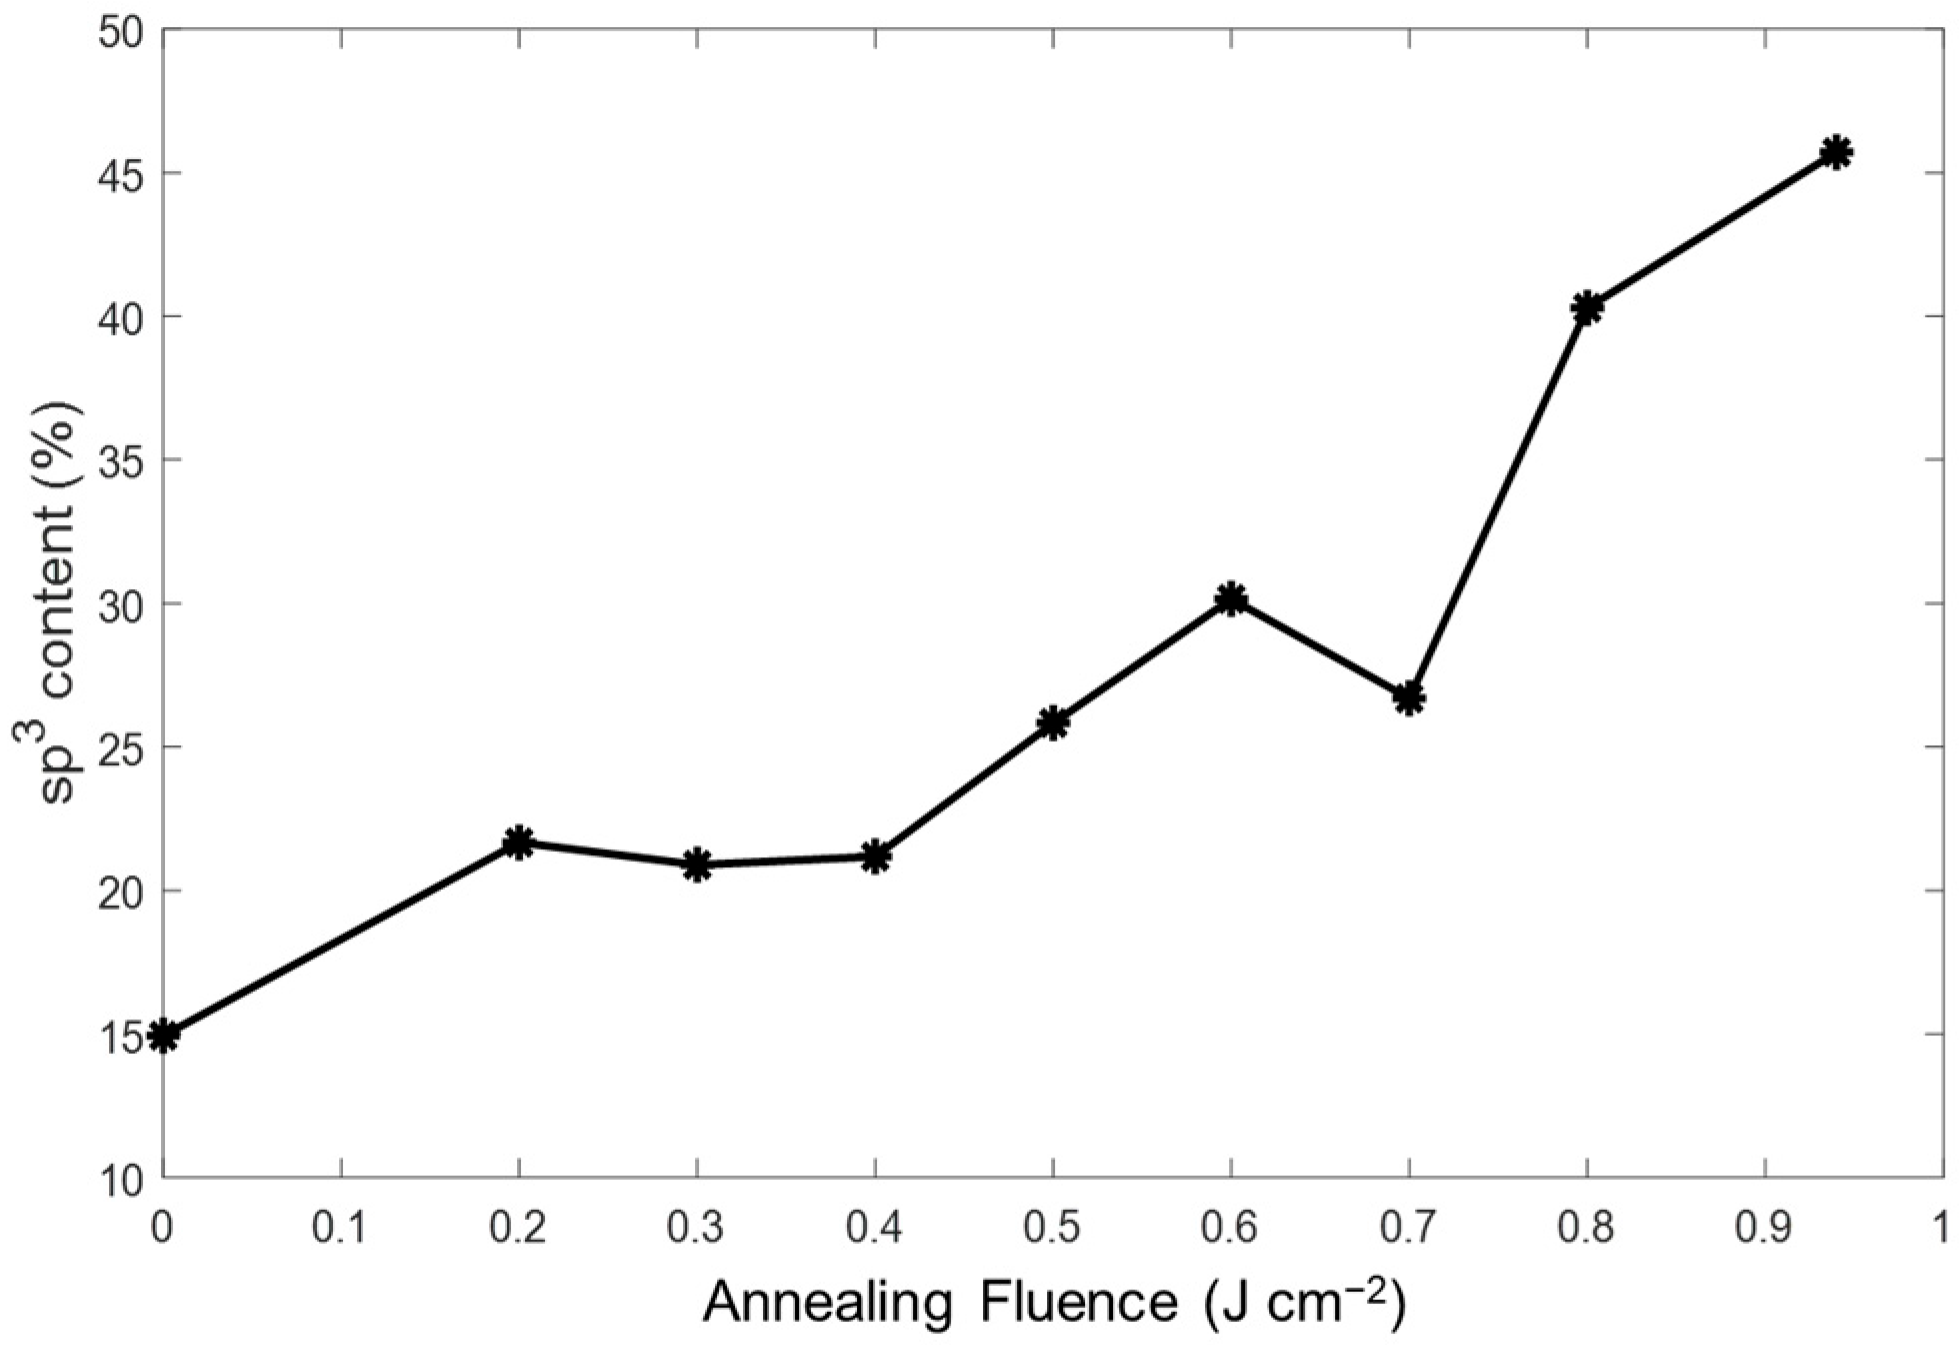
Figure 4 shows the XPS spectrum of the sample after laser annealing at 0.5 J cm−2. After background removal, each XPS spectrum was deconvoluted into three peaks corresponding to sp2, sp3, and C-O bands, demonstrating each one’s unique binding energies. The black line shows the data post-background removal, the green line represents the sp2 band, the blue line the sp3 band, the gray line the C-O contamination band, and the red line the cumulative peak (summation of the green, blue, and gray lines). The sp3 content was then calculated from the ratio of the corresponding sp3 peak area divided by the sum of the sp2 and sp3 peak areas, as summarized in Figure 5 [47].
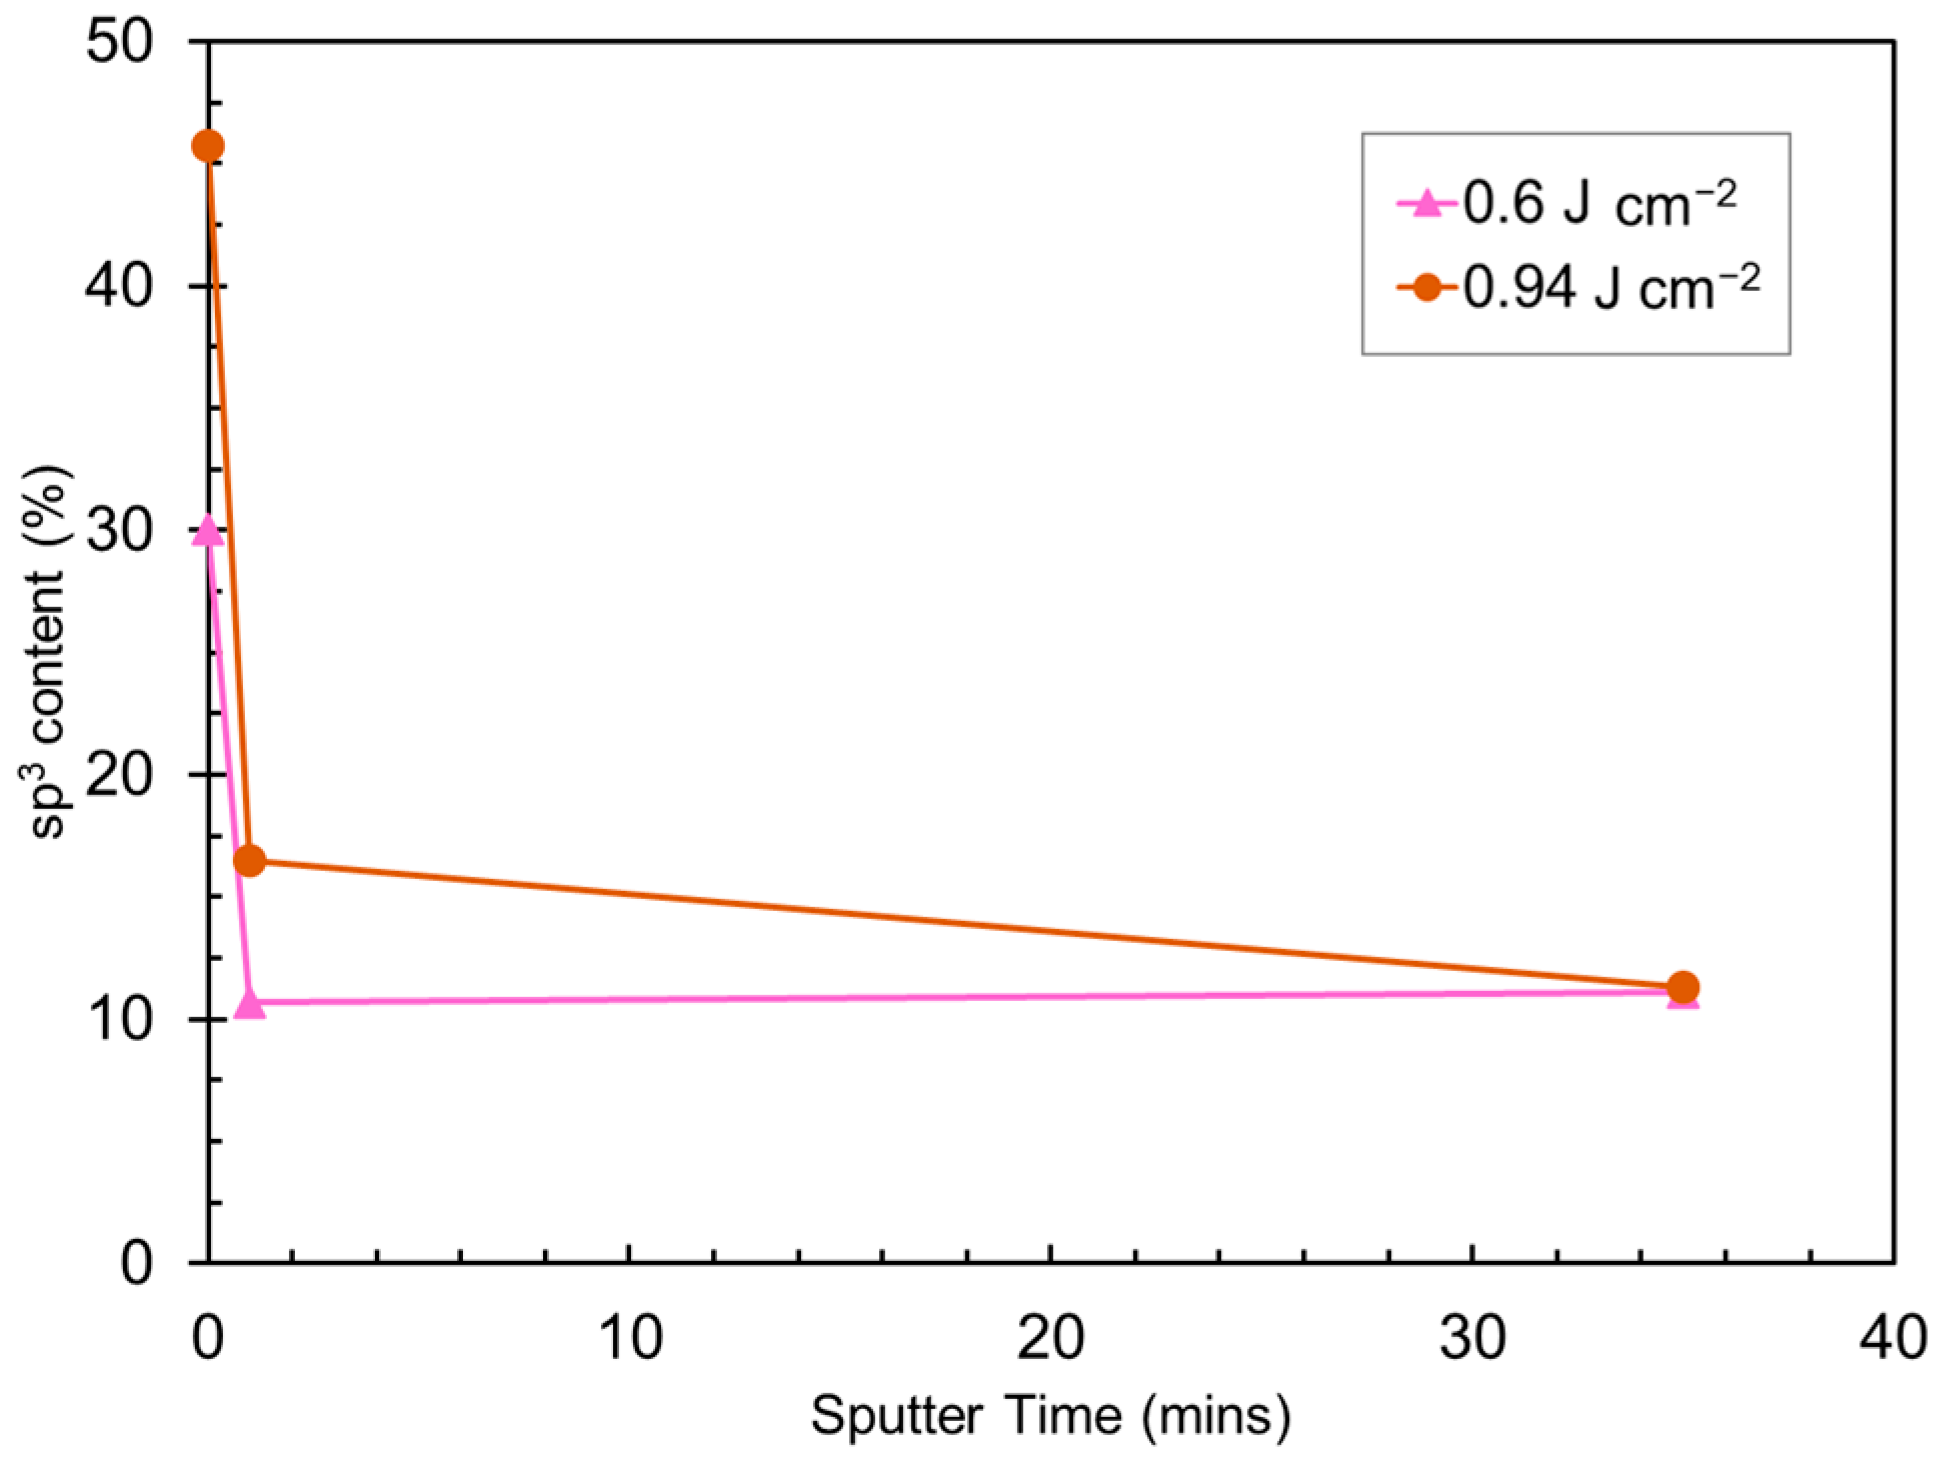
Figure 5 shows the sp3 content as a function of annealing fluence. The increase in sp3 content with increasing laser fluence is dramatic. The film’s initial sp3 content is 15% and, upon annealing with the greatest fluence of 0.94 J cm−2, the sp3 content increases three-fold to 45%. It is known that Raman probes the entire thickness of the carbon film while XPS is a surface analysis technique, and so further investigation of the location of the sp3 content in the film was performed. Samples that resulted in the moderate (30%) and greatest (46%) values of sp3 content, i.e., at fluences of 0.6 and 0.94 J cm−2, respectively, underwent subsequent depth profiling via ion sputtering.
Figure 6 shows the depth distribution for the two different laser annealing fluences, where the ion sputter rate was estimated to be less than 10 nm min−1. The sp3 content dropped dramatically after sputtering for only 1 min, suggesting that the higher sp3 content in the film is less than 10 nm thick. This additional XPS technique, in conjunction with the Raman spectroscopy and XPS results, demonstrates that the original a-C:H film is converted to a more complex film after PLA. This suggests that only a thin layer of the surface (<10 nm) is being converted to a film with higher sp3 (diamond-like) surface, while the bulk of the 0.3 μm film appears to be forming a more ordered (possibly graphitic) structure.

3.3. Microstructural Characterization of PLA a-C:H Film

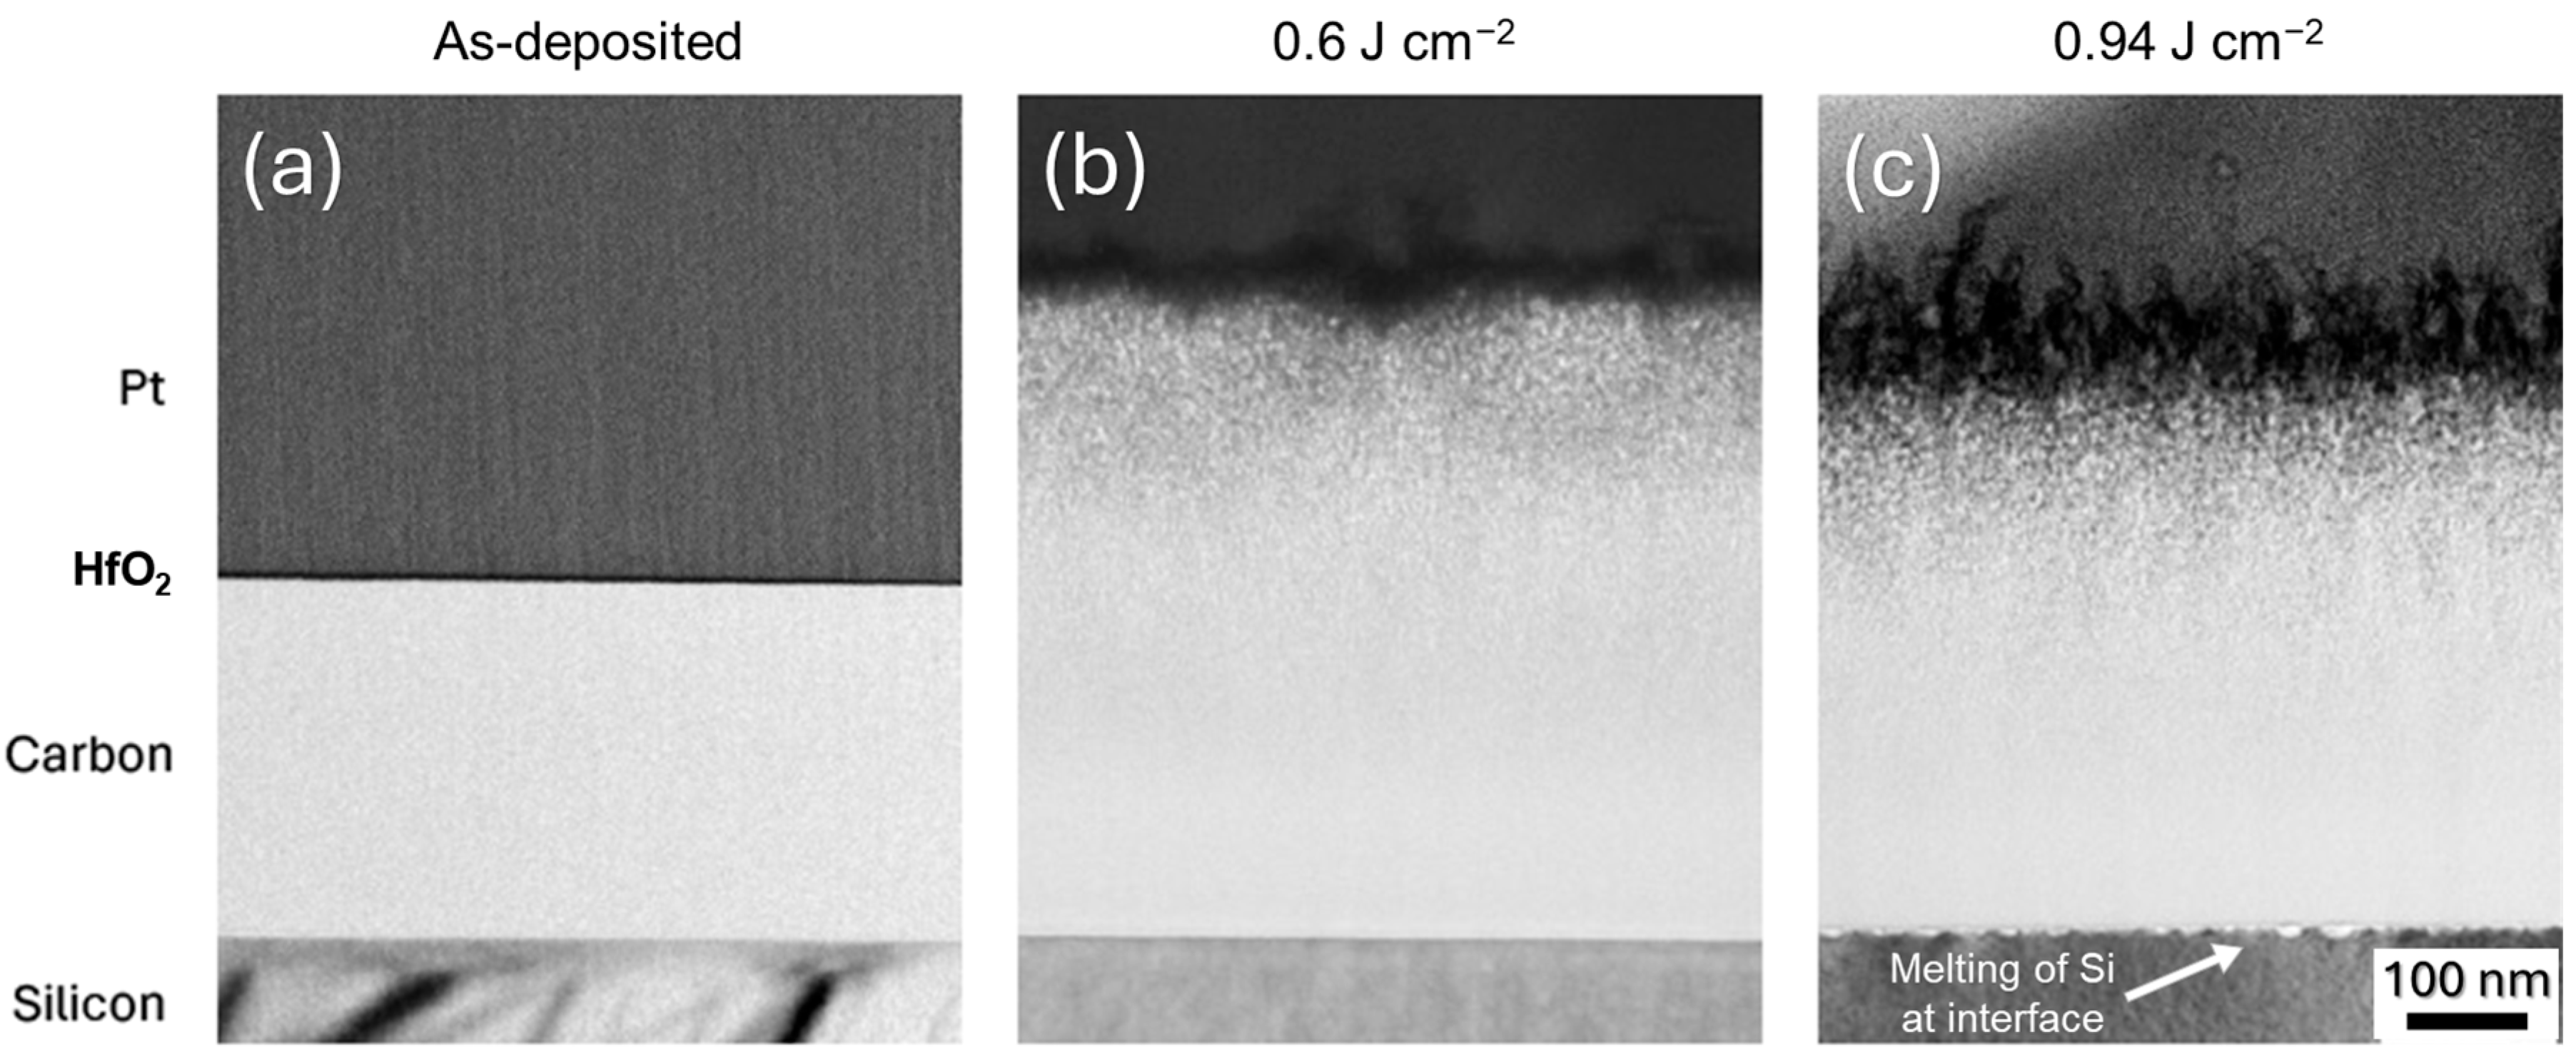
Cross-sectional TEM studies were carried out post-ALD HfO2 to help protect and delineate the interface between the carbon layer and the Pt capping layer during TEM sample preparation and observation. Figure 7 shows the cross-sectional TEM images of the sample as-deposited and after laser annealing at 0.6 J cm−2 and 0.94 J cm−2. The as-deposited cross-sectional TEM image in Figure 7a confirms that the layer is amorphous and uniformly 0.3 μm thick.
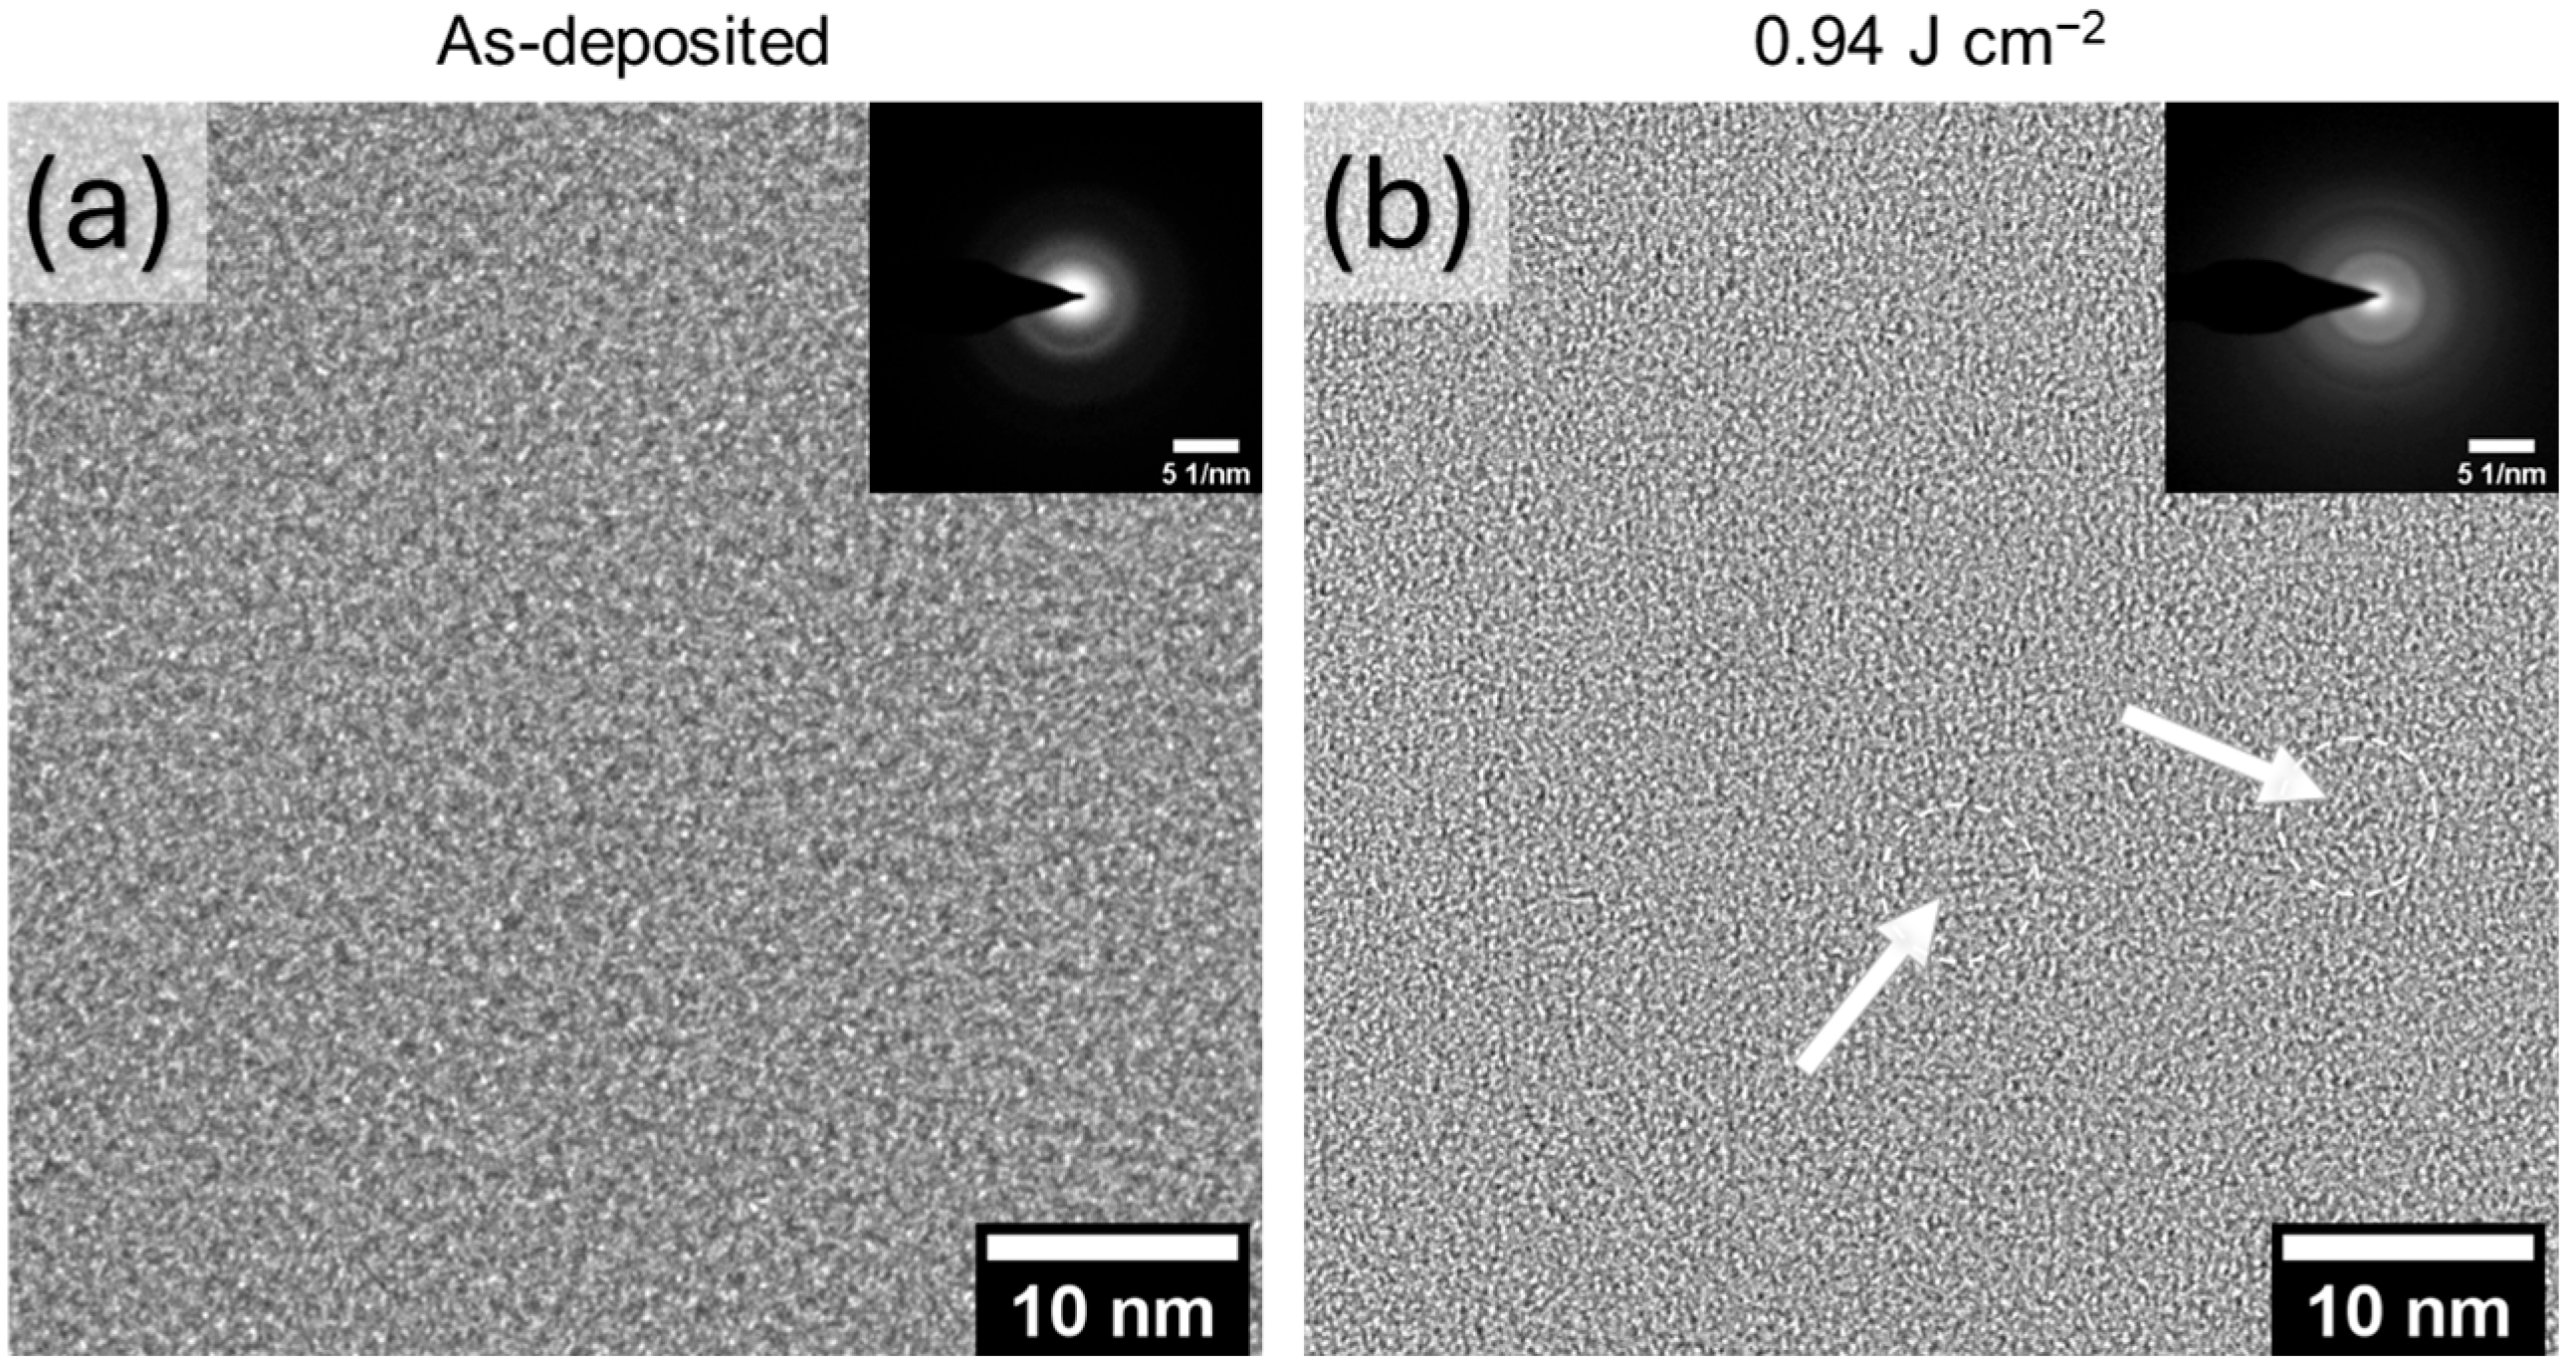
Upon laser annealing at 0.6 J cm−2, as shown in Figure 7b, the surface of the film evolves. The most obvious manifestation of this is a significant swelling of the film, increasing the total film thickness from 0.3 μm to ~0.5 μm (>75%). In addition, the surface exhibits significant porosity. The darker HfO2 layer confirms this surface roughness, as it delineates the carbon layer’s surface post-PLA processing and provides distinction from the Pt capping layer during TEM sample preparation. The thickness of the porous layer extends down from the original carbon surface about 250–300 nm. This is highly unusual and has not been previously reported. Within the bulk of the film, there is a slight contrast change around 150–200 nm above the a-C:H and Si interface. The region above this contrast change within the bulk of the film appears to show more crystalline pockets, consistent with the Raman results of graphite formation. The region below this contrast change (the first 150–200 nm of carbon, closest to the Si) appears to still be amorphous. No melting of the Si surface is observed at this fluence of 0.6 J cm−2 (Figure 7b), even though the melting threshold for bare crystalline Si has been previously observed to be around 0.49 J cm−2 with this laser setup [48]. This may be due to the fact that the surface-confined high-temperature process solely treats the carbon film at this fluence. Increasing the laser fluence to 0.94 J cm−2, as shown in Figure 7c, resulted in the porous surface evolving into a fibrous network that extends down ~250 nm from the top surface. Figure 8 shows the higher magnification of the film before PLA and after annealing with the highest fluence. The diffraction pattern of the as-deposited film exhibits only diffuse rings consistent with amorphous carbon. Upon annealing at the highest power, more distinct rings are observed in the diffraction pattern shown in Figure 8b, consistent with crystallization of the carbon films. However, the crystal size appears to be quite small to be observed easily in the high-resolution TEM image, as only a few graphitic crystals are indicated. The TEM images after the highest power also show clear melting of the Si at the interface with the carbon film (Figure 7c), suggesting the temperature at this position for the highest power exceeds 1400 °C.
To determine if the fibers that formed after 0.94 J cm−2 are open to the surface, EDS mapping of the Hf content was performed—as illustrated in Figure 9—before and after PLA with the highest fluence. A strong Hf signal is present throughout the top 250 nm of the carbon film, indicating the fibers in Figure 9c are open to the surface. Unlike the 0.6 J cm−2 sample, the entire carbon layer at the highest fluence of 0.94 J cm−2 shows a contrast change, suggesting more of the film has undergone a microstructural change, as suggested by the Raman results.

3.4. Optical Properties in the Visible Light Spectrum of PLA a-C:H Films

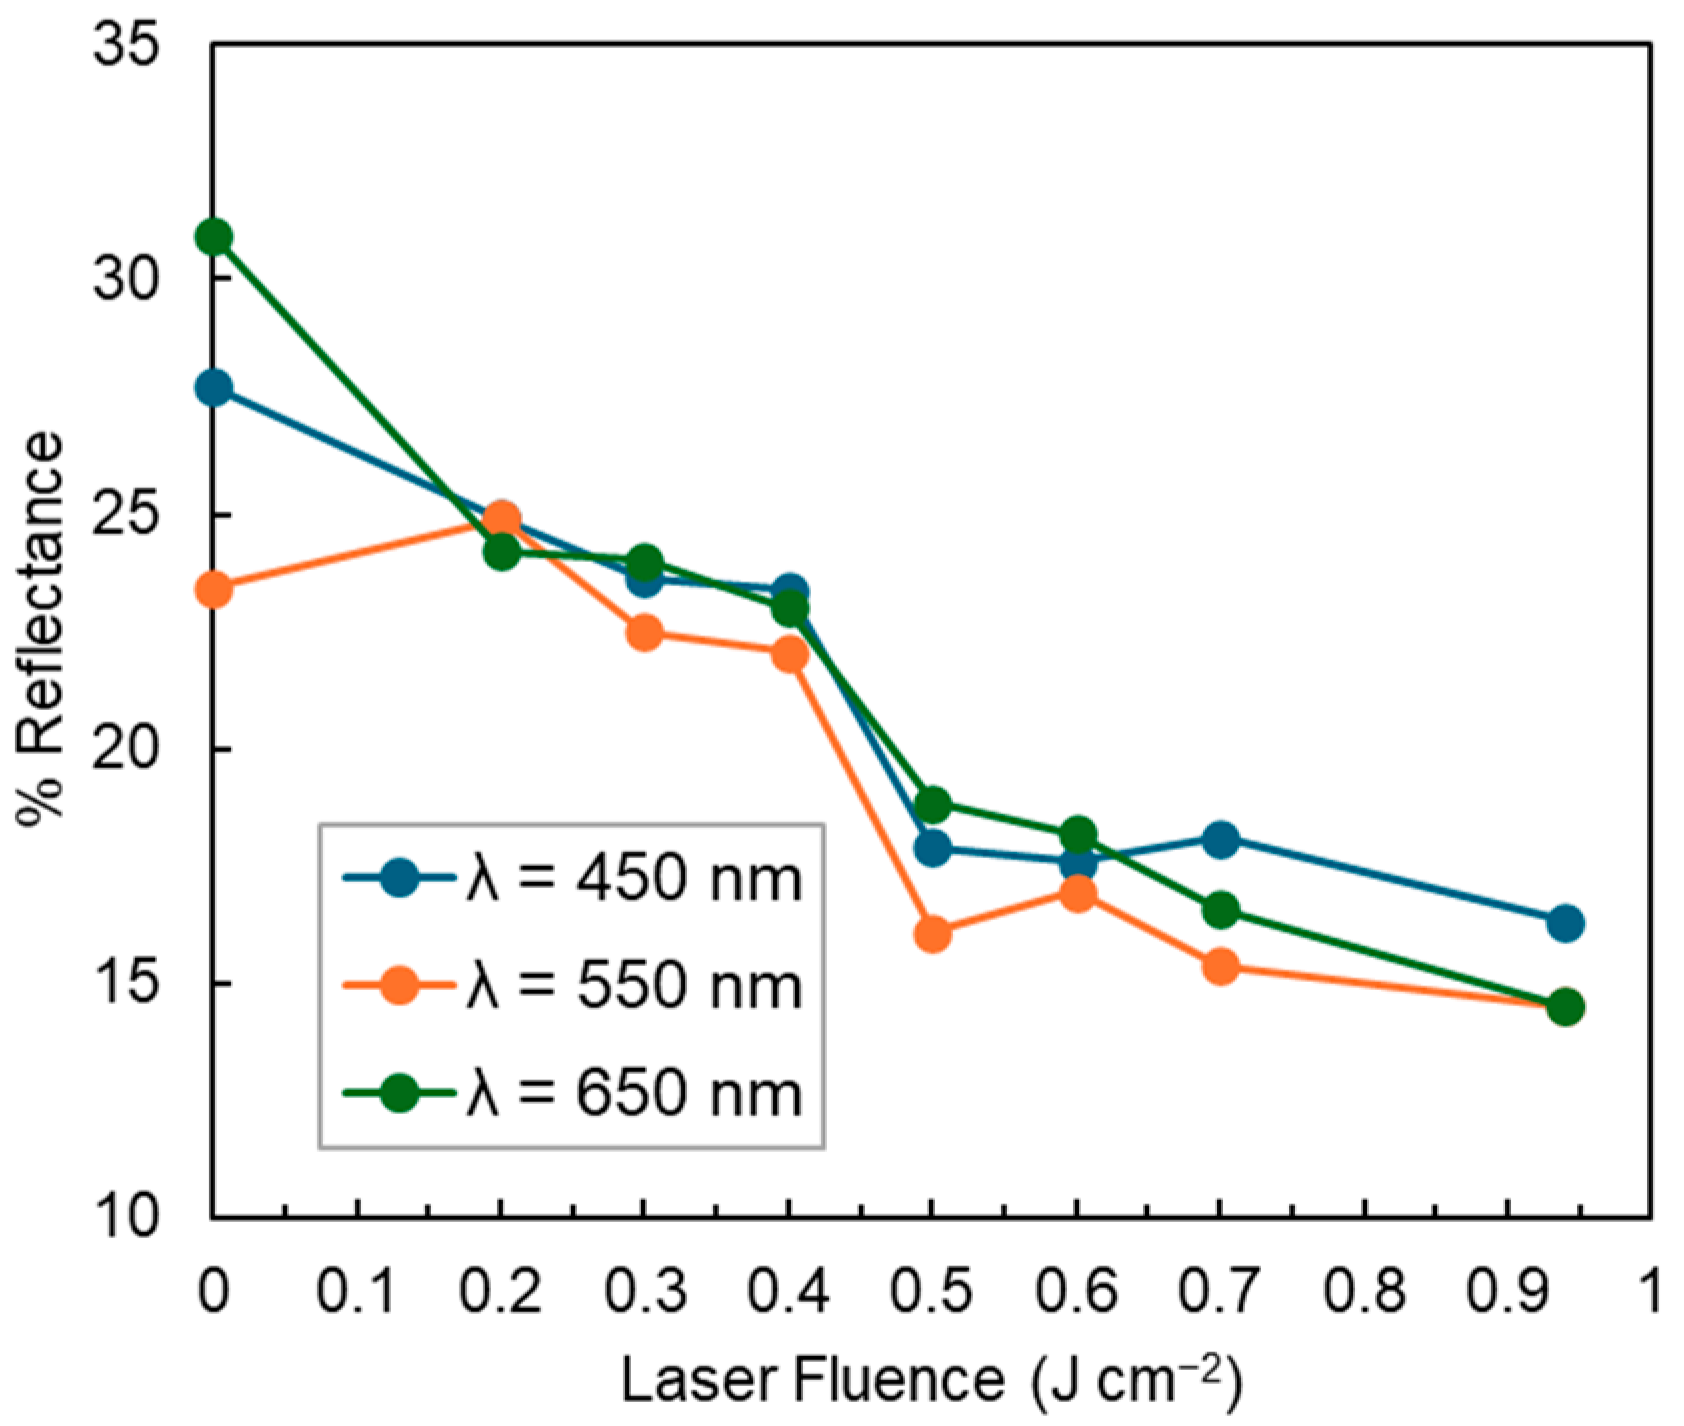
As mentioned earlier, PLA processes caused a noticeable change in the film’s color. Upon annealing, the film color changed from an initial pink hue to black, as observed macroscopically. The apparent film modification at fluences ≥ 0.4 J cm−2 was further elucidated with UV-Vis spectroscopy, as shown in Figure 10. The reflectance decreases with increasing laser fluence, conveying the film’s better light absorbance when annealed with a higher fluence.

4. Discussion

The SEM and TEM observations confirm that the films did not exhibit signs of ablation up to fluences of 0.94 J cm−2 with a single pulse. This contrasts with other nanosecond PLA studies which report delamination at fluences above 0.25 J cm−2 [19,20]. It is possible that the high hydrogen content of the films (between 22 and 38%) and/or film deposition methods may contribute to their resistance to delamination. Raman results show that increasing the laser fluence increases the D to G band ratio and the G band shifts to higher frequencies. Both of these observations are consistent with increased formation of sp2 bonds, suggesting graphitization of the film with increasing fluence. TEM-selected area diffraction patterns also show more distinct rings, suggesting an increase in crystallization upon annealing; however, graphite layers were sparsely observed in the high-resolution images. XPS results show increased sp3 formation upon laser annealing, although sputtering suggests this layer is very thin.
The exact interpretation of the ratio of the D to G band peaks from Raman spectroscopy must be treated carefully, as this can reveal the carbon make-up when combined with evidence from the rest of the spectra. There is also the possibility of variability in peak intensity ratios and G peak position from Raman spectroscopy. Nevertheless, information from sp2 sites in our 0.3 μm film provide explicit evidence of film evolution from amorphous to nanocrystalline graphitic carbon, as observed in Figure 8b.
A three-stage amorphization model for carbon materials that can be applied to un-hydrogenated and hydrogenated carbon materials was described by the authors of [2] (p. 14100). The D peak height in Figure 2 for fluences 0.2 and 0.3 J cm−2 increases and exhibits less broadening, which can be attributed to the ordering of the a-C film. The D-band arises from the radial breathing mode of sp2 hexagonal carbon rings, but appears only when defects are present for detection by visible Raman spectroscopy. Therefore, although the a-C:H orders into hexagonal rings upon annealing, point and/or planar defects are locally present around the carbon atoms in rings. The transition of the a-C:H film to nanocrystalline graphite is supported by an increase in the D to G band intensity ratio that is proportional to an increase in laser fluence. This is further confirmed by the G peak position increase with a minimum fluence of 0.4 J cm−2. The increased wavenumber indicates fewer defects; that is, it suggests an increase in carbon in rings rather than random chains in an amorphous substrate. The more ordered the film becomes once annealed at higher fluences follows graphitization, as the G peak is understood to indicate the E2g vibrational mode of a carbon ring. Deviation from this ring, i.e., breaking of the rings into linear chains, in effect increases the bond angle and bond bending disorder.
Other evidence that confirms the PLA process transitions the bulk as-deposited film from a-C:H to nanocrystalline graphite is the distinction of the Raman spectrum between 2700 and 3000 cm−1 in the 0.3 and 0.4 J cm−2 fluences. At the lower fluence, there is a single broad bump. However, at the higher fluence, we see peak intensity attributed to the 2D peak and D + G peak, which were unobservable in the lower 0.3 J cm−2 spectrum. There were no discernable peaks attributed to the second-order vibrational modes of carbon materials until annealing was carried out at the 0.4 J cm−2 higher fluence, signaling ordering of the annealed film. As the laser fluence increases onwards, these two bands are still present. This indicates that the minimum laser fluence for the resulting ordered, clustered carbon film—as reported by the Raman spectra—is 0.4 J cm−2.
According to the authors of [2] (p. 14100), the increase in the D to G band peak intensities, as well as the G band peak position increase, would suggest an ordering in the film; that is, it suggests a trajectory from the as-deposited amorphous state of a-C:H to micro/nanocrystalline graphite [2]. However, solely relying on the visible wavelength Raman spectra leads to limited interpretation, as peaks largely represent (if not completely) sp2 hybridized carbons. The appearance of the D band—therefore allowing calculation of the D to G band peak ratio following the ordering trajectory—indicates defects at the hexagonal rings, which may include sp3 hybridized carbon formed after the anneal [46]. This is supported by the XPS results, as shown in Figure 5, that show more sp3 content with increasing laser fluence. Depth profiling depicts that the sp3 content is confined to the surface layer of the carbon film post-PLA.
The swelling and formation of a fibrous network on the surface are extremely unexpected. SEM images in Figure 1 show no ablation of the film, in addition to film integrity at the film/substrate interface displayed in the TEM in Figure 7. The swelling therefore suggests an increase in the porosity of the film and/or decrease in the density. It is possible that the hydrogen incorporated during layer growth is outgassing during the laser annealing process and leaves voids, promoting the formation of porosity and expansion of the film upon high-fluence PLA. Hydrogen begins to effuse from a-C:H at relatively low temperatures (450–700 °C); therefore, upon PLA the hydrogen must diffuse through the film towards the surface [49]. As the anneal is 32 ns, this short duration may not be enough time for all the hydrogen content to be removed. The higher sp3 content near the surface, as analyzed from the XPS results, suggests the hydrogen diffusing through the film towards the surface is contained at the near surface of the film once the PLA process concludes. Simulations in the literature describe that increasing hydrogen content increases the sp3 content [50]. There also appears to be graphitization in the bulk film with increasing fluence, as displayed in the Raman results, which probes the full depth of the film. It can be attributed to hydrogen in the film bulk diffusing towards the surface before outgassing.
The surface fibrous network changes the optical properties of the film, turning the film from red/purple to black at the higher laser fluences. The UV-Vis reflectance depicted in Figure 10 quantifies this observation. The increase in light absorbance may be from the graphitization of the amorphous carbon film or increased scattering of light from the fibrous network. The formation of a fibrous surface network at higher fluences may contribute to the light absorption. In contrast to the dark, ultra-absorbent films used for scientific and aerospace applications that have minimum thicknesses of tens of microns, the carbon film discussed here is less than 0.5 μm thick; however, PLA forms a vertical carbon network that may contribute to the decrease in reflectivity with no film ablation, as articulated in Figure 7c [51,52].
It is also possible that, at this fluence, the surface is a spontaneously changing structure due to PLA inducing temperatures nearing the melting point of carbon. LIMPS simulations of the temperature of the surface at this wavelength and fluence are shown in Figure 11. At a fluence of 0.94 J cm−2, the top 10 nm of the carbon surface approaches the carbon melting point of 3550 °C (assuming sublimation does not dominate). This matches well with the observation of a thin sp3-rich layer on the surface of similar thickness from XPS depth profiling, which subsequently decreases after approximately 30 nm sputter depth. As the maximum temperature profile is experienced at the near surface, this suggests that anneals of temperatures approaching the carbon melting point may contribute to sp3 formation.
Previous studies of visible laser annealing (λ = 532 nm) of a-C films deposited by pulsed laser deposition reported an ablation threshold at 0.25 J cm−2, which limited studies at higher fluxes [20]. However, PLA with UV lasers (λ = 248 nm) achieved a-C annealing at 0.55 J cm−2 without ablation [35]. These films were deposited using filtered cathodic vacuum arc methods, and the observed film integrity may be attributed to the high initial sp3 content of 50–80%, compared to only 15%, as observed by XPS in our films. For a-C:H films irradiated with UV lasers (λ = 248 nm), ablation was observed for fluences greater than 0.25 J cm−2, with crystallization of the amorphous layer occurring for their maximum fluence (0.72 J cm−2) [34]. Even with ablation, their TEM analysis depicted crystallization initiating from the surface of the film, either graphitization or the formation of diamond crystallites. The hydrogen content was not reported, while our films contain 22–38% hydrogen content. Nonetheless, all these studies report the transformation of sp3 to sp2 content, and hence ordering of the microstructure evidencing graphitization of the amorphous films upon increasing laser fluence. The difference in the deposition processes meant that the films started with dissimilar diamond-like qualities. In combination with the variations in film thickness and their annealing process (either visible or UV lasers), which used overall lower fluences, any or all of these factors could influence the lack of previous observations of a porous surface as seen here. Film deposition by PECVD and/or the hydrogen content in the starting films in the present study may be crucial components in preventing ablation and film delamination at these higher fluences, helping accommodate the stress induced by visible PLA process even with the resulting porous surface. Modifying the a-C:H film at higher fluences while avoiding ablation would allow the film to reach higher temperature budgets while minimizing thermal damage to the underlying substrate.

5. Conclusions

It was found that using the PECVD process to deposit a 0.3 µm thick carbon film on the surface of a Si wafer will not delaminate upon visible laser annealing for fluences up to 0.94 J cm−2. These amorphous carbon films, which begin with a low (15%) sp3 content, show a dramatic increase in the D to G peak height intensity ratios, as well as an increase in the G peak position in the Raman spectra. This suggests that the film is graphitizing upon annealing, creating micro/nanocrystalline domains. XPS indicates the sp3 content increases with increasing laser fluence, and depth profiling studies show that this increased sp3 content is confined to the surface of the film. Cross-sectional TEM studies show that upon laser annealing at fluences ≥ 0.6 J cm−2, the surface undergoes a dramatic increase in thickness and porosity with the formation of a fibrous network. Film reflectance decreases in the visible light spectrum as the laser fluence increases, as observed with UV-Vis spectroscopy. The structural evolution of the surface and bulk region may be the result of hydrogen outgassing as a result of the anneal and/or simply the temperature gradient induced by PLA. This fibrous network can be used as an ultra-absorbent thin film for scientific equipment and aerospace applications in the future, as the deposited film is only 0.3 μm and easy optical absorbance modification is possible with a single nanosecond laser pulse. Other applications include supercapacitors, where increasing the surface-area-to-volume ratio of highly porous carbon electrodes was previously observed to increase capacitance after PLA [53]. However, the applications discussed require further investigation to evaluate its feasibility for use in industrial and/or scientific fields.

Author Contributions

Conceptualization, K.S.J., A.D.R. and P.P.; methodology, A.D.R., E.H., P.P., H.K., J.J. and K.S.J.; software: P.P. and J.J.; validation, K.S.J. and H.K.; formal analysis, A.D.R., E.H. and P.P.; investigation, A.D.R., E.H., P.P. and M.X.d.J.L. and B.S.; resources, K.S.J. and R.N.; data curation, A.D.R., P.P. and K.S.J.; writing—original draft preparation, A.D.R. and K.S.J.; writing—review and editing, A.D.R., K.S.J. and E.H.; visualization, K.S.J.; supervision, K.S.J.; project administration, K.S.J.; funding acquisition, K.S.J. All authors have read and agreed to the published version of the manuscript.

Funding

This work was supported in part by the University of Florida Rhines Chair of Materials Science and Engineering endowed by Dr. Wally Rhines. No external funding was received.

Data Availability Statement

The data that support the findings of this study are available from the corresponding author upon reasonable request.

Conflicts of Interest

At the time this work was completed, R.N. was employed by Applied Materials, Inc. and J.J. was employed by Mainstream Engineering Corporation. At the time the manuscript was accepted, they both held the same affiliations. However, these potential conflicts of interests did not influence the work, analysis, and/or interpretation of the data. No other conflicts of interests are declared.

Abbreviations

The following abbreviations are used in this manuscript:
DLCDiamond-like carbon
a-C:HHydrogenated amorphous carbon
ta-CTetrahedral amorphous carbon
UVUltraviolet
PLAPulsed laser annealing
PECVDPlasma-enhanced chemical vapor deposition
PLDPulsed laser deposition
XPSX-ray photoelectron spectroscopy
SEMScanning electron microscopy
TEMTransmission electron microscopy
ALDAtomic layer deposition
EDSEnergy-dispersive spectroscopy
LIMPSLaser induced melting prediction of one-dimensional heat flow during pulsed laser melting of thin films

References

  1. Robertson, J. Diamond-like amorphous carbon. Mater. Sci. Eng. R. Rep. 2002, 37, 129–281. [Google Scholar] [CrossRef]
  2. Ferrari, A.C.; Robertson, J. Interpretation of Raman spectra of disordered and amorphous carbon. Phys. Rev. B 2000, 61, 14095–14107. [Google Scholar] [CrossRef]
  3. Thapliyal, V.; Alabdulkarim, M.E.; Whelan, D.R.; Mainali, B.; Maxwell, J.L. A concise review of the Raman spectra of carbon allotropes. Diam. Relat. Mater. 2022, 127, 109180. [Google Scholar] [CrossRef]
  4. Kim, I.-S.; Shim, C.-E.; Kim, S.W.; Lee, C.-S.; Kwon, J.; Byun, K.-E.; Jeong, U. Amorphous Carbon Films for Electronic Applications. Adv. Mater. 2022, 35, 2204912. [Google Scholar] [CrossRef]
  5. Dychalska, A.; Popielarski, P.; Franków, W.; Fabisiak, K.; Paprocki, K.; Szybowicz, M. Study of CVD diamond layers with amorphous carbon admixture by Raman scattering spectroscopy. Mater. Sci. Pol. 2015, 33, 799–805. [Google Scholar] [CrossRef]
  6. Ferrari, A.C.; Robertson, J. Raman spectroscopy of amorphous, nanostructured, diamond—Like carbon, and nanodiamond. Philos. Trans. A Math. Phys. Eng. 2004, 362, 2477–2512. [Google Scholar] [CrossRef]
  7. Park, M.; Sakhrani, V.; Maria, J.-P.; Cuomo, J.J.; Teng, C.W.; Muth, J.F.; Ware, M.E.; Rodriguez, B.J.; Nemanich, R.J. Wavelength-dependent Raman scattering of hydrogenated amorphous silicon carbon with red, green, and blue light excitation. J. Mater. Res. 2003, 18, 768–771. [Google Scholar] [CrossRef]
  8. Filik, J.; May, P.W.; Pearce, S.R.J.; Wild, R.K.; Hallam, K.R. XPS and laser Raman analysis of hydrogenated amorphous carbon films. Diam. Relat. Mater. 2003, 12, 974–978. [Google Scholar] [CrossRef]
  9. Li, J.; Kim, S.J.; Han, S.; Chae, H. Characterization of sp2/sp3 hybridization ratios of hydrogenated amorphous carbon films deposited in C2H2 inductively coupled plasmas. Surf. Coat. Technol. 2021, 422, 127514. [Google Scholar] [CrossRef]
  10. Chen, J.-L.; Ji, P.-Y.; Yang, Y.; Jin, C.-G.; Zhuge, L.-J.; Wu, X.-M. The structure and properties of amorphous diamond-like carbon films deposited by helicon wave plasma chemical vapor deposition. Thin Solid Films 2020, 709, 138167. [Google Scholar] [CrossRef]
  11. Chu, P.K.; Li, L. Characterization of amorphous and nanocrystalline carbon films. Mater. Chem. Phys. 2006, 96, 253–277. [Google Scholar] [CrossRef]
  12. Schwan, J.; Ulrich, S.; Batori, V.; Ehrhardt, H.; Silva, S.R.P. Raman spectroscopy on amorphous carbon films. J. Appl. Phys. 1996, 80, 440–447. [Google Scholar] [CrossRef]
  13. Tang, X.-M.; Weber, J.; Baer, Y.; Müller, C.; Hänni, W.; Hintermann, H.E. Influence of hydrogen on the structure of amorphous carbon. Phys. Rev. B 1993, 48, 10124–10128. [Google Scholar] [CrossRef] [PubMed]
  14. Jiang, Z.; Zhu, H.; Sun, Q. Process Optimization of Amorphous Carbon Hard Mask in Advanced 3D-NAND Flash Memory Applications. Electronics 2021, 10, 1374. [Google Scholar] [CrossRef]
  15. Lai, C.C.; Chang, Y.H.; Chien, H.J.; Lu, M.C. Hard mask and lithographic capabilities improvement by amorphous carbon step coverage optimization in high aspect ratio device pattern. Vacuum 2018, 153, 267–273. [Google Scholar] [CrossRef]
  16. Pauliac-Vaujour, S.; Brianceau, P.; Comboroure, C.; Faynot, O. Improvement of high resolution lithography by using amorphous carbon hard mask. Microelectron. Eng. 2008, 85, 800–804. [Google Scholar] [CrossRef]
  17. Jaoul, C.; Jarry, O.; Tristant, P.; Merle-Méjean, T.; Colas, M.; Dublanche-Tixier, C.; Jacquet, J.-M. Raman analysis of DLC coated engine components with complex shape: Understanding wear mechanisms. Thin Solid Films 2009, 518, 1475–1479. [Google Scholar] [CrossRef]
  18. Krishna, K.M.; Umeno, M.; Nukaya, Y.; Soga, T.; Jimbo, T. Photovoltaic and spectral photoresponse characteristics of n-C/p-C solar cell on a p-silicon substrate. Appl. Phys. Lett. 2000, 77, 1472–1474. [Google Scholar] [CrossRef]
  19. Grigonis, A.; Rutkunienė, Ž.; Medvids, A. The influence of nanosecond pulse laser irradiation on the properties of a-C:H films. Vacuum 2008, 82, 1212–1215. [Google Scholar] [CrossRef]
  20. Cappelli, E.; Scilletta, C.; Orlando, S.; Valentini, V.; Servidori, M. Laser annealing of amorphous carbon films. Appl. Surf. Sci. 2009, 255, 5620–5625. [Google Scholar] [CrossRef]
  21. Ibenskas, A.; Galdikas, A.; Grigonis, A. Kinetic modeling of laser annealing processes in a-C:H films. Vacuum 2011, 86, 124–130. [Google Scholar] [CrossRef]
  22. Kononenko, T.V.; Kononenko, V.V.; Pimenov, S.M.; Zavedeev, E.; Konov, V.I.; Romano, V.; Dumitru, G. Effects of pulse duration in laser processing of diamond-like carbon films. Diam. Relat. Mater. 2005, 14, 1368–1376. [Google Scholar] [CrossRef]
  23. Narayan, J.; Gupta, S.; Sachan, R.; Bhaumik, A.; Cellini, F.; Riedo, E. Q-carbon harder than diamond. MRS Commun. 2018, 8, 428–436. [Google Scholar] [CrossRef]
  24. Li, H.; Xu, T.; Wang, C.; Chen, J.; Zhou, H.; Liu, H. Annealing effect on the structure, mechanical and tribological properties of hydrogenated diamond-like carbon films. Thin Solid Films 2006, 515, 2153–2160. [Google Scholar] [CrossRef]
  25. Choi, W.S.; Hong, B. The effect of annealing on the properties of diamond-like carbon protective antireflection coatings. Renew Energy 2008, 33, 226–231. [Google Scholar] [CrossRef]
  26. Ding, Q.; Wang, L.; Hu, L.; Hu, T.; Wang, Y.; Zhang, Y. An explanation for laser-induced spallation effect in a-C:H films: Altered phase evolution route caused by hydrogen doping. J. Appl. Phys. 2011, 109, 013501. [Google Scholar] [CrossRef]
  27. Grigonis, A.; Rutkunienė, Ž.; Manikowski, H.; Šilinskas, M. Laser-induced transformation of a-C:H thin films. Vacuum 2009, 83, S152–S154. [Google Scholar] [CrossRef]
  28. Nandihalli, N. Microwave-driven synthesis and modification of nanocarbons and hybrids in liquid and solid phases. J. Energy Storage 2025, 111, 115315. [Google Scholar]
  29. Schwenke, A.M.; Hoeppener, S.; Schubert, U.S. Synthesis and modification of carbon nanomaterials utilizing microwave heating. Adv. Mater. 2015, 27, 4113–4141. [Google Scholar] [CrossRef]
  30. Gupta, S.; Sachan, R.; Bhaumik, A.; Pant, P.; Narayan, J. Undercooling driven growth of Q-carbon, diamond, and graphite. MRS Commun. 2018, 8, 533–540. [Google Scholar] [CrossRef]
  31. Haque, A.; Pant, P.; Narayan, J. Large-area diamond thin film on Q-carbon coated crystalline sapphire by HFCVD. J. Cryst. Growth 2018, 504, 17–25. [Google Scholar] [CrossRef]
  32. Narayan, J.; Khosla, N. Self-organization of amorphous Q-carbon and Q-BN nanoballs. Carbon 2022, 192, 301–307. [Google Scholar] [CrossRef]
  33. Narayan, J.; Bhaumik, A.; Gupta, S.; Joshi, P.; Riley, P.; Narayan, R. Role of Q-carbon in nucleation and formation of continuous diamond film. Carbon 2021, 176, 558–568. [Google Scholar] [CrossRef]
  34. Nistor, L.C.; Van Landuyt, J.; Ralchenko, V.G.; Kononenko, T.V.; Obraztsova, E.D.; Strelnitsky, V.E. Direct observation of laser-induced crystallization of a-C:H films. Appl. Phys. A 1994, 58, 137–144. [Google Scholar] [CrossRef]
  35. Xu, N.; Tsang, S.H.; Teo, E.H.T.; Wang, X.; Ng, C.M.; Tay, B.K. Effect of initial sp3 content on bonding structure evolution of amorphous carbon upon pulsed laser annealing. Diam. Relat. Mater. 2012, 30, 48–52. [Google Scholar] [CrossRef]
  36. Tomasella, E.; Meunier, C.; Mikhailov, S. a-C:H thin films deposited by radio-frequency plasma: Influence of gas composition on structure, optical properties and stress levels. Surf. Coat. Technol. 2001, 141, 289–296. [Google Scholar] [CrossRef]
  37. Viana, W.E.S.S.; Elzubair, A.E.; Wysard, M.M.; Franeschini, D.F.; Camargo, S.S. Comparison of the properties of a-C:H films deposited from methane and heptane precursors: Study of the mechanical, chemical and structural properties. Thin Solid Films 2020, 695, 137733. [Google Scholar] [CrossRef]
  38. Adams, B.E.; Howells, S.C.; Jennings, D.; Li, J.; Thomas, T.N.; Moffatt, S. Apparatus and Method of Improving Beam Shaping and Beam Homogenization. U.S. Patent 9908200 B2, 06 March 2018. [Google Scholar]
  39. Shirley, D.A. High-Resolution X-Ray Photoemission Spectrum of the Valence Bands of Gold. Phys. Rev. B 1972, 5, 4709–4714. [Google Scholar] [CrossRef]
  40. Proctor, A.; Sherwood, P.M.A. Data analysis techniques in x-ray photoelectron spectroscopy. Anal. Chem. 1982, 54, 13–19. [Google Scholar] [CrossRef]
  41. Ba, E.C.T.; Dumont, M.R.; Martins, P.S.; Da Silva Pinheiro, B.; da Cruz, M.P.M.; Barbosa, J.W. Deconvolution process approach in Raman spectra of DLC coating to determine the sp3 hybridization content using the ID/IG ratio in relation to the quantification determined by X-ray photoelectron spectroscopy. Diam. Relat. Mater. 2022, 122, 108818. [Google Scholar] [CrossRef]
  42. Tuinstra, F.; Koenig, J.L. Raman Spectrum of Graphite. J. Chem. Phys. 1970, 53, 1126–1130. [Google Scholar] [CrossRef]
  43. Bîru, E.I.; Iovu, H. Graphene nanocomposites studied by Raman spectroscopy. In Raman Spectroscopy; Do Nascimento, G.M., Ed.; InTechOpen: London, UK, 2018; Volume 1, pp. 179–201. [Google Scholar]
  44. Petrov, D.V.; Matrosov, I.I.; Sedinkin, D.O.; Zaripov, A.R. Raman Spectra of Nitrogen, Carbon Dioxide, and Hydrogen in a Methane Environment. Opt. Spectrosc. 2018, 124, 8–12. [Google Scholar] [CrossRef]
  45. Jorio, A.; Ferreira, E.H.M.; Moutinho, M.V.O.; Stavale, F.; Achete, C.A.; Capaz, R.B. Measuring disorder in graphene with the G and D bands. Phys. Status Solidi B 2010, 247, 2980–2982. [Google Scholar] [CrossRef]
  46. Ferrari, A.C. Raman spectroscopy of graphene and graphite: Disorder, electron–phonon coupling, doping and nonadiabatic effects. Solid State Commun. 2007, 143, 47–57. [Google Scholar] [CrossRef]
  47. Park, C.K.; Chang, S.M.; Uhm, H.S.; Seo, S.H.; Park, J.S. XPS and XRR studies on microstructures and interfaces of DLC films deposited by FCVA method. Thin Solid Films 2002, 420–421, 235–240. [Google Scholar] [CrossRef]
  48. Johnson, J.A. Pulsed Laser Melting of Silicon-Germanium/Silicon Heterostructures. Ph.D. Thesis, University of Florida, Gainesville, FL, USA, 2021. [Google Scholar]
  49. Jiang, X.; Beyer, W.; Reichelt, K. Gas evolution from hydrogenated amorphous carbon films. J. Appl. Phys. 1990, 68, 1378–1380. [Google Scholar] [CrossRef]
  50. Park, H.; Woo, D.; Lee, J.M.; Park, S.J.; Lee, S.; Kim, H.J.; Yoon, E.; Lee, G.-D. The influence of hydrogen concentration in amorphous carbon films on mechanical properties and fluorine penetration: A density functional theory and ab initio molecular dynamics study. RSC Adv. 2020, 10, 6822–6830. [Google Scholar] [CrossRef] [PubMed]
  51. Cartwright, J. Fifty shades of black. Phys. World 2015, 28, 25–28. [Google Scholar] [CrossRef]
  52. Theocharous, E.; Chunnilall, C.J.; Mole, R.; Gibbs, D.; Fox, N.; Shang, N.; Howlett, G.; Jensen, B.; Taylor, R.; Reveles, J.R.; et al. The partial space qualification of a vertically aligned carbon nanotube coating on aluminium substrates for EO applications. Opt. Express 2014, 22, 7290–7307. [Google Scholar] [CrossRef] [PubMed]
  53. Baptista, J.M.; Gaspar, G.; Wijayantha, K.G.U.; Lobato, K. The impact of laser-scribing carbon-based supercapacitor electrodes. Appl. Surf. Sci. Adv. 2022, 10, 100262. [Google Scholar] [CrossRef]
Figure 1. SEM image of the surface (a) as-deposited as well as after laser annealing with a single laser pulse of 32 ns with a fluence of (b) 0.6 J cm−2 and (c) 0.94 J cm−2. No delamination of the carbon film was observed for the range of the fluences studied for one pulse (0.2–0.94 J cm−2). Laser annealing with 10 pulses at (d) 0.6 J cm−2 and (e) 0.94 J cm−2 fluence was also performed, and delamination of the films was observed under these conditions.
Carbon 11 00060 g001
Figure 2. Raman spectra as a function of increasing laser fluence (top to bottom). There is an increased definition of both the D and G peaks with increasing fluence, as well as a positive shift in the wavenumber of the G peak with increasing fluence.
Carbon 11 00060 g002
Figure 3. The D band to G band intensity ratio (left axis) and the position of the G band (right axis) as a function of laser fluence. A clear, increasing trend for both variables is observed that is consistent with the crystallization of carbon films.
Carbon 11 00060 g003
Figure 4. Deconvolution of the XPS spectra for the sample after laser annealing at 0.5 J cm−2 using the Shirley method [39]. This film has about a 25% sp3 character, compared to the as-deposited 15% sp3 content.
Carbon 11 00060 g004
Figure 5. Deconvoluted sp3 percentage content on the surface as a function of laser fluence from XPS spectra, describing the positive trend between increasing laser fluence and higher diamond-like behavior/structure.
Carbon 11 00060 g005
Figure 6. The effect of sputter time on the sp3 content in the films determined by XPS depth profiling after different laser annealing treatments, utilizing a 10 nm min−1 sputter rate from a 1 kV Ar ion beam. It is clear the high sp3 content is confined to the near-surface region of the annealed films.
Carbon 11 00060 g006
Figure 7. Cross-sectional TEM images of the carbon layer (a) before and after laser annealing at (b) 0.6 J cm−2 and (c) 0.94 J cm−2. The film exhibits significant swelling by 0.6 J cm−2 and further decomposes into a fibrous network at 0.94 J cm−2. The Si surface exhibits signs of pitting consistent with the melting of the Si substrate at this fluence.
Carbon 11 00060 g007
Figure 8. High-resolution cross-sectional TEM images of the carbon layer (a) before and after laser annealing at the highest fluence of (b) 0.94 J cm−2, the latter showcasing the ordered graphite domains, resulting from the highest fluence PLA, highlighted with arrows and dashed circles. The inset images display the electron diffraction pattern.
Carbon 11 00060 g008
Figure 9. EDS mapping of hafnium, oxygen, carbon, silicon, and the platinum capping layer for (a) as-deposited a-C:H after the ALD HfO2 step with (b) the corresponding EDS image and (c) 0.94 J cm−2 PLA sample after ALD HfO2 step with (d) its corresponding EDS image. The white arrow at the bottom of each EDS image denotes the direction of the linescan. After the laser annealing process, the total thickness of the film increases and Hf is found throughout the top layer of the sample, as indicated in the depth profiles.
Carbon 11 00060 g009
Figure 10. Reflectance data obtained from UV-Vis spectroscopy at each laser fluence for 450 nm, 550 nm, and 650 nm wavelengths. As the laser fluence increases, there is an observed decrease in the reflectance value, indicating more light is absorbed by the annealed carbon thin film.
Carbon 11 00060 g010
Figure 11. LIMPS simulation of the temperature as a function of annealing time for two different depths from the surface. The simulated sample was annealed for 32 ns at 0.94 J cm−2.
Carbon 11 00060 g011
Disclaimer/Publisher’s Note: The statements, opinions and data contained in all publications are solely those of the individual author(s) and contributor(s) and not of MDPI and/or the editor(s). MDPI and/or the editor(s) disclaim responsibility for any injury to people or property resulting from any ideas, methods, instructions or products referred to in the content.