


Lecithin as an Effective Modifier of the Transport Properties of Variously Crosslinked Hydrogels
 , ,
, ,  and
and
Abstract
1. Introduction
2. Results and Discussion
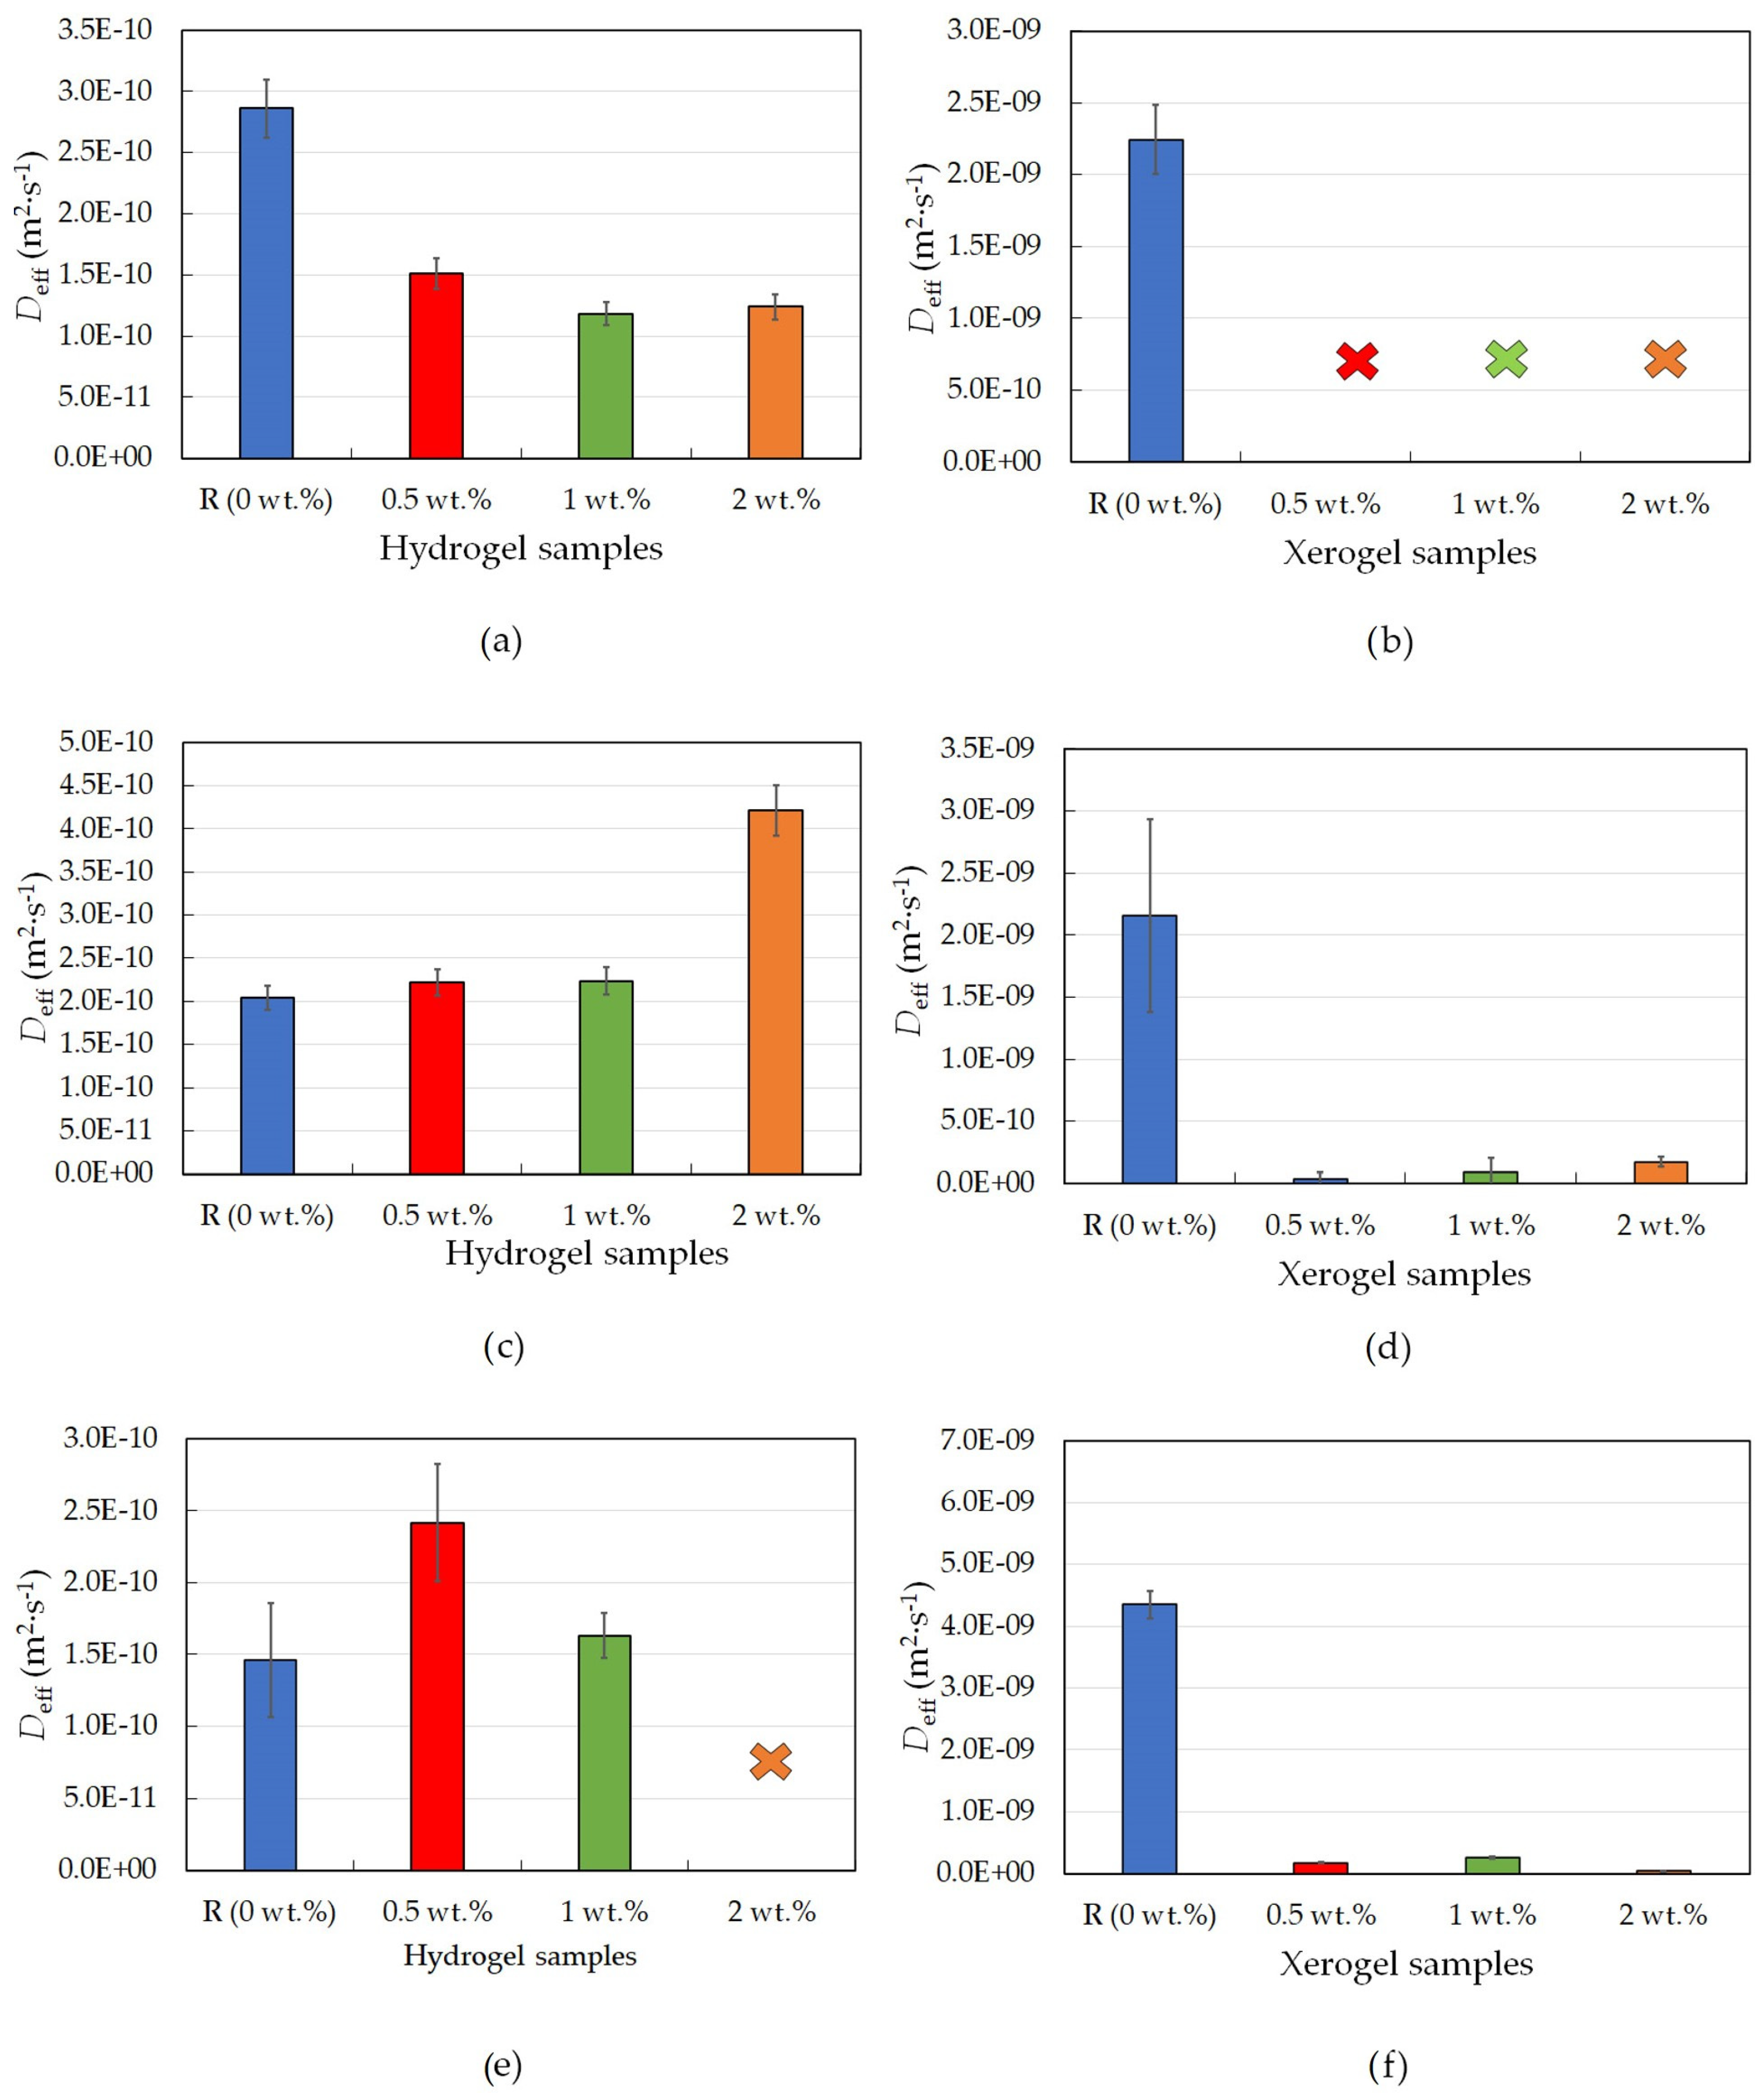
2.1. Physical Crosslinking
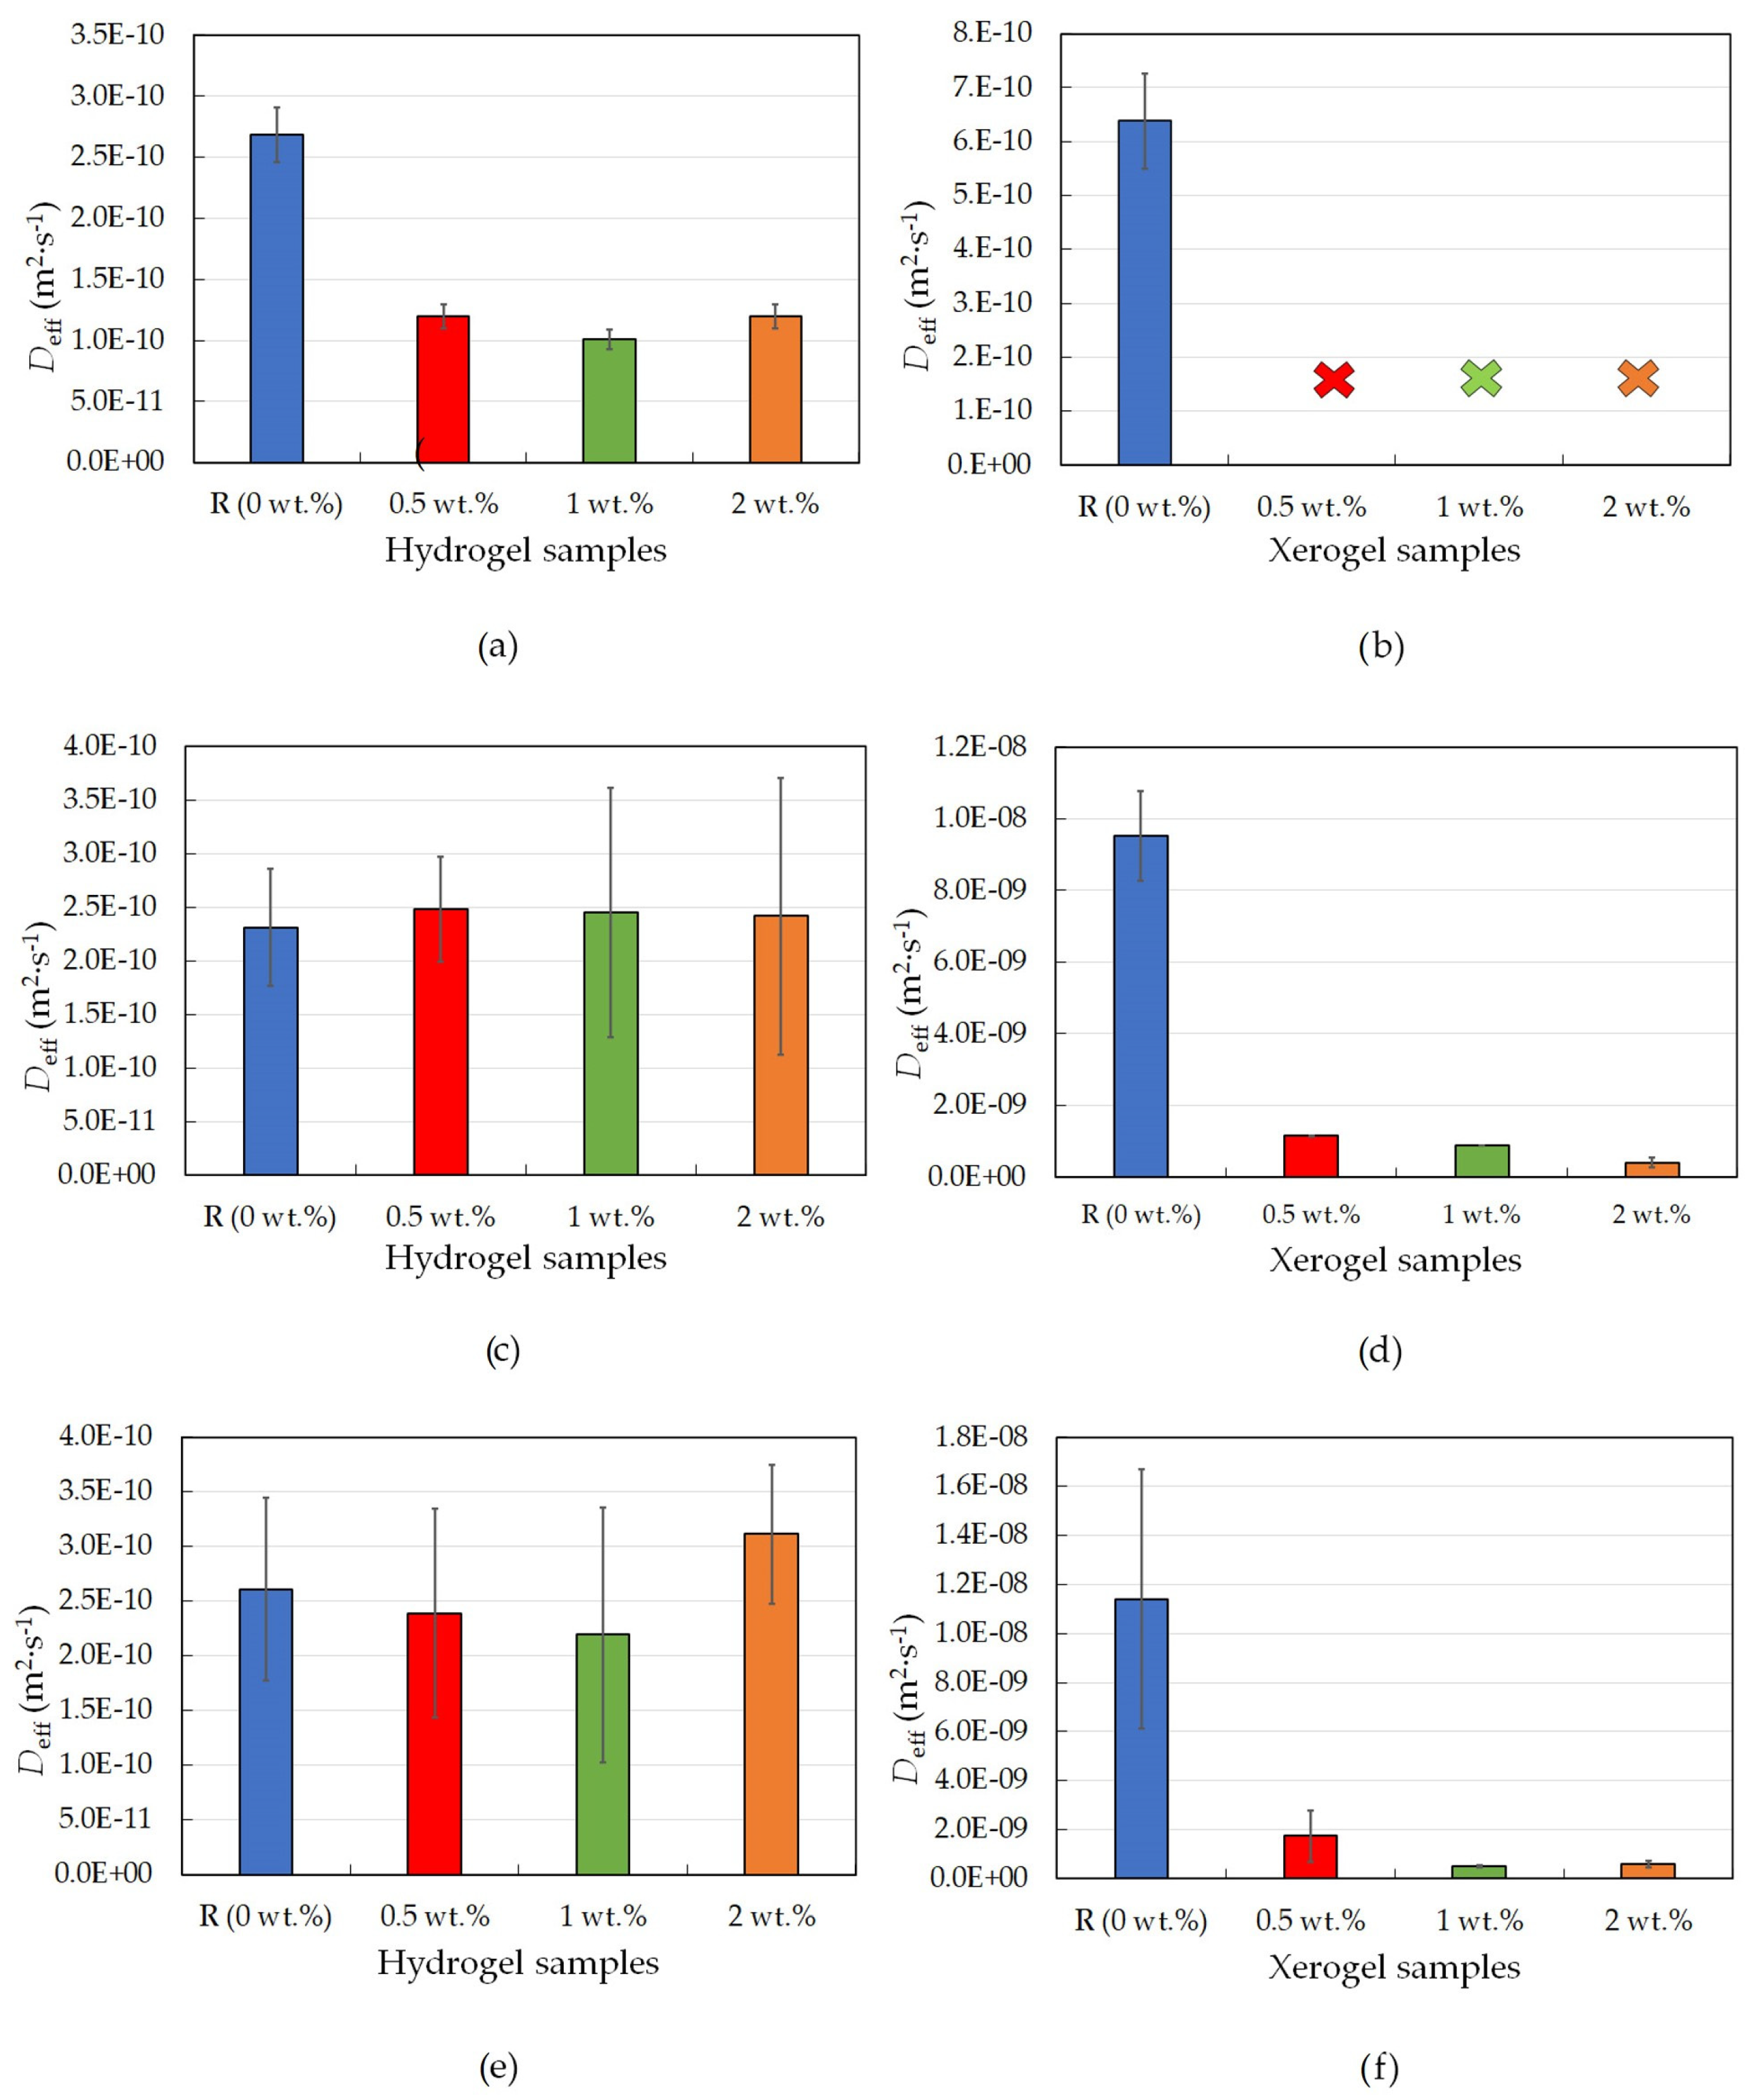
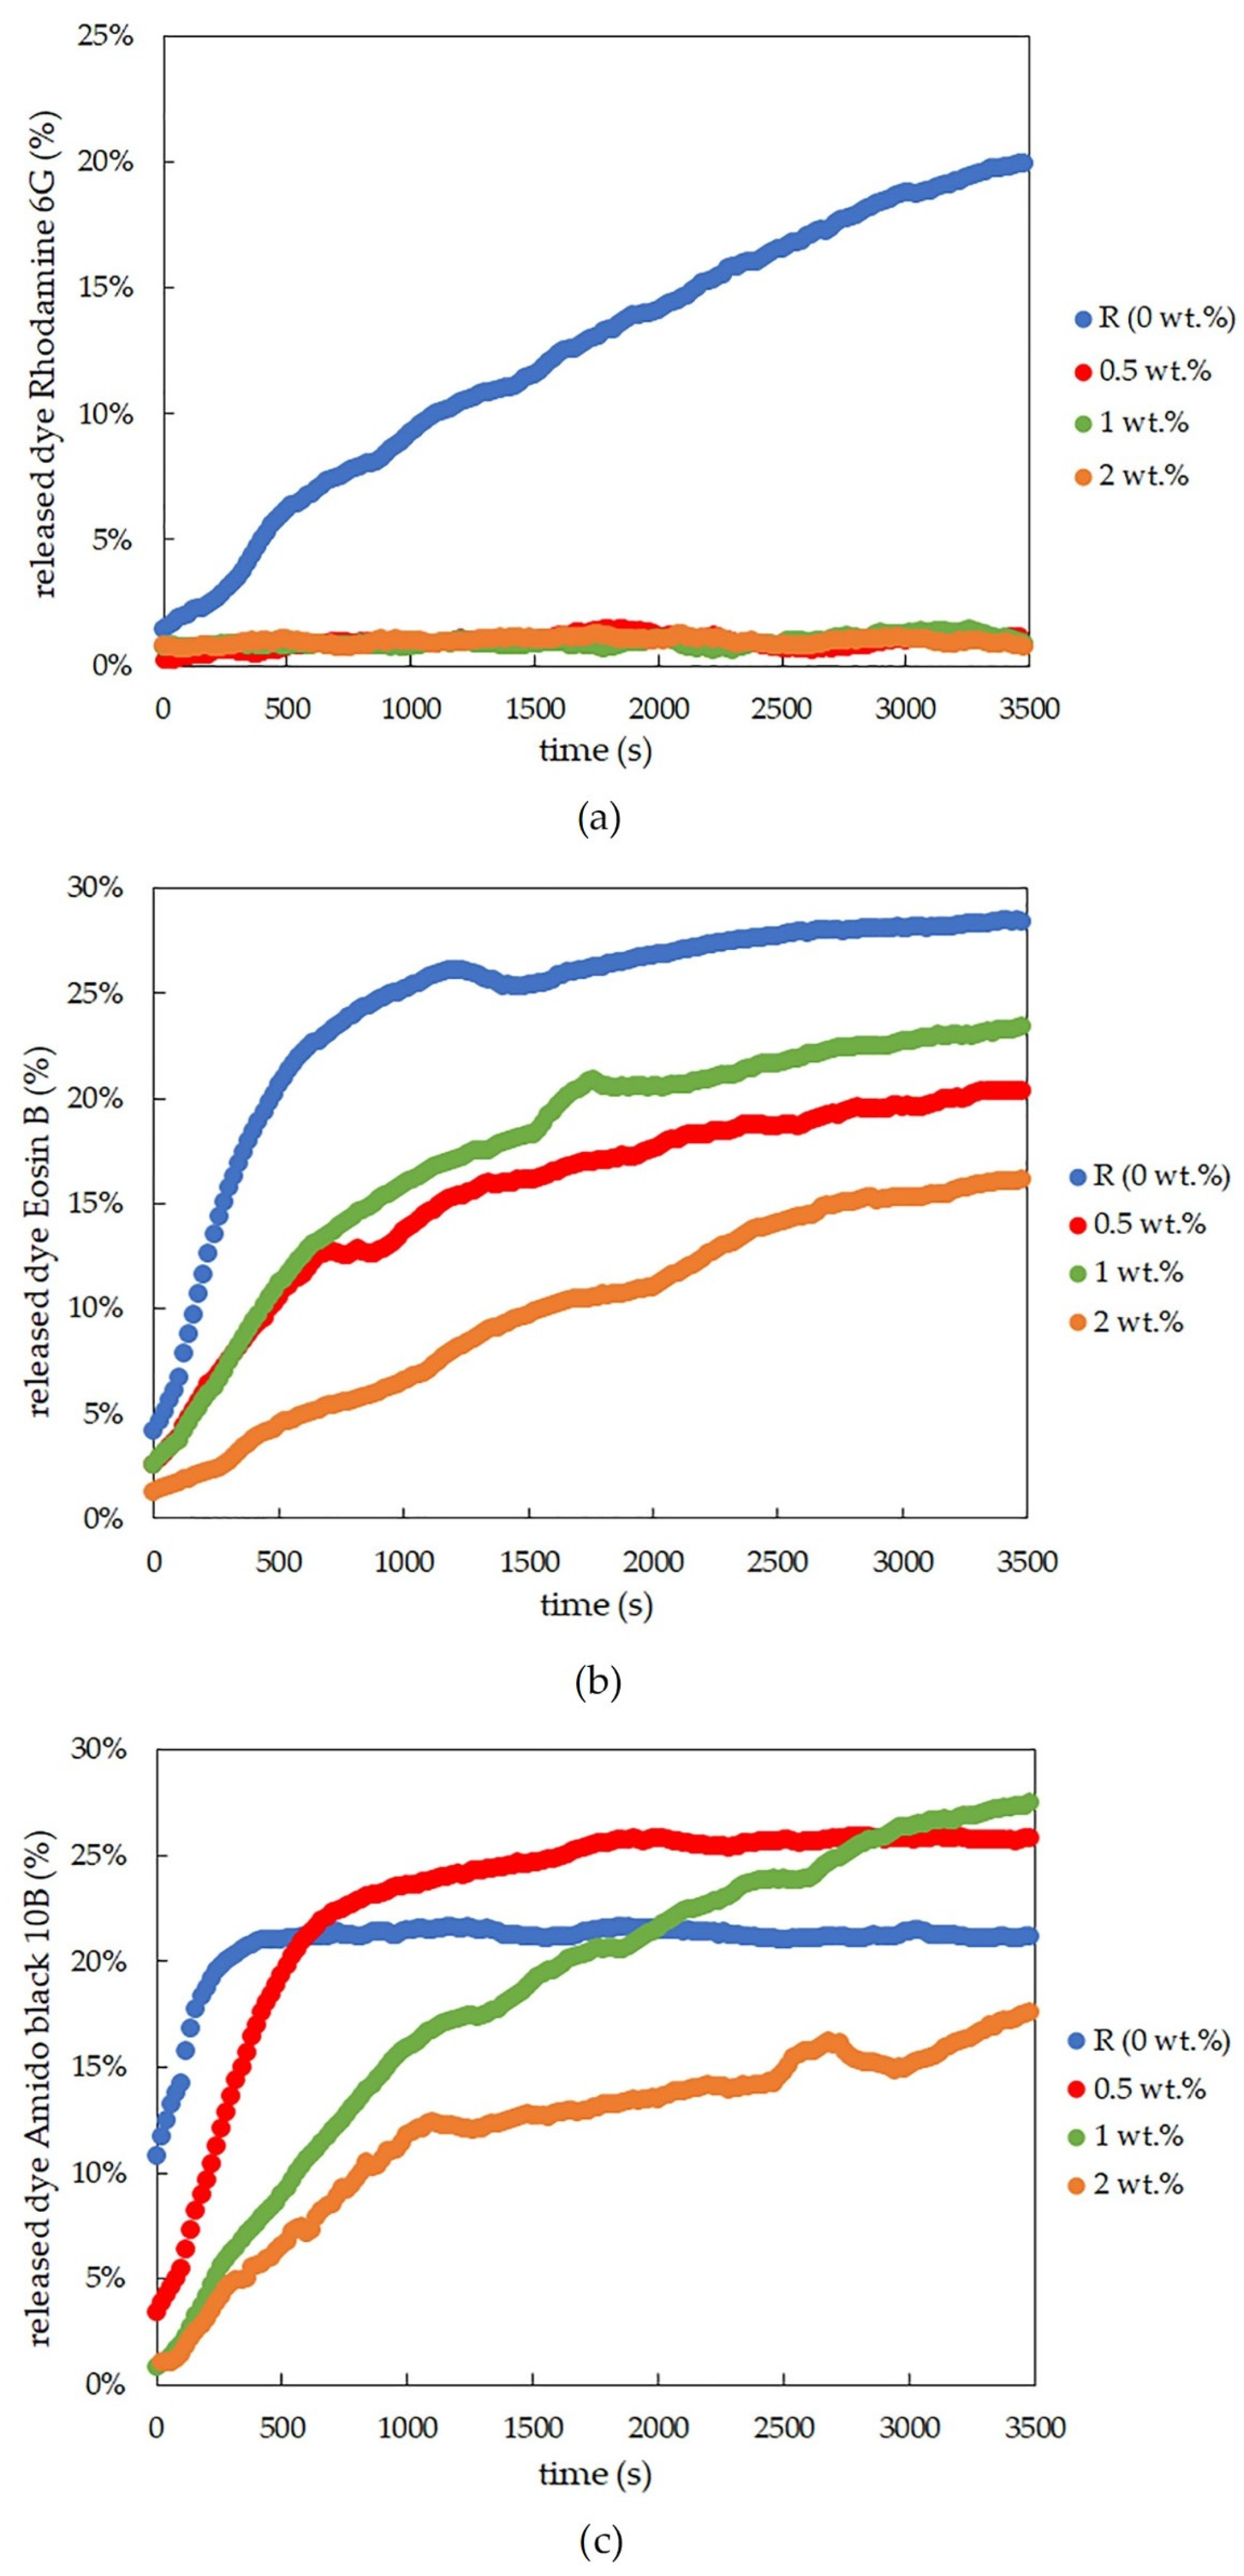
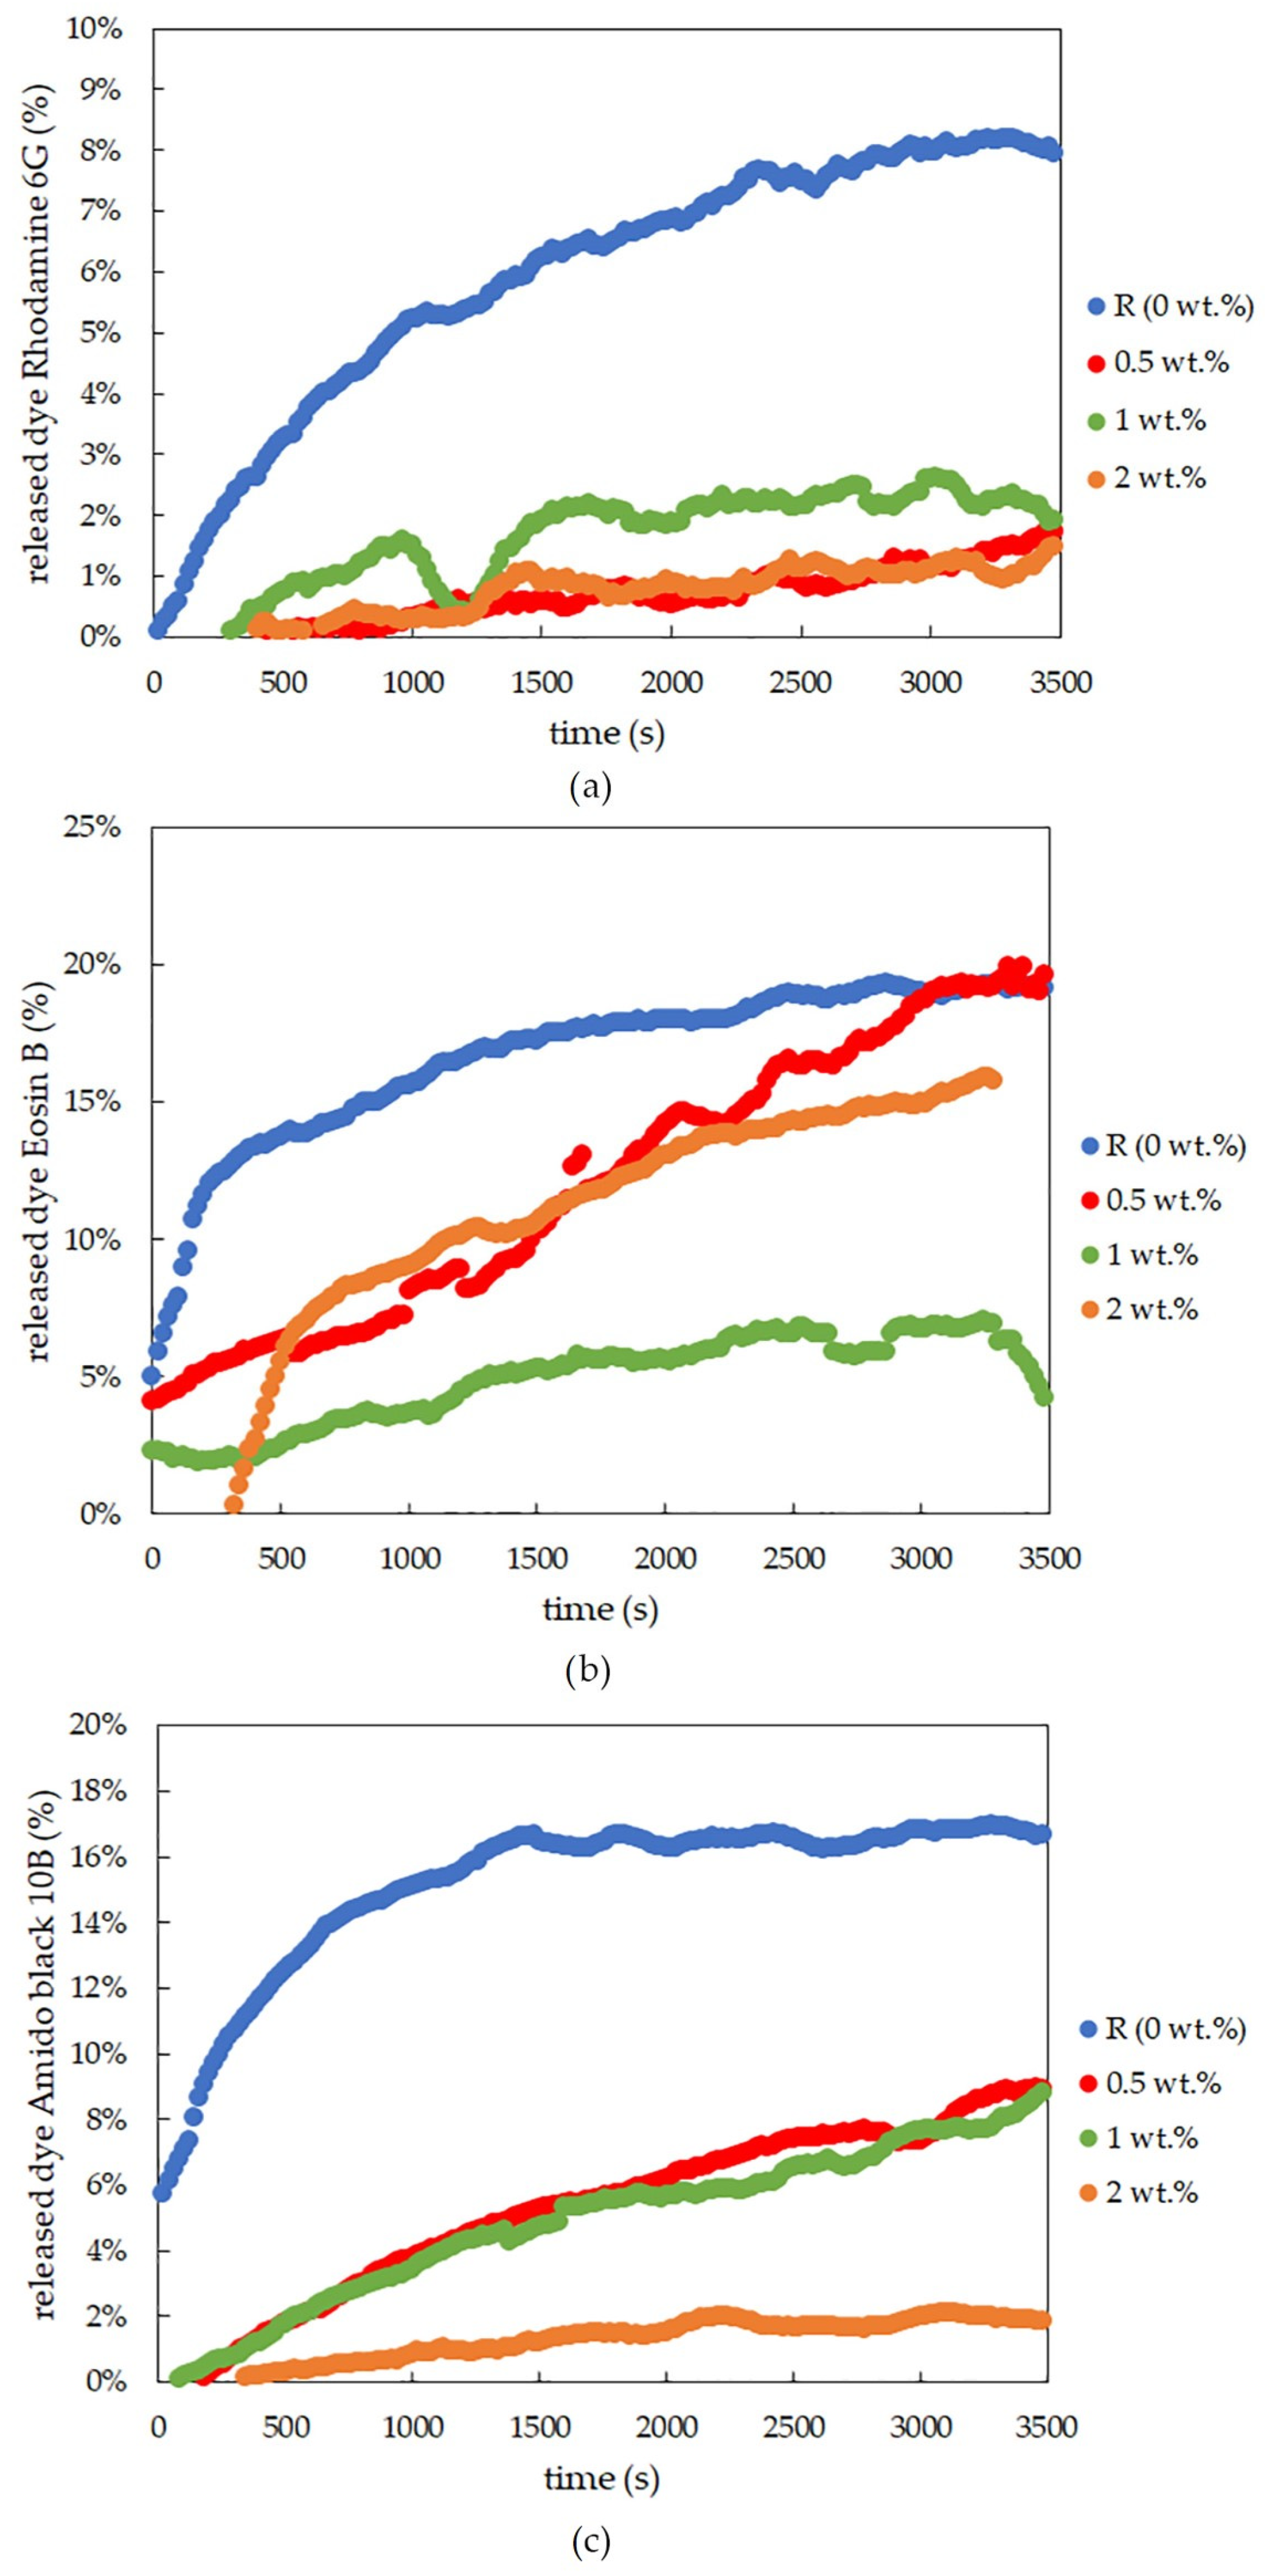
2.1.1. Dye-Release Experiments
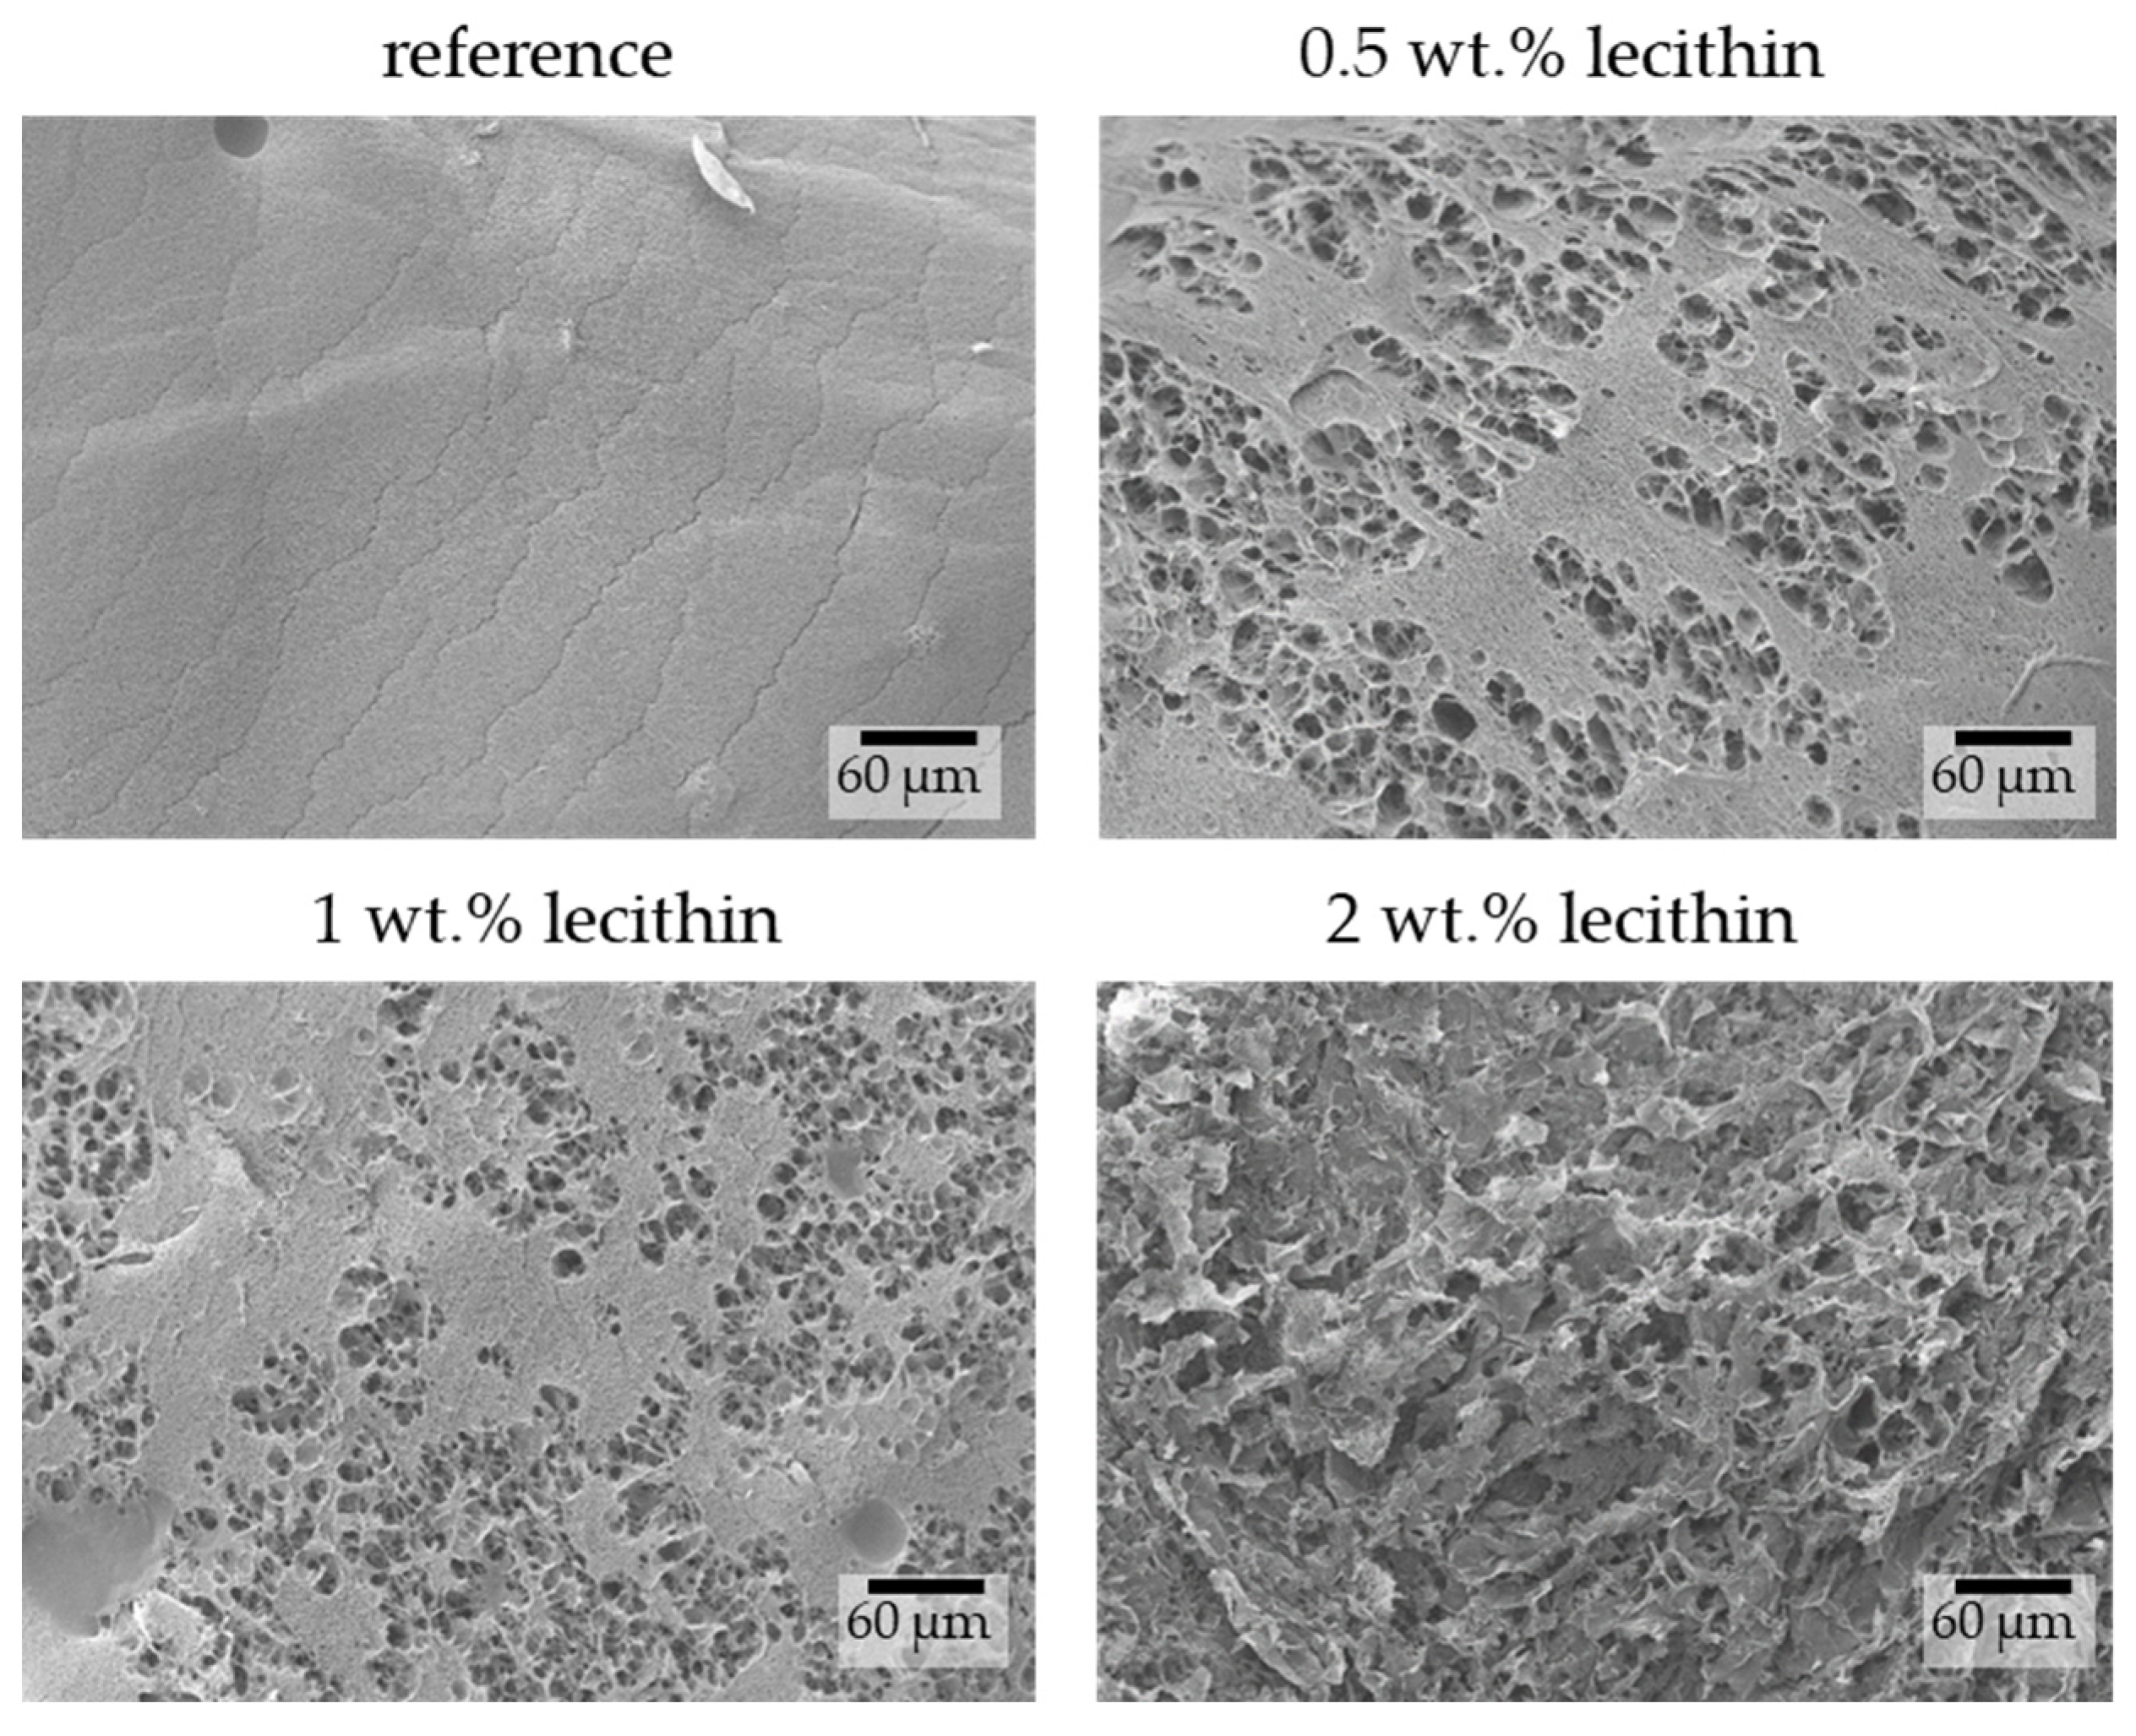
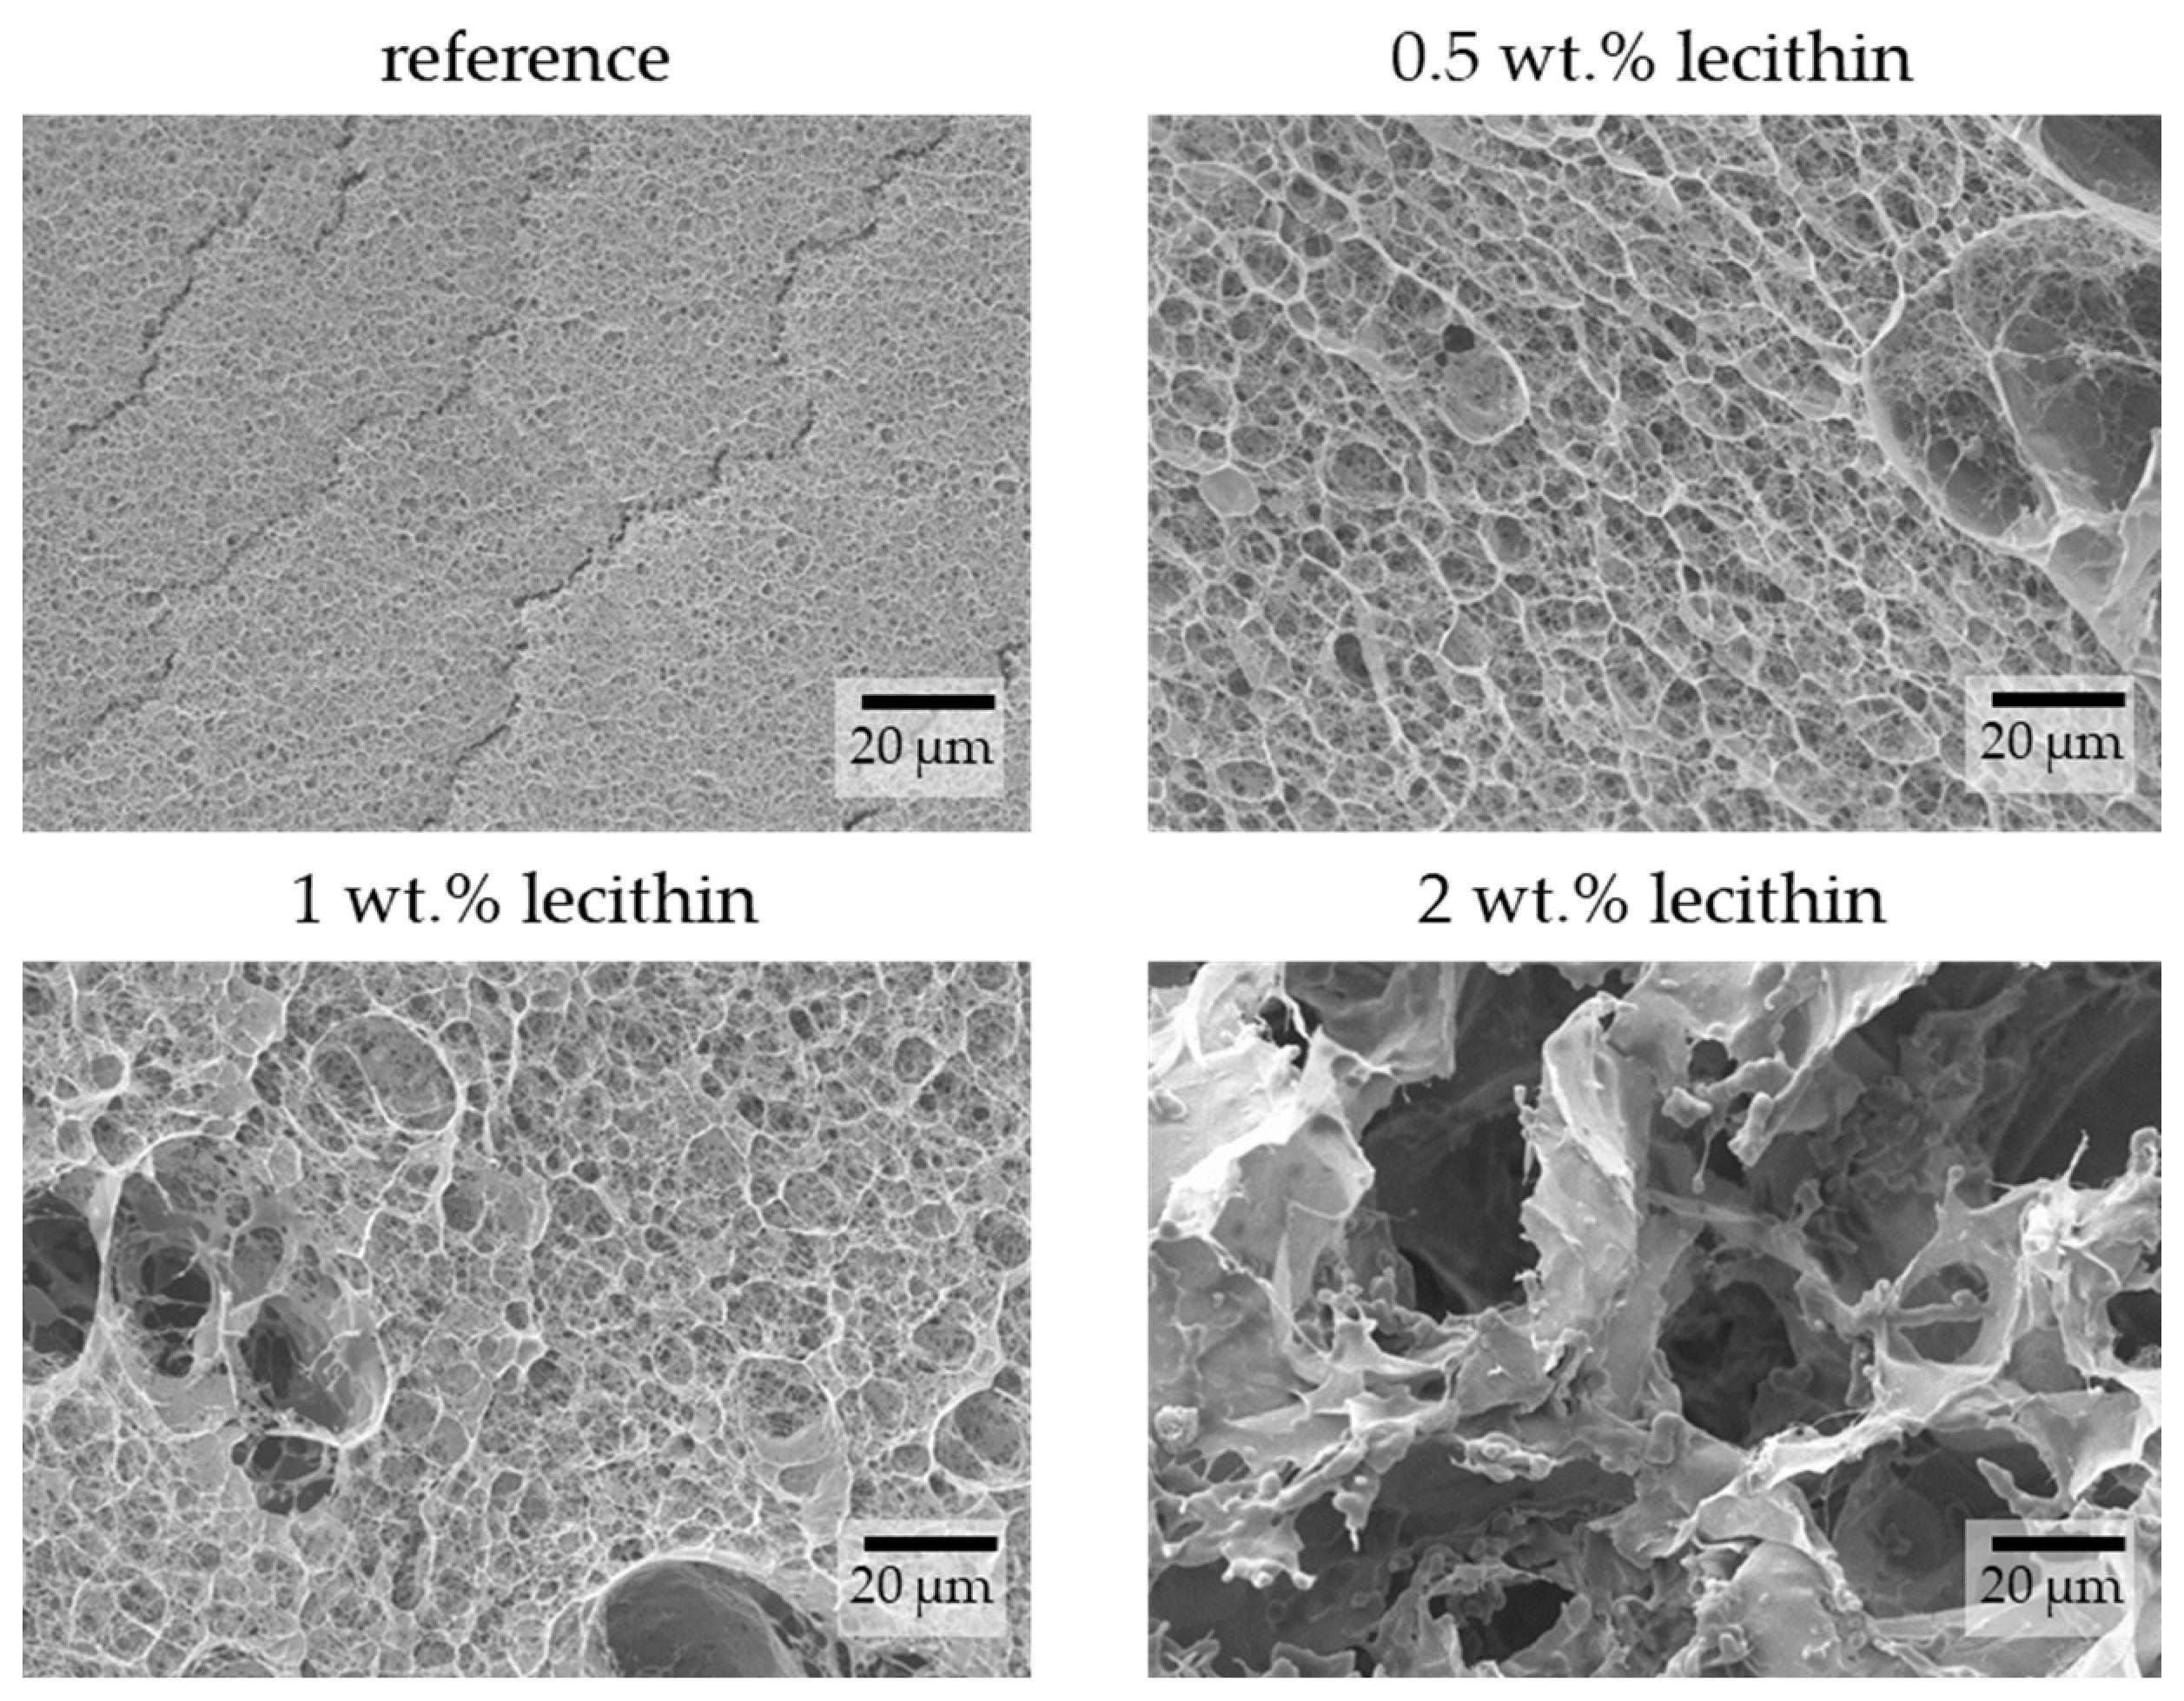
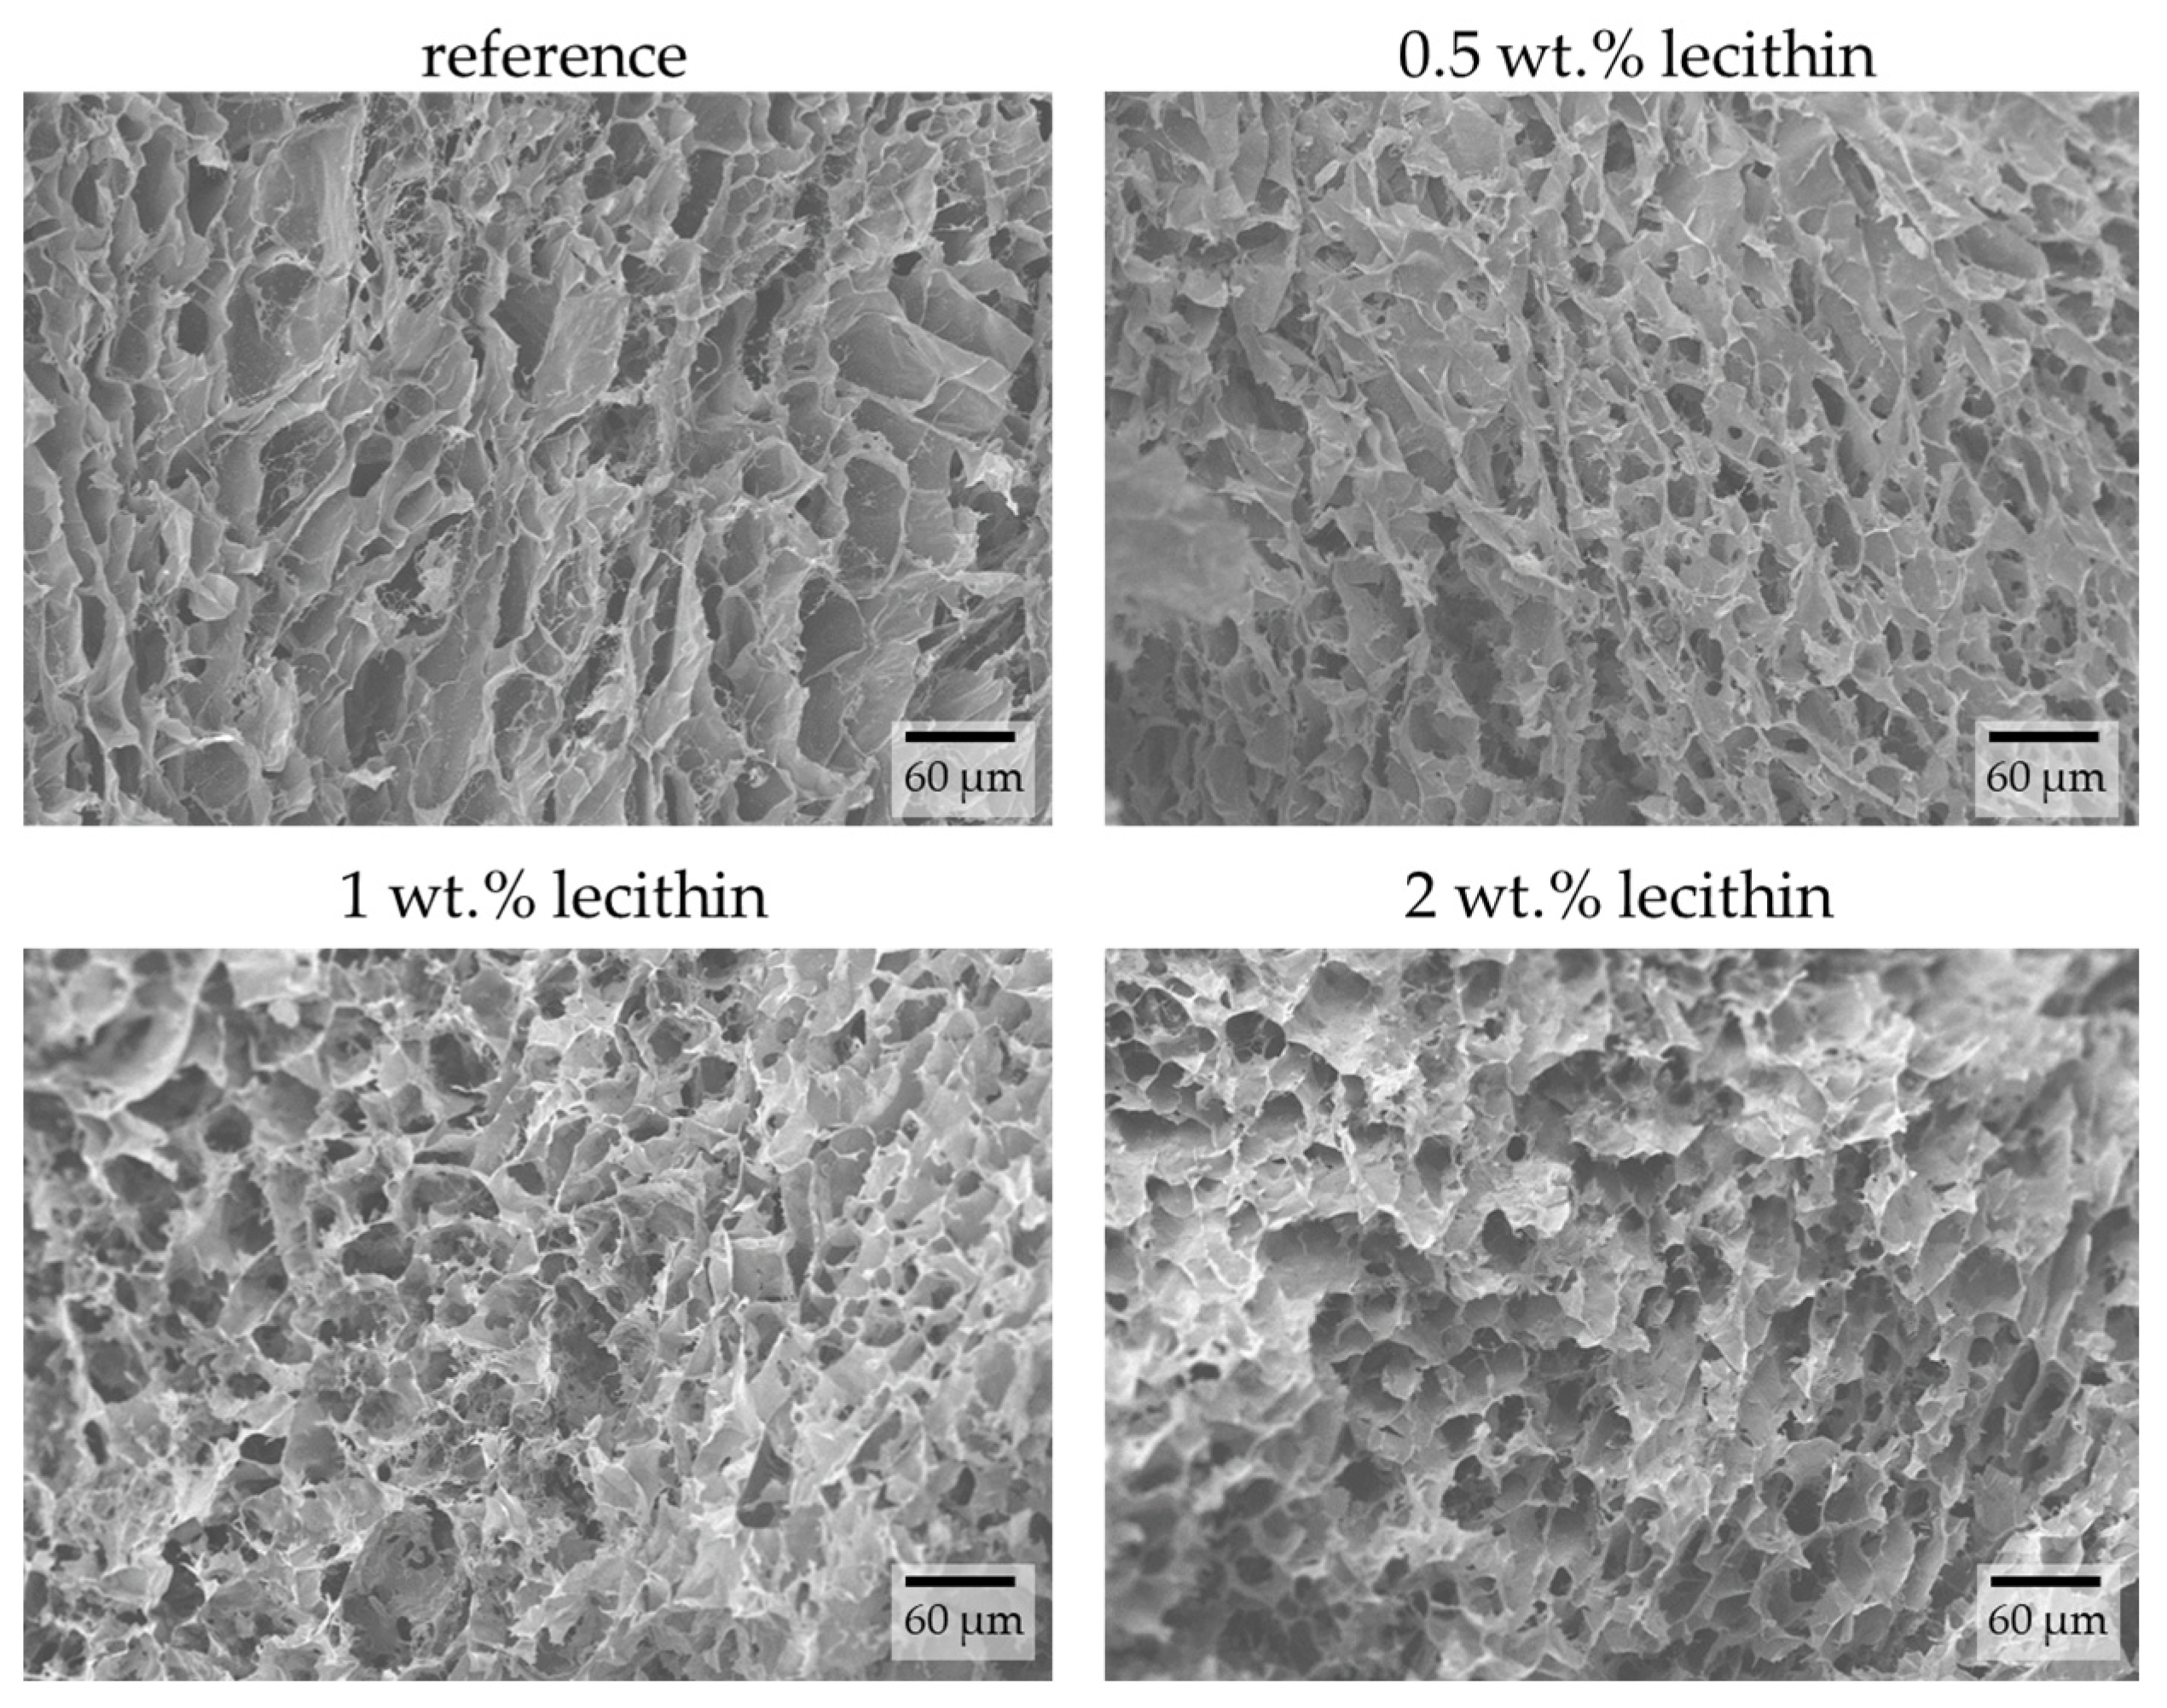
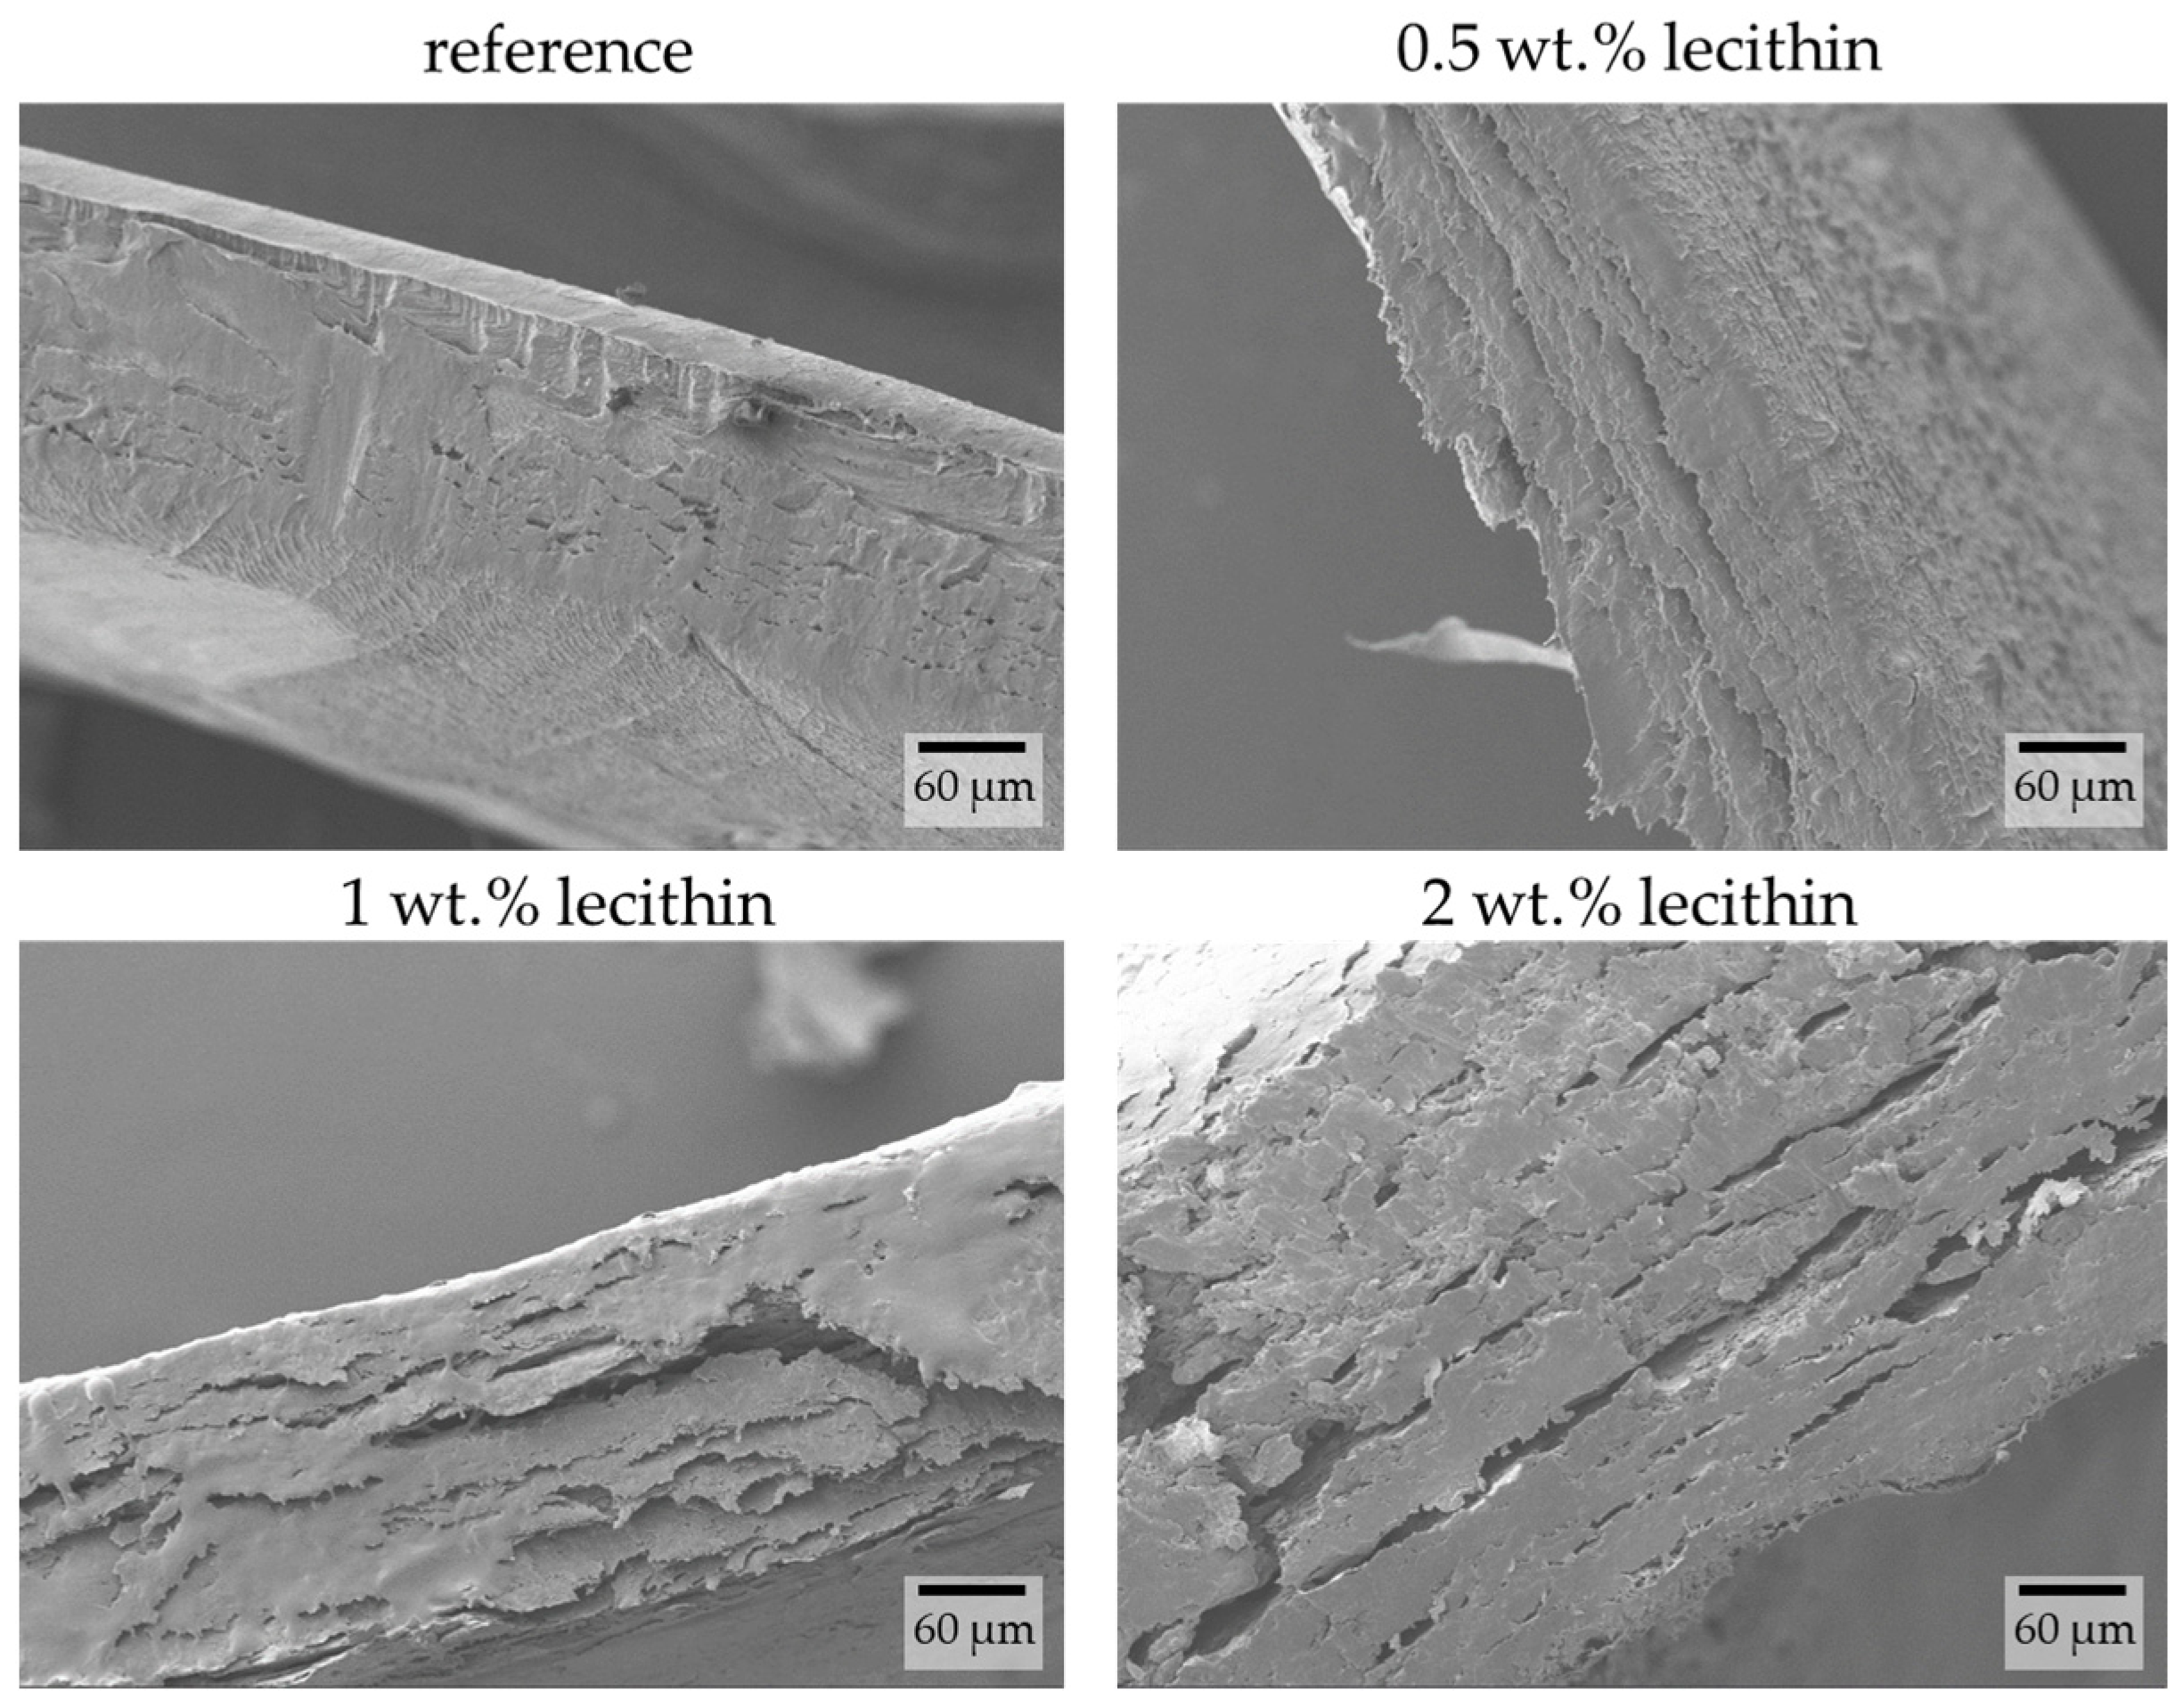
2.1.2. Morphological Characterization
2.2. Ionic Crosslinking
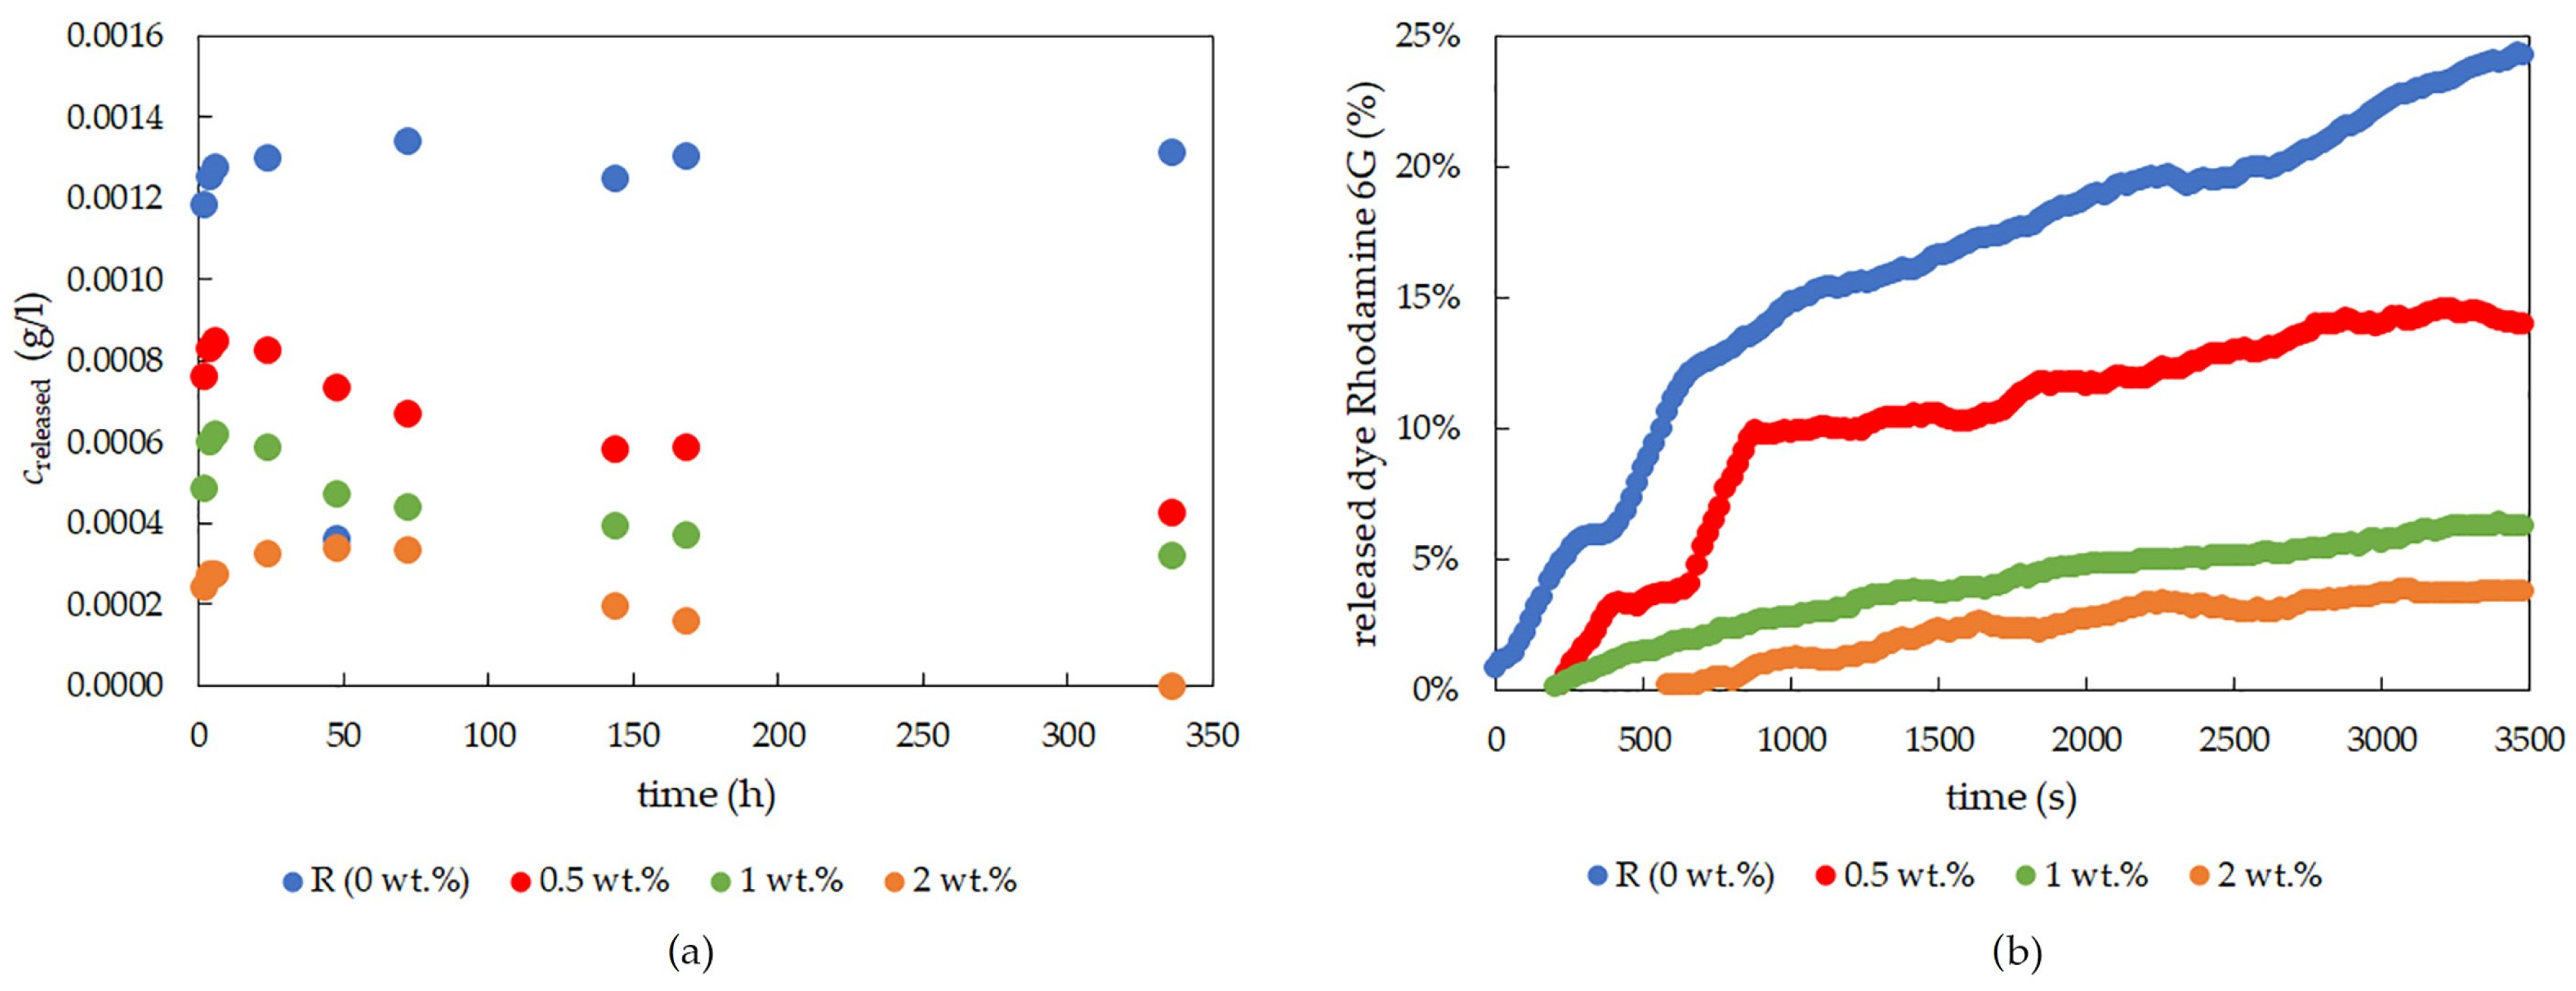
2.2.1. Dye-Release Experiments
2.2.2. Morphological Characterization
2.3. Chemical Crosslinking
2.3.1. Dye-Release Experiments
2.3.2. Morphological Characterization
3. Conclusions
4. Materials and Methods
4.1. Sample Preparations
4.2. Diffusion Release Experiments
4.3. Scanning Electron Microscopy
Supplementary Materials
Author Contributions
Funding
Institutional Review Board Statement
Informed Consent Statement
Data Availability Statement
Acknowledgments
Conflicts of Interest
References
- Bashir, S.; Hina, M.; Iqbal, J.; Rajpar, A.H.; Mujtaba, M.A.; Alghamdi, N.A.; Wageh, S.; Ramesh, K.; Ramesh, S. Fundamental Concepts of Hydrogels: Synthesis, Properties, and Their Applications. Polymers 2020, 12, 2702. [Google Scholar] [CrossRef] [PubMed]
- Miyata, T.; Uragami, T.; Nakamae, K. Biomolecule-sensitive hydrogels. Adv. Drug. Deliv. Rev. 2002, 54, 79–98. [Google Scholar] [CrossRef] [PubMed]
- Ahmed, E.M. Hydrogel: Preparation, characterization, and applications: A review. J. Adv. Res. 2015, 6, 105–121. [Google Scholar] [CrossRef]
- Li, J.; Mooney, D.J. Designing hydrogels for controlled drug delivery. Nat. Rev. Mater. 2016, 1, 16071. [Google Scholar] [CrossRef]
- Nezhad-Mokhtari, P.; Ghorbani, M.; Roshangar, L.; Soleimani Rad, J. A review on the construction of hydrogel scaffolds by various chemically techniques for tissue engineering. Eur. Polym. J. 2019, 117, 64–76. [Google Scholar] [CrossRef]
- Serrano-Aroca, Á. Enhancement of Hydrogels’ Properties for Biomedical Applications: Latest Achievements. In Hydrogels; IntechOpen: London, UK, 2018; pp. 91–120. [Google Scholar]
- Jalageri, M.B.; Mohan Kumar, G.C. Hydroxyapatite Reinforced Polyvinyl Alcohol/Polyvinyl Pyrrolidone Based Hydrogel for Cartilage Replacement. Gels 2022, 8, 555. [Google Scholar] [CrossRef]
- Jayash, S.N.; Cooper, P.R.; Shelton, R.M.; Kuehne, S.A.; Poologasundarampillai, G. Novel Chitosan-Silica Hybrid Hydrogels for Cell Encapsulation and Drug Delivery. Int. J. Mol. Sci. 2021, 22, 12267. [Google Scholar] [CrossRef]
- Appel, E.A.; Tibbitt, M.W.; Webber, M.J.; Mattix, B.A.; Veiseh, O.; Langer, R. Self-assembled hydrogels utilizing polymer–nanoparticle interactions. Nat. Commun. 2015, 6, 6295. [Google Scholar] [CrossRef]
- Heger, R.; Kadlec, M.; Trudicova, M.; Zinkovska, N.; Hajzler, J.; Pekar, M.; Smilek, J. Novel Hydrogel Material with Tailored Internal Architecture Modified by “Bio” Amphiphilic Components—Design and Analysis by a Physico-Chemical Approach. Gels 2022, 8, 115. [Google Scholar] [CrossRef]
- Riazi, M.R. Chapter 8—Applications: Estimation of Transport Properties. In Characterization and Properties of Petroleum Fractions; ASTM International: West Conshohocken, PA, USA, 2007; pp. 329–336. [Google Scholar]
- Kuo, C.K.; Ma, P.X. Ionically crosslinked alginate hydrogels as scaffolds for tissue engineering: Part 1. Structure, gelation rate and mechanical properties. Biomaterials 2001, 22, 511–521. [Google Scholar] [CrossRef]
- Rahman, F.; Rafiquee, M.Z.A.; Aazam, E.S.; Alshabi, A.M.; Iqubal, S.M.S.; Khan, A.A.; Mohammed, T.; Dawoud, A.; Shaikh, I.A.; Maqbul, M.S.; et al. Determination of Rate of Release of Dye from the Hydrogels using Spectrophotometer Studies. Asian. J. Pharm. 2020, 14, 507–512. [Google Scholar] [CrossRef]
- Feng, Y.; Taraban, M.; Yu, Y.B. The effect of ionic strength on the mechanical, structural and transport properties of peptide hydrogels. Soft Matter 2012, 8, 11723. [Google Scholar] [CrossRef] [PubMed]
- Price, W.S. Pulsed-field gradient nuclear magnetic resonance as a tool for studying translational diffusion: Part 1. Basic theory. Concepts Magn. Reson. 1997, 9, 299–336. [Google Scholar] [CrossRef]
- Evans, S.M.; Litzenberger, A.L.; Ellenberger, A.E.; Maneval, J.E.; Jablonski, E.L.; Vogel, B.M. A microfluidic method to measure small molecule diffusion in hydrogels. Mater. Sci. Eng. C Mater. Biol. Appl. 2014, 35, 322–334. [Google Scholar] [CrossRef]
- Richbourg, N.R.; Peppas, N.A. High-Throughput FRAP Analysis of Solute Diffusion in Hydrogels. Macromolecules 2021, 54, 10477–10486. [Google Scholar] [CrossRef]
- Piechocki, K.; Koynov, K.; Piechocka, J.; Chamerski, K.; Filipecki, J.; Maczugowska, P.; Kozanecki, M. Small molecule diffusion in poly-(olygo ethylene glycol methacrylate) based hydrogels studied by fluorescence correlation spectroscopy. Polymer 2022, 244, 124628. [Google Scholar] [CrossRef]
- Jain, E.; Flanagan, M.; Sheth, S.; Patel, S.; Gan, Q.; Patel, B.; Montaño, A.M.; Zustiak, S.P. Biodegradable polyethylene glycol hydrogels for sustained release and enhanced stability of rhGALNS enzyme. Drug Deliv. Transl. Res. 2020, 10, 1341–1352. [Google Scholar] [CrossRef]
- Quesada-Pérez, M.; Martín-Molina, A. Solute diffusion in gels: Thirty years of simulations. Adv. Colloid Interface Sci. 2021, 287, 102320. [Google Scholar] [CrossRef]
- Jang, S.S.; Goddard, W.A.; Kalani, M.Y.S. Mechanical and Transport Properties of the Poly(ethylene oxide)−Poly(acrylic acid) Double Network Hydrogel from Molecular Dynamic Simulations. J. Phys. Chem. B 2007, 111, 1729–1737. [Google Scholar] [CrossRef]
- Pomfret, R.; Sillay, K.; Miranpuri, G. An Exploration of the Electrical Properties of Agarose Gel: Characterization of Concentration Using Nyquist Plot Phase Angle and the Implications of a More Comprehensive In Vitro Model of the Brain. Ann. Neurosci. 2013, 20, 99–107. [Google Scholar] [CrossRef]
- Smilek, J.; Sedláček, P.; Kalina, M.; Klučáková, M. On the role of humic acids’ carboxyl groups in the binding of charged organic compounds. Chemosphere 2015, 138, 503–510. [Google Scholar] [CrossRef] [PubMed]
- Klučáková, M. Agarose Hydrogels Enriched by Humic Acids as the Complexation Agent. Polymers 2020, 12, 687. [Google Scholar] [CrossRef] [PubMed]
- Fatin-Rouge, N.; Starchev, K.; Buffle, J. Size Effects on Diffusion Processes within Agarose Gels. Biophys. J. 2004, 86, 2710–2719. [Google Scholar] [CrossRef] [PubMed]
- Lai, M.; Lü, B. Tissue Preparation for Microscopy and Histology. Compr. Sampl. Sample Prep. 2012, 3, 53–93. [Google Scholar] [CrossRef]
- Trudicova, M.; Smilek, J.; Kalina, M.; Smilkova, M.; Adamkova, K.; Hrubanova, K.; Krzyzanek, V.; Sedlacek, P. Multiscale Experimental Evaluation of Agarose-Based Semi-Interpenetrating Polymer Network Hydrogels as Materials with Tunable Rheological and Transport Performance. Polymers 2020, 12, 2561. [Google Scholar] [CrossRef]
- Rowley, J.A.; Madlambayan, G.; Mooney, D.J. Alginate hydrogels as synthetic extracellular matrix materials. Biomaterials 1999, 20, 45–53. [Google Scholar] [CrossRef]
- Golmohamadi, M.; Wilkinson, K.J. Diffusion of ions in a calcium alginate hydrogel-structure is the primary factor controlling diffusion. Carbohydr. Polym. 2013, 94, 82–87. [Google Scholar] [CrossRef]
- Cohen, S.; Bañó, M.C.; Chow, M.; Langer, R. Lipid-alginate interactions render changes in phospholipid bilayer permeability. Biochim. Et Biophys. Acta (BBA)—Biomembr. 1991, 1063, 95–102. [Google Scholar] [CrossRef]
- Klak, M.-C.; Lefebvre, E.; Rémy, L.; Agniel, R.; Picard, J.; Giraudier, S.; Larreta-Garde, V. Gelatin-Alginate Gels and Their Enzymatic Modifications: Controlling the Delivery of Small Molecules. Macromol. Biosci. 2013, 13, 687–695. [Google Scholar] [CrossRef]
- Kaberova, Z.; Karpushkin, E.; Nevoralová, M.; Vetrík, M.; Šlouf, M.; Dušková-Smrčková, M. Microscopic Structure of Swollen Hydrogels by Scanning Electron and Light Microscopies: Artifacts and Reality. Polymers 2020, 12, 578. [Google Scholar] [CrossRef]
- Garnica-Palafox, I.M.; Sánchez-Arévalo, F.M.; Velasquillo, C.; García-Carvajal, Z.Y.; García-López, J.; Ortega-Sánchez, C.; Ibarra, C.; Luna-Bárcenas, G.; Solís-Arrieta, L. Mechanical and structural response of a hybrid hydrogel based on chitosan and poly(vinyl alcohol) cross-linked with epichlorohydrin for potential use in tissue engineering. J. Biomater. Sci. Polym. Ed. 2014, 25, 32–50. [Google Scholar] [CrossRef] [PubMed]
- Hezaveh, H.; Muhamad, I.I. Controlled drug release via minimization of burst release in pH-response kappa-carrageenan/polyvinyl alcohol hydrogels. Chem. Eng. Res. Des. 2013, 91, 508–519. [Google Scholar] [CrossRef]
- Crank, J. The Mathematics of Diffusion, 2nd ed.; Oxford University Press USA: New York, NY, USA, 1979. [Google Scholar]
- Mlynáriková, K.; Samek, O.; Bernatová, S.; Růžička, F.; Ježek, J.; Hároniková, A.; Šiler, M.; Zemánek, P.; Holá, V. Influence of Culture Media on Microbial Fingerprints Using Raman Spectroscopy. Sensors 2015, 15, 29635–29647. [Google Scholar] [CrossRef] [PubMed]


| Rhodamine 6G | Hydrogel Deff × 10−10 (m2·s−1) | Xerogel Deff × 10−10 (m2·s−1) |
|---|---|---|
| R (0 wt.%) | 2.7 ± 0.2 | 6.4 ± 0.9 |
| 0.5 wt.% | 1.2 ± 0.1 | — |
| 1 wt.% | 1.0 ± 0.1 | — |
| 2 wt.% | 1.2 ± 0.1 | — |
| Eosin B | Hydrogel Deff × 10−10 (m2·s−1) | Xerogel Deff × 10−10 (m2·s−1) |
|---|---|---|
| R (0 wt.%) | 2.3 ± 0.6 | 95 ± 13 |
| 0.5 wt.% | 2.5 ± 0.5 | 12 ± 2·10−2 |
| 1 wt.% | 2.5 ± 1.2 | 9 ± 3·10−7 |
| 2 wt.% | 2.4 ± 1.3 | 4 ± 2 |
| Amido Black 10B | Hydrogel Deff × 10−10 (m2·s−1) | Xerogel Deff × 10−10 (m2·s−1) |
|---|---|---|
| R (0 wt.%) | 2.6 ± 0.8 | 110 ± 53 |
| 0.5 wt.% | 2.4 ± 1.0 | 18 ± 11 |
| 1 wt.% | 2.2 ± 1.2 | 5.0 ± 0.4 |
| 2 wt.% | 3.1 ± 0.1 | 6 ± 1 |
| Rhodamine 6G | Hydrogel Deff × 10−10 (m2·s−1) | Xerogel Deff × 10−10 (m2·s−1) |
|---|---|---|
| R (0 wt.%) | 2.9 ± 0.2 | 22 ± 2 |
| 0.5 wt.% | 1.5 ± 0.1 | — |
| 1 wt.% | 1.2 ± 0.1 | — |
| 2 wt.% | 1.2 ± 0.1 | — |
| Eosin B | Hydrogel Deff × 10−10 (m2·s−1) | Xerogel Deff × 10−10 (m2·s−1) |
|---|---|---|
| R (0 wt.%) | 2.0 ± 0.1 | 22 ± 8 |
| 0.5 wt.% | 2.2 ± 0.2 | 0.4 ± 0.6 |
| 1 wt.% | 2.2 ± 0.2 | 0.9 ± 1.2 |
| 2 wt.% | 4.2 ± 0.3 | 1.7 ± 0.4 |
| Amido Black 10B | Hydrogel Deff × 10−10 (m2·s−1) | Xerogel Deff × 10−10 (m2·s−1) |
|---|---|---|
| R (0 wt.%) | 1.5 ± 0.4 | 44 ± 2 |
| 0.5 wt.% | 2.4 ± 0.4 | 1.8 ± 0.1 |
| 1 wt.% | 1.7 ± 0.2 | 2.6 ± 0.1 |
| 2 wt.% | — | 0.45 ± 0.02 |
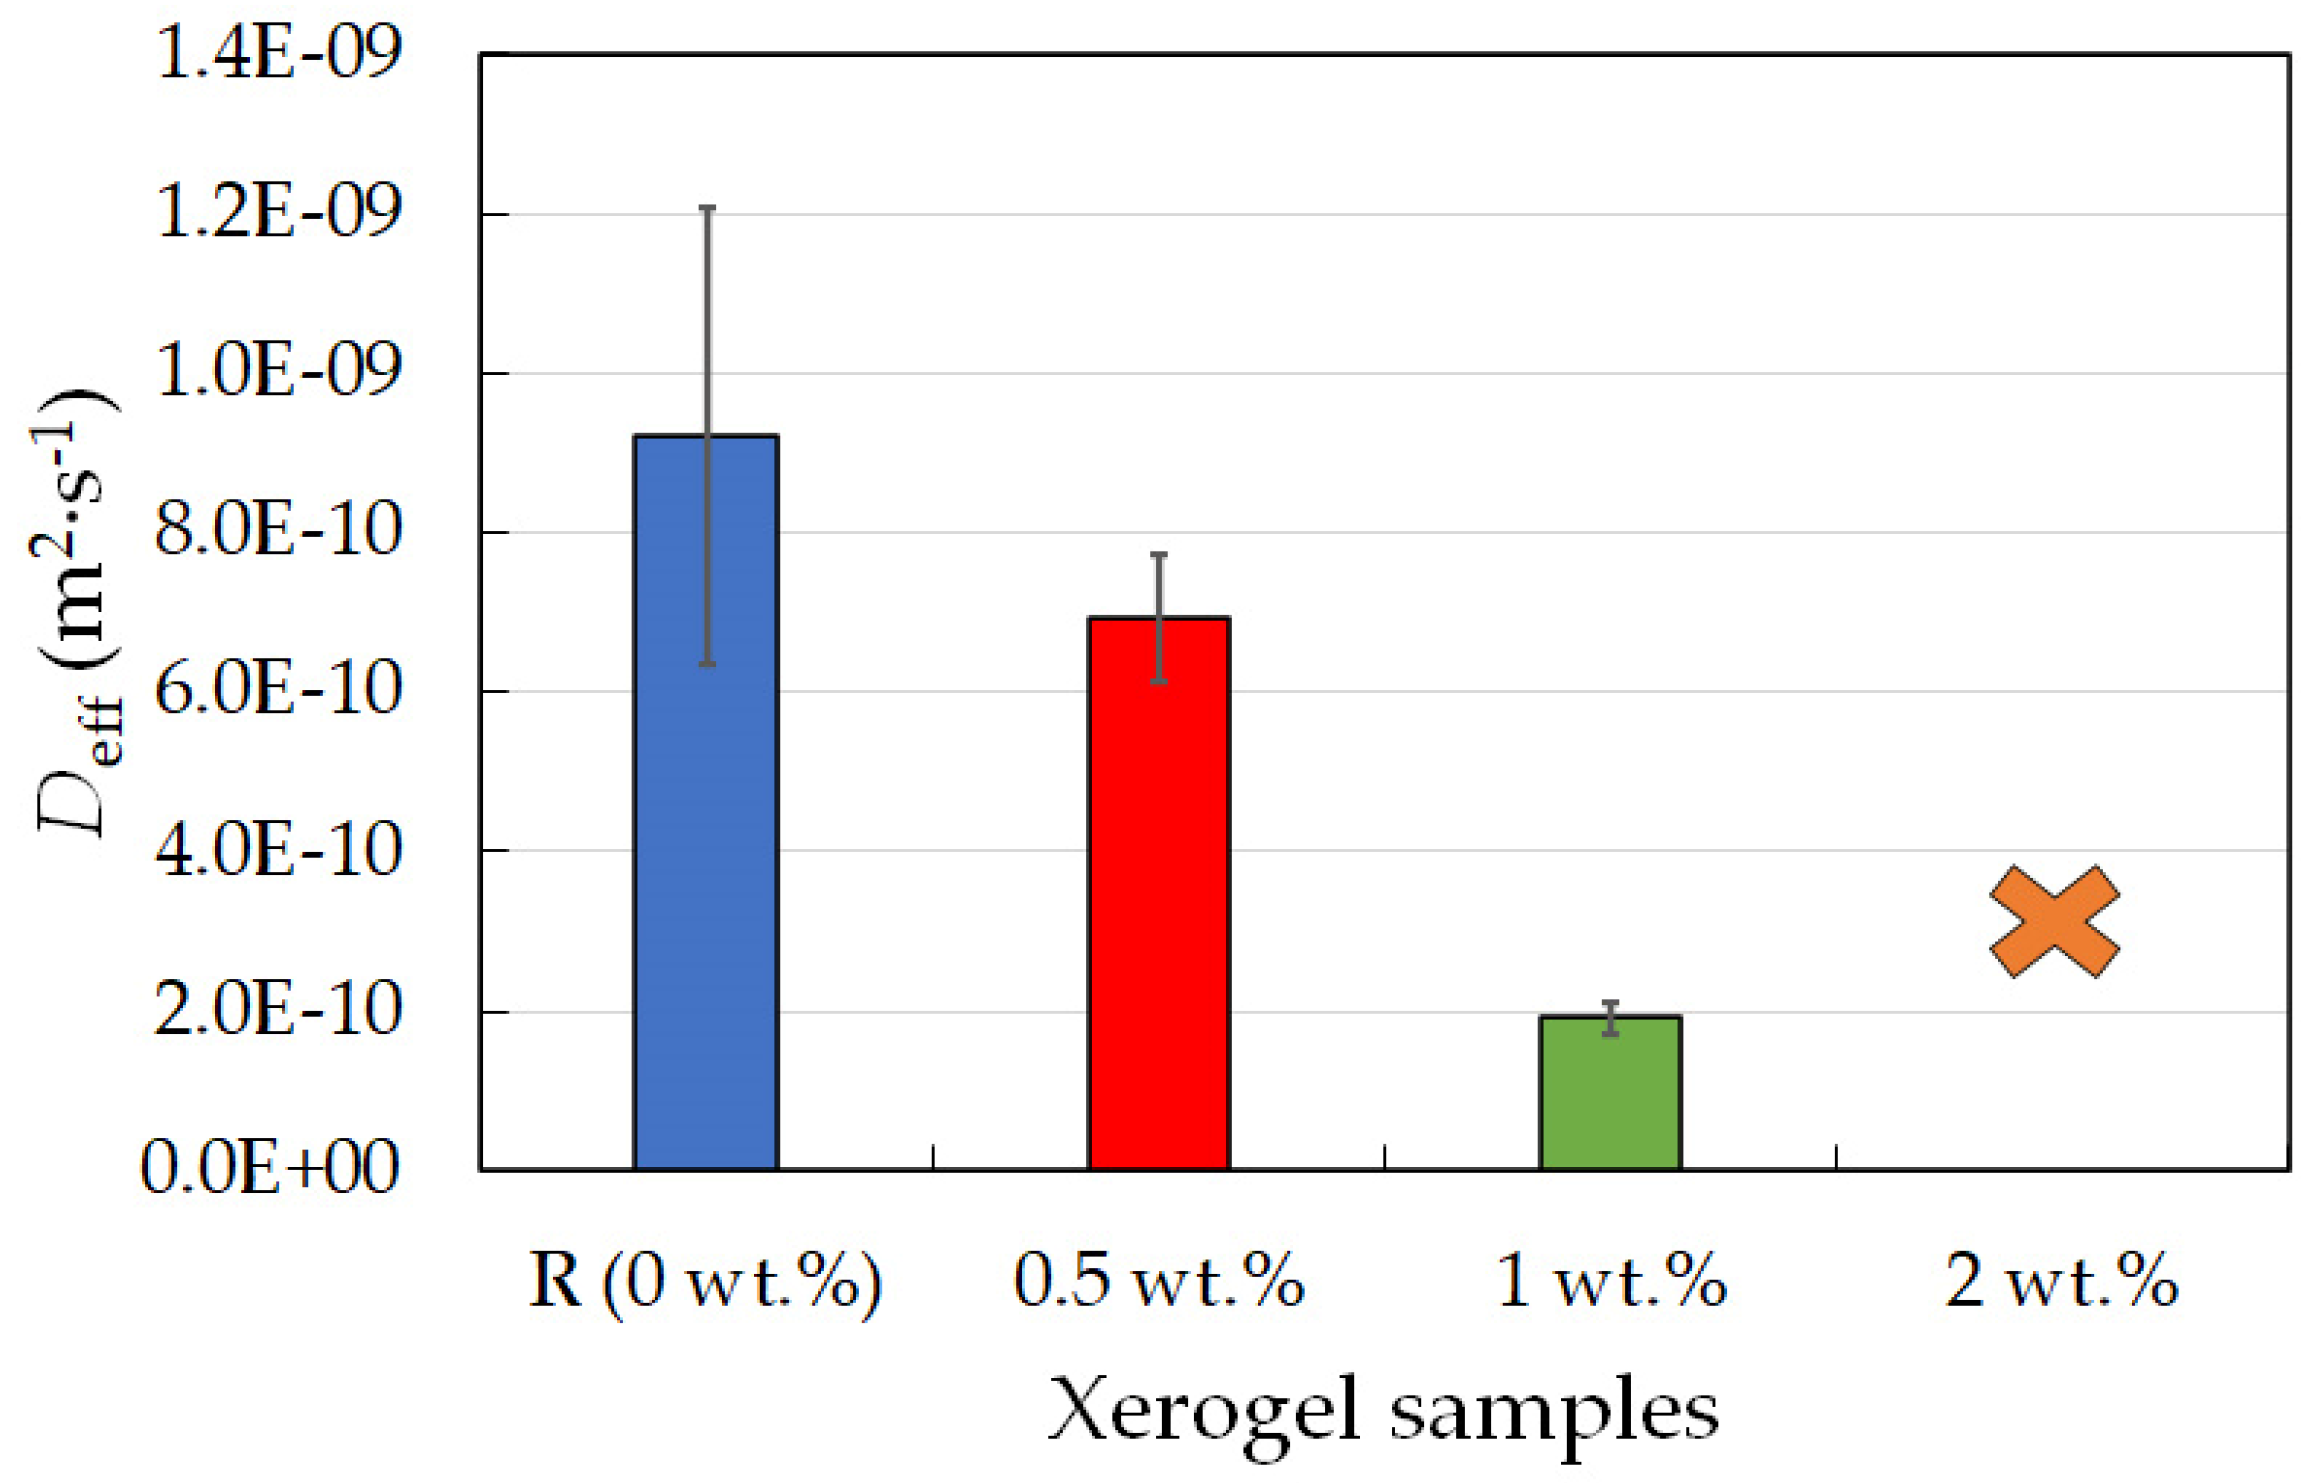
| Xerogel Sample (c of Lecithin) | R (0 wt.%) | 0.5 wt.% | 1 wt.% | 2 wt.% |
|---|---|---|---|---|
| Deff × 10−10 (m2·s−1) | 9 ± 3 | 7 ± 1 | 1.9 ± 0.2 | — |
Disclaimer/Publisher’s Note: The statements, opinions and data contained in all publications are solely those of the individual author(s) and contributor(s) and not of MDPI and/or the editor(s). MDPI and/or the editor(s) disclaim responsibility for any injury to people or property resulting from any ideas, methods, instructions or products referred to in the content. |
© 2023 by the authors. Licensee MDPI, Basel, Switzerland. This article is an open access article distributed under the terms and conditions of the Creative Commons Attribution (CC BY) license (https://creativecommons.org/licenses/by/4.0/).
Share and Cite
Heger, R.; Zinkovska, N.; Trudicova, M.; Kadlec, M.; Pekar, M.; Smilek, J. Lecithin as an Effective Modifier of the Transport Properties of Variously Crosslinked Hydrogels. Gels 2023, 9, 367. https://doi.org/10.3390/gels9050367
Heger R, Zinkovska N, Trudicova M, Kadlec M, Pekar M, Smilek J. Lecithin as an Effective Modifier of the Transport Properties of Variously Crosslinked Hydrogels. Gels. 2023; 9(5):367. https://doi.org/10.3390/gels9050367
Chicago/Turabian StyleHeger, Richard, Natalia Zinkovska, Monika Trudicova, Martin Kadlec, Miloslav Pekar, and Jiri Smilek. 2023. "Lecithin as an Effective Modifier of the Transport Properties of Variously Crosslinked Hydrogels" Gels 9, no. 5: 367. https://doi.org/10.3390/gels9050367
APA StyleHeger, R., Zinkovska, N., Trudicova, M., Kadlec, M., Pekar, M., & Smilek, J. (2023). Lecithin as an Effective Modifier of the Transport Properties of Variously Crosslinked Hydrogels. Gels, 9(5), 367. https://doi.org/10.3390/gels9050367