
Evaluation of Artificial Intelligence Methods to Estimate the Compressive Strength of Geopolymers

 , ,
, ,
Abstract
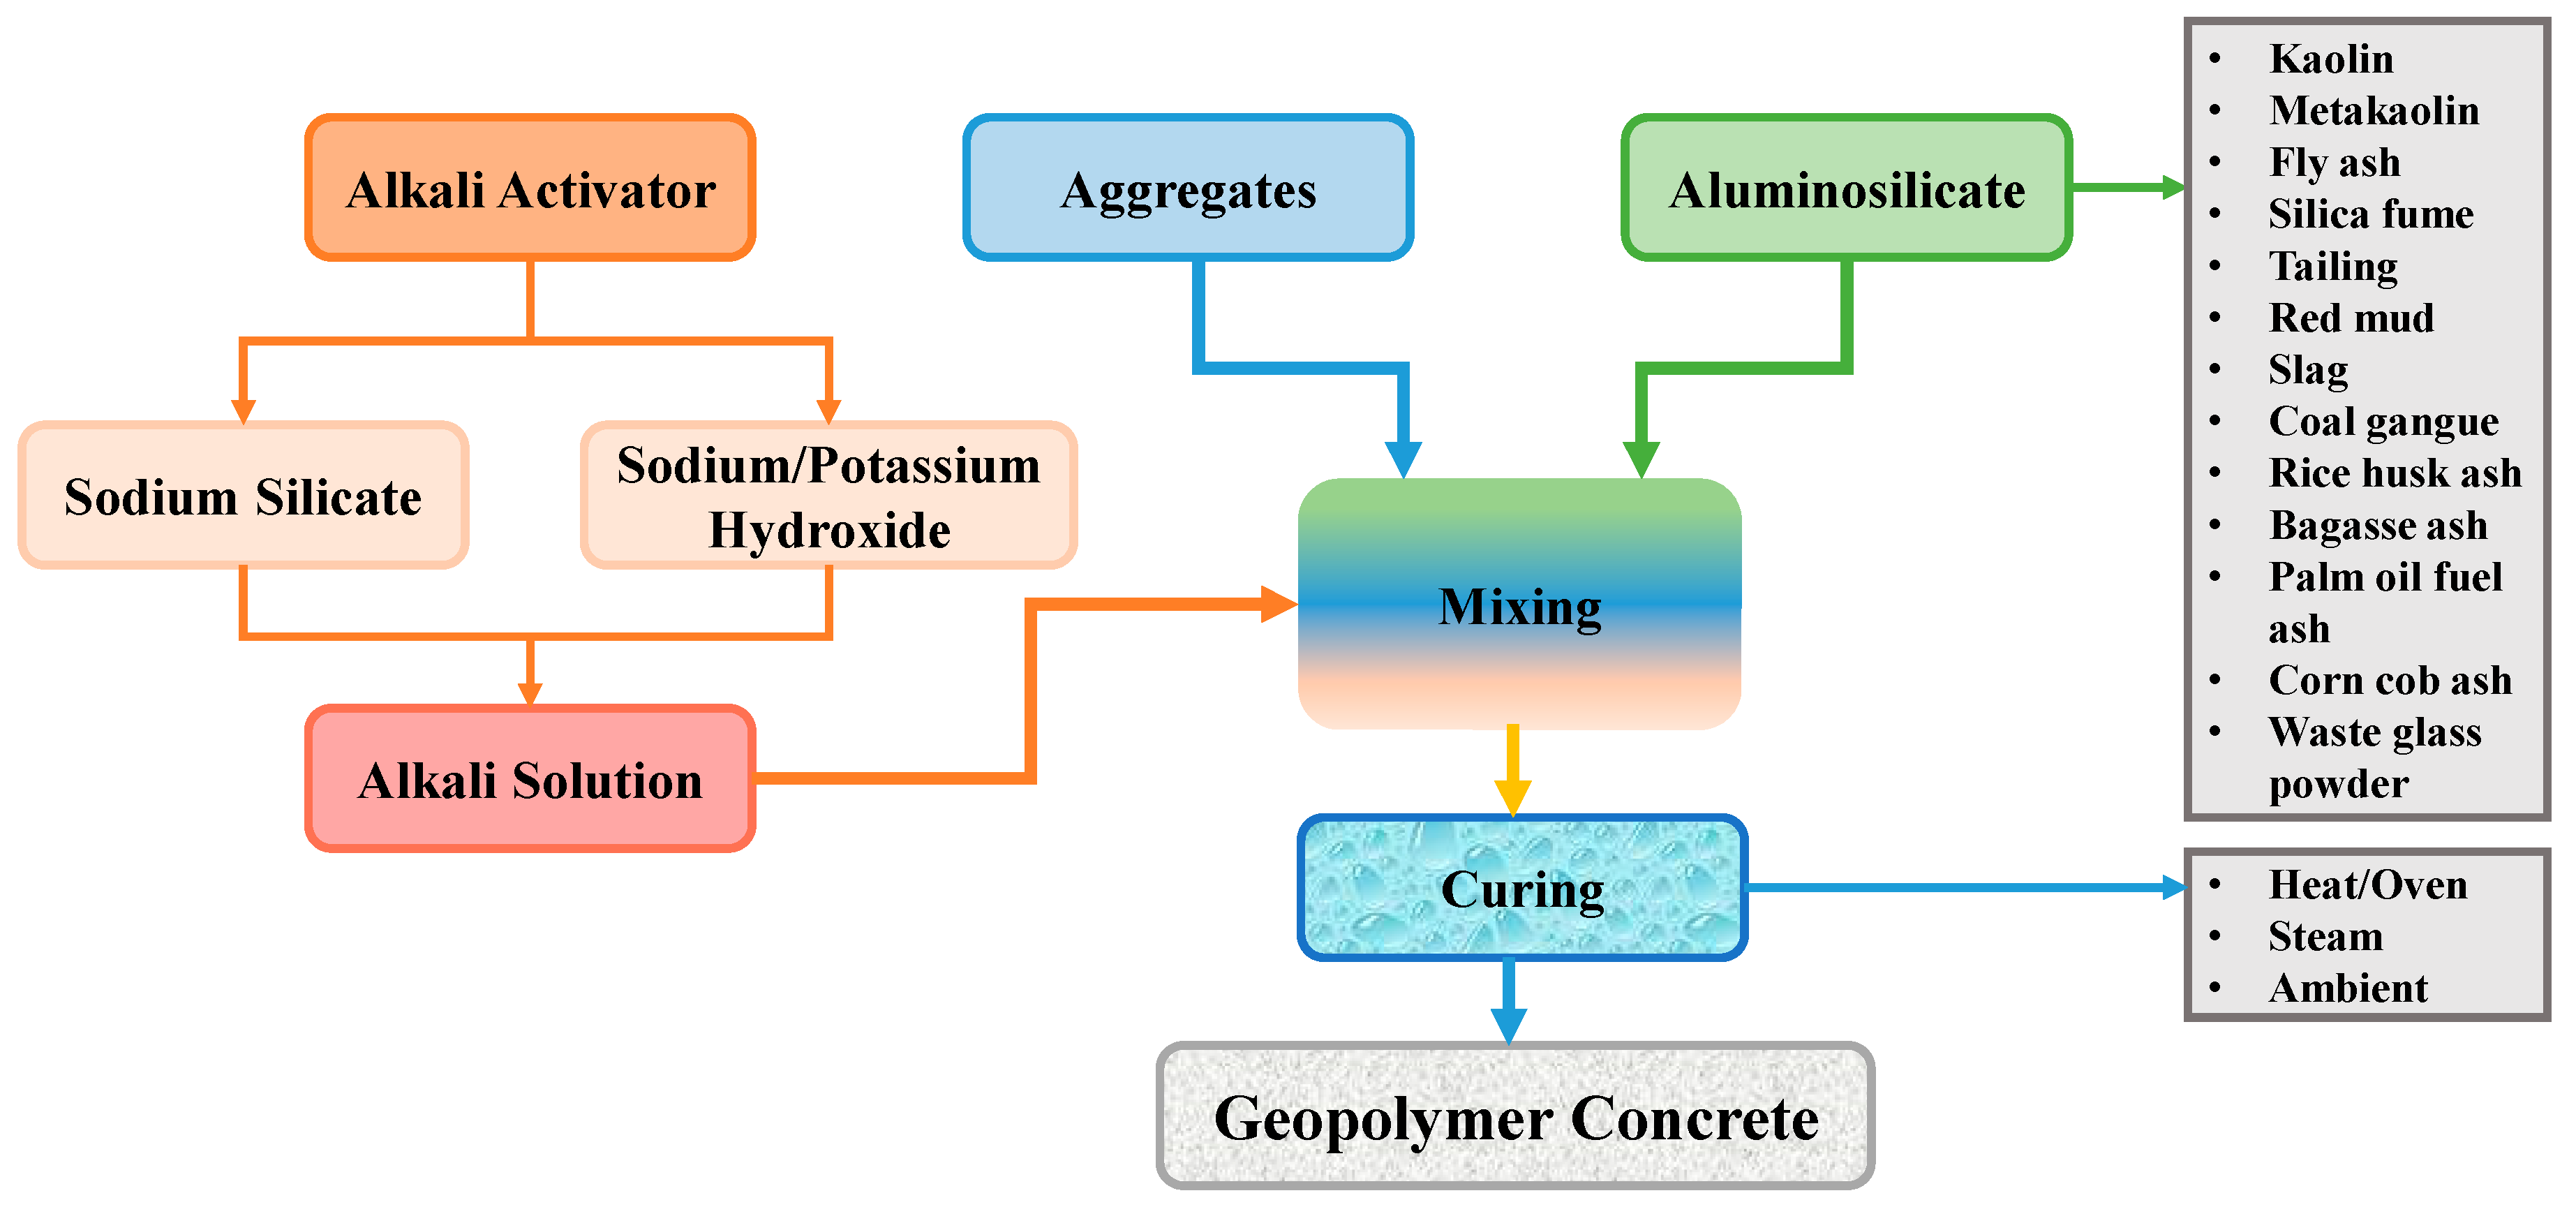
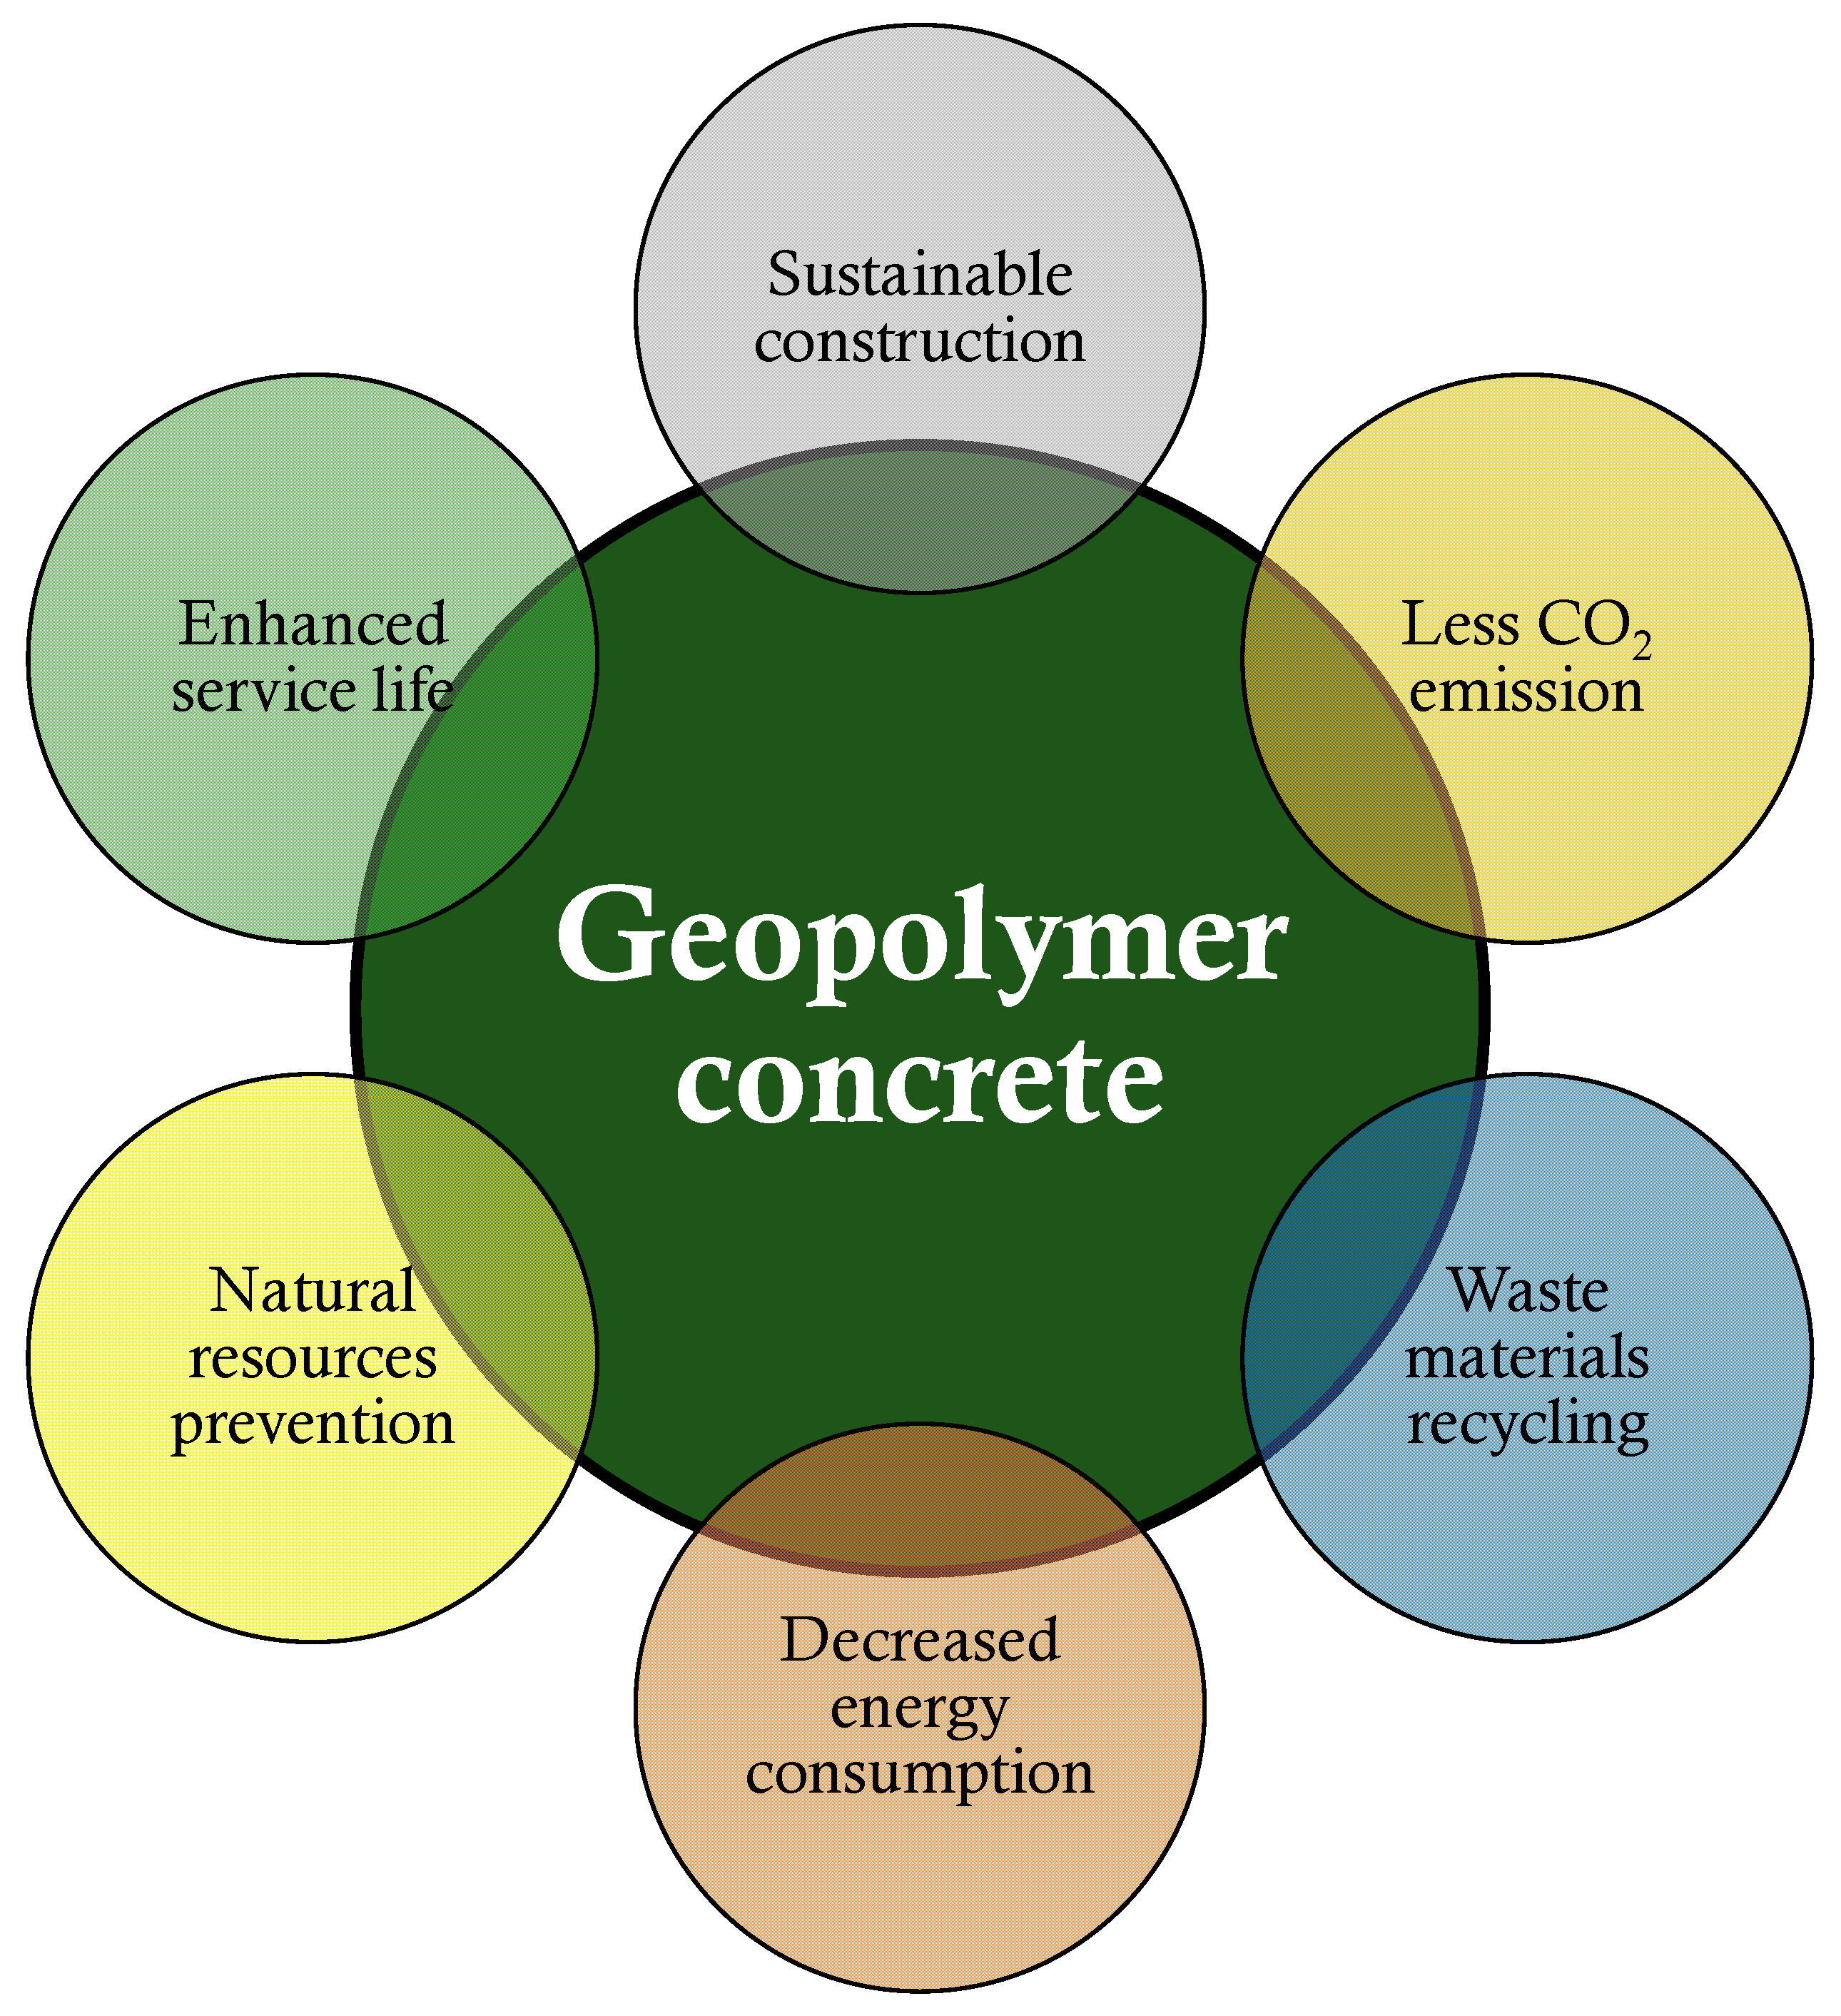
:1. Introduction
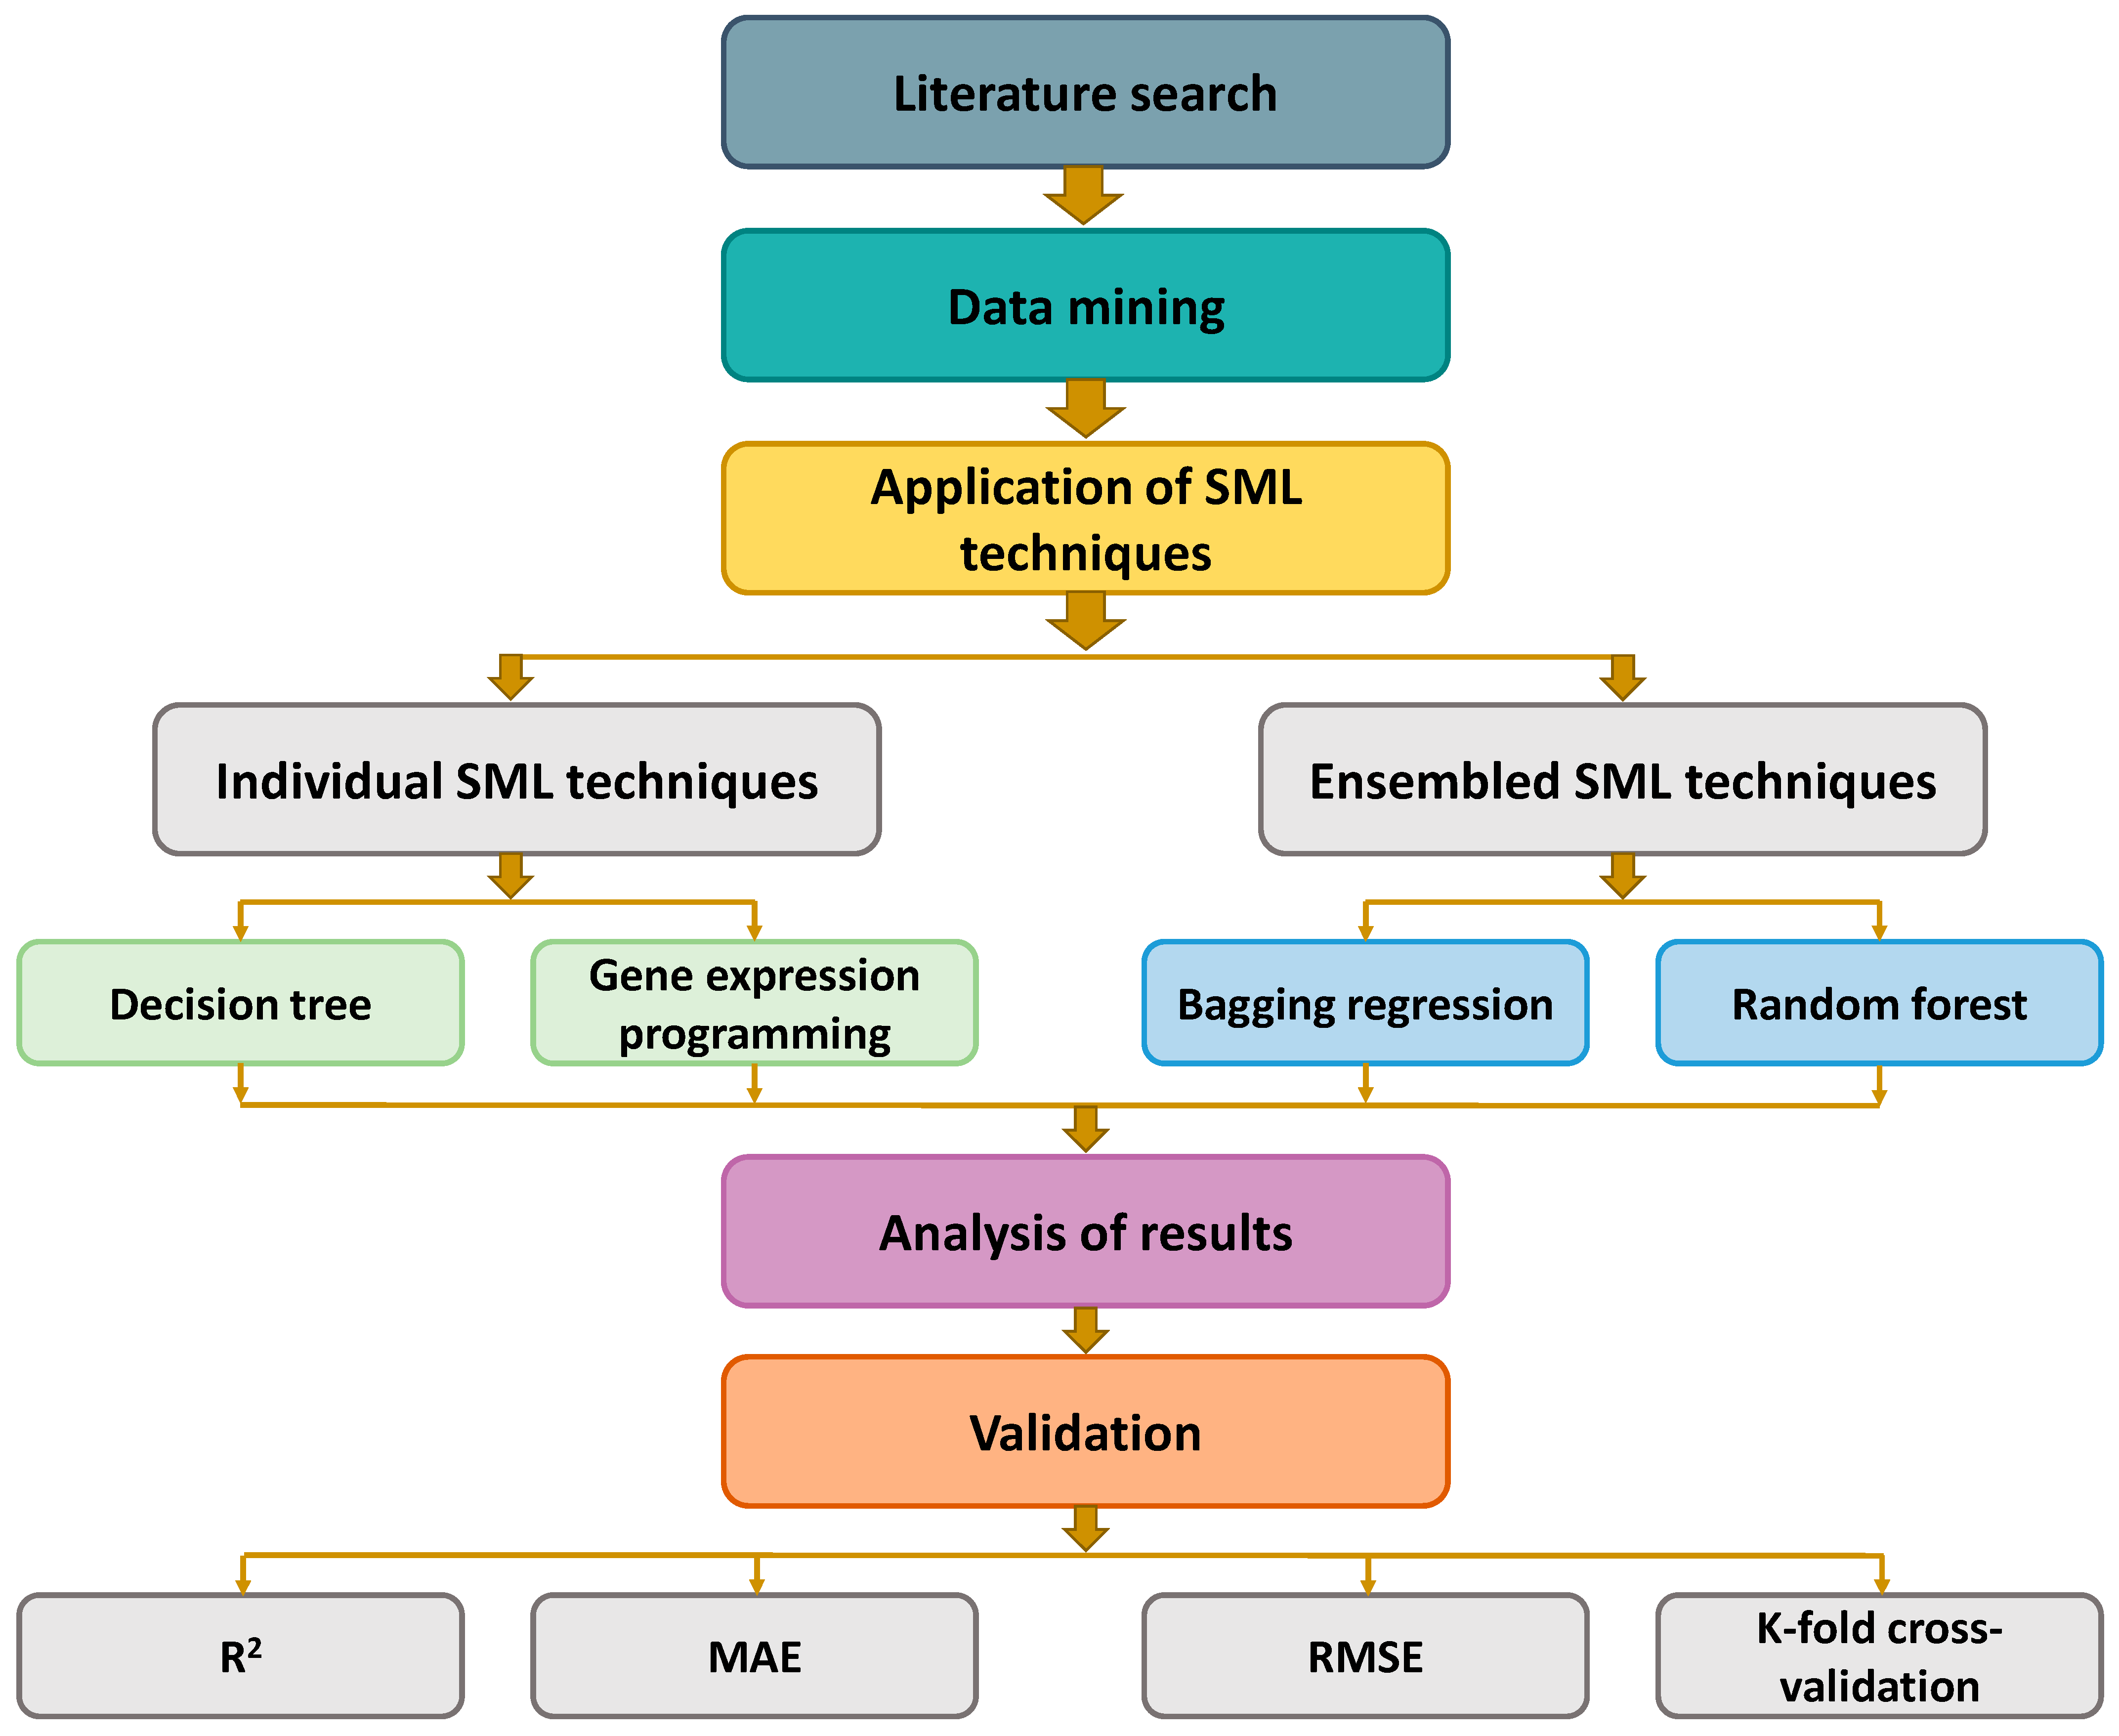
2. Research Methods
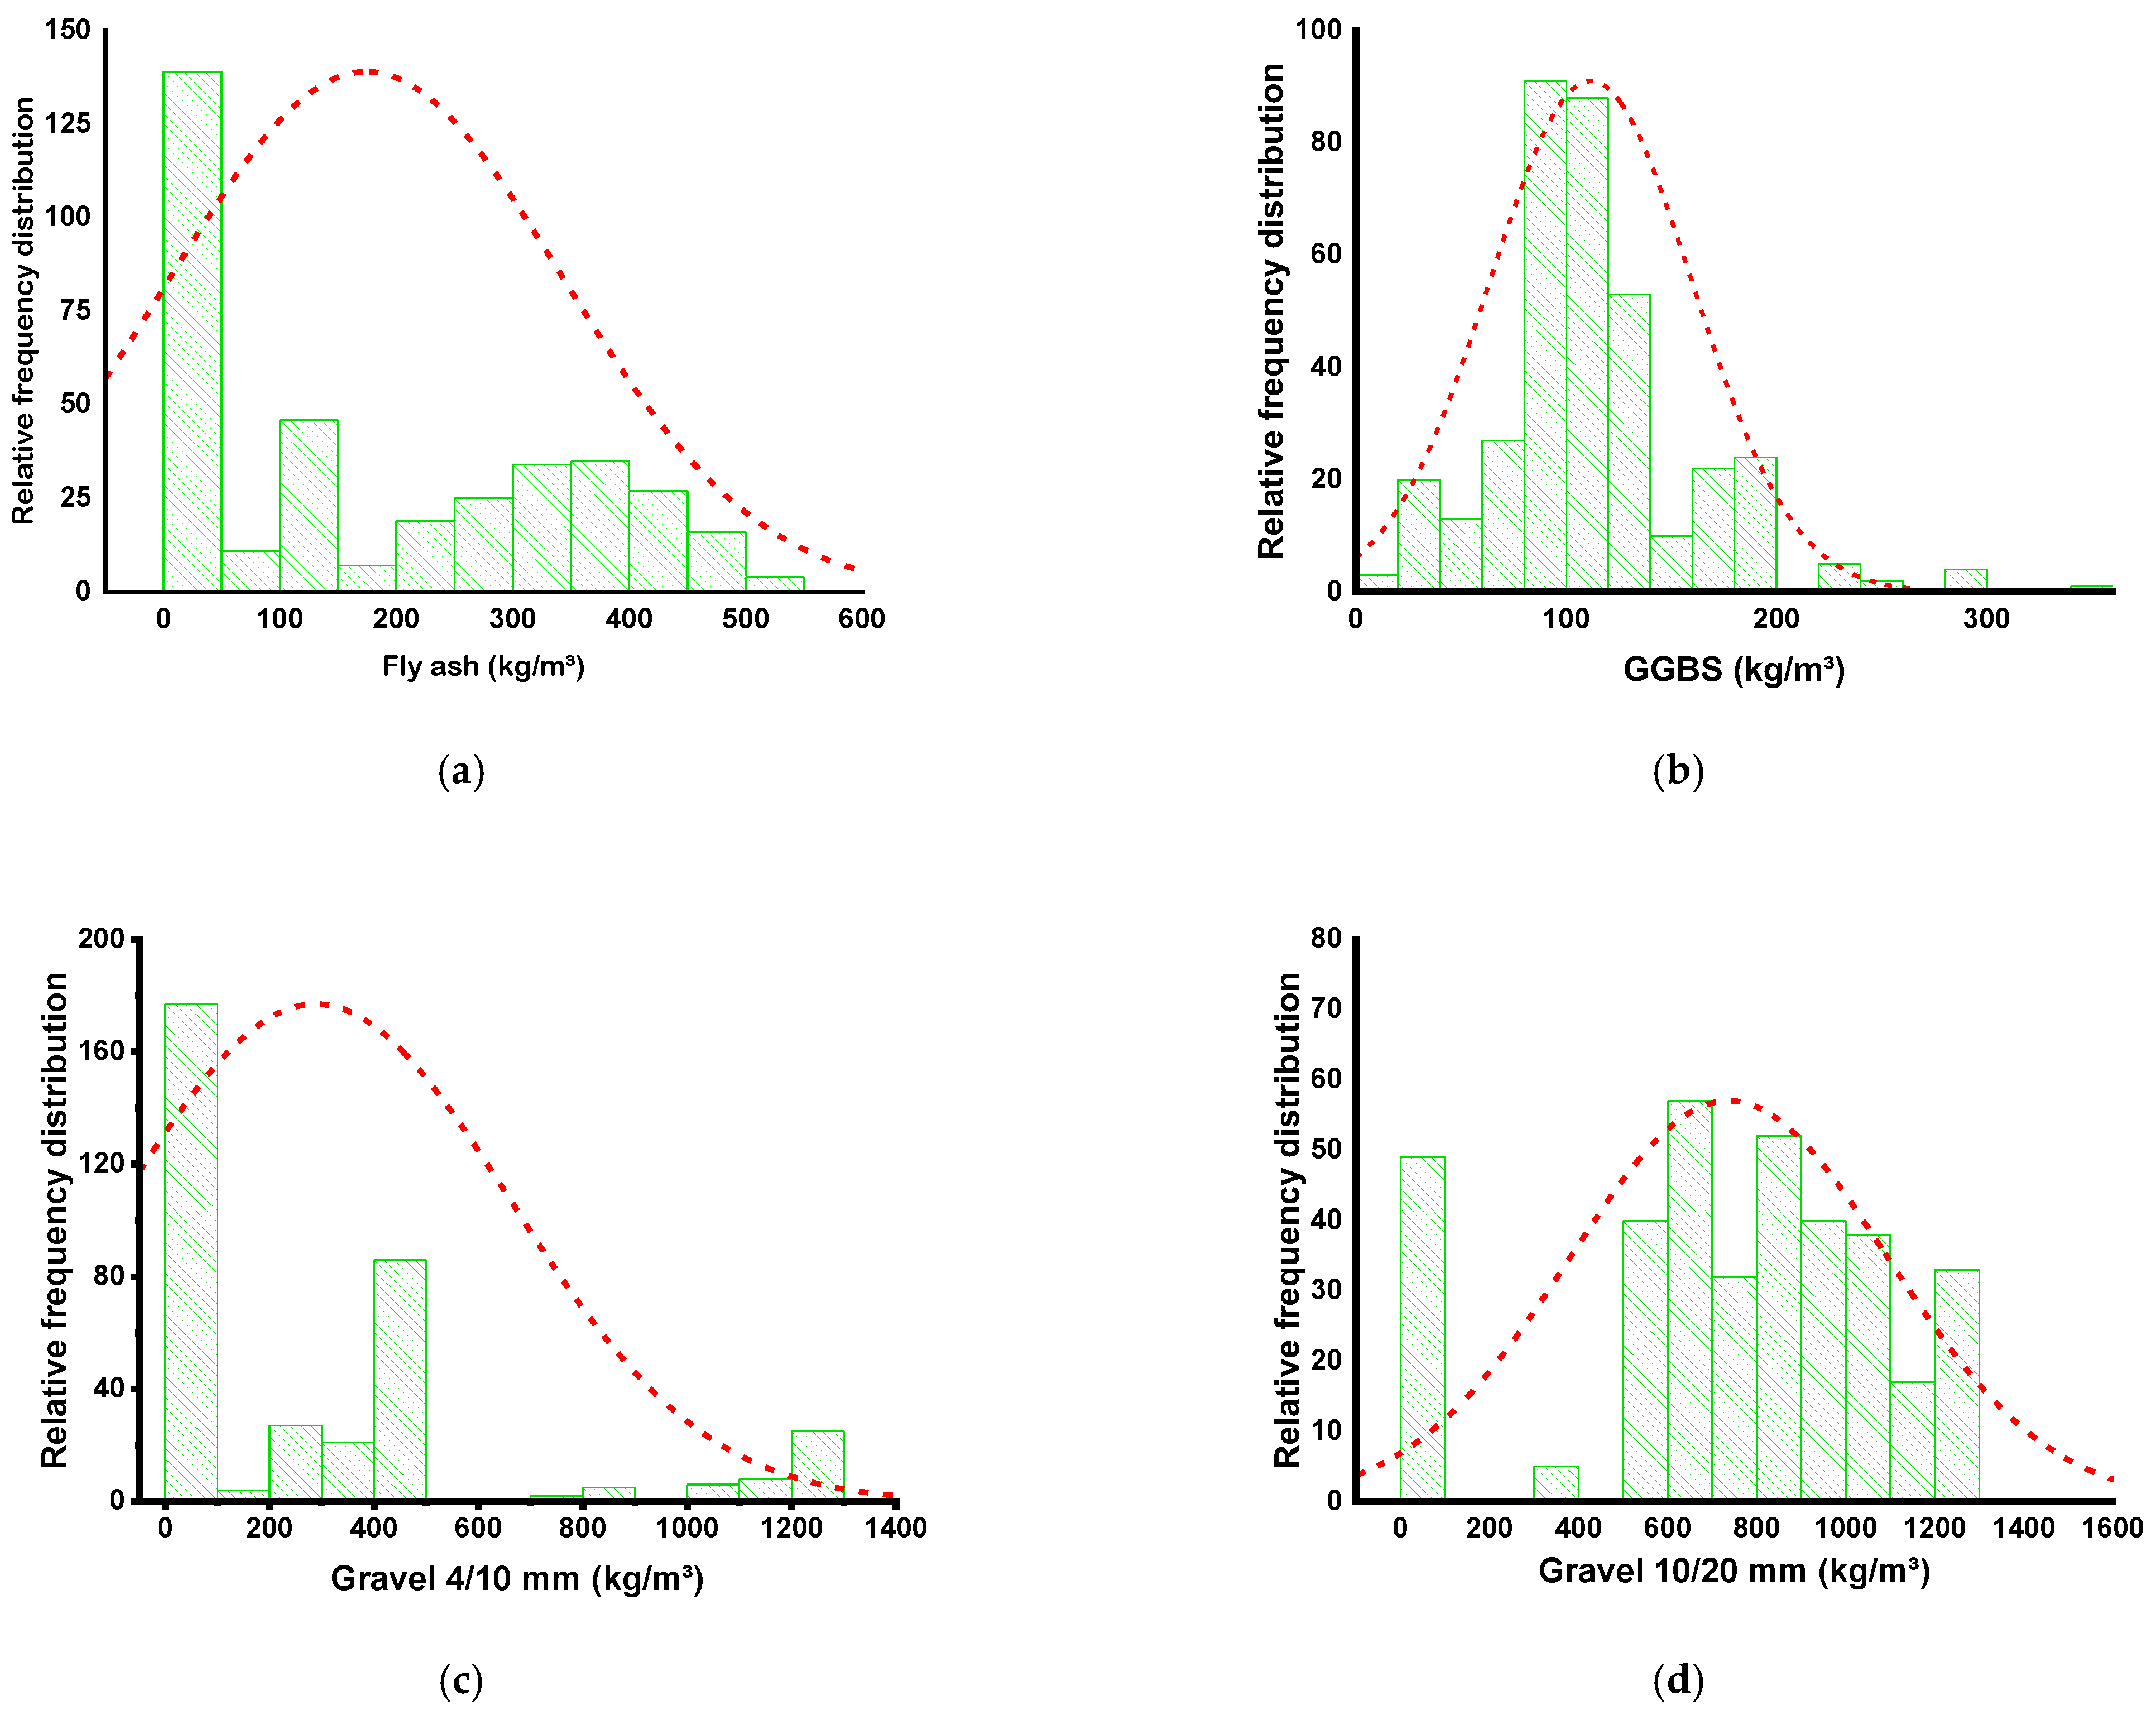
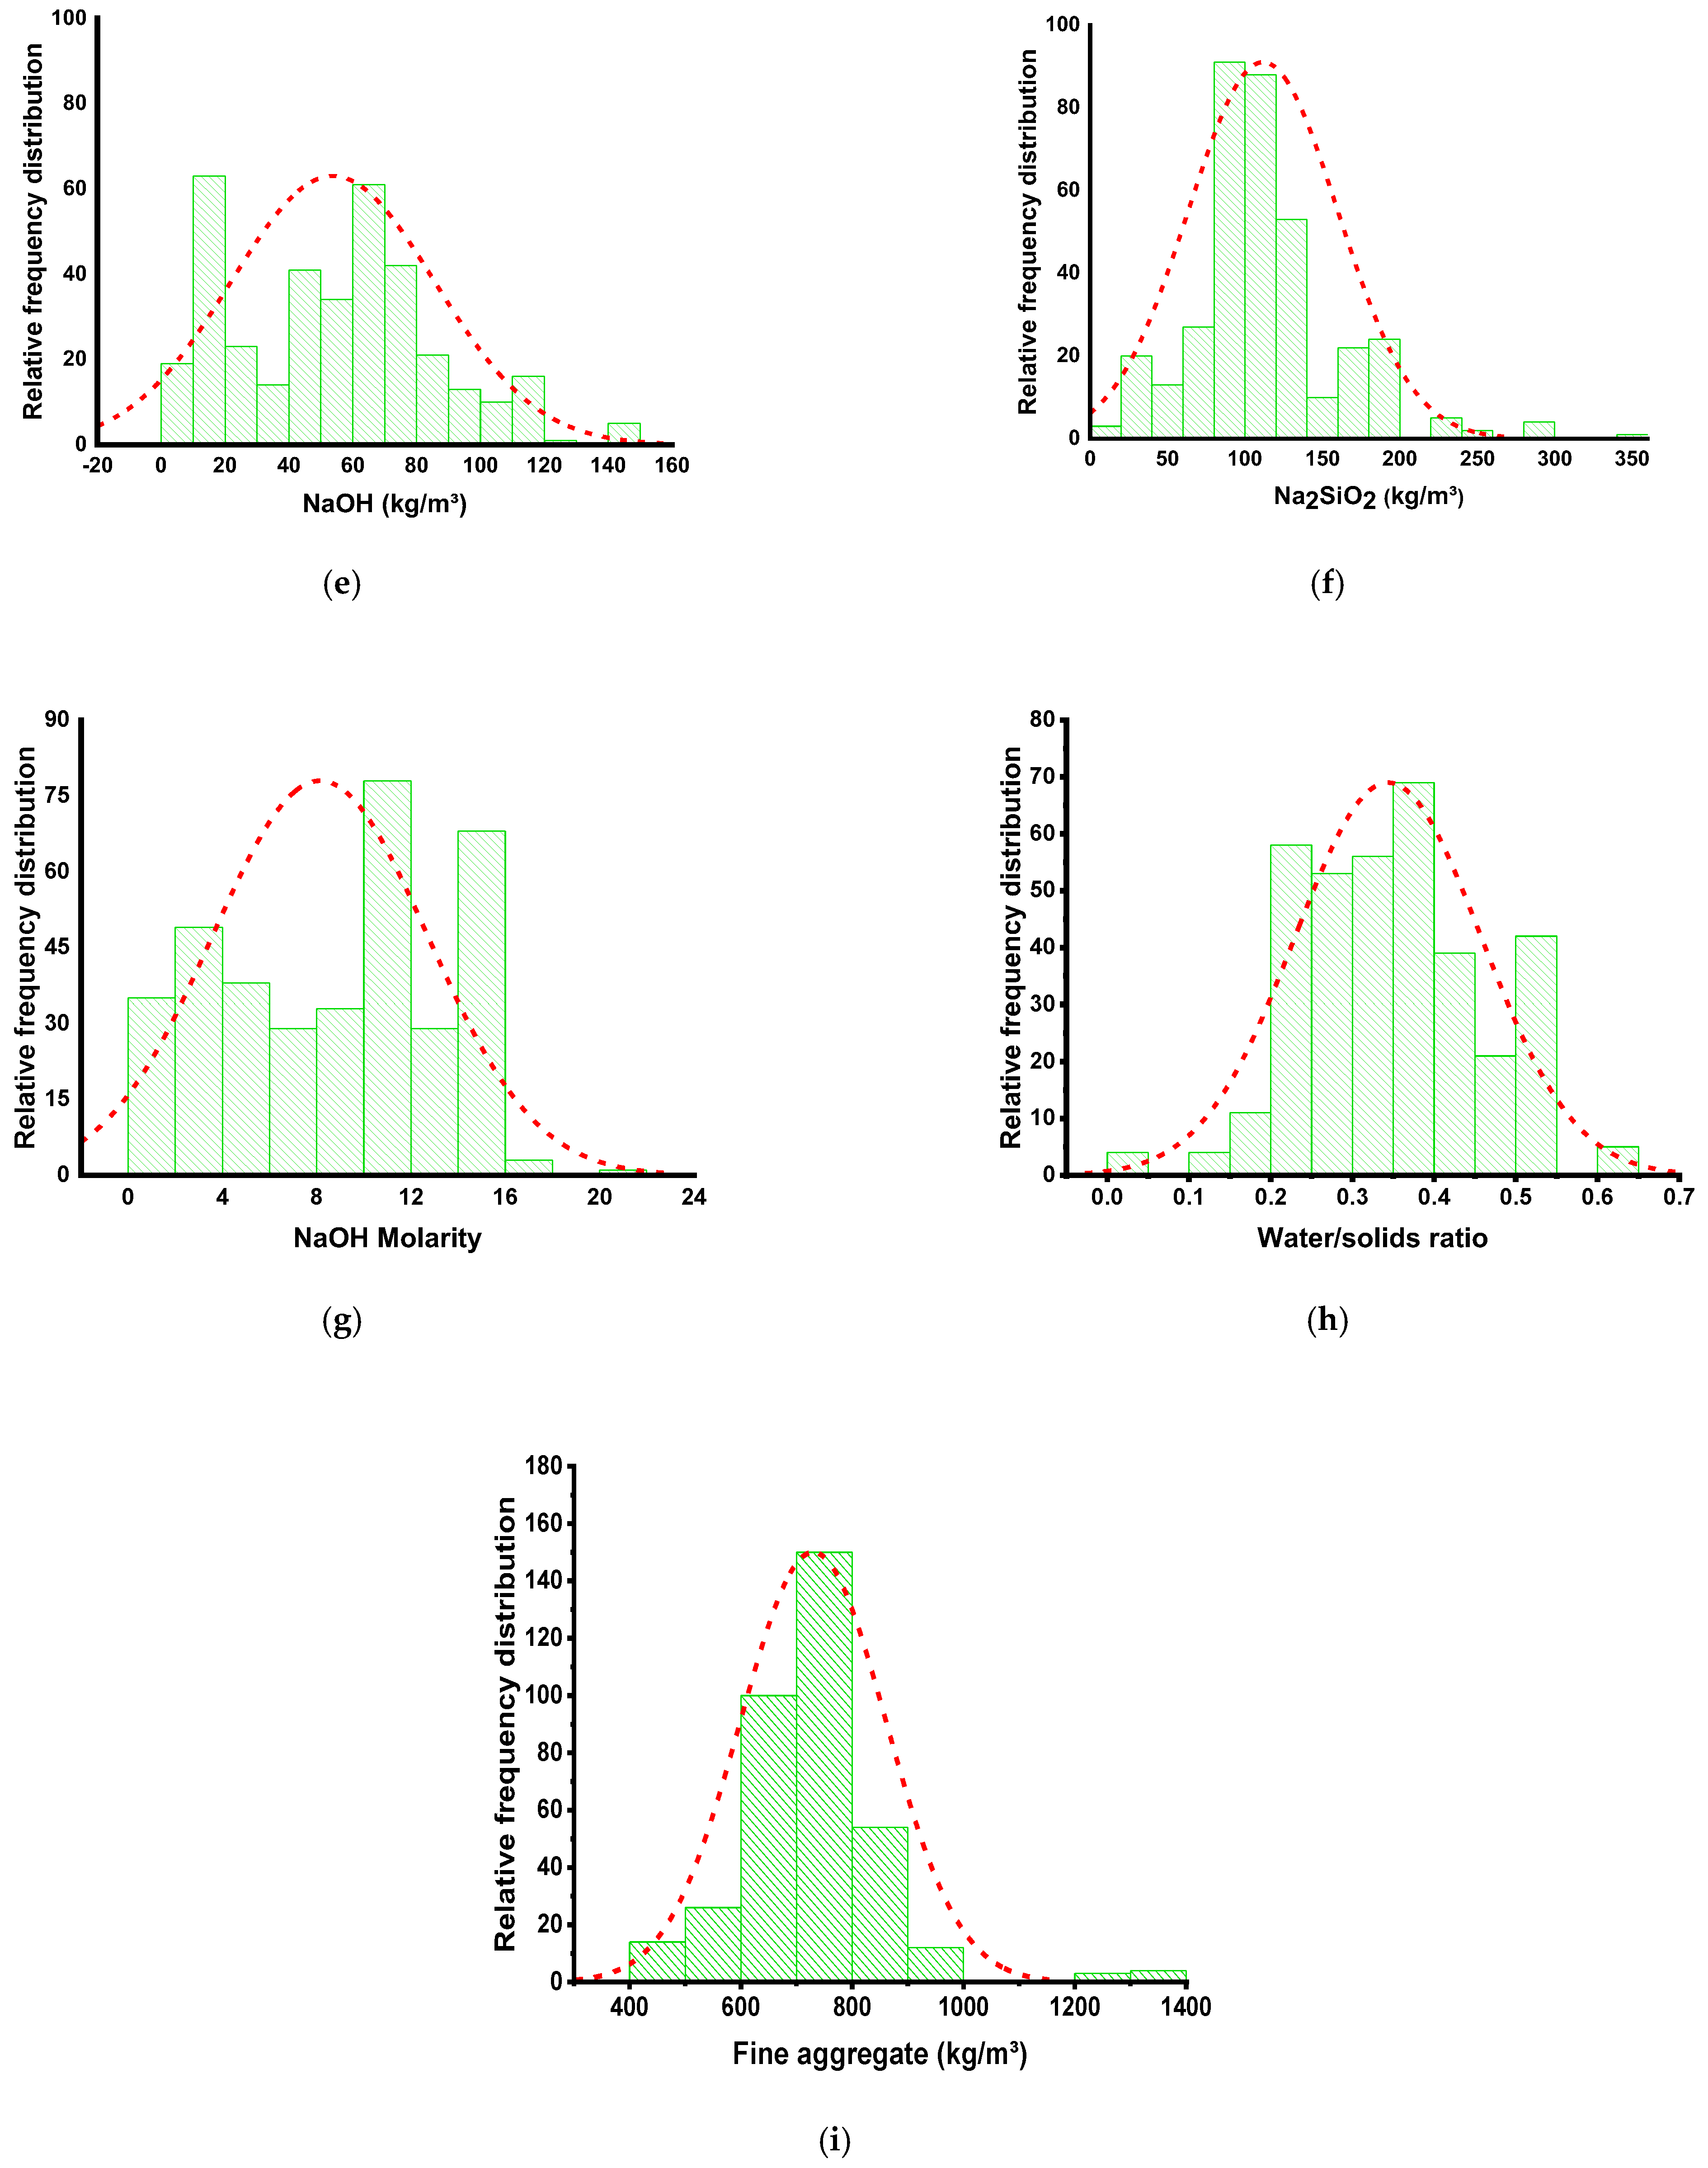
2.1. Data Retrieval and Analysis
2.2. Analysis of Techniques Employed
2.2.1. Decision Tree ML Technique
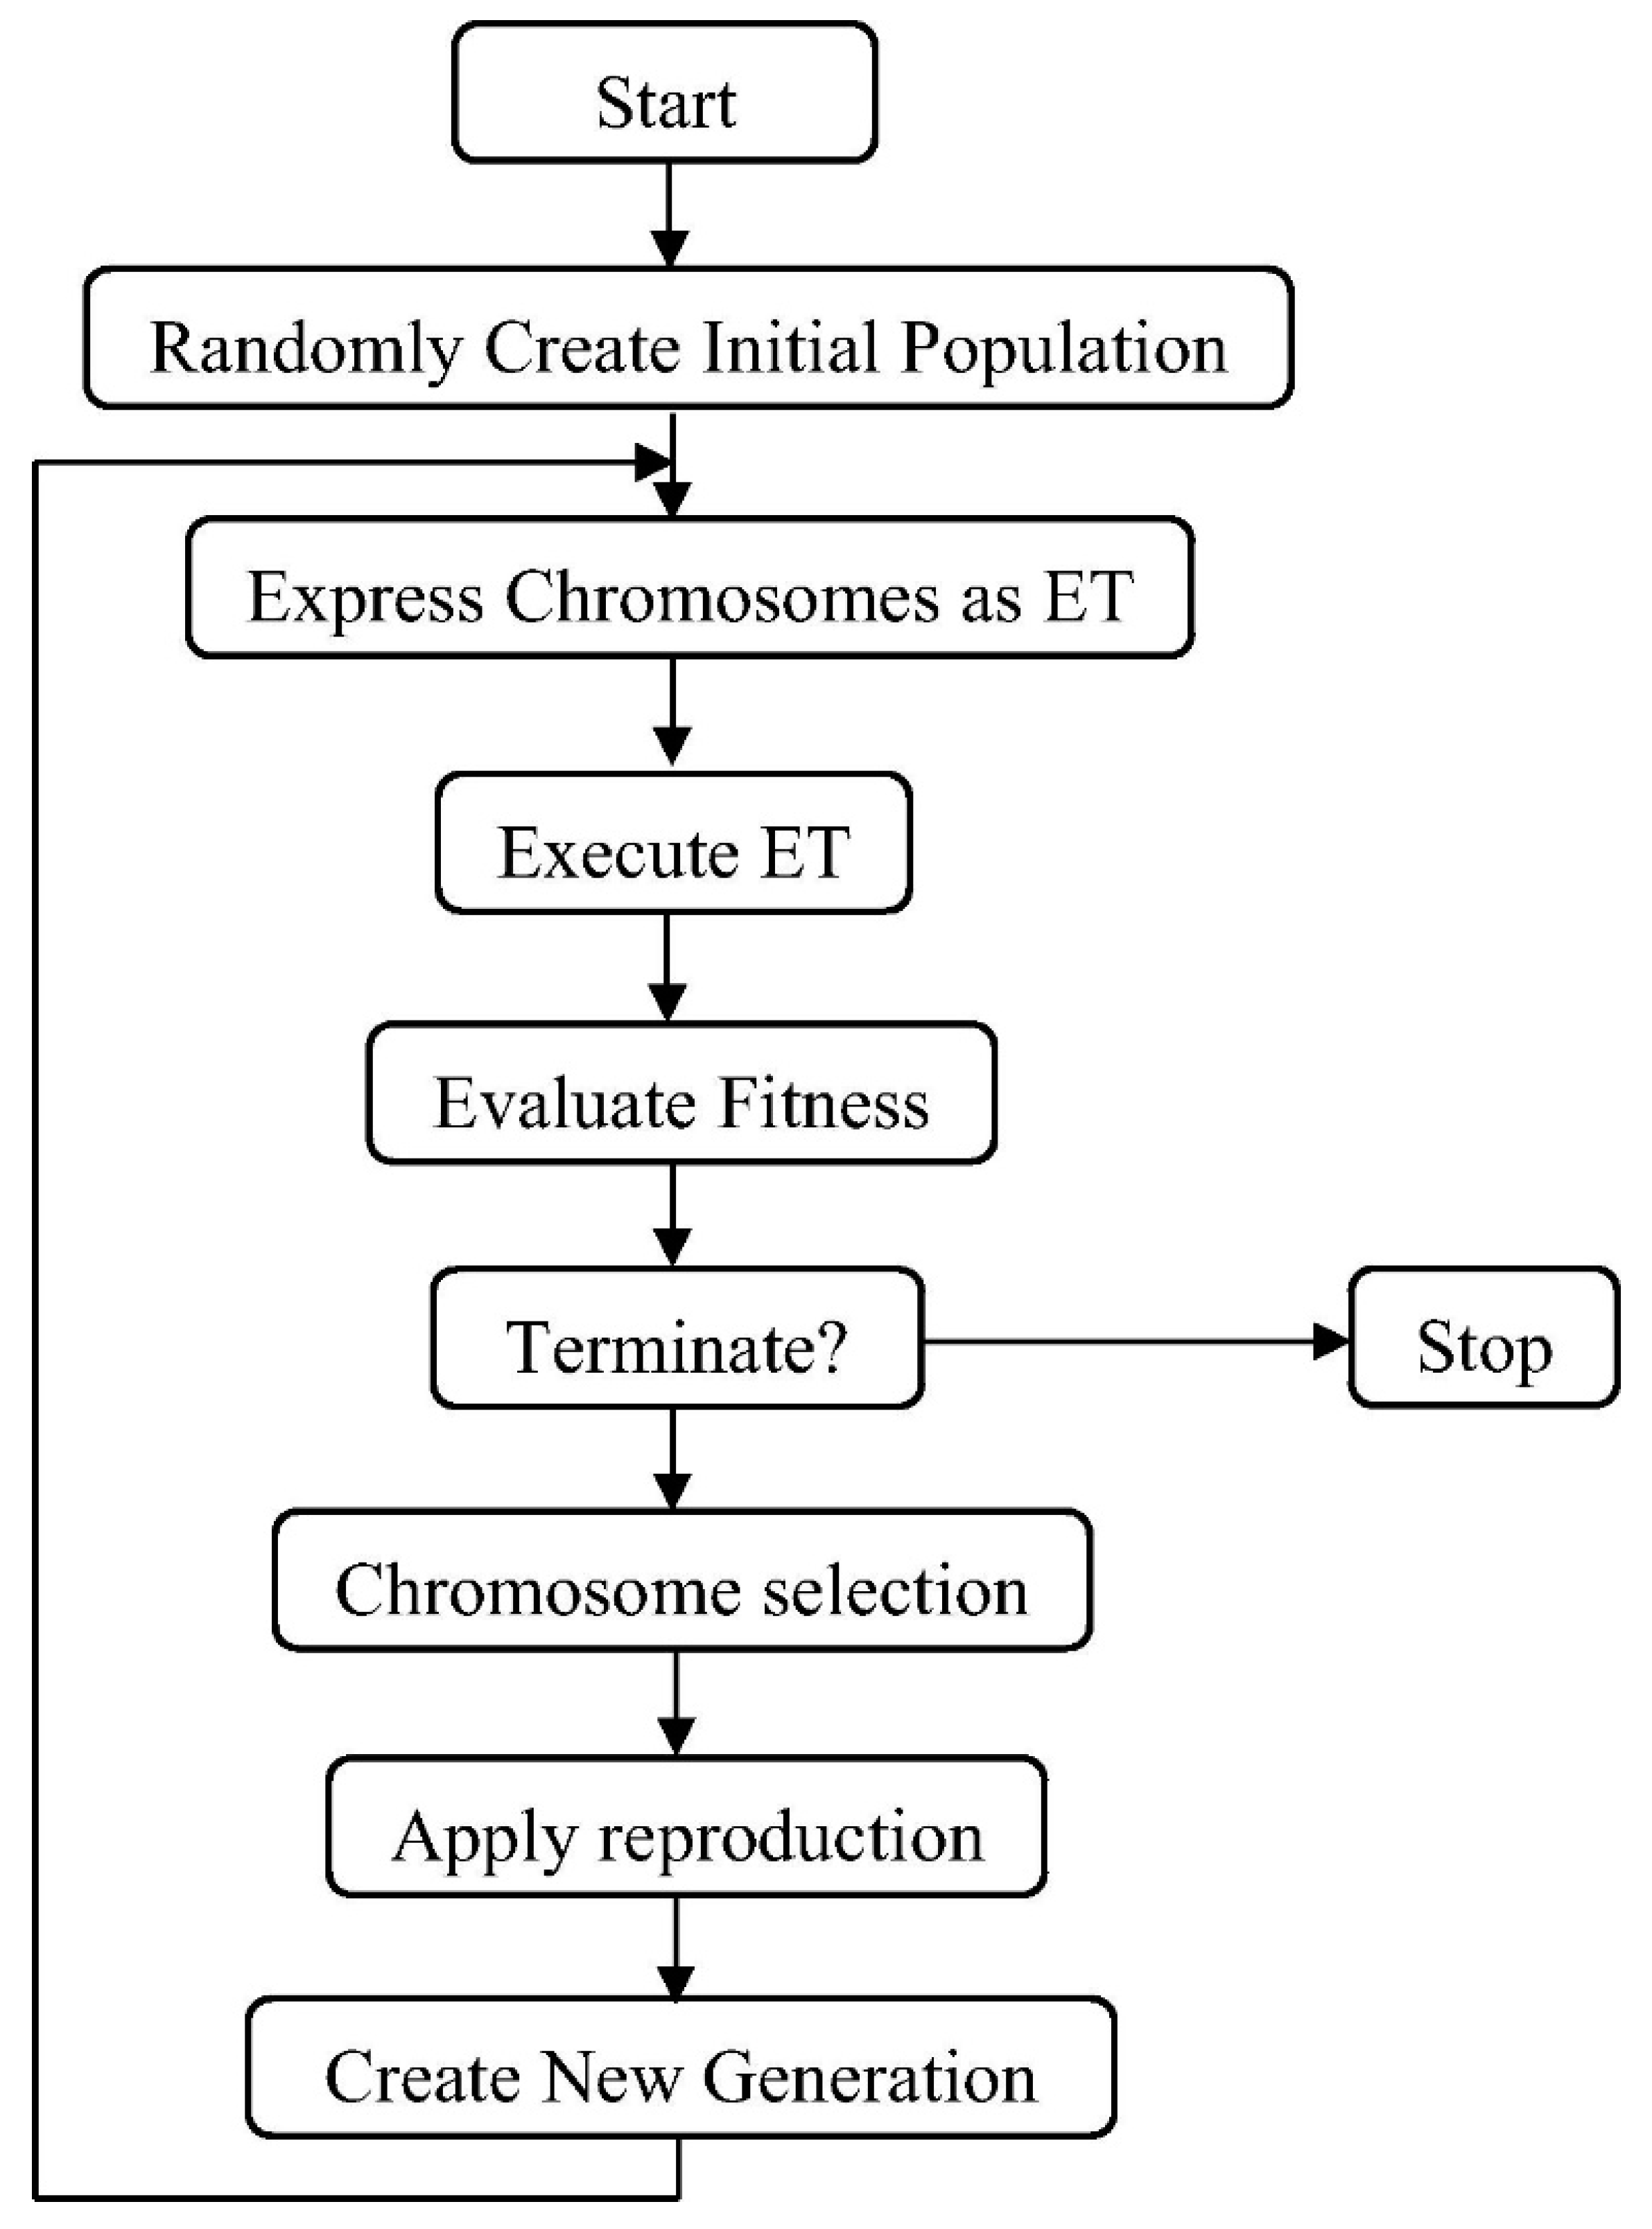
2.2.2. Gene Expression Programming Technique
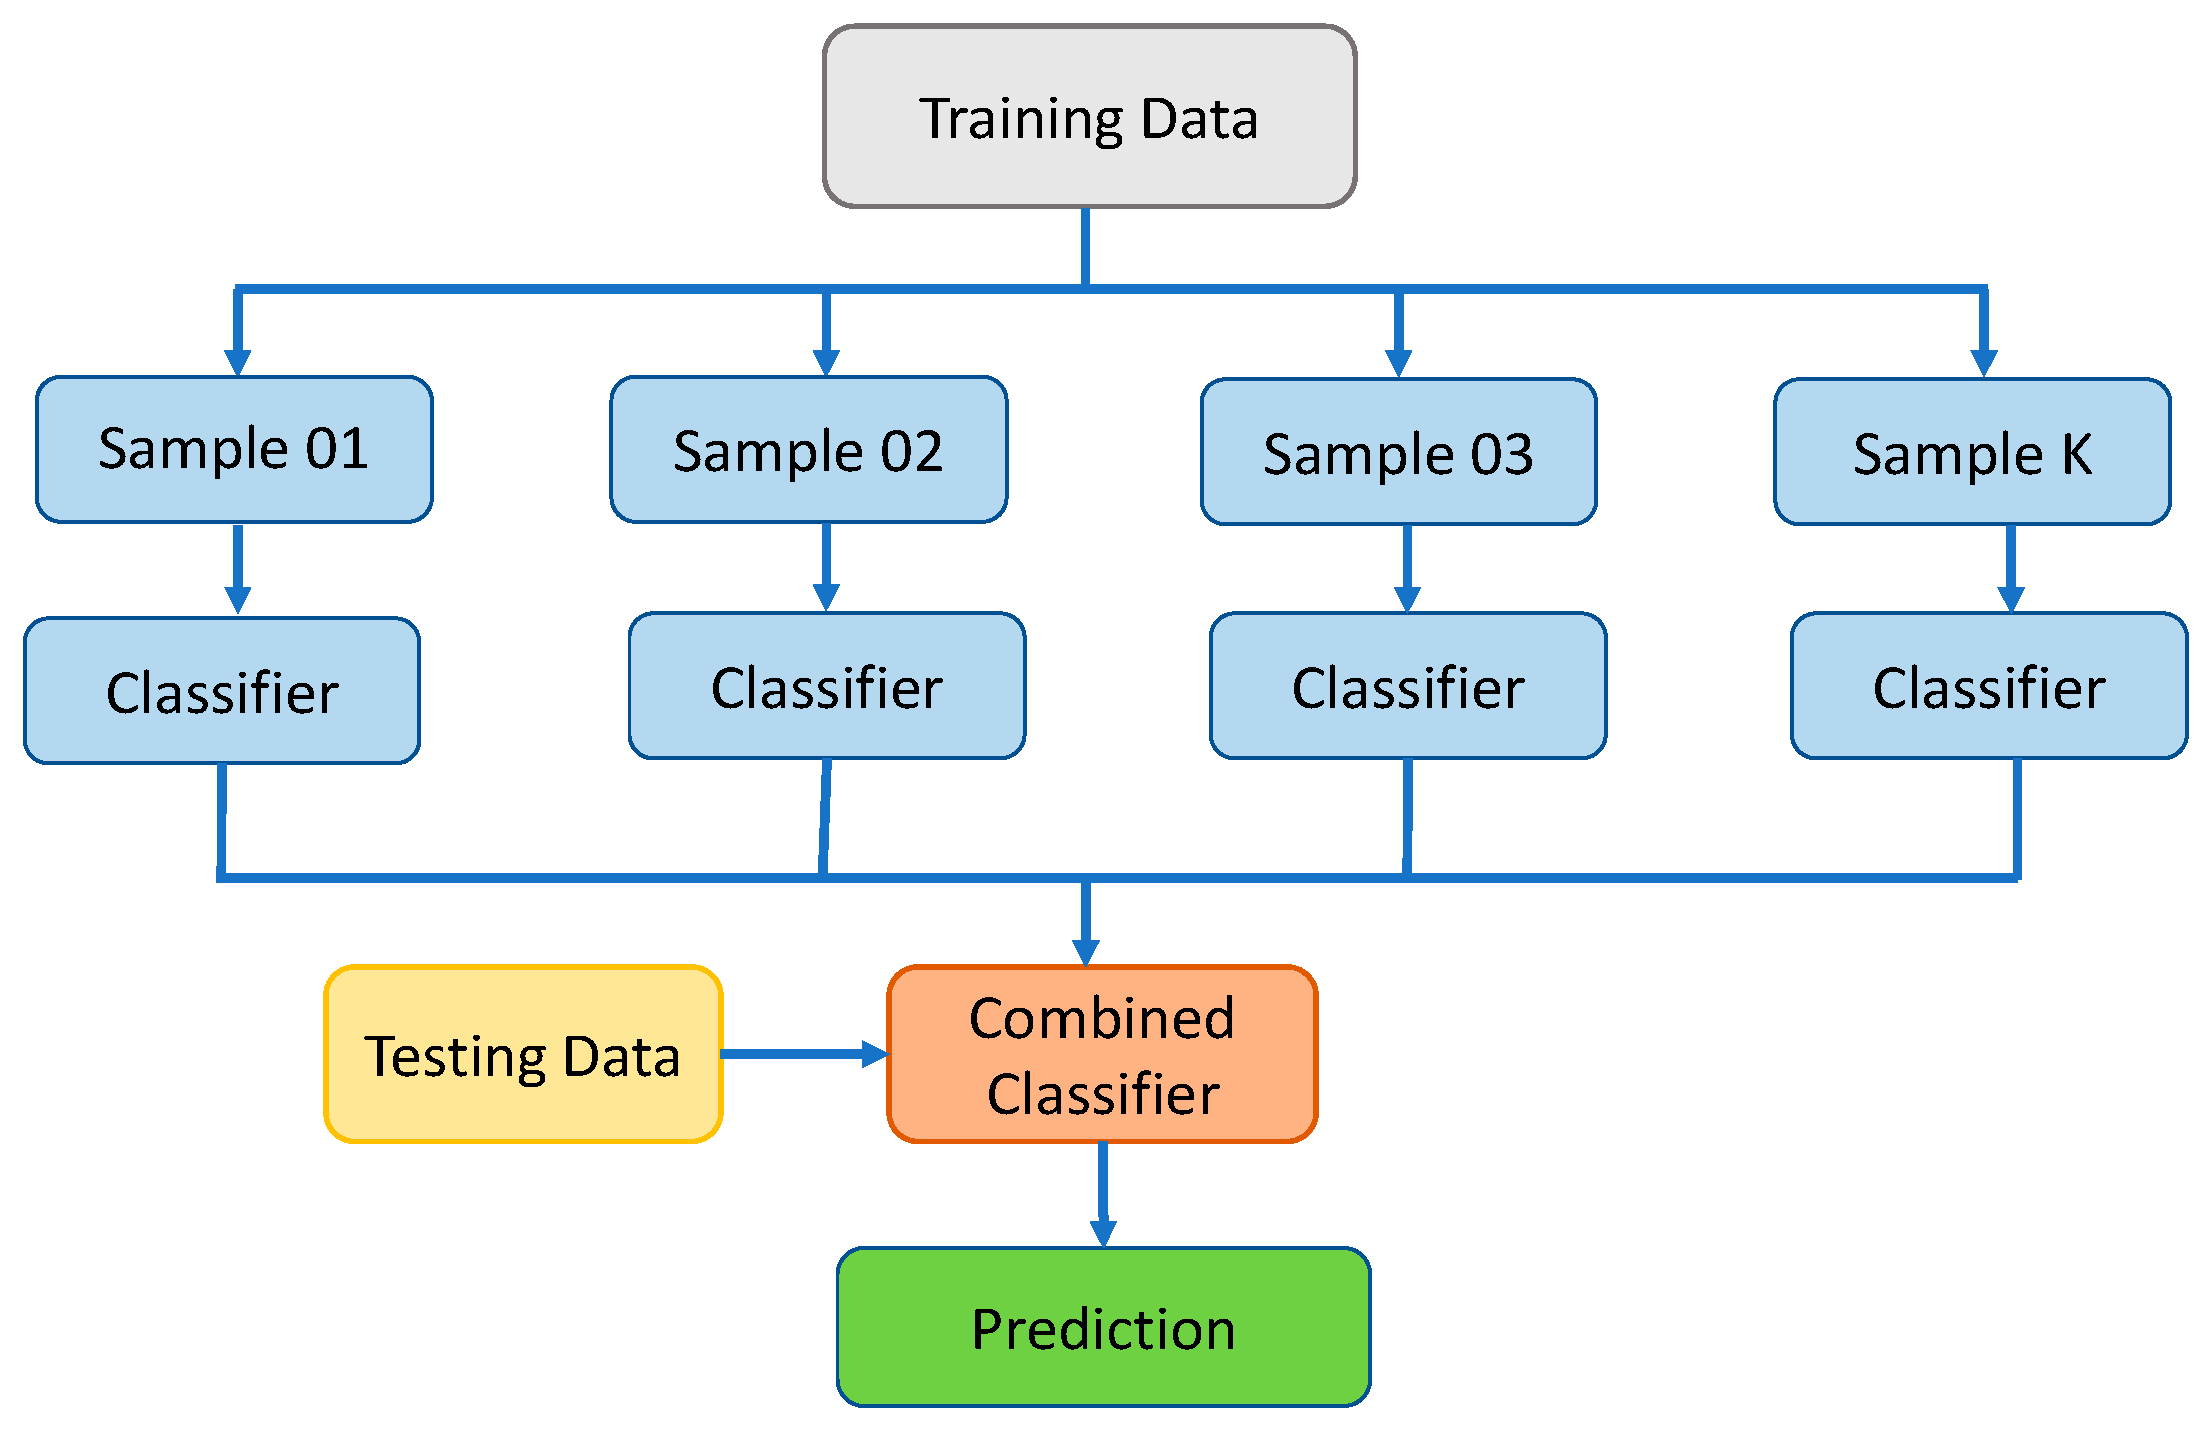
2.2.3. Bagging Regressor Approach
2.2.4. Random Forest (RF) Technique
3. Analysis of Results
3.1. Model Result of the Decision Tree
3.2. Gene Expression Programming Model
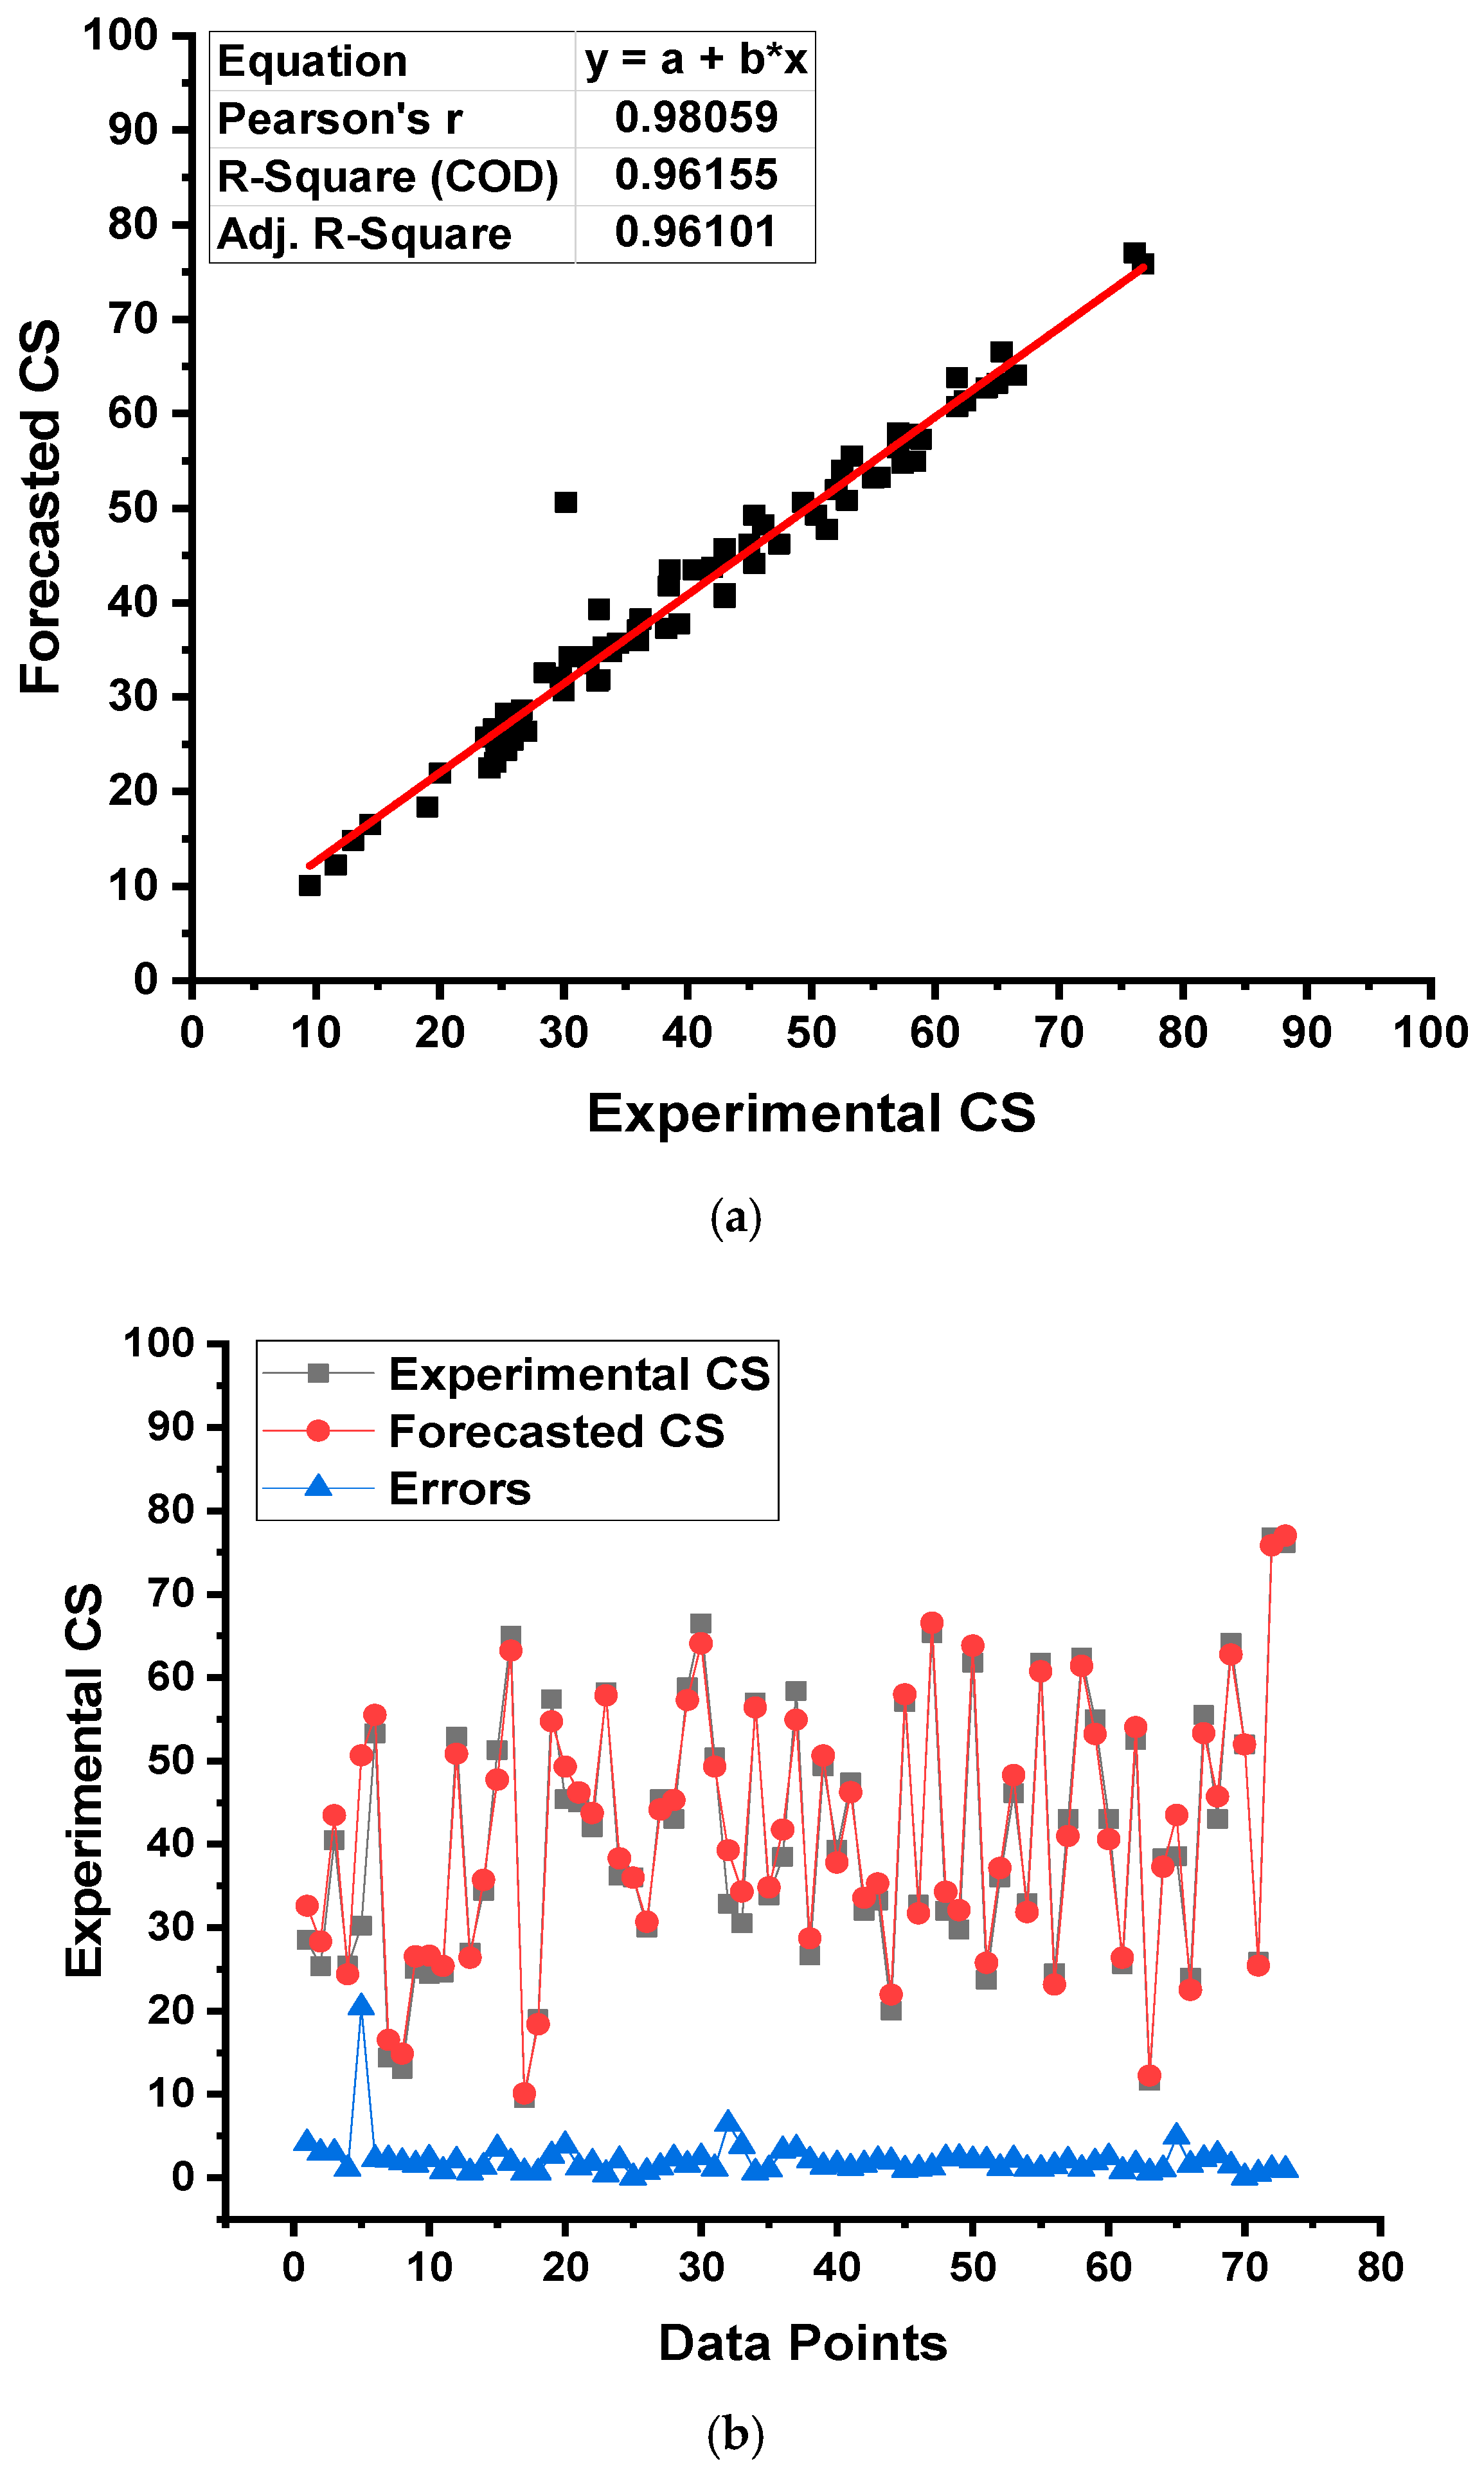
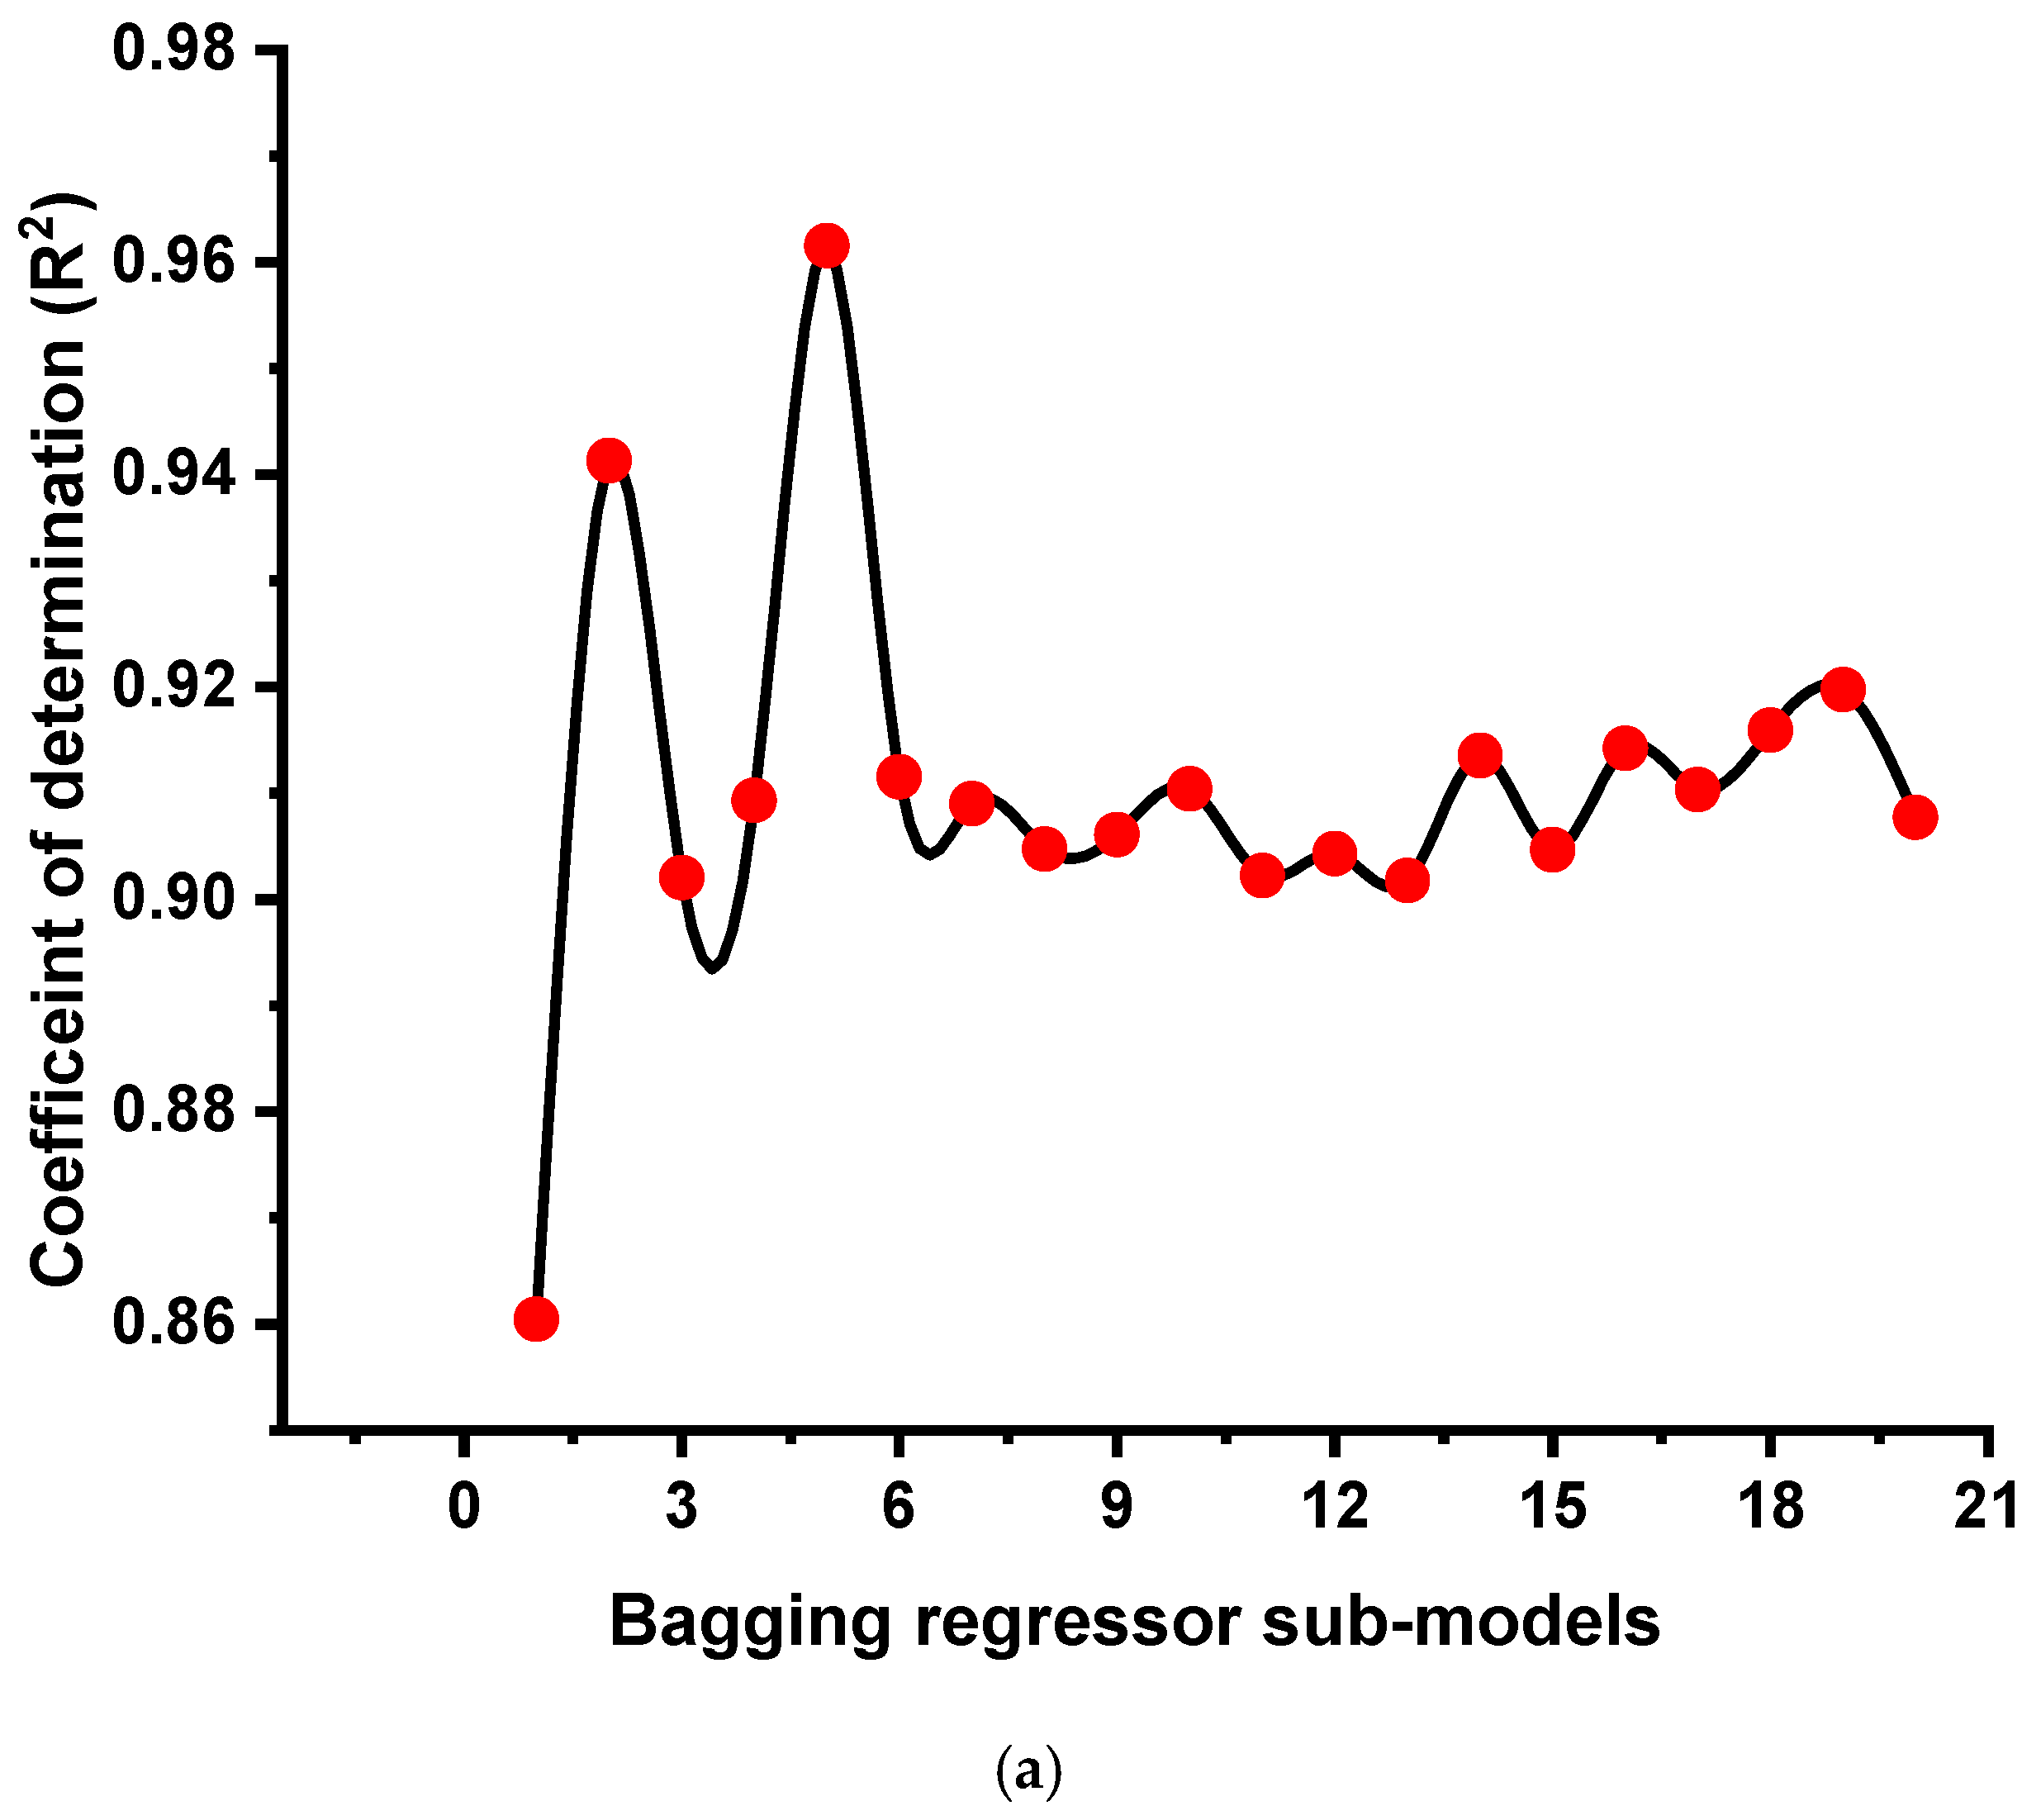
3.3. Bagging Regressor Model
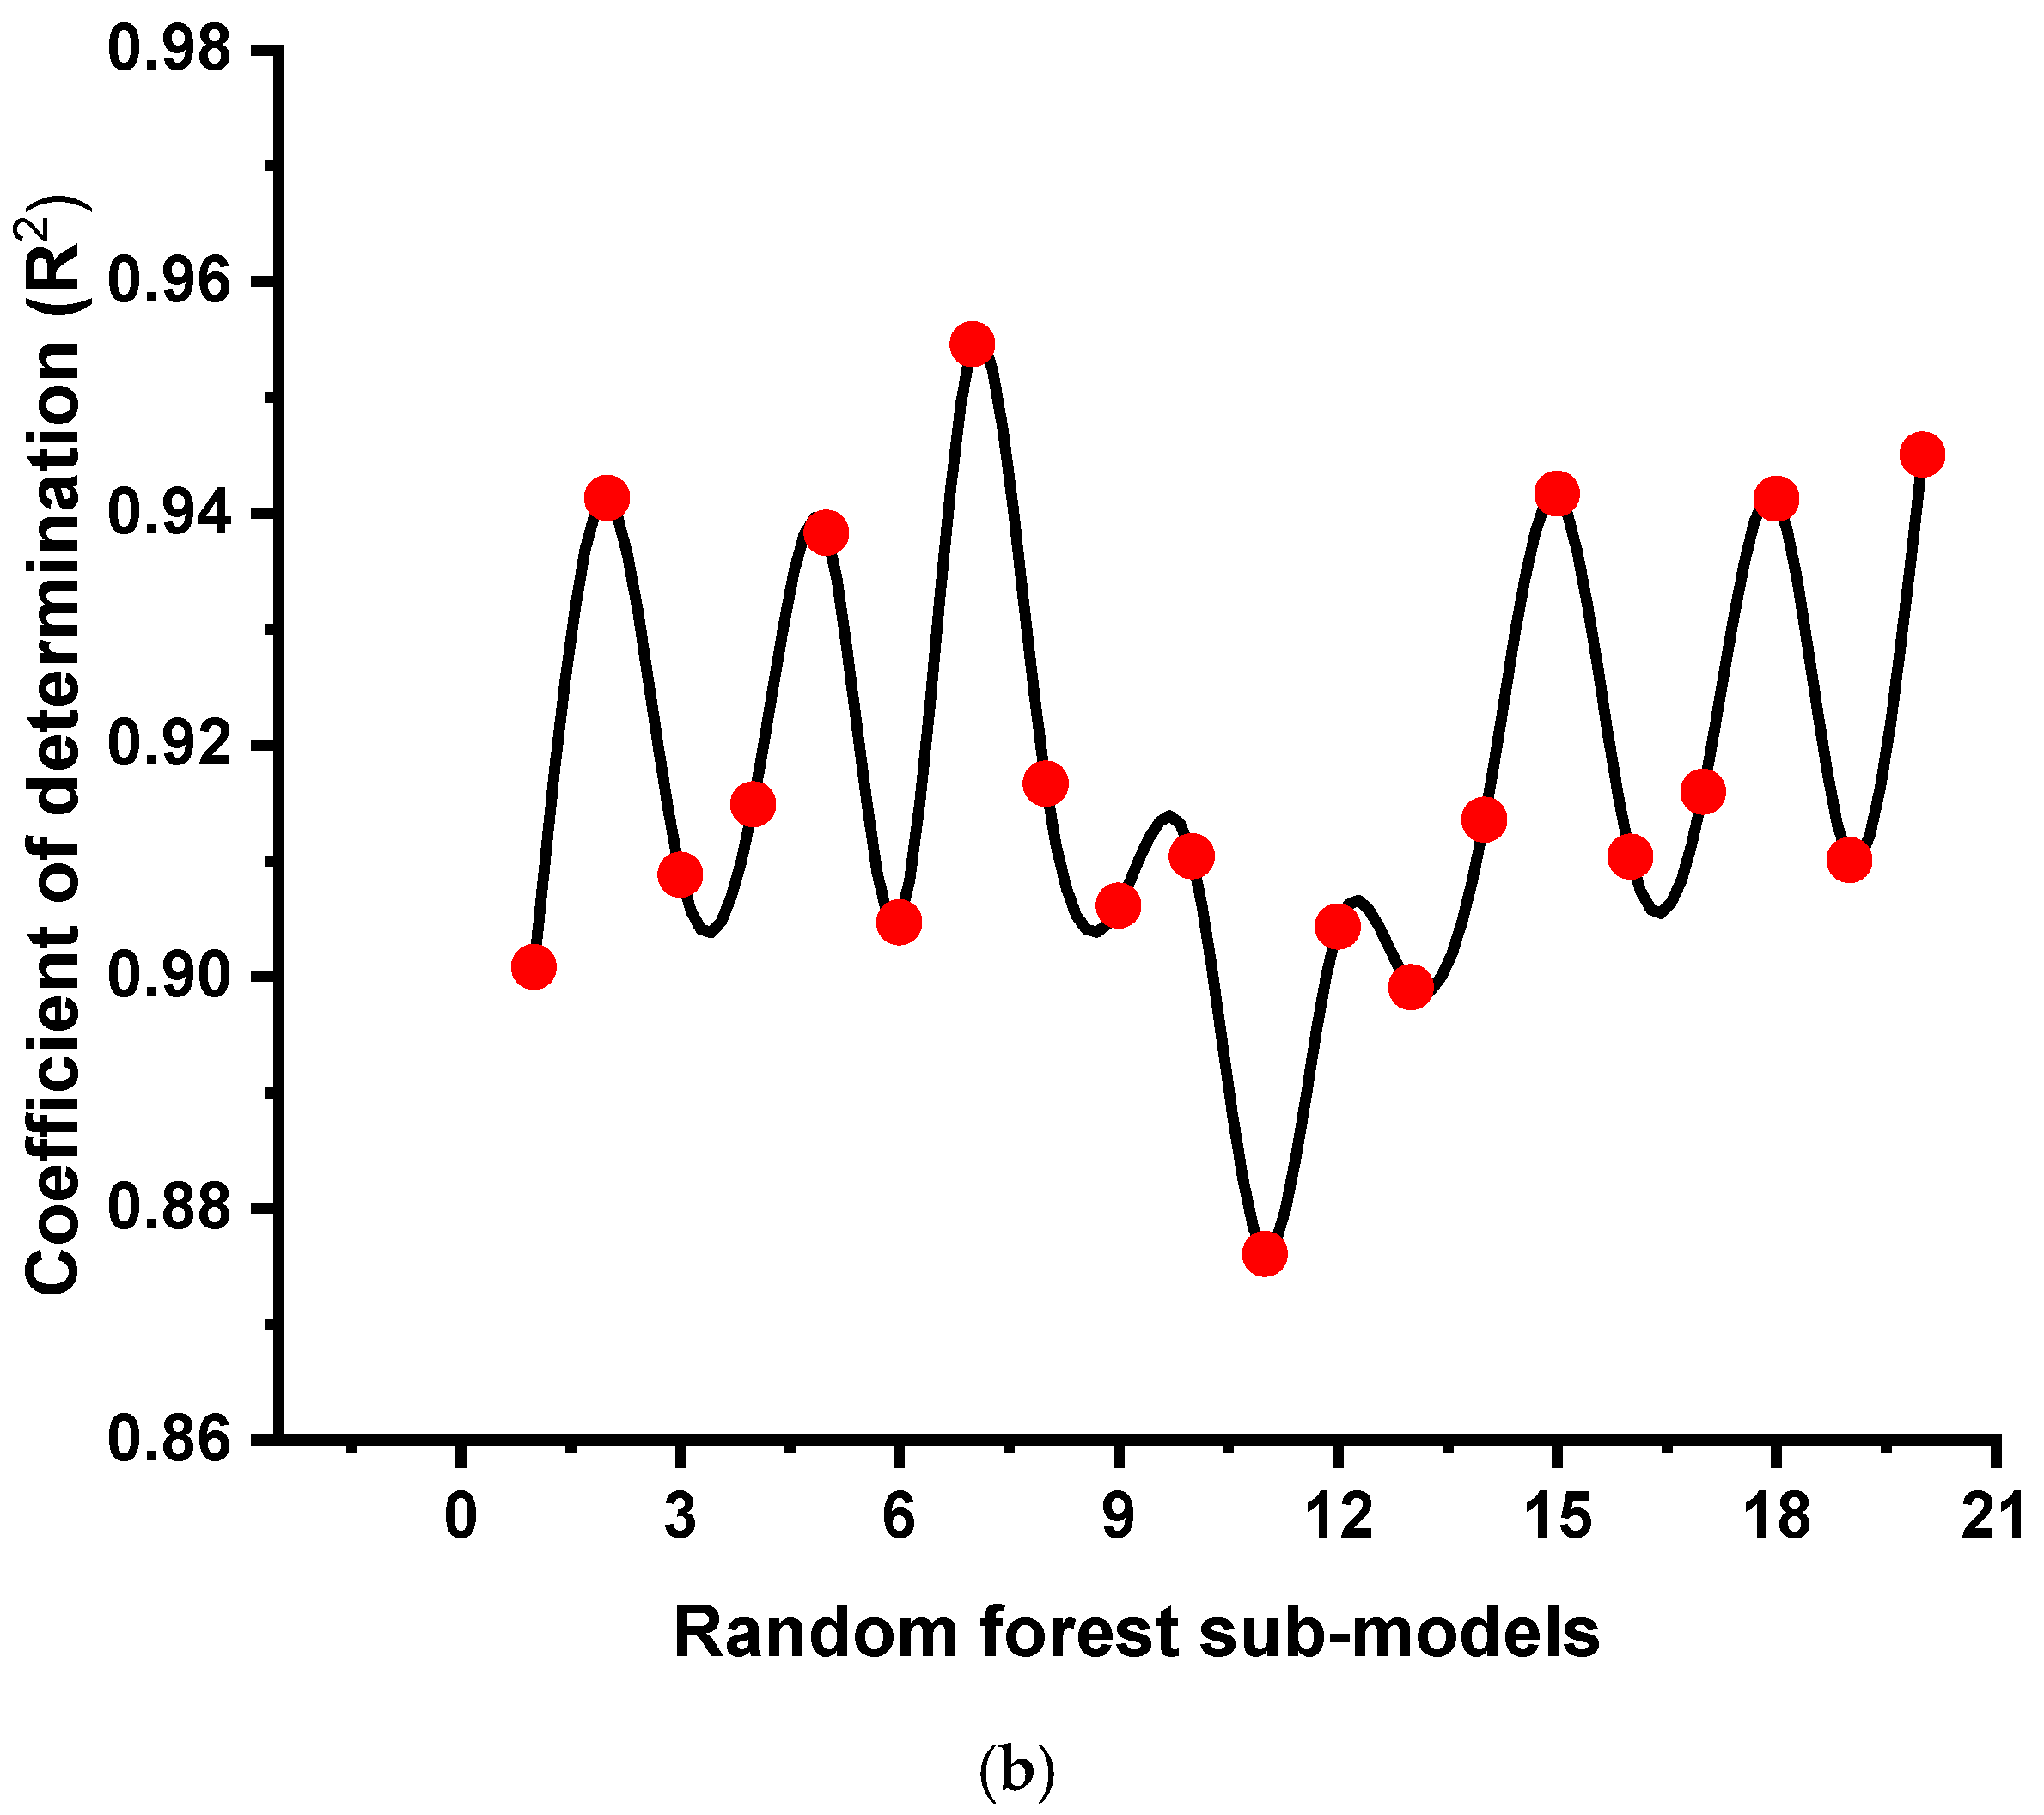
3.4. Random Forest Model
4. Validation
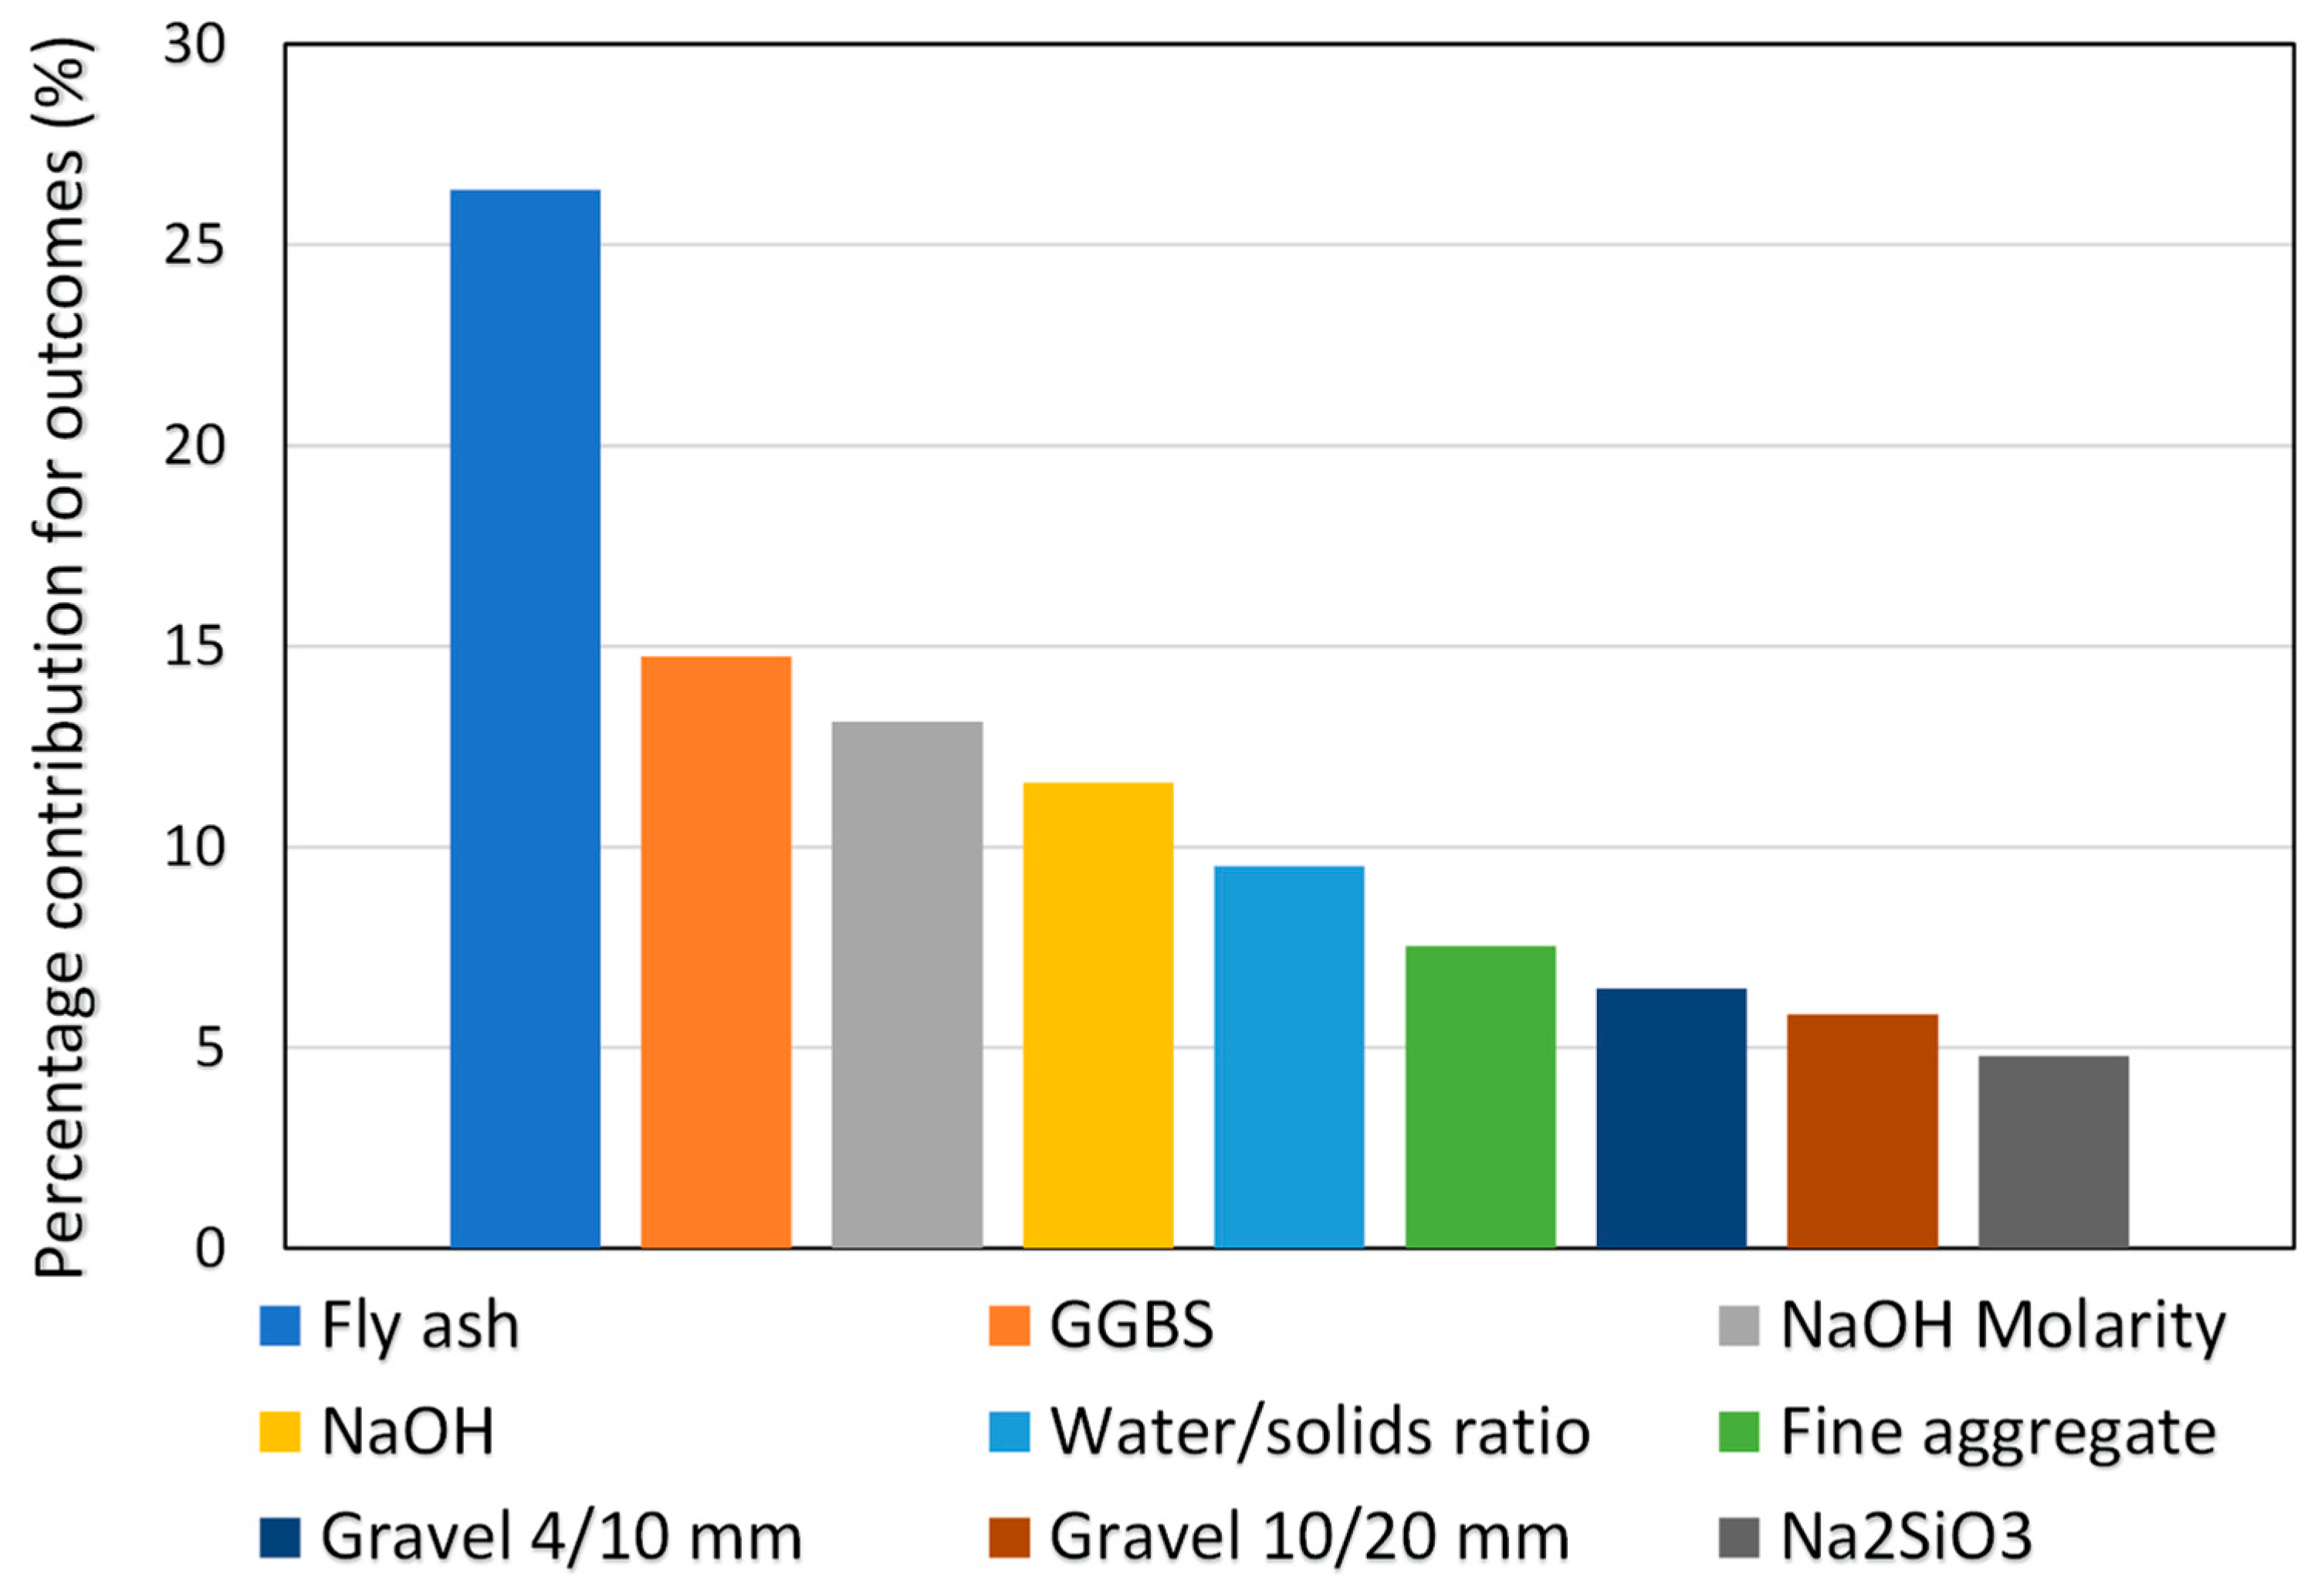
5. Sensitivity Analysis
6. Discussions
7. Conclusions
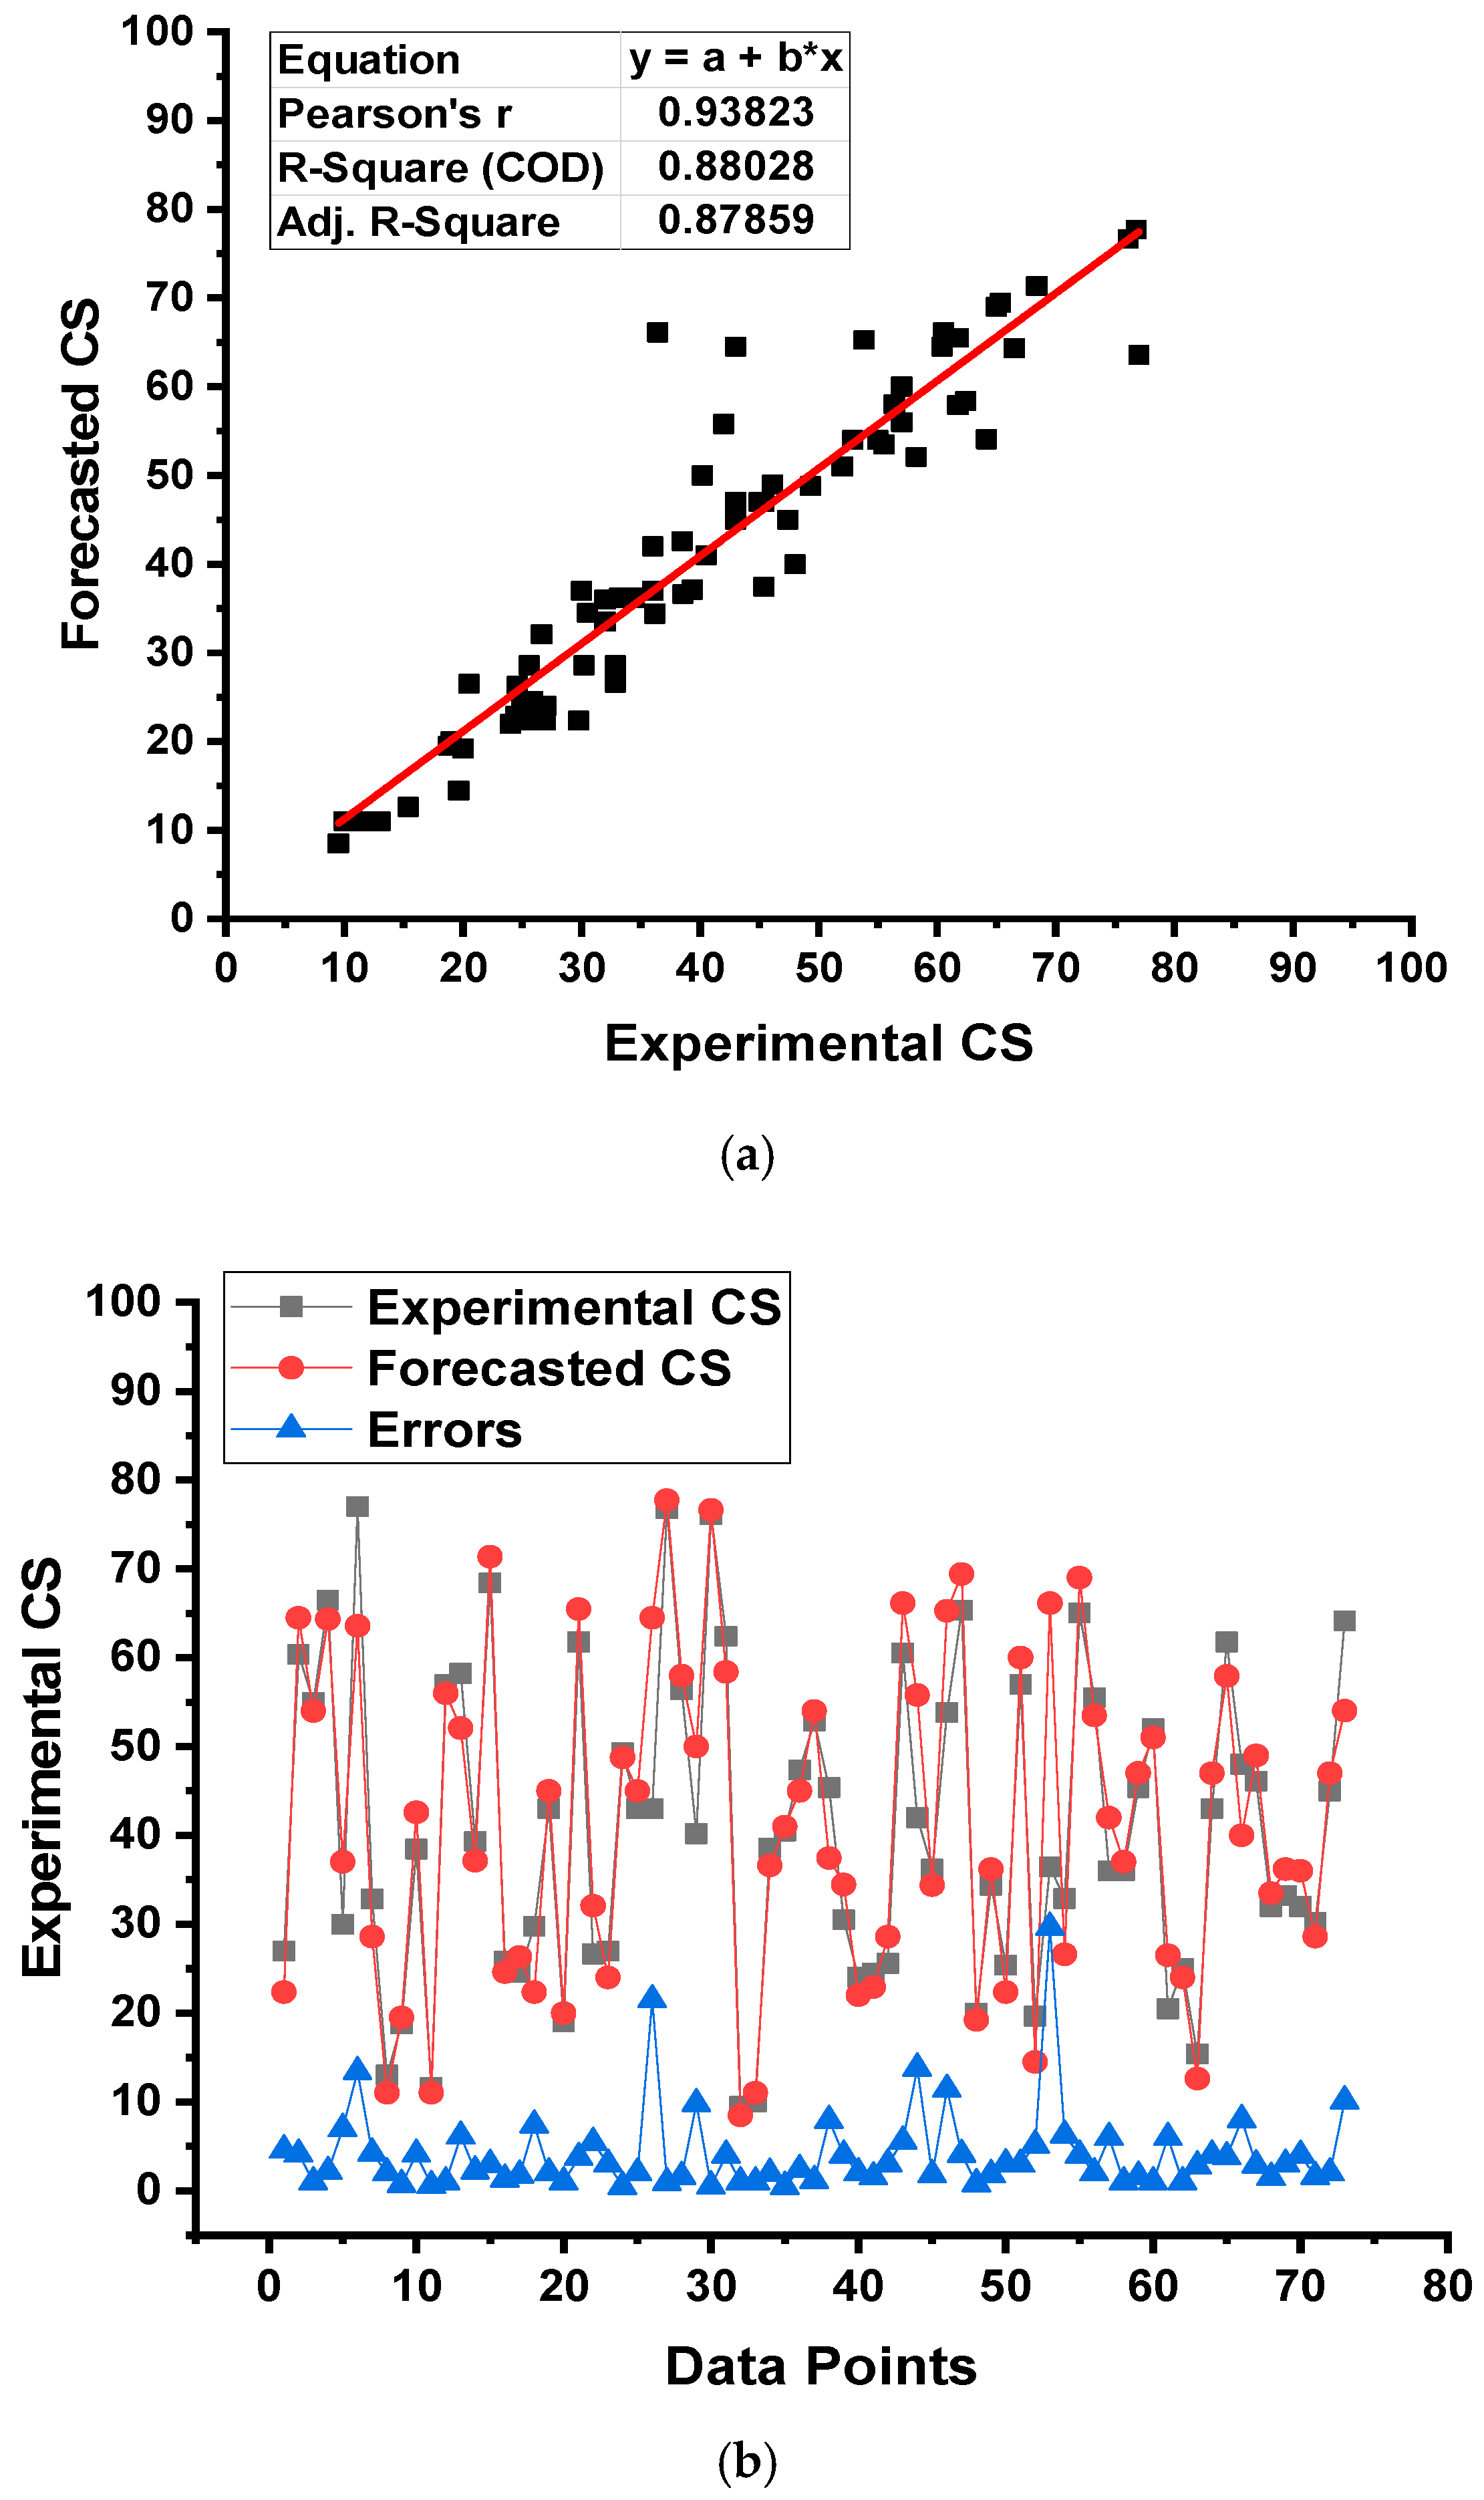
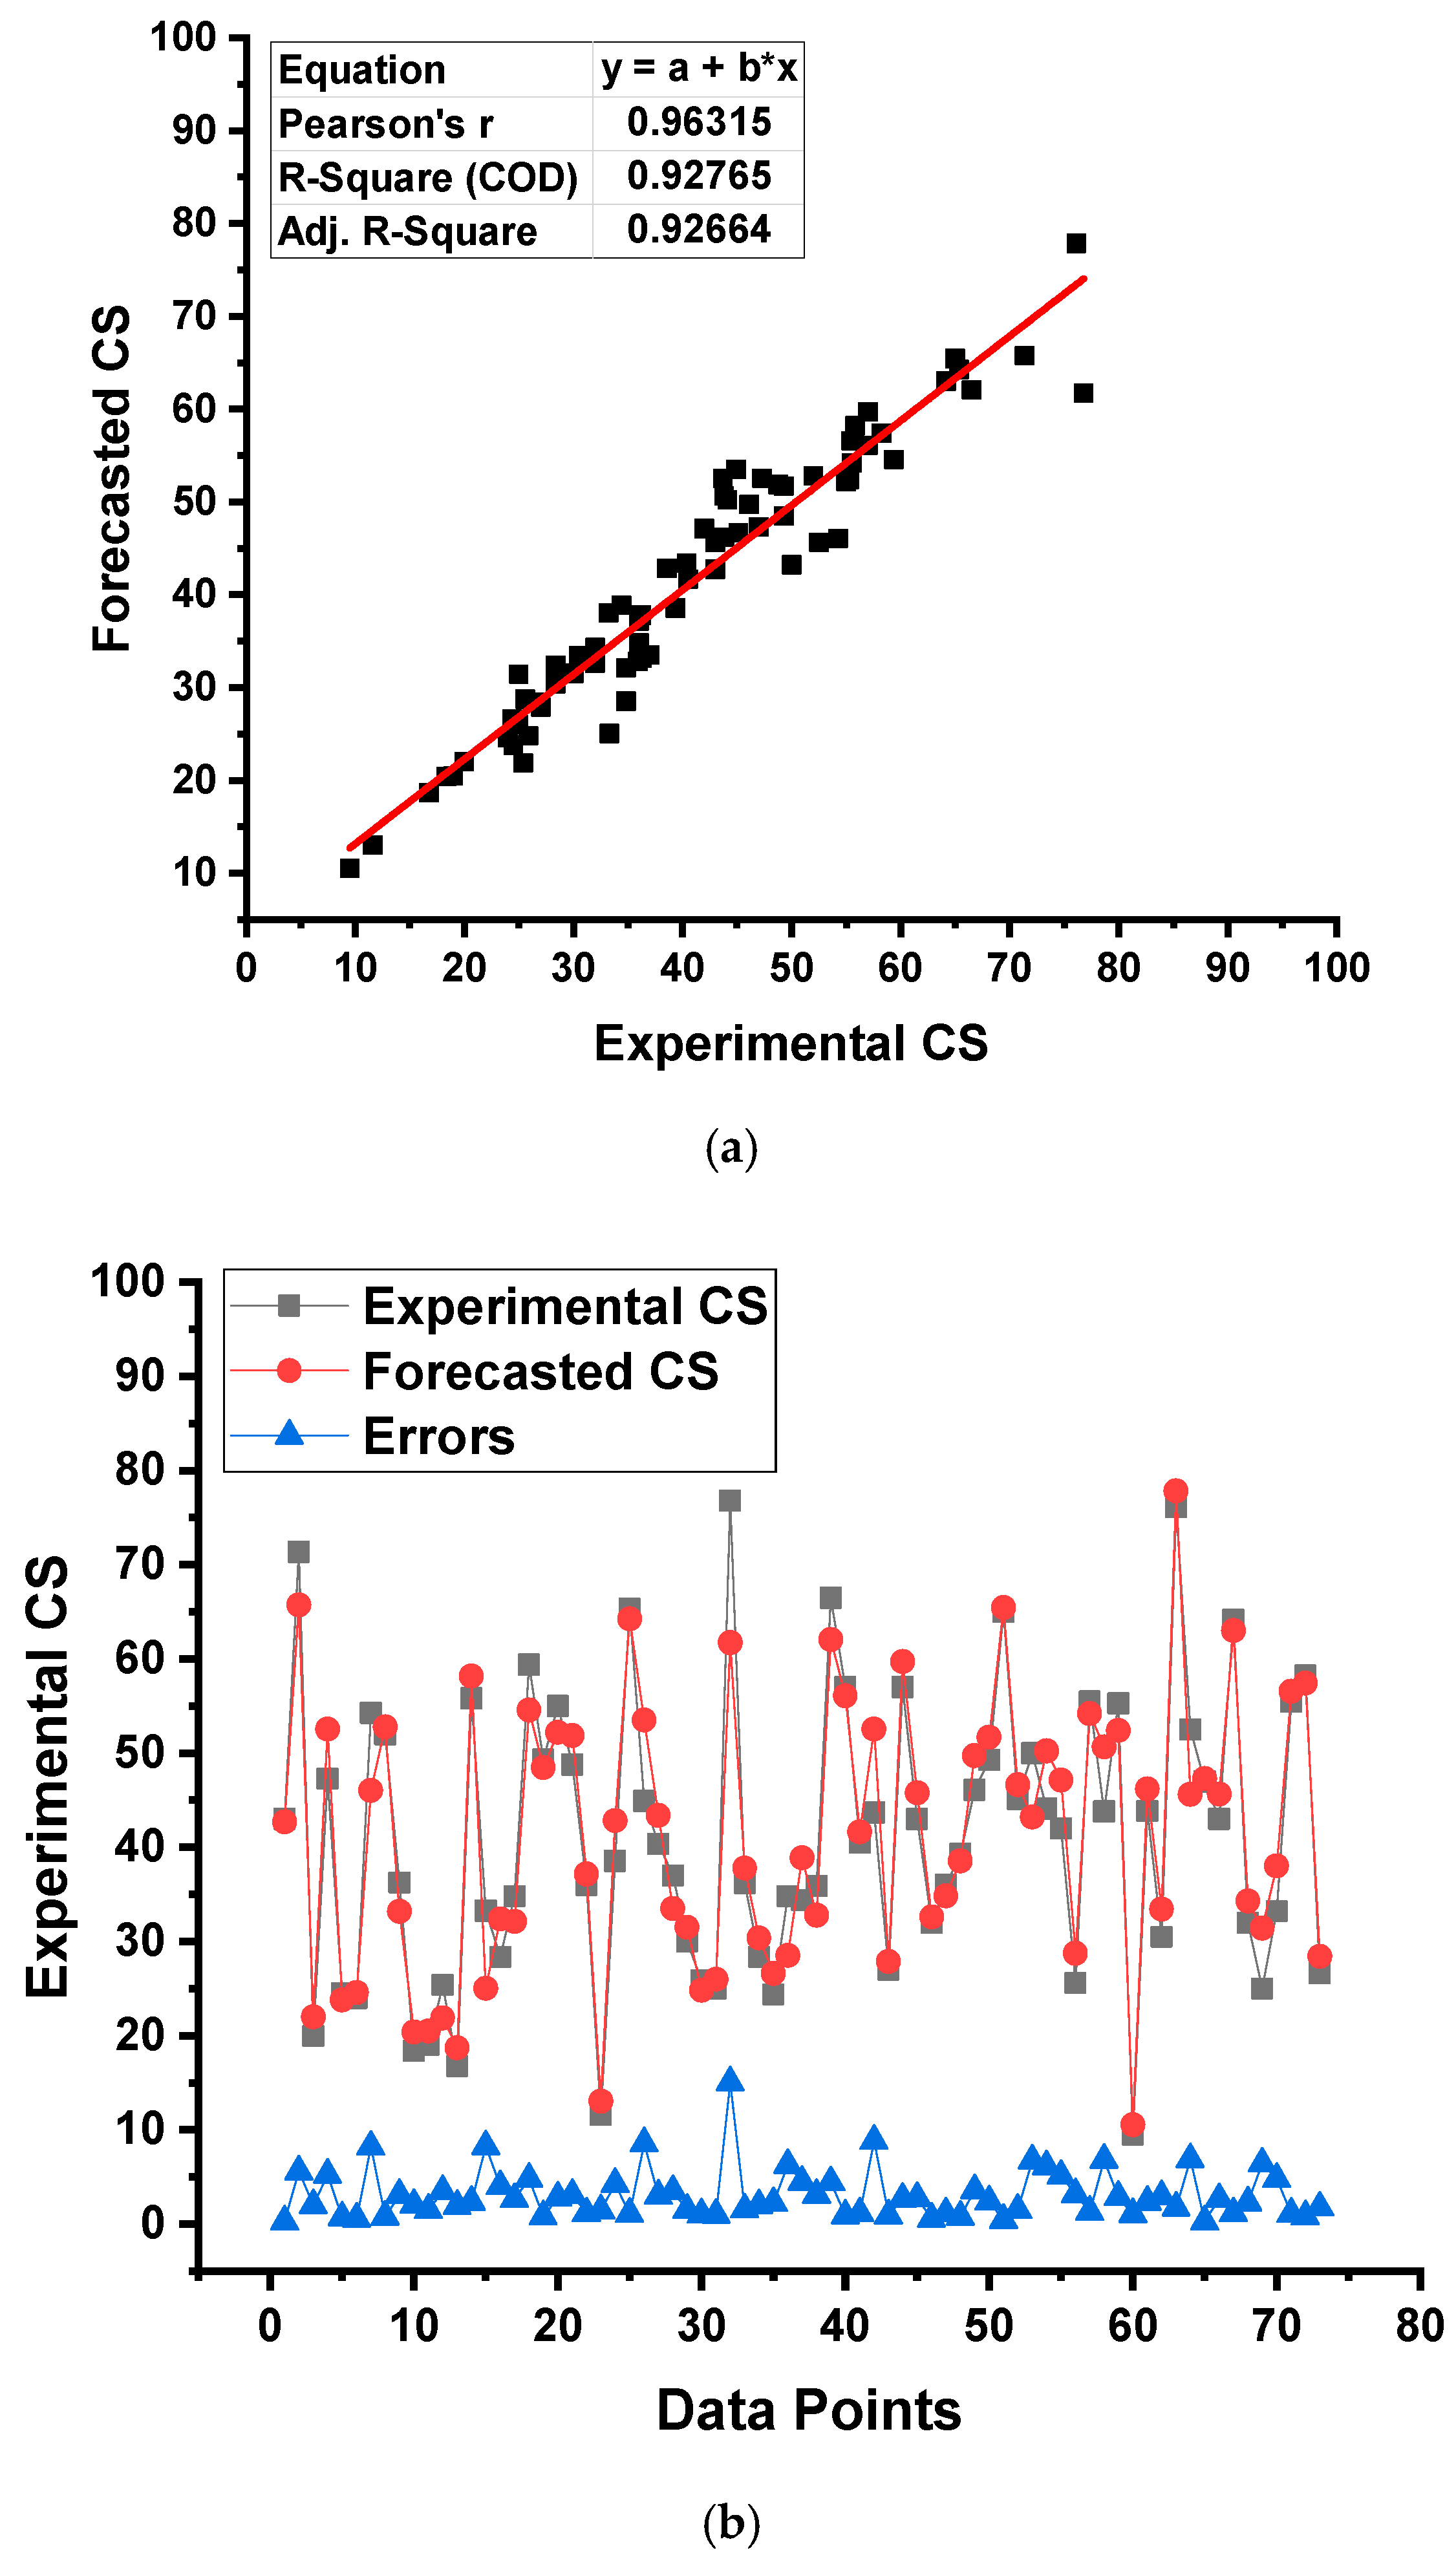
- Ensembled SML approaches were more accurate than individual SML techniques at predicting the CS of GPC, with the BR model having the best accuracy. The coefficients of determination (R2) were 0.96, 0.95, 0.93, and 0.88 for BR, RF, GEP, and DT models, respectively. All models produced findings within a satisfactory range and had little deviation from the real data.
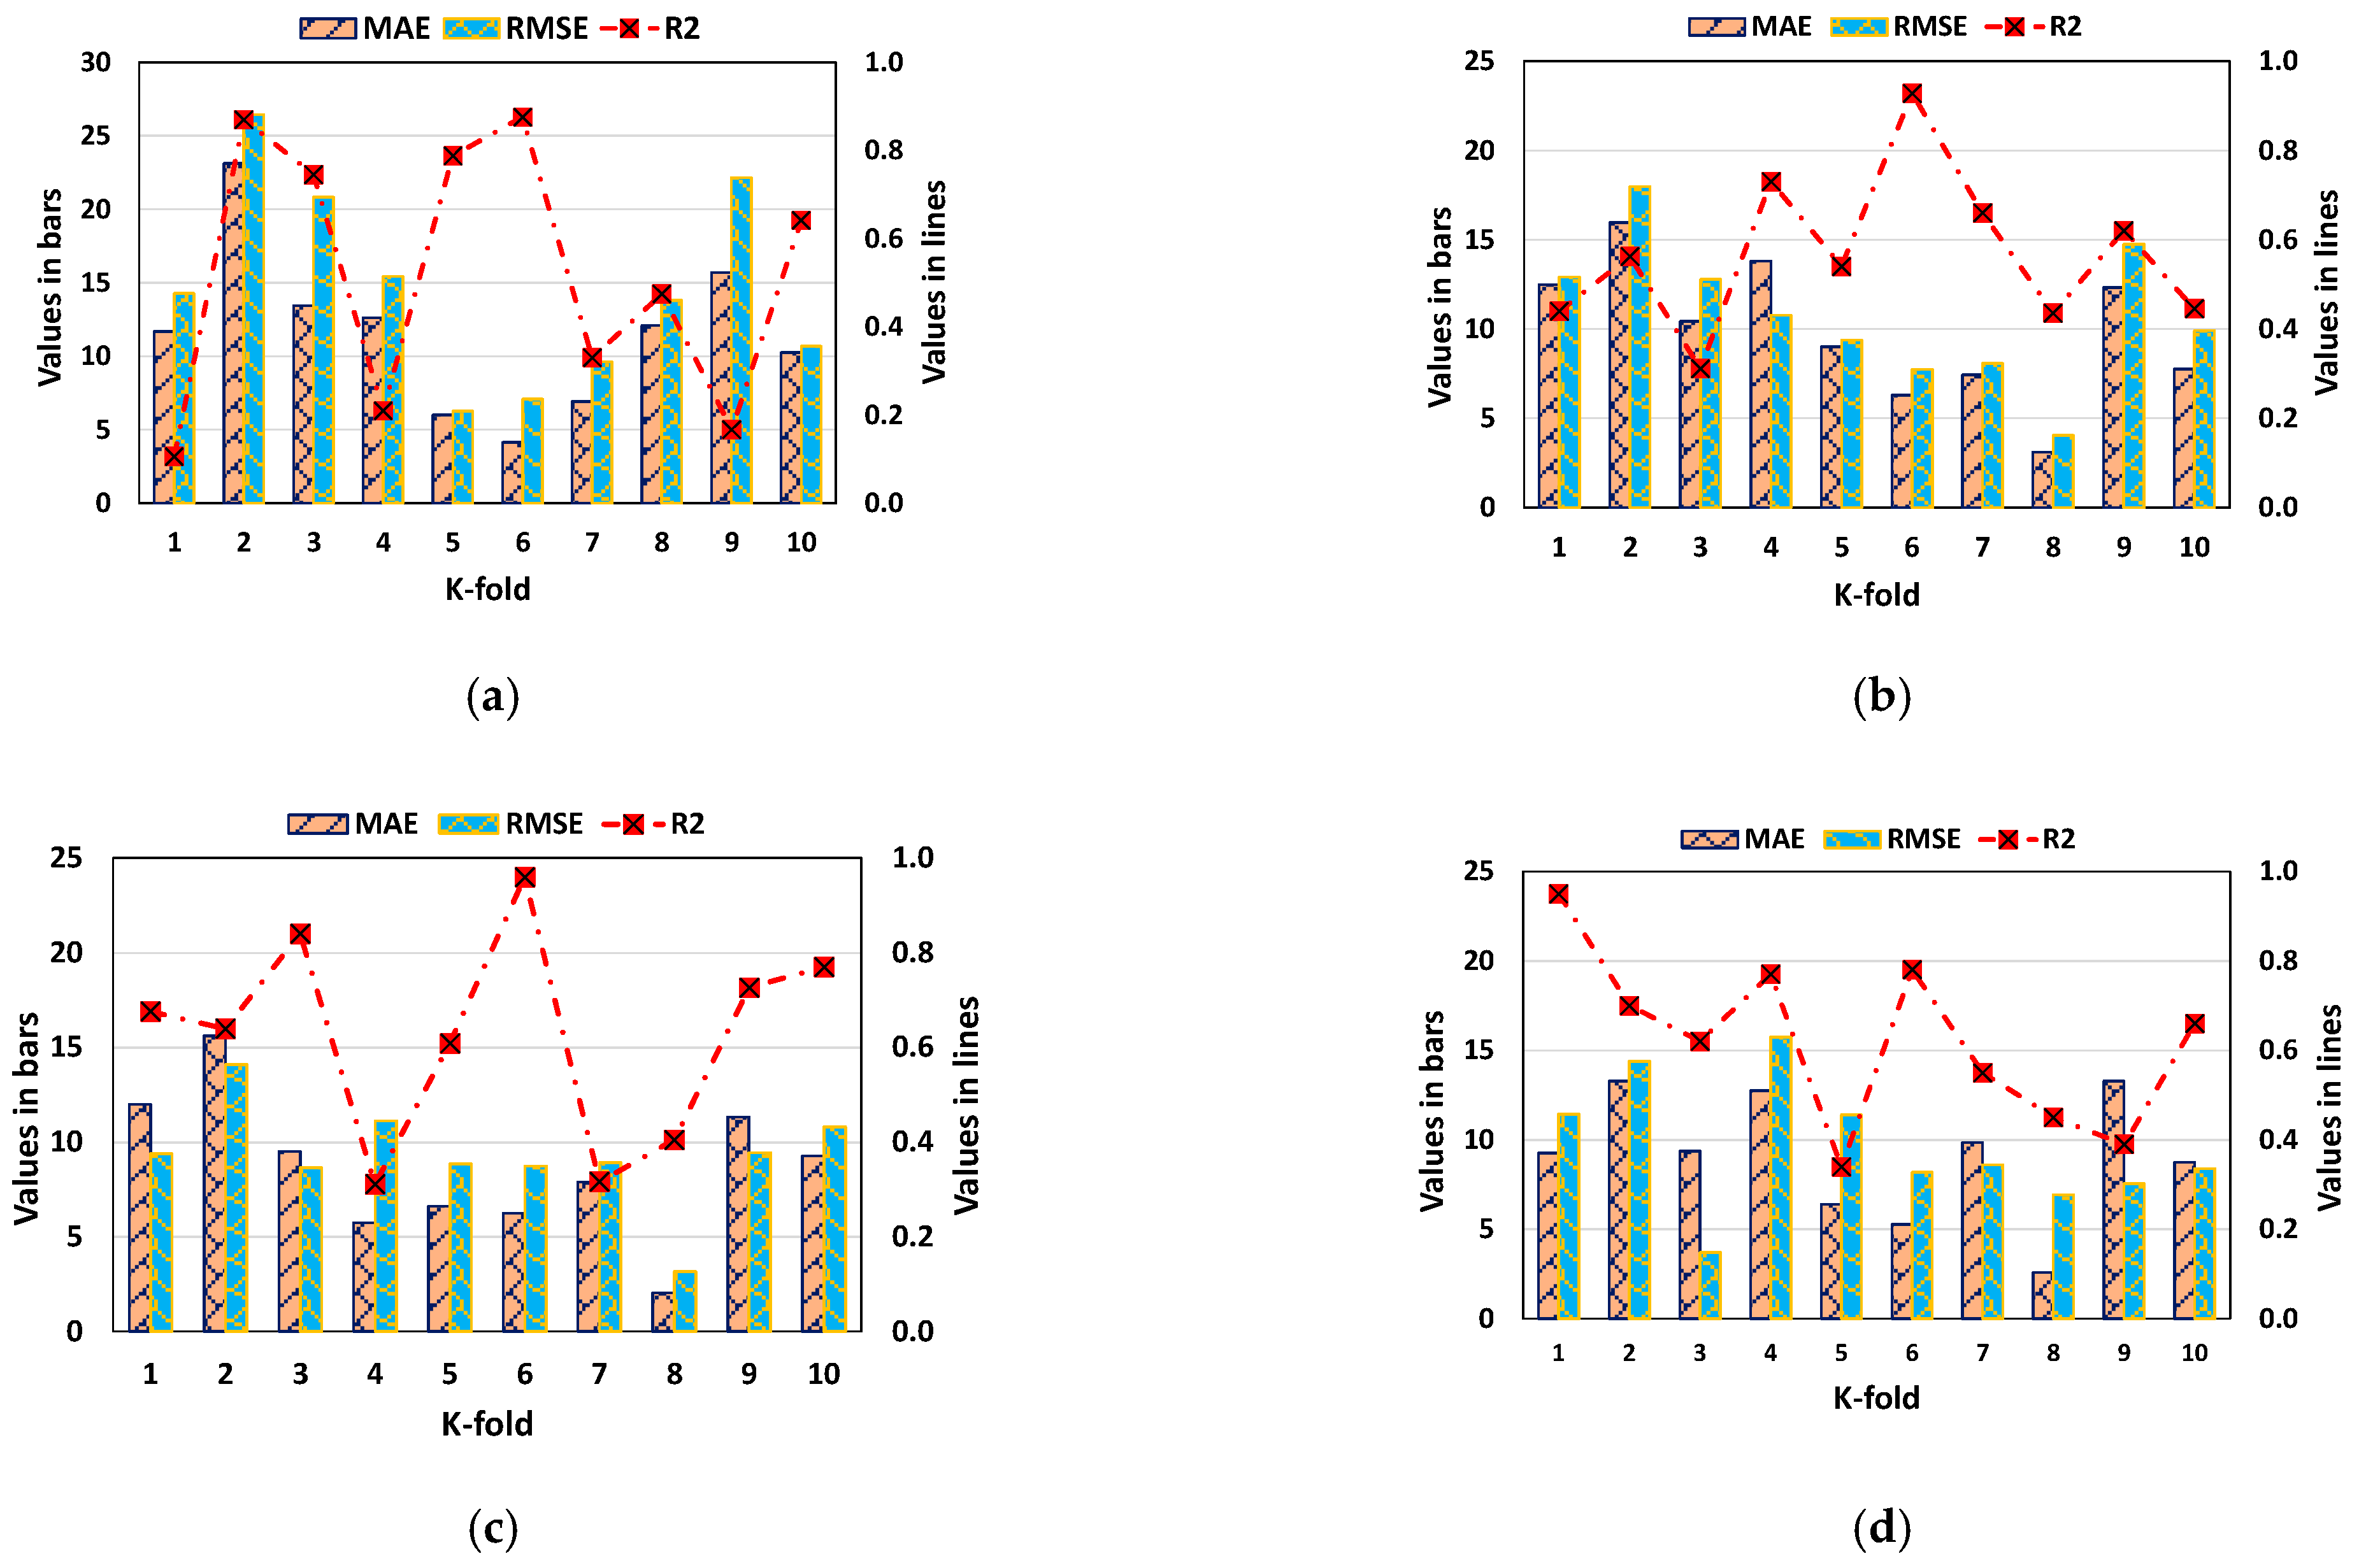
- Checks from the statistics and K-fold cross-validation confirmed the model’s performance as well. In addition, these checks proved that the BR model outperformed the other models evaluated.
- Sensitivity analysis revealed that fly ash, GGBS, NaOH molarity, water–to–solids ratio, sand, gravel with 10/20 mm in size, NaOH, gravel with 4/10 mm in size, and Na2SiO3 contributed 26.4%, 14.7%, 13.1%, 11.6%, 9.5%, 7.5%, 6.5%, 5.8%, and 4.8%, respectively, for the anticipation of output.
- This study will benefit the construction industry by producing quick and cost-effective approaches for predicting the strengths of materials. Additionally, utilizing these ways to promote more eco-friendly construction will expedite the adoption of GPC in construction projects.
Supplementary Materials
Author Contributions
Funding
Institutional Review Board Statement
Informed Consent Statement
Data Availability Statement
Acknowledgments
Conflicts of Interest
Abbreviations
| BR | Bagging regressor |
| CS | Compressive strength |
| DT | Decision tree |
| OPC | ordinary Portland cement |
| GPC | geopolymer concrete |
| GEP | Gene expression programming |
| KFCV | K-fold cross-validation |
| MAE | mean absolute error |
| MSE | Mean square error |
| ML | Machine learning |
| RF | Random forest |
| RMSE | Root mean square error |
| SML | Supervised machine learning |
References
- Chu, S.H.; Ye, H.; Huang, L.; Li, L.G. Carbon fiber reinforced geopolymer (FRG) mix design based on liquid film thickness. Constr. Build. Mater. 2021, 269, 121278. [Google Scholar] [CrossRef]
- Homayoonmehr, R.; Ramezanianpour, A.A.; Mirdarsoltany, M. Influence of metakaolin on fresh properties, mechanical properties and corrosion resistance of concrete and its sustainability issues: A review. J. Build. Eng. 2021, 44, 103011. [Google Scholar] [CrossRef]
- Ahmad, M.R.; Chen, B.; Haque, M.A.; Oderji, S.Y. Multiproperty characterization of cleaner and energy-efficient vegetal concrete based on one-part geopolymer binder. J. Clean. Prod. 2020, 253, 119916. [Google Scholar] [CrossRef]
- Khan, M.; Ali, M. Use of glass and nylon fibers in concrete for controlling early age micro cracking in bridge decks. Constr. Build. Mater. 2016, 125, 800–808. [Google Scholar] [CrossRef]
- Khan, M.; Cao, M.; Ali, M. Cracking behaviour and constitutive modelling of hybrid fibre reinforced concrete. J. Build. Eng. 2020, 30, 101272. [Google Scholar] [CrossRef]
- Khan, M.; Ali, M. Effect of super plasticizer on the properties of medium strength concrete prepared with coconut fiber. Constr. Build. Mater. 2018, 182, 703–715. [Google Scholar] [CrossRef]
- Khan, M.; Cao, M.; Chaopeng, X.; Ali, M. Experimental and analytical study of hybrid fiber reinforced concrete prepared with basalt fiber under high temperature. Fire Mater. 2021, 46, 205–226. [Google Scholar] [CrossRef]
- Teja, K.V.; Sai, P.P.; Meena, T. Investigation on the behaviour of ternary blended concrete with scba and sf. In Proceedings of the IOP Conference Series: Materials Science and Engineering, Xiamen, China, 20–22 October 2017; p. 032012. [Google Scholar]
- Gopalakrishnan, R.; Kaveri, R. Using graphene oxide to improve the mechanical and electrical properties of fiber-reinforced high-volume sugarcane bagasse ash cement mortar. Eur. Phys. J. Plus 2021, 136, 202. [Google Scholar] [CrossRef]
- Yang, H.; Liu, L.; Yang, W.; Liu, H.; Ahmad, W.; Ahmad, A.; Aslam, F.; Joyklad, P. A comprehensive overview of geopolymer composites: A bibliometric analysis and literature review. Case Stud. Constr. Mater. 2022, 16, e00830. [Google Scholar] [CrossRef]
- Bayasi, Z.; Zhou, J. Properties of silica fume concrete and mortar. Mater. J. 1993, 90, 349–356. [Google Scholar]
- Li, X.; Qin, D.; Hu, Y.; Ahmad, W.; Ahmad, A.; Aslam, F.; Joyklad, P. A systematic review of waste materials in cement-based composites for construction applications. J. Build. Eng. 2021, 45, 103447. [Google Scholar] [CrossRef]
- Cleetus, A.; Shibu, R.; Sreehari, P.M.; Paul, V.K.; Jacob, B. Analysis and study of the effect of GGBFS on concrete structures. Int. Res. J. Eng. Technol. 2018, 5, 3033–3037. [Google Scholar]
- Ahmad, A.; Ahmad, W.; Aslam, F.; Joyklad, P. Compressive strength prediction of fly ash-based geopolymer concrete via advanced machine learning techniques. Case Stud. Constr. Mater. 2022, 16, e00840. [Google Scholar] [CrossRef]
- Zhang, P.; Wang, K.; Li, Q.; Wang, J.; Ling, Y. Fabrication and engineering properties of concretes based on geopolymers/alkali-activated binders-A review. J. Clean. Prod. 2020, 258, 120896. [Google Scholar] [CrossRef]
- Zakka, W.P.; Lim, N.H.A.S.; Khun, M.C. A scientometric review of geopolymer concrete. J. Clean. Prod. 2021, 280, 124353. [Google Scholar] [CrossRef]
- Babu, D.L.V. Assessing the performance of molarity and alkaline activator ratio on engineering properties of self-compacting alkaline activated concrete at ambient temperature. J. Build. Eng. 2018, 20, 137–155. [Google Scholar]
- Marvila, M.T.; Azevedo, A.R.G.d.; Vieira, C.M.F. Reaction mechanisms of alkali-activated materials. Rev. IBRACON Estrut. Mater. 2021, 14, e14309. [Google Scholar] [CrossRef]
- Farooq, F.; Jin, X.; Javed, M.F.; Akbar, A.; Shah, M.I.; Aslam, F.; Alyousef, R. Geopolymer concrete as sustainable material: A state of the art review. Constr. Build. Mater. 2021, 306, 124762. [Google Scholar] [CrossRef]
- Muttashar, H.L.; Ariffin, M.A.M.; Hussein, M.N.; Hussin, M.W.; Ishaq, S.B. Self-compacting geopolymer concrete with spend garnet as sand replacement. J. Build. Eng. 2018, 15, 85–94. [Google Scholar] [CrossRef]
- Farhan, K.Z.; Johari, M.A.M.; Demirboğa, R. Assessment of important parameters involved in the synthesis of geopolymer composites: A review. Constr. Build. Mater. 2020, 264, 120276. [Google Scholar] [CrossRef]
- Hosan, A.; Haque, S.; Shaikh, F. Compressive behaviour of sodium and potassium activators synthetized fly ash geopolymer at elevated temperatures: A comparative study. J. Build. Eng. 2016, 8, 123–130. [Google Scholar] [CrossRef]
- Herath, C.; Gunasekara, C.; Law, D.W.; Setunge, S. Long term mechanical performance of nano-engineered high volume fly ash concrete. J. Build. Eng. 2021, 43, 103168. [Google Scholar] [CrossRef]
- Ahmad, W.; Ahmad, A.; Ostrowski, K.A.; Aslam, F.; Joyklad, P.; Zajdel, P. Application of Advanced Machine Learning Approaches to Predict the Compressive Strength of Concrete Containing Supplementary Cementitious Materials. Materials 2021, 14, 5762. [Google Scholar] [CrossRef] [PubMed]
- Alyousef, R.; Ahmad, W.; Ahmad, A.; Aslam, F.; Joyklad, P.; Alabduljabbar, H. Potential use of recycled plastic and rubber aggregate in cementitious materials for sustainable construction: A review. J. Clean. Prod. 2021, 329, 129736. [Google Scholar] [CrossRef]
- Khan, M.; Ali, M. Improvement in concrete behavior with fly ash, silica-fume and coconut fibres. Constr. Build. Mater. 2019, 203, 174–187. [Google Scholar] [CrossRef]
- Anjos, M.A.S.; Camões, A.; Campos, P.; Azeredo, G.A.; Ferreira, R.L.S. Effect of high volume fly ash and metakaolin with and without hydrated lime on the properties of self-compacting concrete. J. Build. Eng. 2020, 27, 100985. [Google Scholar] [CrossRef]
- Mehta, A.; Ashish, D.K. Silica fume and waste glass in cement concrete production: A review. J. Build. Eng. 2020, 29, 100888. [Google Scholar] [CrossRef]
- Tchakouté, H.K.; Rüscher, C.H.; Kong, S.; Ranjbar, N. Synthesis of sodium waterglass from white rice husk ash as an activator to produce metakaolin-based geopolymer cements. J. Build. Eng. 2016, 6, 252–261. [Google Scholar] [CrossRef]
- Ahmad, A.; Ahmad, W.; Chaiyasarn, K.; Ostrowski, K.A.; Aslam, F.; Zajdel, P.; Joyklad, P. Prediction of Geopolymer Concrete Compressive Strength Using Novel Machine Learning Algorithms. Polymers 2021, 13, 3389. [Google Scholar] [CrossRef]
- Reddy, M.S.; Dinakar, P.; Rao, B.H. Mix design development of fly ash and ground granulated blast furnace slag based geopolymer concrete. J. Build. Eng. 2018, 20, 712–722. [Google Scholar] [CrossRef]
- Van Deventer, J.S.J.; Provis, J.L.; Duxson, P. Technical and commercial progress in the adoption of geopolymer cement. Miner. Eng. 2012, 29, 89–104. [Google Scholar] [CrossRef]
- Jindal, B.B. Investigations on the properties of geopolymer mortar and concrete with mineral admixtures: A review. Constr. Build. Mater. 2019, 227, 116644. [Google Scholar] [CrossRef]
- Wong, C.L.; Mo, K.H.; Alengaram, U.J.; Yap, S.P. Mechanical strength and permeation properties of high calcium fly ash-based geopolymer containing recycled brick powder. J. Build. Eng. 2020, 32, 101655. [Google Scholar] [CrossRef]
- John, S.K.; Nadir, Y.; Girija, K. Effect of source materials, additives on the mechanical properties and durability of fly ash and fly ash-slag geopolymer mortar: A review. Constr. Build. Mater. 2021, 280, 122443. [Google Scholar] [CrossRef]
- Pilehvar, S.; Cao, V.D.; Szczotok, A.M.; Carmona, M.; Valentini, L.; Lanzón, M.; Pamies, R.; Kjøniksen, A.-L. Physical and mechanical properties of fly ash and slag geopolymer concrete containing different types of micro-encapsulated phase change materials. Constr. Build. Mater. 2018, 173, 28–39. [Google Scholar] [CrossRef]
- Amlashi, A.T.; Abdollahi, S.M.; Goodarzi, S.; Ghanizadeh, A.R. Soft computing based formulations for slump, compressive strength, and elastic modulus of bentonite plastic concrete. J. Clean. Prod. 2019, 230, 1197–1216. [Google Scholar] [CrossRef]
- Sun, J.; Ma, Y.; Li, J.; Zhang, J.; Ren, Z.; Wang, X. Machine learning-aided design and prediction of cementitious composites containing graphite and slag powder. J. Build. Eng. 2021, 43, 102544. [Google Scholar] [CrossRef]
- Milad, A.; Hussein, S.H.; Khekan, A.R.; Rashid, M.; Al-Msari, H.; Tran, T.H. Development of ensemble machine learning approaches for designing fiber-reinforced polymer composite strain prediction model. Eng. Comput. 2021, 1–13. [Google Scholar] [CrossRef]
- Arafa, S.; Milad, A.; Yusoff, N.I.M.; Al-Ansari, N.; Yaseen, Z.M. Investigation into the permeability and strength of pervious geopolymer concrete containing coated biomass aggregate material. J. Mater. Res. Technol. 2021, 15, 2075–2087. [Google Scholar] [CrossRef]
- Kheder, G.F. A two stage procedure for assessment of in situ concrete strength using combined non-destructive testing. Mater. Struct. 1999, 32, 410–417. [Google Scholar] [CrossRef]
- Mansour, M.Y.; Dicleli, M.; Lee, J.-Y.; Zhang, J.J.E.S. Predicting the shear strength of reinforced concrete beams using artificial neural networks. Eng. Struct. 2004, 26, 781–799. [Google Scholar] [CrossRef]
- Naderpour, H.; Poursaeidi, O.; Ahmadi, M.J.M. Shear resistance prediction of concrete beams reinforced by FRP bars using artificial neural networks. Measurement 2018, 126, 299–308. [Google Scholar] [CrossRef]
- Ahmad, A.; Chaiyasarn, K.; Farooq, F.; Ahmad, W.; Suparp, S.; Aslam, F. Compressive Strength Prediction via Gene Expression Programming (GEP) and Artificial Neural Network (ANN) for Concrete Containing RCA. Buildings 2021, 11, 324. [Google Scholar] [CrossRef]
- Song, H.; Ahmad, A.; Ostrowski, K.A.; Dudek, M. Analyzing the Compressive Strength of Ceramic Waste-Based Concrete Using Experiment and Artificial Neural Network (ANN) Approach. Materials 2021, 14, 4518. [Google Scholar] [CrossRef] [PubMed]
- Nguyen, H.; Vu, T.; Vo, T.P.; Thai, H.-T. Efficient machine learning models for prediction of concrete strengths. Constr. Build. Mater. 2021, 266, 120950. [Google Scholar] [CrossRef]
- Dao, D.V.; Trinh, S.H.; Ly, H.-B.; Pham, B.T.J.A.S. Prediction of compressive strength of geopolymer concrete using entirely steel slag aggregates: Novel hybrid artificial intelligence approaches. Appl. Sci. 2019, 9, 1113. [Google Scholar] [CrossRef] [Green Version]
- Dao, D.V.; Ly, H.-B.; Trinh, S.H.; Le, T.-T.; Pham, B.T.J.M. Artificial intelligence approaches for prediction of compressive strength of geopolymer concrete. Materials 2019, 12, 983. [Google Scholar] [CrossRef] [PubMed] [Green Version]
- Sufian, M.; Ullah, S.; Ostrowski, K.A.; Ahmad, A.; Zia, A.; Śliwa-Wieczorek, K.; Siddiq, M.; Awan, A.A. An Experimental and Empirical Study on the Use of Waste Marble Powder in Construction Material. Materials 2021, 14, 3829. [Google Scholar] [CrossRef]
- Ahmad, A.; Farooq, F.; Niewiadomski, P.; Ostrowski, K.; Akbar, A.; Aslam, F.; Alyousef, R. Prediction of compressive strength of fly ash based concrete using individual and ensemble algorithm. Materials 2021, 14, 794. [Google Scholar] [CrossRef] [PubMed]
- Song, Y.-Y.; Ying, L.U. Decision tree methods: Applications for classification and prediction. Shanghai Arch. Psychiatry 2015, 27, 130. [Google Scholar]
- Hillebrand, E.; Medeiros, M.C. The benefits of bagging for forecast models of realized volatility. Econom. Rev. 2010, 29, 571–593. [Google Scholar] [CrossRef]
- Ferreira, C. Gene expression programming: A new adaptive algorithm for solving problems. arXiv 2001, arXiv:cs/0102027. [Google Scholar]
- Gholampour, A.; Gandomi, A.H.; Ozbakkaloglu, T. New formulations for mechanical properties of recycled aggregate concrete using gene expression programming. Constr. Build. Mater. 2017, 130, 122–145. [Google Scholar] [CrossRef]
- Huang, J.; Sun, Y.; Zhang, J. Reduction of computational error by optimizing SVR kernel coefficients to simulate concrete compressive strength through the use of a human learning optimization algorithm. Eng. Comput. 2021, 1–18. [Google Scholar] [CrossRef]
- Han, Q.; Gui, C.; Xu, J.; Lacidogna, G. A generalized method to predict the compressive strength of high-performance concrete by improved random forest algorithm. Constr. Build. Mater. 2019, 226, 734–742. [Google Scholar] [CrossRef]
- Farooq, F.; Ahmed, W.; Akbar, A.; Aslam, F.; Alyousef, R. Predictive modeling for sustainable high-performance concrete from industrial wastes: A comparison and optimization of models using ensemble learners. J. Clean. Prod. 2021, 292, 126032. [Google Scholar] [CrossRef]
- Aslam, F.; Farooq, F.; Amin, M.N.; Khan, K.; Waheed, A.; Akbar, A.; Javed, M.F.; Alyousef, R.; Alabdulijabbar, H. Applications of gene expression programming for estimating compressive strength of high-strength concrete. Adv. Civ. Eng. 2020, 2020, 8850535. [Google Scholar] [CrossRef]
- Ahmad, A.; Ostrowski, K.A.; Maślak, M.; Farooq, F.; Mehmood, I.; Nafees, A. Comparative Study of Supervised Machine Learning Algorithms for Predicting the Compressive Strength of Concrete at High Temperature. Materials 2021, 14, 4222. [Google Scholar] [CrossRef]
- Song, H.; Ahmad, A.; Farooq, F.; Ostrowski, K.A.; Maślak, M.; Czarnecki, S.; Aslam, F.J.C.; Materials, B. Predicting the compressive strength of concrete with fly ash admixture using machine learning algorithms. Constr. Build. Mater. 2021, 308, 125021. [Google Scholar] [CrossRef]


| Parameter | Fly Ash (kg/m3) | GGBS (kg/m3) | Na2SiO3 (kg/m3) | NaOH (kg/m3) | Fine Aggregate (kg/m3) | Gravel 4/10 mm (kg/m3) | Gravel 10/20 mm (kg/m3) | Water/Solids Ratio | NaOH Molarity |
|---|---|---|---|---|---|---|---|---|---|
| Mean | 174.34 | 225.15 | 111.66 | 53.74 | 729.88 | 288.39 | 737.37 | 0.34 | 8.14 |
| Mode | 0 | 0 | 108 | 64 | 651 | 0 | 0 | 0.53 | 10 |
| Median | 120 | 300 | 108 | 56 | 728 | 208 | 789 | 0.34 | 9.2 |
| Standard Deviation | 167.95 | 162.27 | 48.16 | 31.91 | 130.97 | 372.31 | 358.55 | 0.11 | 4.56 |
| Sum | 63,286.04 | 81,728.05 | 40,532.68 | 19,508.75 | 264,947.79 | 104,684.28 | 267,664.93 | 124.78 | 2955.11 |
| Range | 523 | 450 | 324 | 143.5 | 901 | 1293.4 | 1298 | 0.63 | 19 |
| Maximum | 523 | 450 | 342 | 147 | 1360 | 1293.4 | 1298 | 0.63 | 20 |
| Minimum | 0 | 0 | 18 | 3.5 | 459 | 0 | 0 | 0 | 1 |
| Standard Error | 8.82 | 8.52 | 2.53 | 1.67 | 6.87 | 19.54 | 18.82 | 0.01 | 0.24 |
| SML Technique | MAE | RMSE |
|---|---|---|
| Decision tree | 4.136 | 6.256 |
| Gene expression programming | 3.102 | 4.049 |
| Bagging regressor | 2.044 | 3.180 |
| Random forest | 2.585 | 3.702 |
| K-Fold | DT | GEP | BR | RF | ||||||||
|---|---|---|---|---|---|---|---|---|---|---|---|---|
| MAE | RMSE | R2 | MAE | RMSE | R2 | MAE | RMSE | R2 | MAE | RMSE | R2 | |
| 1 | 11.67 | 14.28 | 0.11 | 12.48 | 12.90 | 0.44 | 11.99 | 9.40 | 0.68 | 9.26 | 11.43 | 0.95 |
| 2 | 23.11 | 26.44 | 0.87 | 15.95 | 17.98 | 0.56 | 15.61 | 14.10 | 0.64 | 13.28 | 14.38 | 0.70 |
| 3 | 13.44 | 20.82 | 0.75 | 10.44 | 12.78 | 0.31 | 9.52 | 8.65 | 0.84 | 9.37 | 3.70 | 0.62 |
| 4 | 12.61 | 15.43 | 0.21 | 13.79 | 10.77 | 0.73 | 5.75 | 11.14 | 0.31 | 12.75 | 15.74 | 0.77 |
| 5 | 6.00 | 6.26 | 0.79 | 8.99 | 9.37 | 0.54 | 6.63 | 8.85 | 0.61 | 6.40 | 11.38 | 0.34 |
| 6 | 4.14 | 7.10 | 0.88 | 6.29 | 7.73 | 0.93 | 6.25 | 8.74 | 0.96 | 5.27 | 8.19 | 0.78 |
| 7 | 6.92 | 9.62 | 0.33 | 7.45 | 8.08 | 0.66 | 7.90 | 8.93 | 0.32 | 9.84 | 8.60 | 0.55 |
| 8 | 12.10 | 13.81 | 0.47 | 3.10 | 4.05 | 0.44 | 2.04 | 3.18 | 0.41 | 2.59 | 6.94 | 0.45 |
| 9 | 15.68 | 22.15 | 0.17 | 12.32 | 14.74 | 0.62 | 11.33 | 9.45 | 0.73 | 13.28 | 7.55 | 0.39 |
| 10 | 10.25 | 10.69 | 0.64 | 7.75 | 9.90 | 0.45 | 9.28 | 10.81 | 0.77 | 8.75 | 8.38 | 0.66 |
Publisher’s Note: MDPI stays neutral with regard to jurisdictional claims in published maps and institutional affiliations. |
© 2022 by the authors. Licensee MDPI, Basel, Switzerland. This article is an open access article distributed under the terms and conditions of the Creative Commons Attribution (CC BY) license (https://creativecommons.org/licenses/by/4.0/).
Share and Cite
Zou, Y.; Zheng, C.; Alzahrani, A.M.; Ahmad, W.; Ahmad, A.; Mohamed, A.M.; Khallaf, R.; Elattar, S. Evaluation of Artificial Intelligence Methods to Estimate the Compressive Strength of Geopolymers. Gels 2022, 8, 271. https://doi.org/10.3390/gels8050271
Zou Y, Zheng C, Alzahrani AM, Ahmad W, Ahmad A, Mohamed AM, Khallaf R, Elattar S. Evaluation of Artificial Intelligence Methods to Estimate the Compressive Strength of Geopolymers. Gels. 2022; 8(5):271. https://doi.org/10.3390/gels8050271
Chicago/Turabian StyleZou, Yong, Chao Zheng, Abdullah Mossa Alzahrani, Waqas Ahmad, Ayaz Ahmad, Abdeliazim Mustafa Mohamed, Rana Khallaf, and Samia Elattar. 2022. "Evaluation of Artificial Intelligence Methods to Estimate the Compressive Strength of Geopolymers" Gels 8, no. 5: 271. https://doi.org/10.3390/gels8050271
APA StyleZou, Y., Zheng, C., Alzahrani, A. M., Ahmad, W., Ahmad, A., Mohamed, A. M., Khallaf, R., & Elattar, S. (2022). Evaluation of Artificial Intelligence Methods to Estimate the Compressive Strength of Geopolymers. Gels, 8(5), 271. https://doi.org/10.3390/gels8050271