
Biochemical and Microstructural Properties of Lizardfish (Saurida tumbil) Scale Collagen Extracted with Various Organic Acids

 , ,
, , 
Abstract
:1. Introduction
2. Results and Discussion
2.1. Yield and Hydroxyproline (Hyp)
2.2. Color of Acid-Extracted Collagens
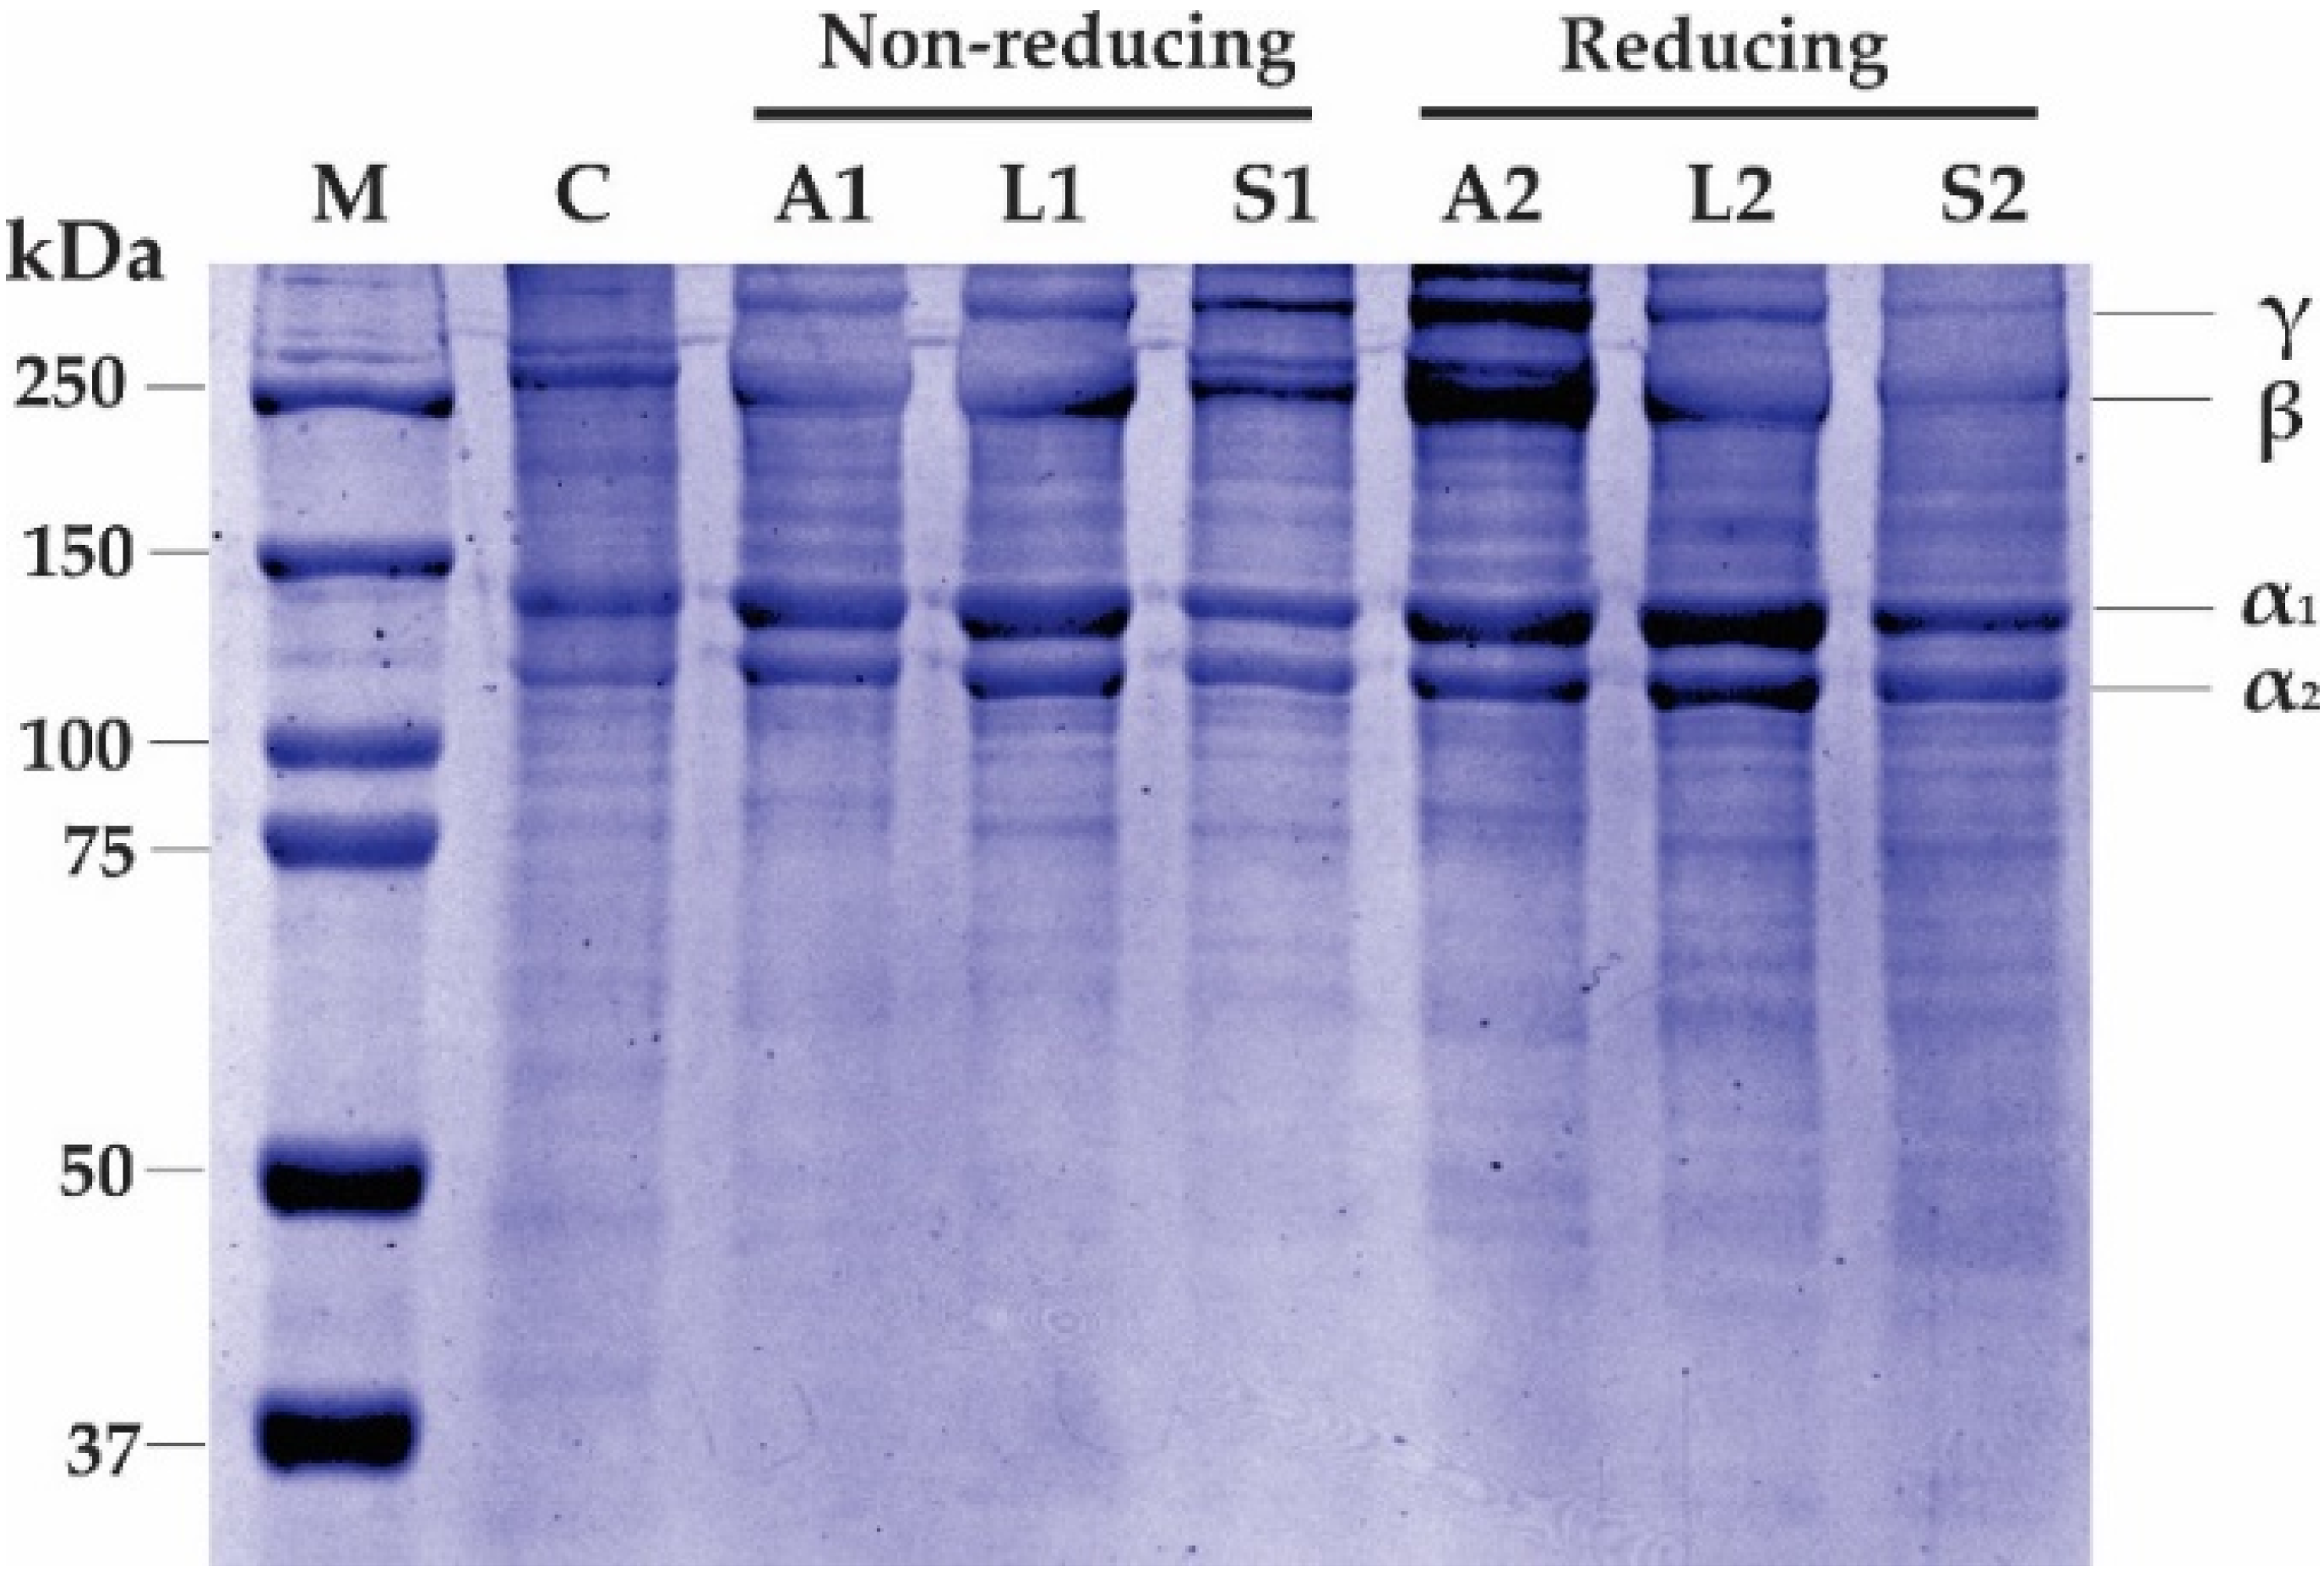
2.3. SDS-PAGE Profile
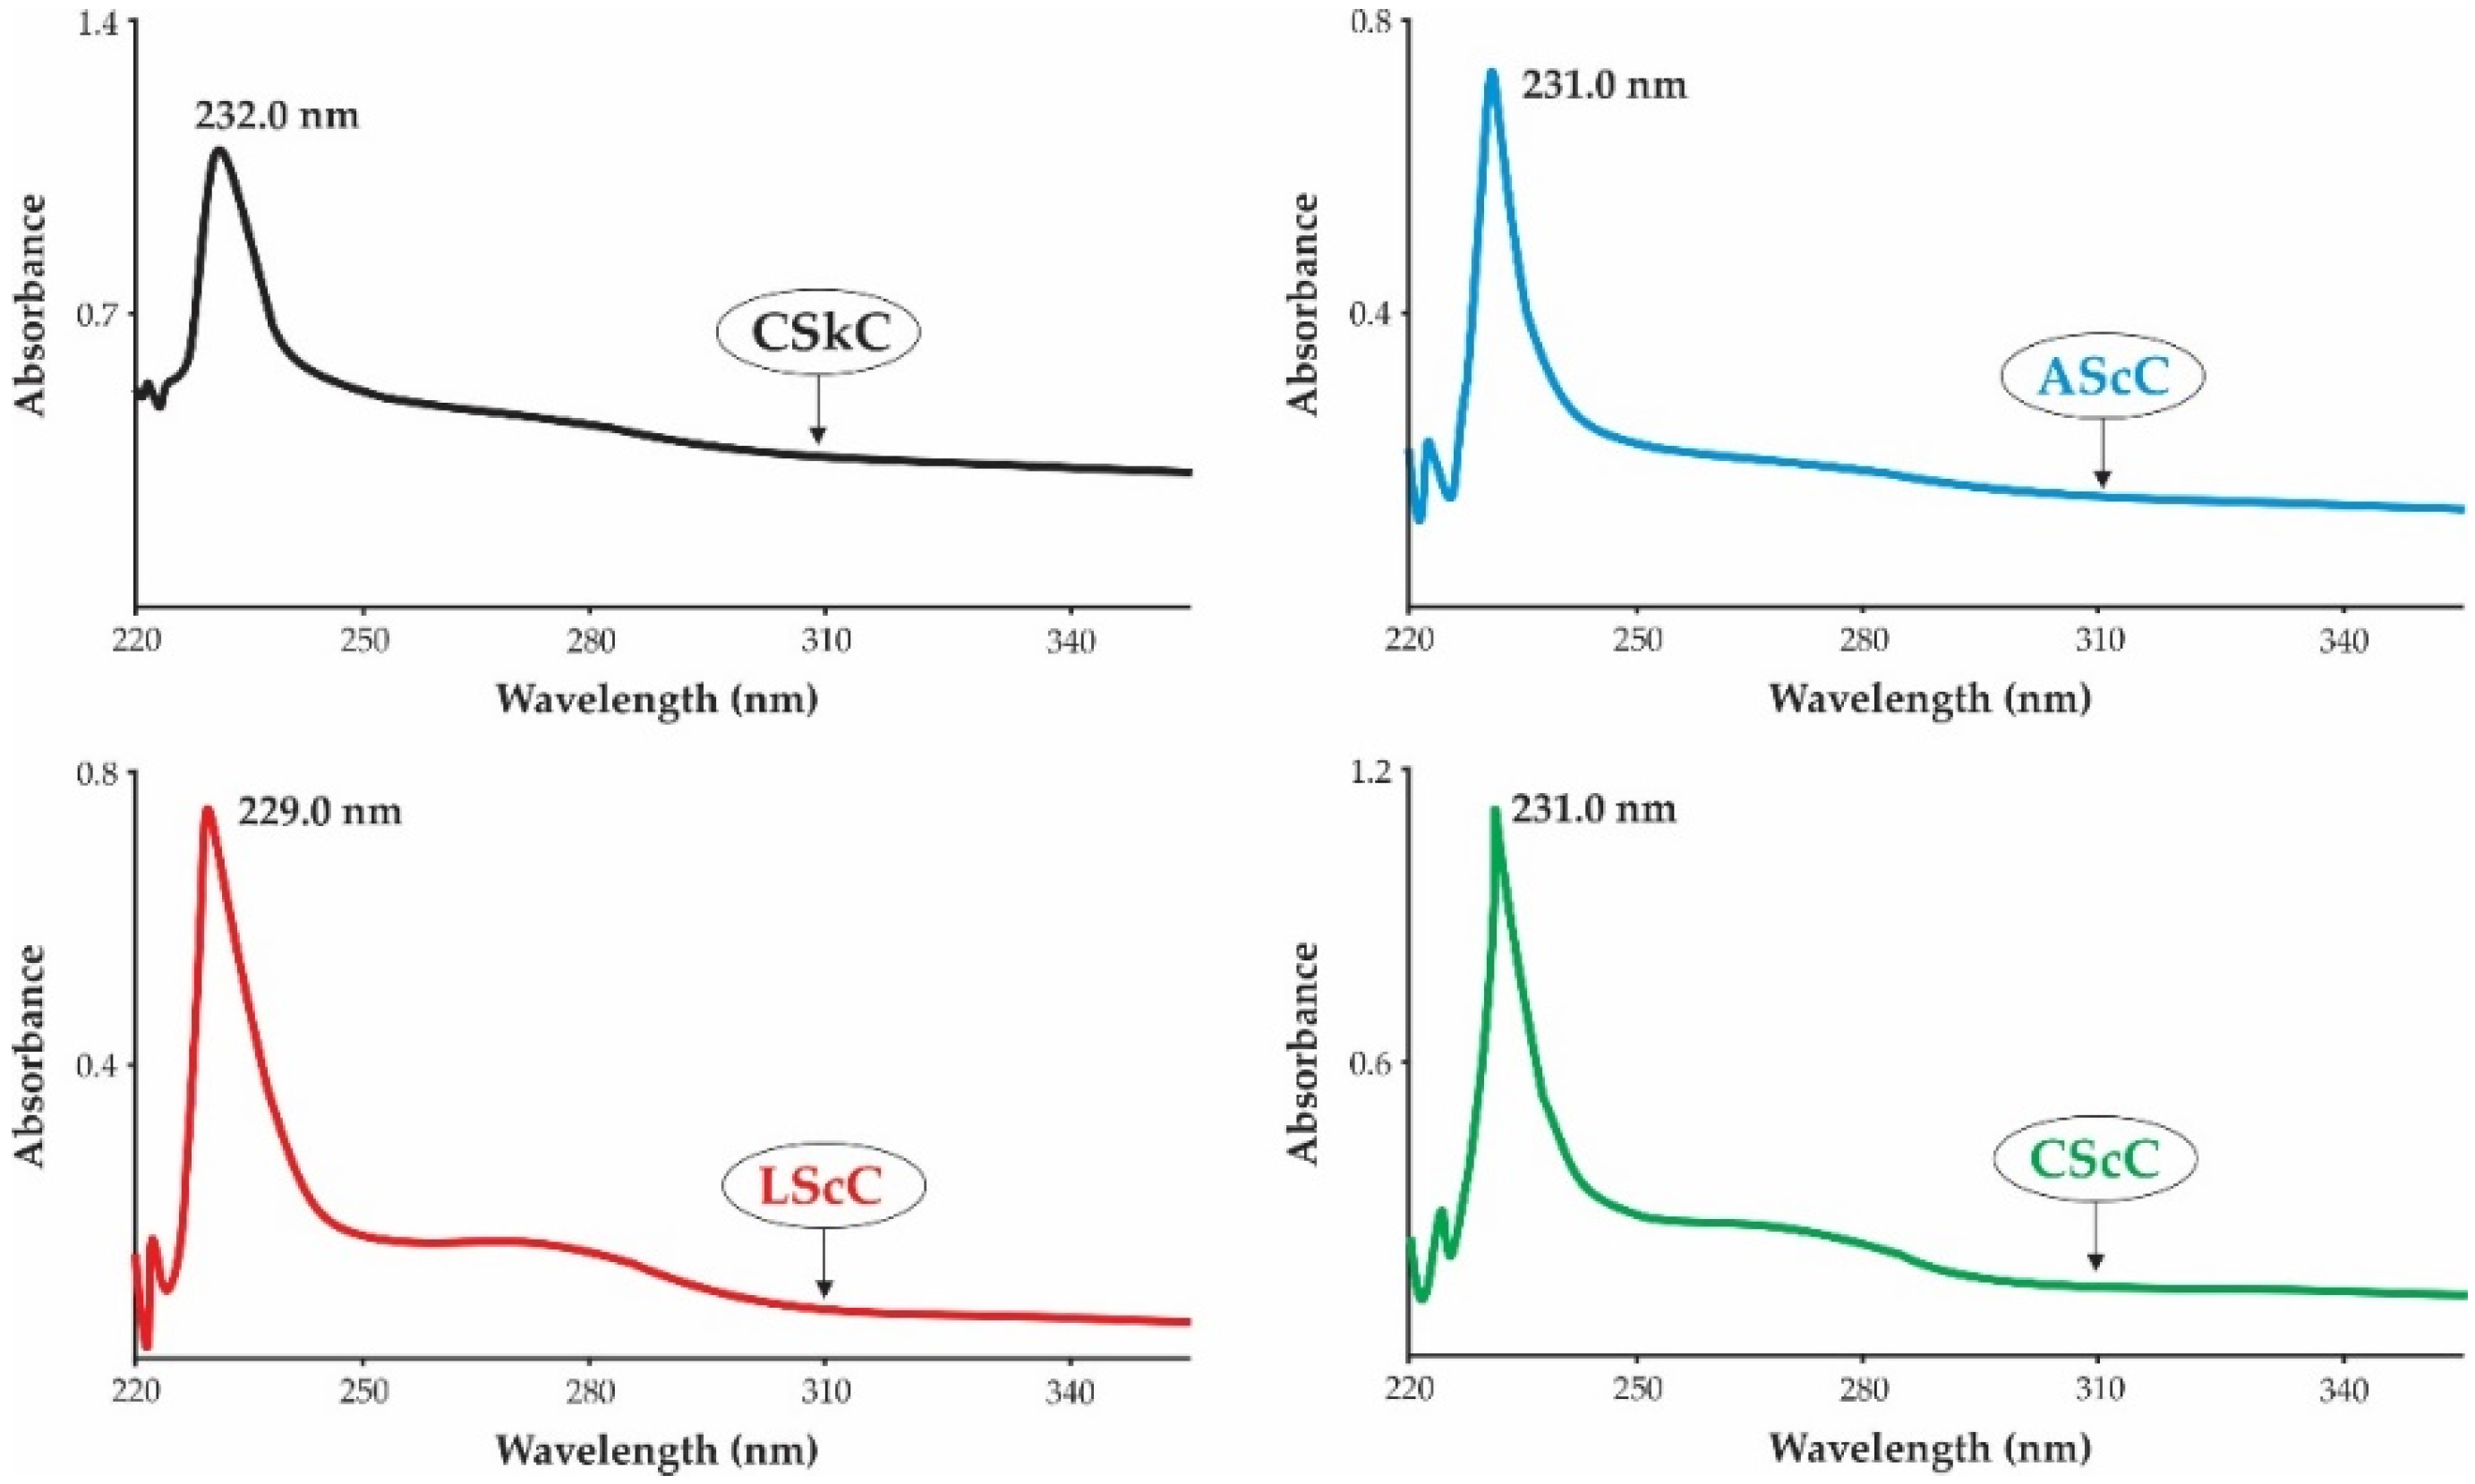
2.4. UV-Vis Spectra
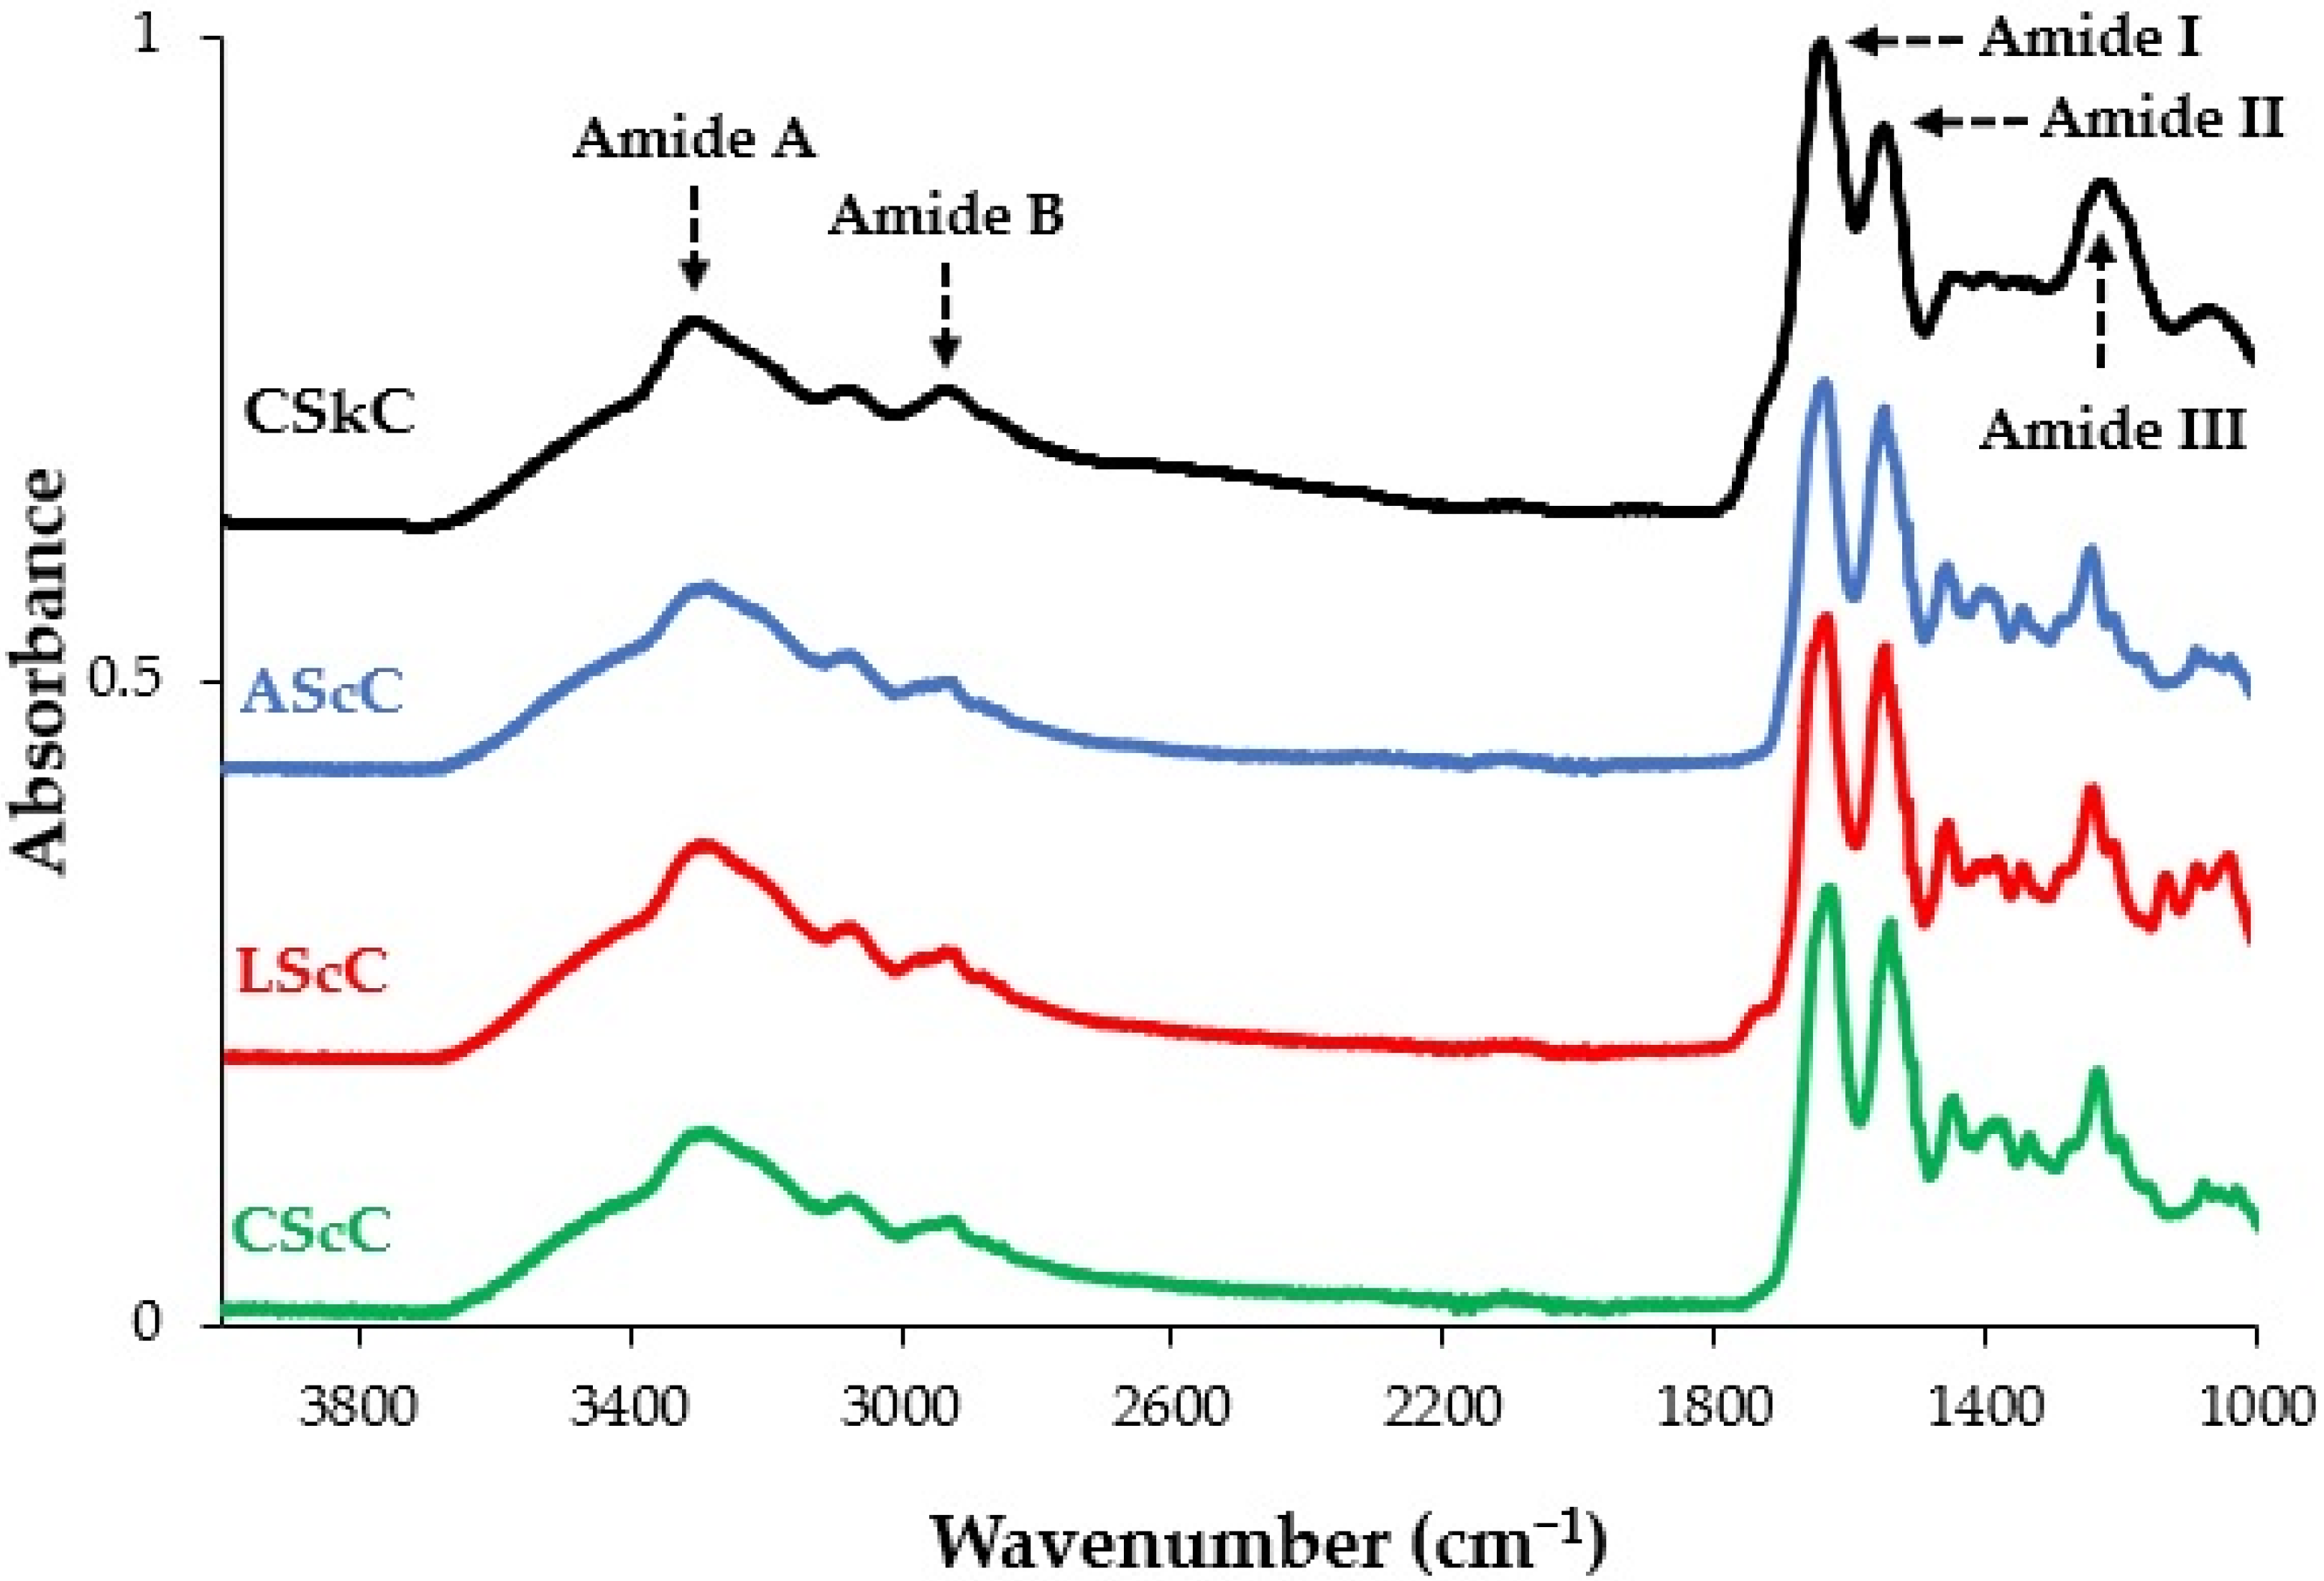
2.5. FTIR Spectra
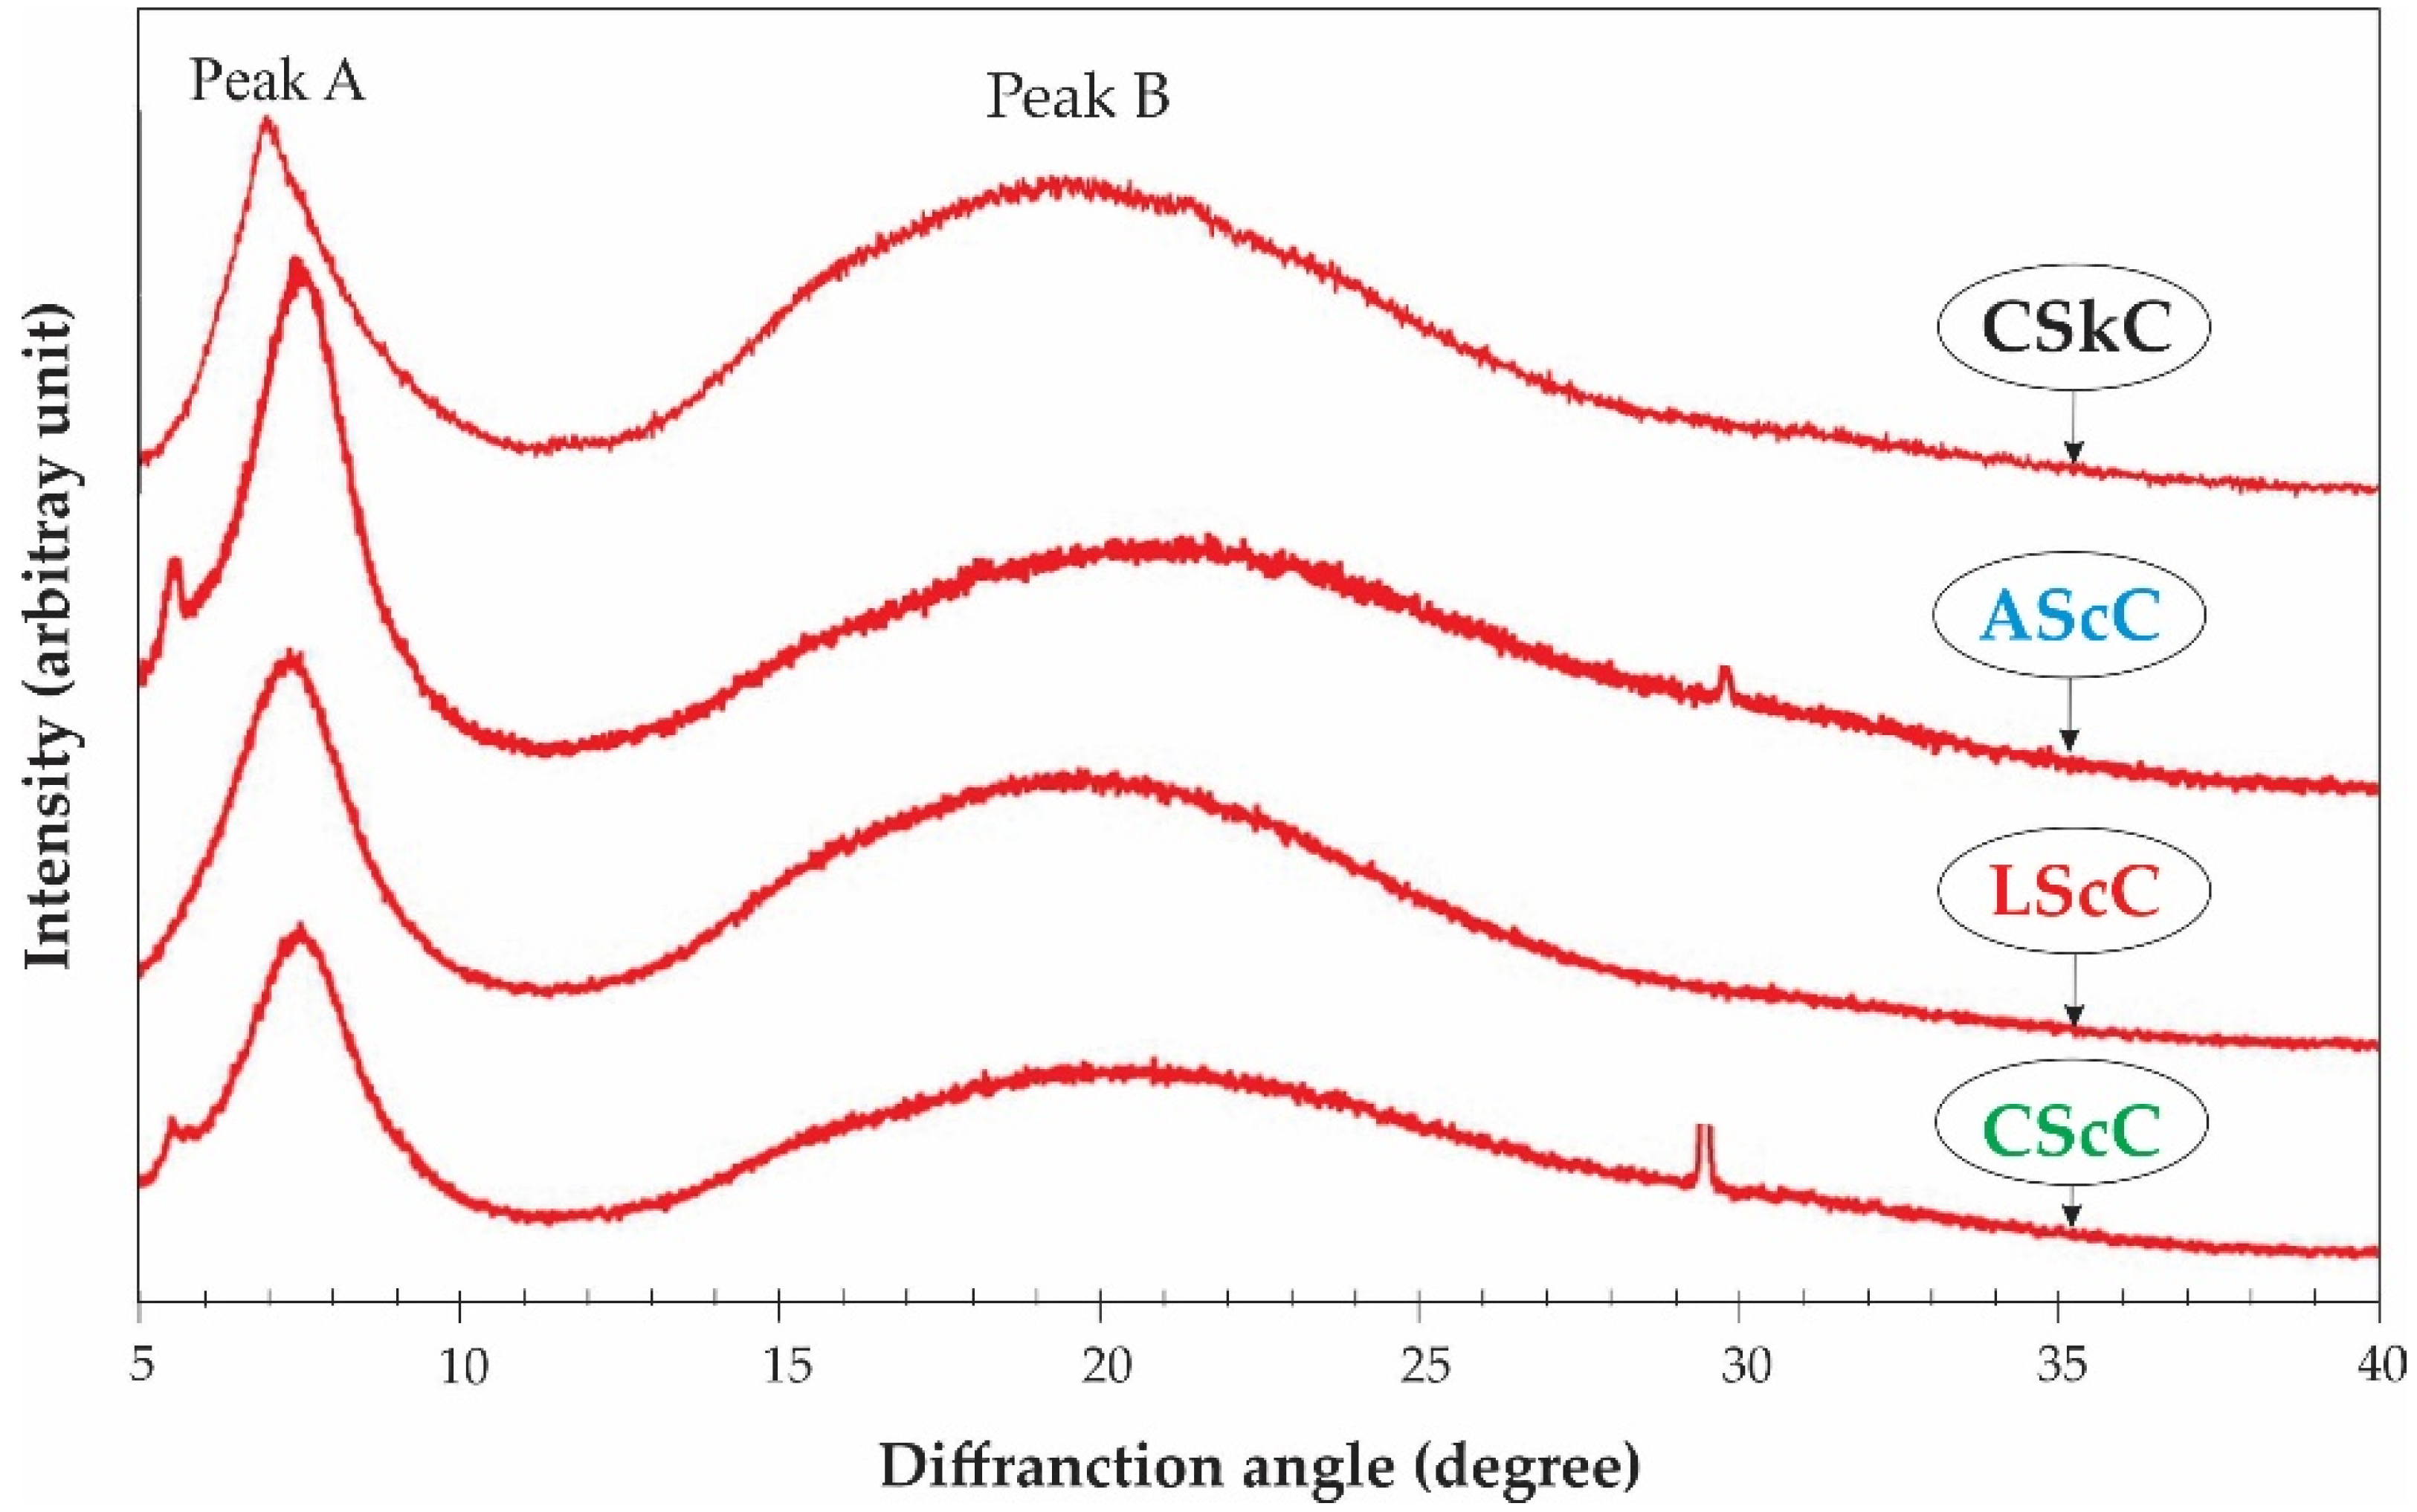
2.6. X-ray Diffraction (XRD) Analysis
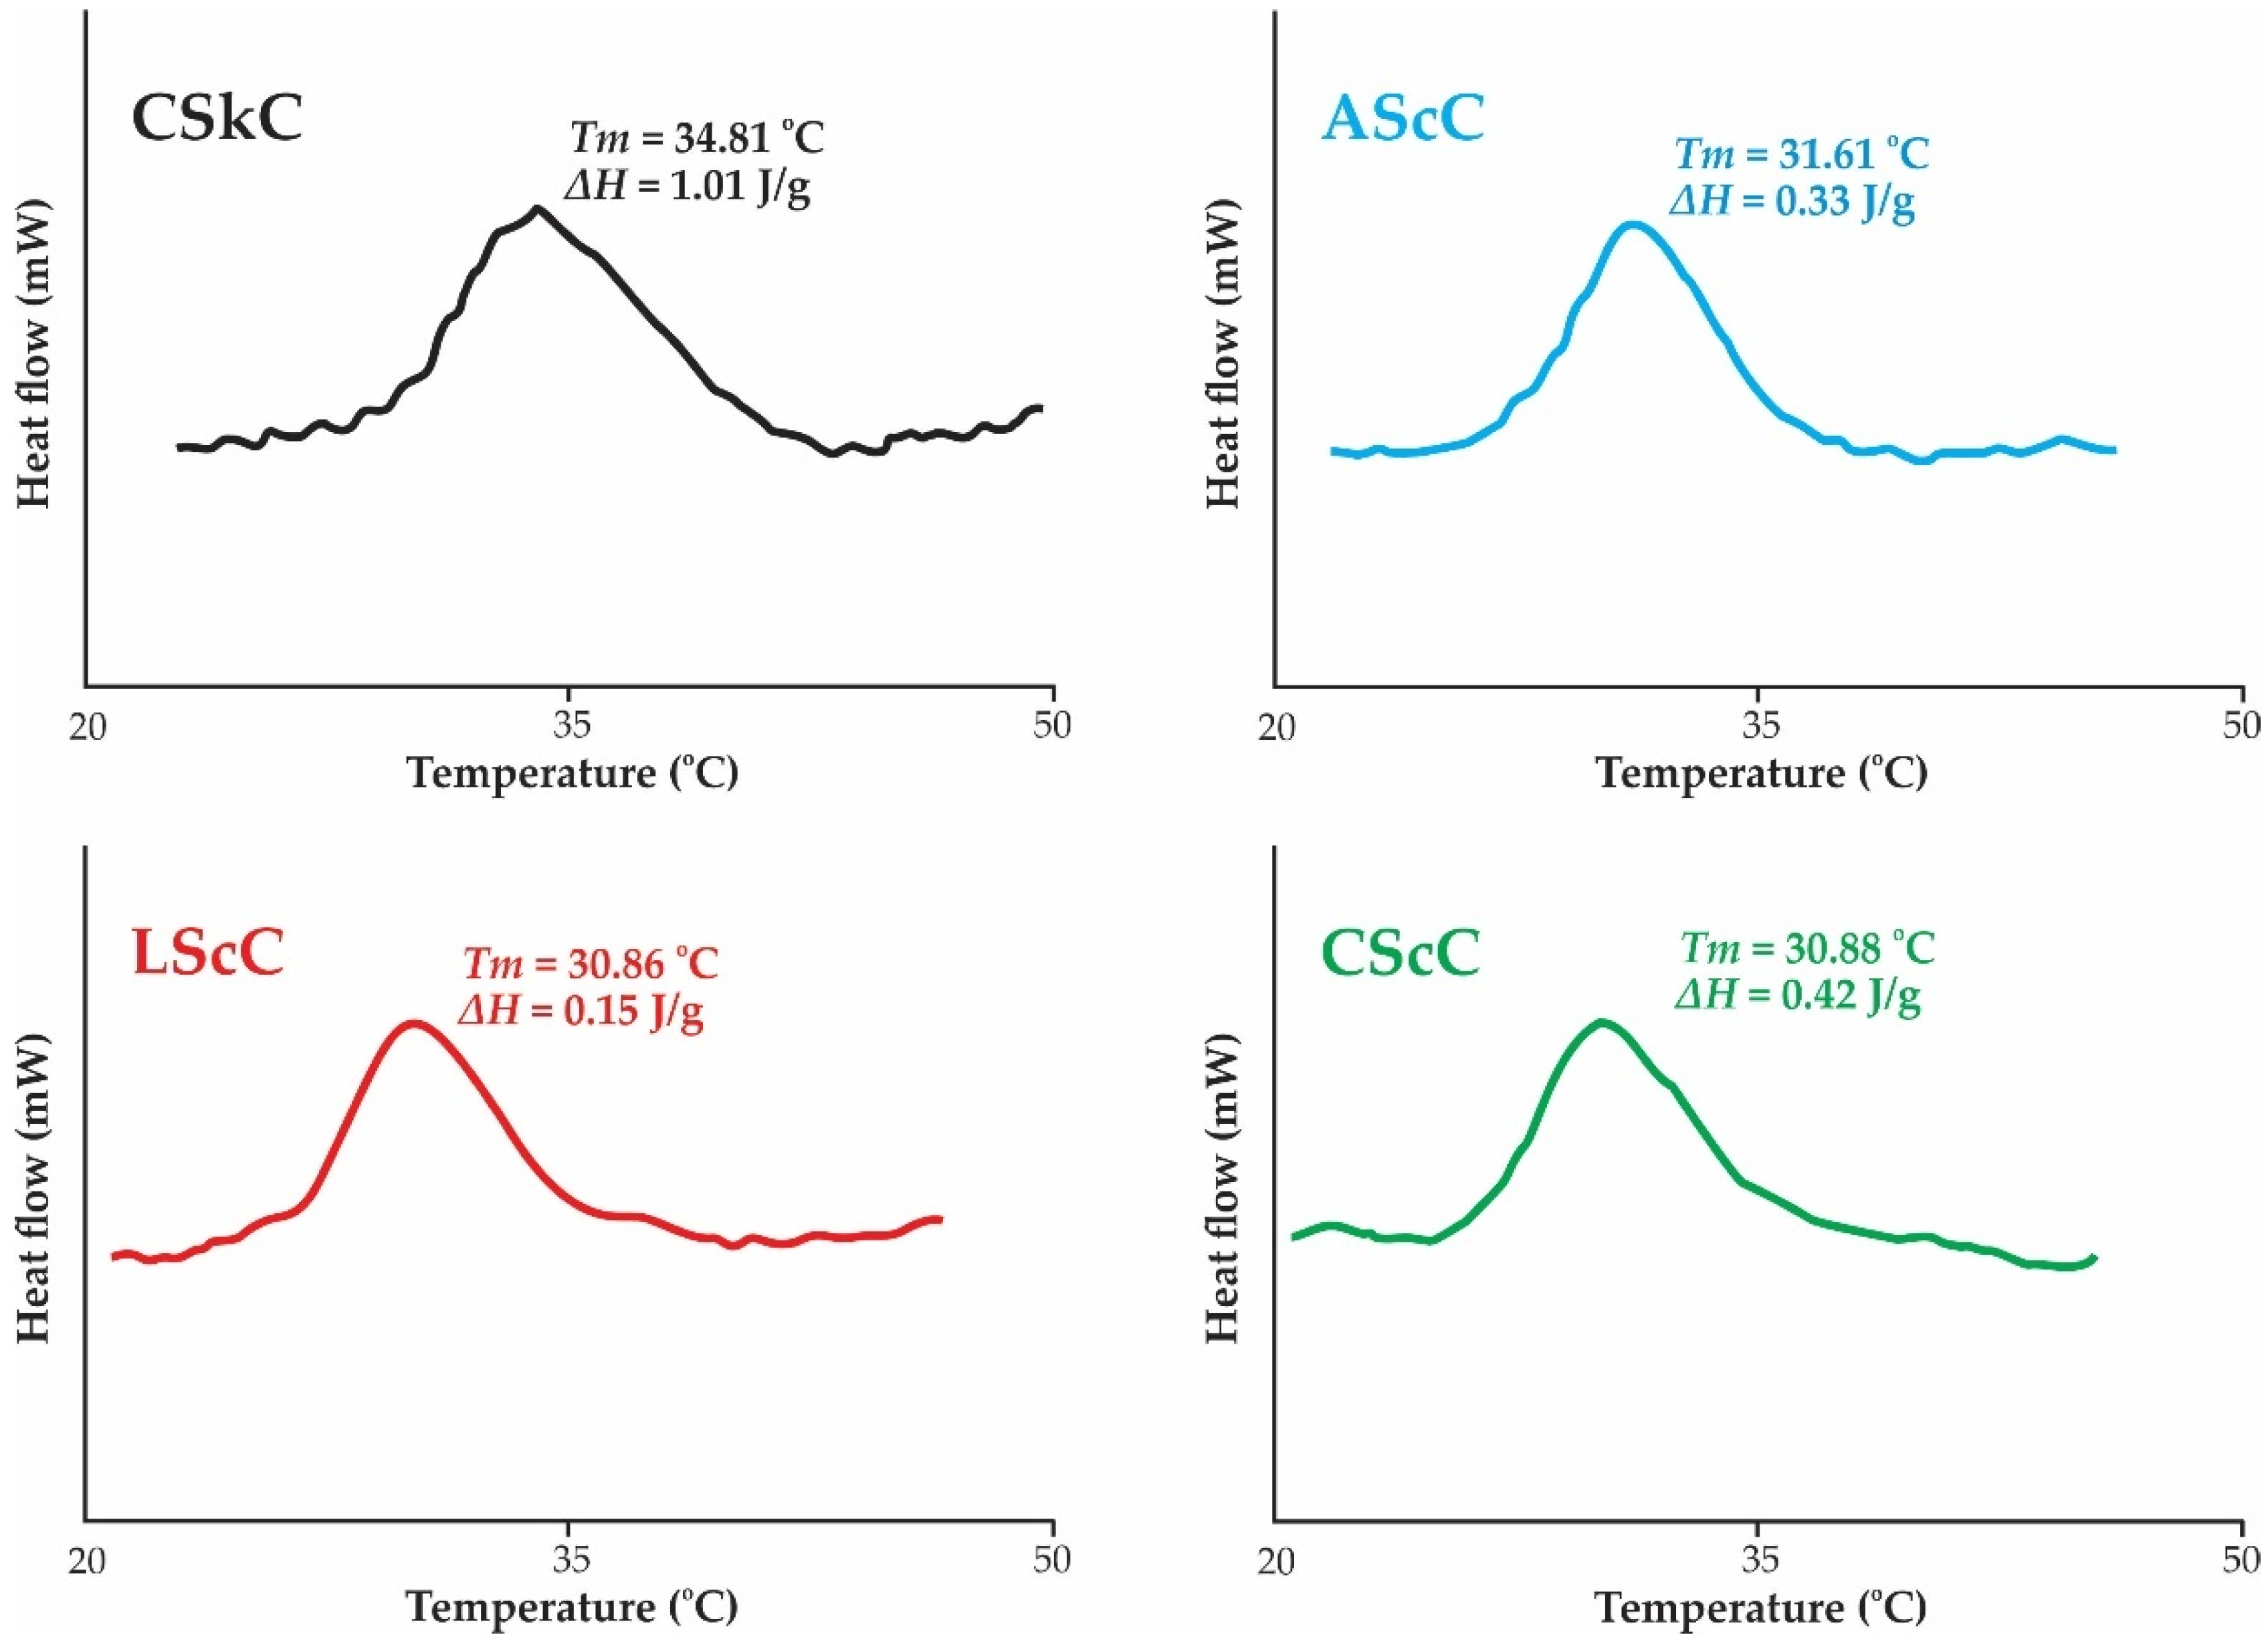
2.7. Thermal Stability
2.8. Microstructure Analysis
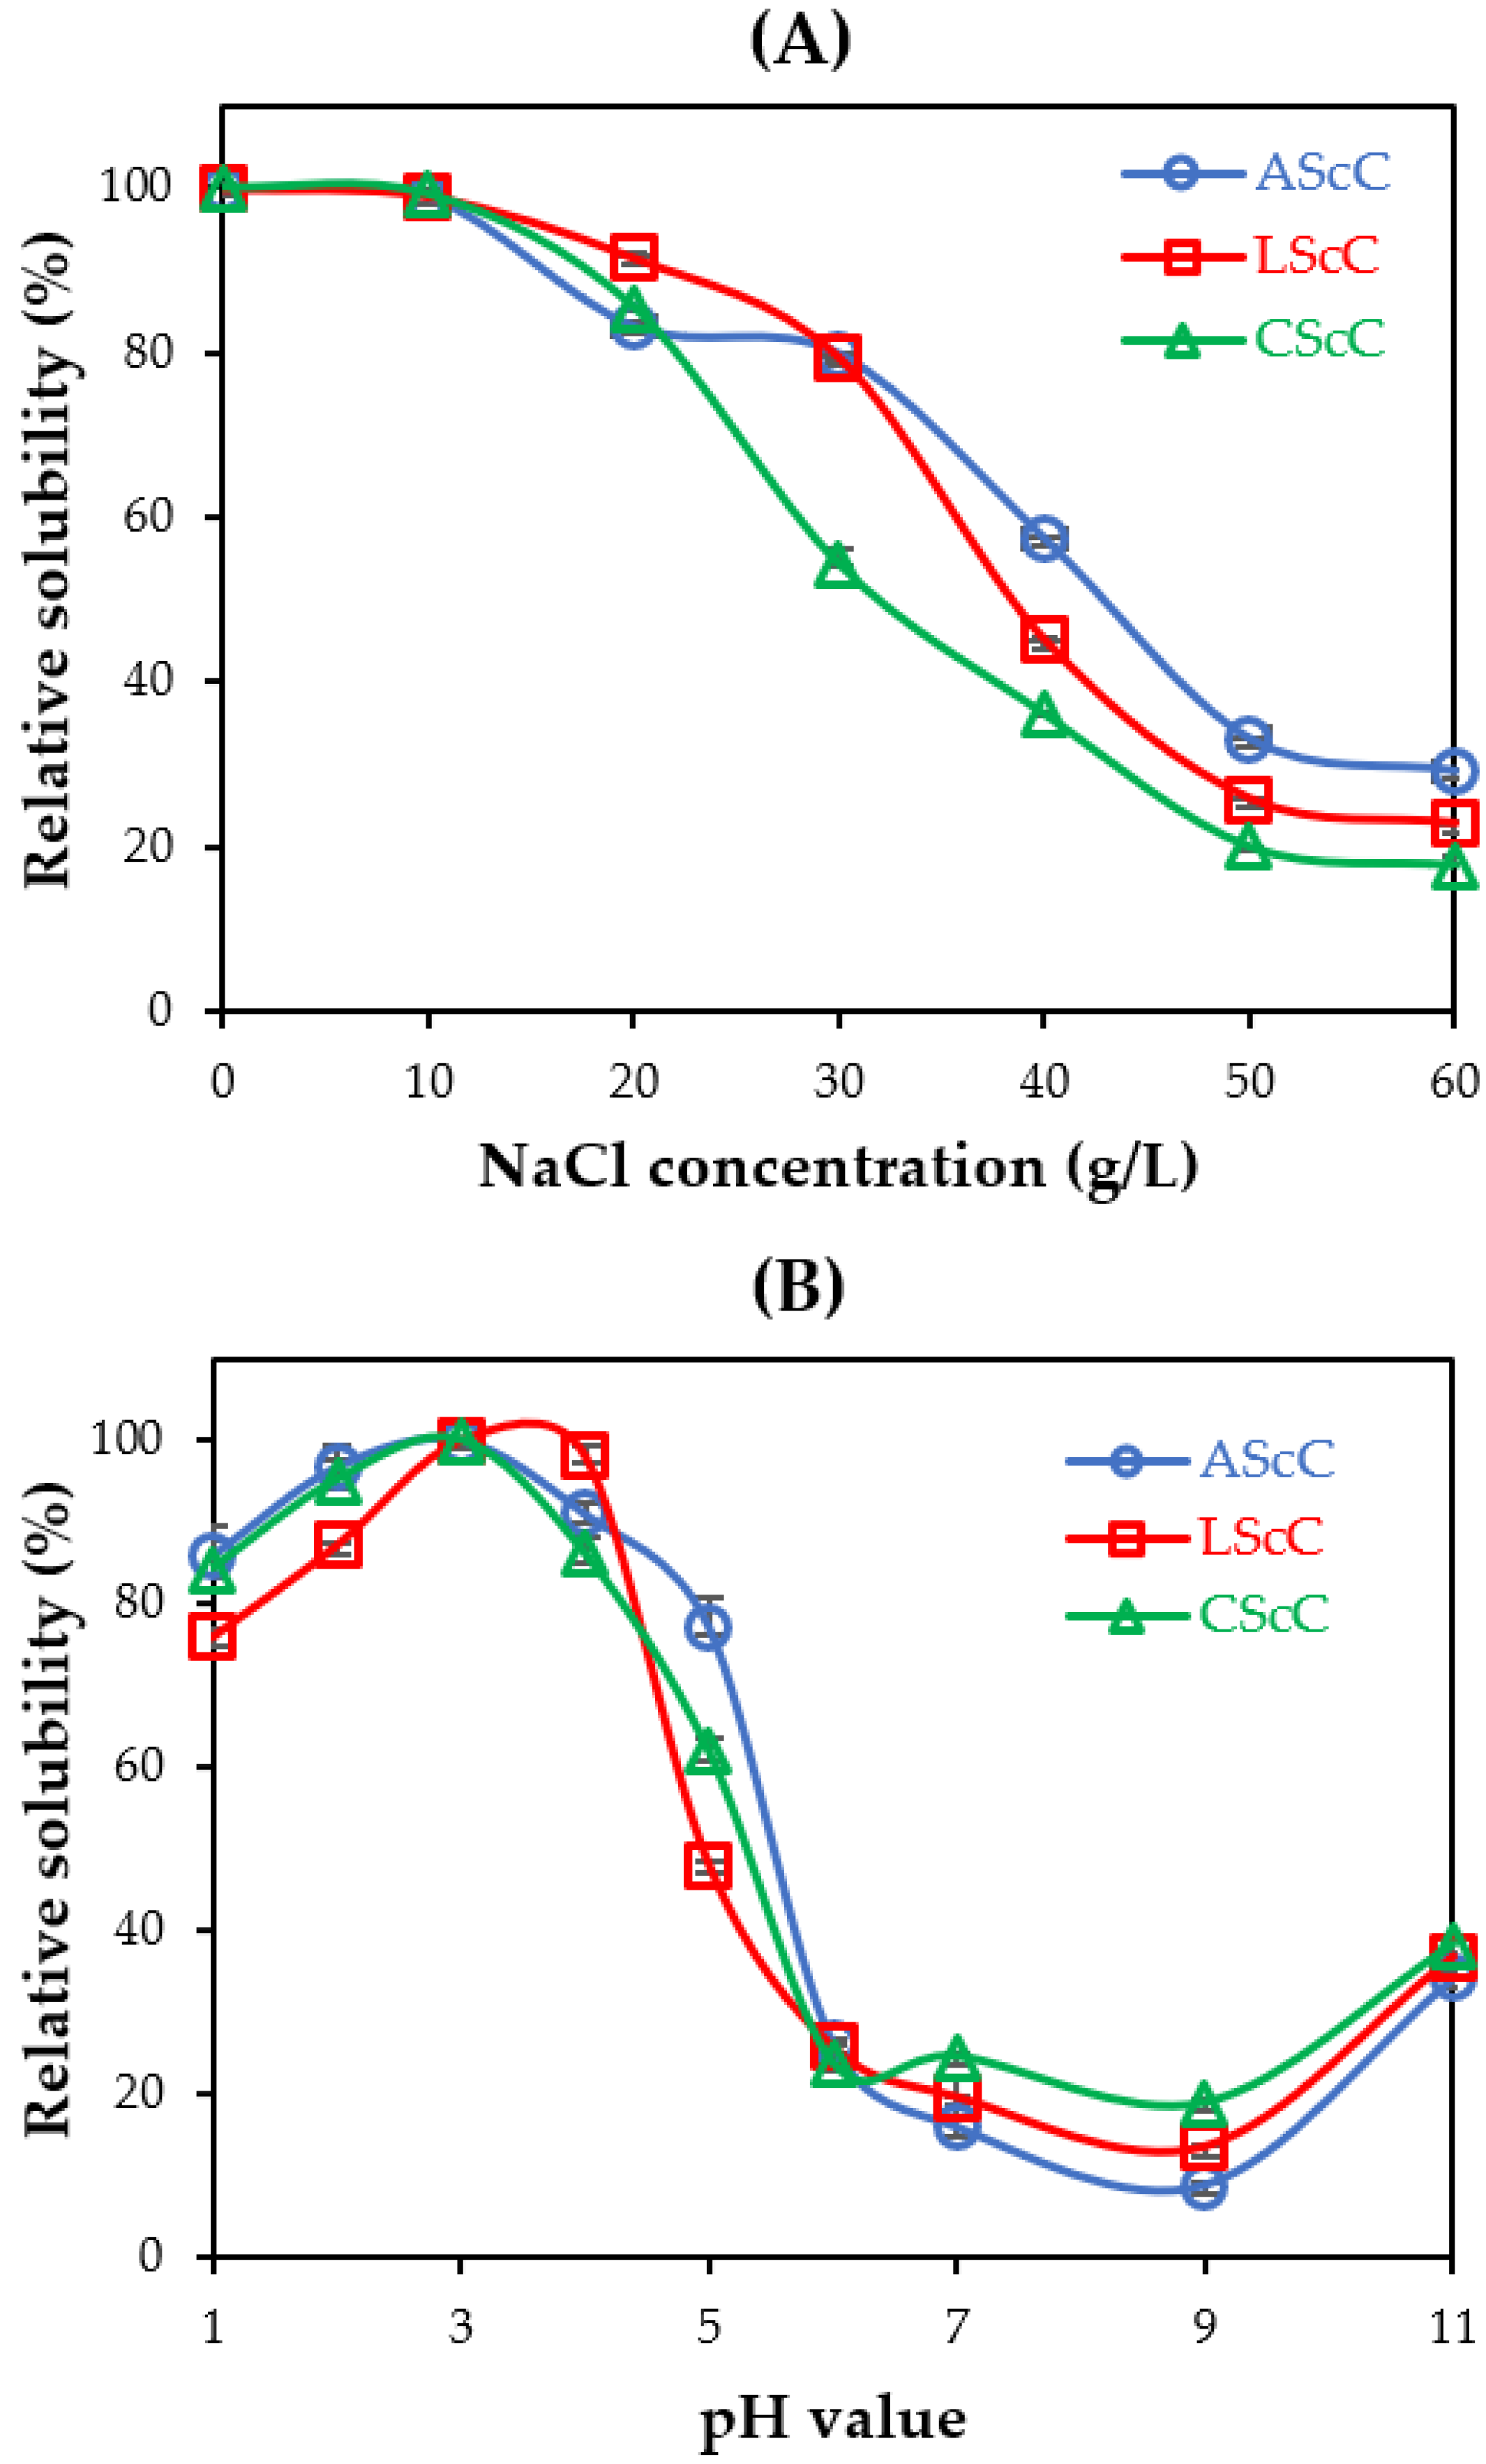
2.9. Solubility
3. Conclusions
4. Materials and Methods
4.1. Chemicals
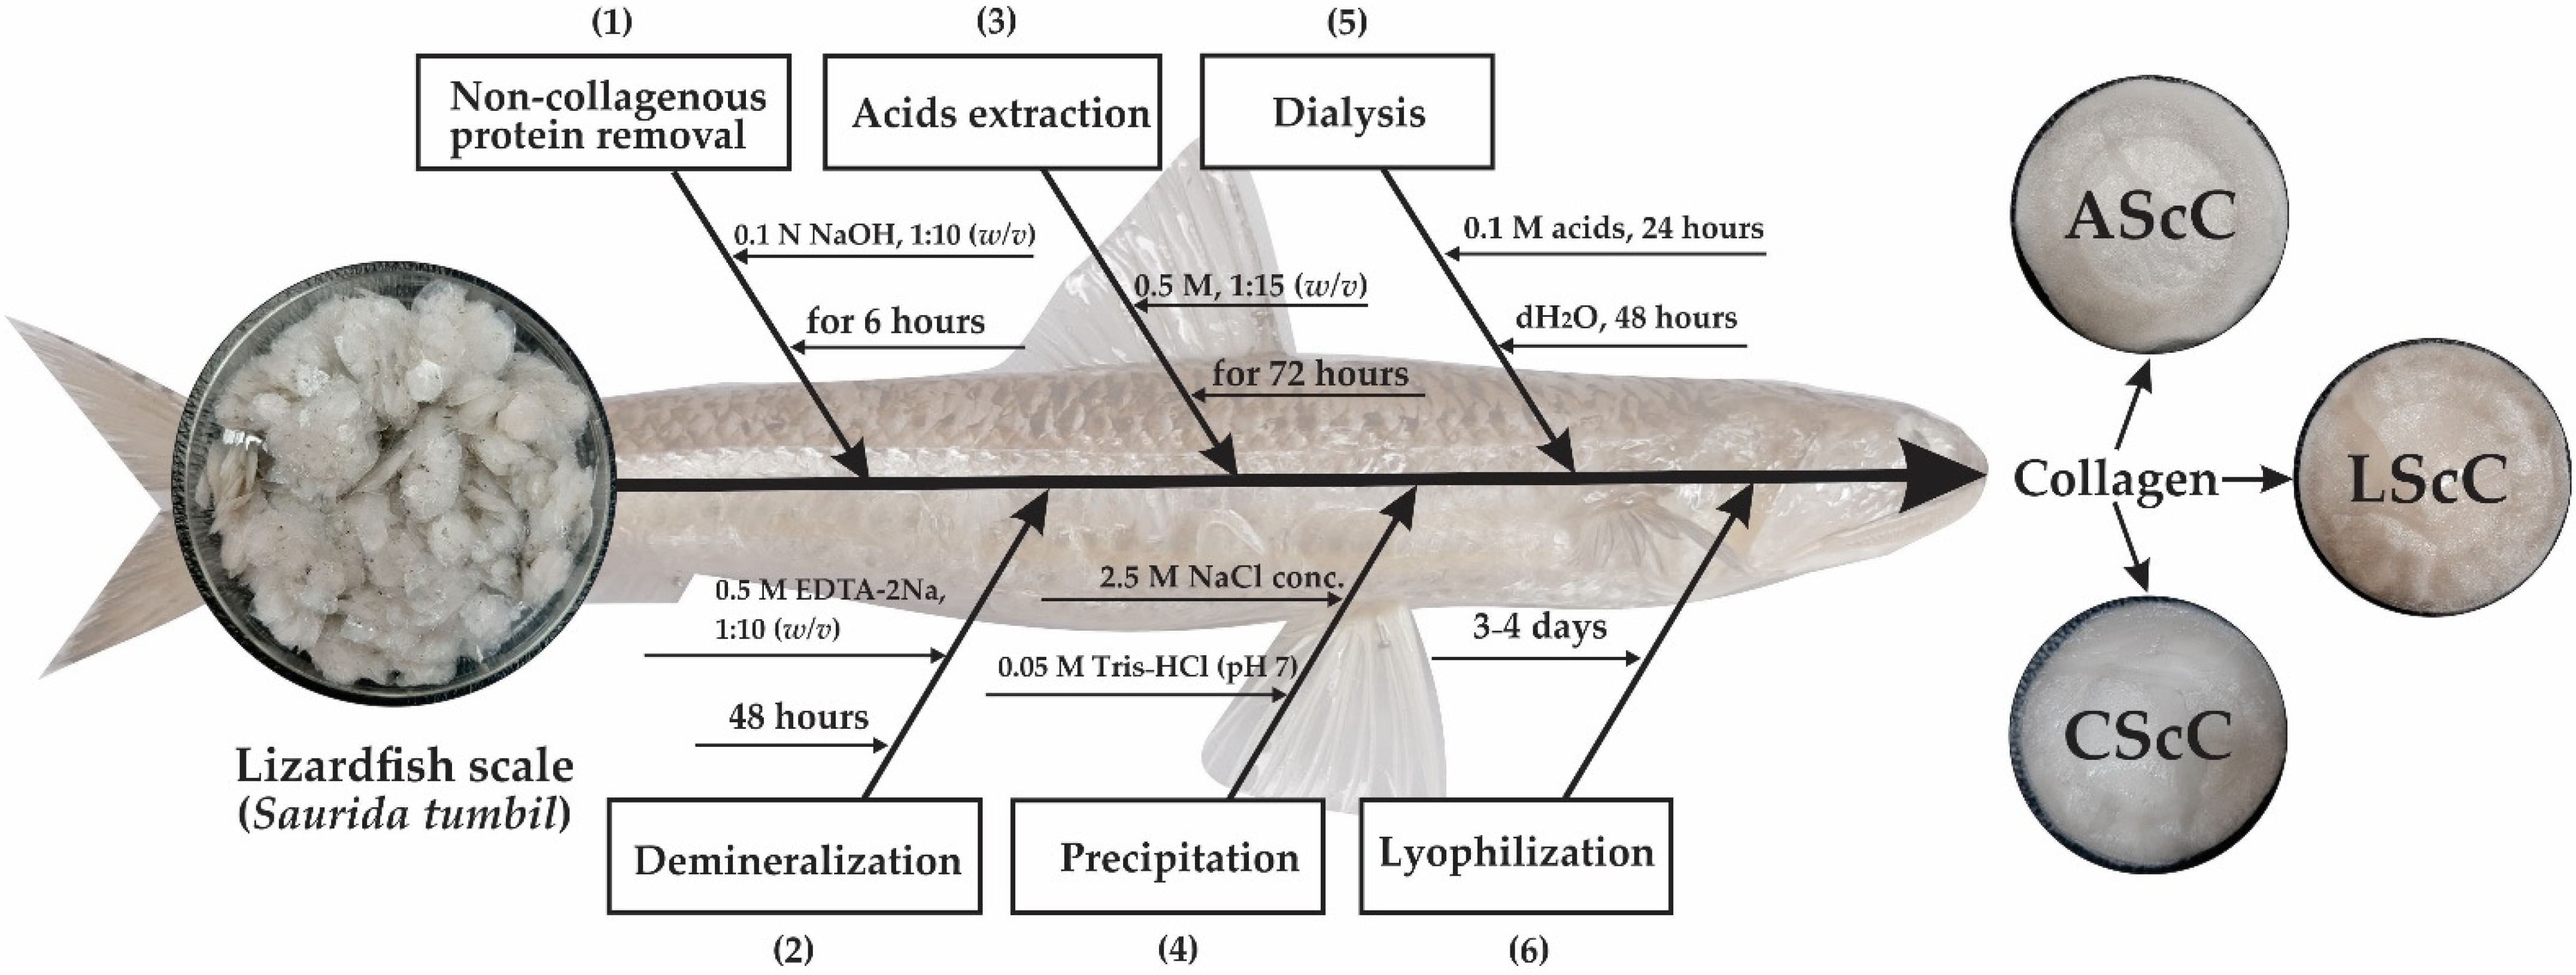
4.2. Preparation of Lizardfish Scales
4.3. Preparation of Acid-Extracted Collagens
4.4. Determination of Yield and Hydoxyproline
4.5. Analysis of Color Attributes
4.6. Sodium Dodecyl Sulfate-Polyacrylamide Gel Electrophoresis (SDS-PAGE)
4.7. Ultraviolet-Visible (UV-Vis) Absorption Spectra
4.8. Attenuated Total Reflectance–Fourier Transform Infrared Spectroscopy (ATR–FTIR)
4.9. Analysis of X-ray Diffraction (XRD)
4.10. Differential Scanning Calorimetry (DSC)
4.11. Field Emission Scanning Electron Microscopy (FESEM)
4.12. Solubility Test at Different NaCl Concentrations and pH Conditions
4.13. Statistical Analysis
Author Contributions
Funding
Institutional Review Board Statement
Informed Consent Statement
Data Availability Statement
Acknowledgments
Conflicts of Interest
References
- Sorushanova, A.; Delgado, L.M.; Wu, Z.; Shologu, N.; Kshirsagar, A.; Raghunath, R.; Mullen, A.M.; Bayon, Y.; Pandit, A.; Raghunath, M.; et al. The Collagen Suprafamily: From Biosynthesis to Advanced Biomaterial Development. Adv. Mater. 2019, 31, e1801651. [Google Scholar] [CrossRef] [PubMed] [Green Version]
- Shoulders, M.D.; Raines, R.T. Collagen structure and stability. Annu. Rev. Biochem. 2009, 78, 929–958. [Google Scholar] [CrossRef] [PubMed] [Green Version]
- Huda, N.; Seow, E.K.; Normawati, M.N.; Nik Aisyah, N.M.; Fazilah, A.; Easa, A.M. Effect of duck feet collagen addition on physicochemical properties of surimi. Int. Food Res. J. 2013, 20, 537–544. [Google Scholar]
- Lim, Y.-S.; Ok, Y.-J.; Hwang, S.-Y.; Kwak, J.-Y.; Yoon, S. Marine Collagen as a Promising Biomaterial for Biomedical Applications. Mar. Drugs 2019, 17, 467. [Google Scholar] [CrossRef] [PubMed] [Green Version]
- Coppola, D.; Oliviero, M.; Vitale, G.A.; Lauritano, C.; D’Ambra, I.; Iannace, S.; De Pascale, D. Marine Collagen from Alternative and Sustainable Sources: Extraction, Processing and Applications. Mar. Drugs 2020, 18, 214. [Google Scholar] [CrossRef] [Green Version]
- Jaziri, A.A.; Muyasyaroh, H.; Firdaus, M. Effect of phosphoric acid concentration on physicochemical properties of Abalistes stellaris skin gelatin. In IOP Conference Series: Earth and Environmental Science; IOP Publishing: Bristol, UK, 2020; Volume 493, p. 12038. [Google Scholar]
- Zhang, X.; Xu, S.; Shen, L.; Li, G. Factors affecting thermal stability of collagen from the aspects of extraction, processing and modification. J. Leather Sci. Eng. 2020, 2, 19. [Google Scholar] [CrossRef]
- Ahmed, R.; Haq, M.; Chun, B.-S. Characterization of marine derived collagen extracted from the by-products of bigeye tuna (Thunnus obesus). Int. J. Biol. Macromol. 2019, 135, 668–676. [Google Scholar] [CrossRef]
- Wang, H.; Liang, Y.; Wang, H.; Zhang, H.; Wang, M.; Liu, L. Physical-Chemical Properties of Collagens from Skin, Scale, and Bone of grass carp (Ctenopharyngodon idellus). J. Aquat. Food Prod. Technol. 2014, 23, 264–277. [Google Scholar] [CrossRef]
- Li, Z.-R.; Wang, B.; Chi, C.-F.; Zhang, Q.-H.; Gong, Y.-D.; Tang, J.-J.; Luo, H.Y.; Ding, G.-F. Isolation and characterization of acid soluble collagens and pepsin soluble collagens from the skin and bone of Spanish mackerel (Scomberomorous niphonius). Food Hydrocoll. 2013, 31, 103–113. [Google Scholar] [CrossRef]
- Jaziri, A.A.; Shapawi, R.; Mokhtar, R.A.M.; Noordin, W.N.M.; Huda, N. Biochemical analysis of collagens from the bone of Lizardfish (Saurida tumbil Bloch, 1795) extracted with different acids. PeerJ 2022, 10, e13103. [Google Scholar] [CrossRef]
- Jaziri, A.A.; Shapawi, R.; Mokhtar, R.A.M.; Noordin, W.N.M.; Huda, N. Microstructural and Physicochemical Analysis of Collagens from the Skin of Lizardfish (Saurida tumbil Bloch, 1795) Extracted with Different Organic Acids. Molecules 2022, 27, 2452. [Google Scholar] [CrossRef]
- Atef, M.; Ojagh, S.M.; Latifi, A.M.; Esmaeili, M.; Udenigwe, C.C. Biochemical and structural characterization of sturgeon fish skin collagen (Huso huso). J. Food Biochem. 2020, 44, e13256. [Google Scholar] [CrossRef] [PubMed]
- Liao, W.; Guanghua, X.; Li, Y.; Shen, X.R.; Li, C. Comparison of characteristics and fibril-forming ability of skin collagen from barramundi (Lates calcarifer) and tilapia (Oreochromis niloticus). Int. J. Biol. Macromol. 2018, 107, 549–559. [Google Scholar] [CrossRef] [PubMed]
- Thuy, L.T.M.; Okazaki, E.; Osako, K. Isolation and characterization of acid-soluble collagen from the scales of marine fishes from Japan and Vietnam. Food Chem. 2014, 149, 264–270. [Google Scholar] [CrossRef]
- Upasen, S.; Naeramitmarnsuk, K.; Antonio, C.; Roces, S.; Morillas, H.; Wattanachai, P. Acid-Pepsin Soluble Collagen from Saltwater and Freshwater Fish Scales. Eng. J. 2019, 23, 183–195. [Google Scholar] [CrossRef]
- Moniruzzaman, S.M.; Takahashi, K.; Nesa, N.U.; Keratimanoch, S.; Okazaki, E.; Osako, K. Characterization of Acid- and Pepsin-soluble Collagens Extracted from Scales of Carp and Lizardfish Caught in Japan, Bangladesh and Vietnam with a Focus on Thermostability. Food Sci. Technol. Res. 2019, 25, 331–340. [Google Scholar] [CrossRef]
- Li, L.-Y.; Zhao, Y.-Q.; He, Y.; Chi, C.-F.; Wang, B. Physicochemical and Antioxidant Properties of Acid- and Pepsin-Soluble Collagens from the Scales of Miiuy croaker (Miichthys miiuy). Mar. Drugs 2018, 16, 394. [Google Scholar] [CrossRef] [Green Version]
- Jongjareonrak, A.; Benjakul, S.; Visessanguan, W.; Nagai, T.; Tanaka, M. Isolation and characterisation of acid and pep-sin-solubilised collagens from the skin of brownstripe red snapper (Lutjanus vitta). Food Chem. 2005, 93, 475–484. [Google Scholar] [CrossRef]
- Skierka, E.; Sadowska, M. The influence of different acids and pepsin on the extractability of collagen from the skin of baltic cod (Gadus morhua). Food Chem. 2007, 105, 1302–1306. [Google Scholar] [CrossRef]
- Liu, D.; Wei, G.; Li, T.; Hu, J.; Lu, N.; Regenstein, J.M.; Zhou, P. Effects of alkaline pretreatments and acid extraction conditions on the acid-soluble collagen from grass carp (Ctenopharyngodon idella) skin. Food Chem. 2015, 172, 836–843. [Google Scholar] [CrossRef]
- Jaziri, A.A.; Shapawi, R.; Mokhtar, R.A.M.; Noordin, W.N.M.; Huda, N. Tropical Marine Fish Surimi By-products: Utilisation and Potential as Functional Food Application. Food Rev. Int. 2021, 37, 1–26. [Google Scholar] [CrossRef]
- Saurida Tumbil (Bloch, 1795). Available online: https://www.fishbase.se/summary/6479 (accessed on 25 February 2022).
- The Department of Fisheries Malaysia. Fisheries Statistic. Available online: https://www.dof.gov.my/index.php/pages/view/82 (accessed on 2 January 2022).
- Nawaz, A.; Li, E.; Irshad, S.; Xiong, Z.; Xiong, H.; Shahbaz, H.M.; Siddique, F. Valorization of fisheries by-products: Challenges and technical concerns to food industry. Trends Food Sci. Technol. 2020, 99, 34–43. [Google Scholar] [CrossRef]
- Jaziri, A.A.; Shapawi, R.; Mokhtar, R.A.M.; Noordin, W.N.M.; Huda, N. Chemical Composition of Lizardfish Surimi By-Product: Focus on Macro and Micro-Minerals Contents. Curr. Res. Nutr. Food Sci. J. 2021, 9, 52–61. [Google Scholar] [CrossRef]
- Chuaychan, S.; Benjakul, S.; Kishimura, H. Characteristics of acid- and pepsin-soluble collagens from scale of seabass (Lates calcarifer). LWT Food Sci. Technol. 2015, 63, 71–76. [Google Scholar] [CrossRef]
- Matmaroh, K.; Benjakul, S.; Prodpran, T.; Encarnacion, A.B.; Kishimura, H. Characteristics of acid soluble collagen and pepsin soluble collagen from scale of spotted golden goatfish (Parupeneus heptacanthus). Food Chem. 2011, 129, 1179–1186. [Google Scholar] [CrossRef]
- Kittiphattanabawon, P.; Sriket, C.; Kishimura, H.; Benjakul, S. Characteristics of acid and pepsin solubilized collagens from Nile tilapia (Oreochromis niloticus) scale. Emir. J. Food Agric. 2019, 31, 95–101. [Google Scholar] [CrossRef]
- Kittiphattanabawon, P.; Benjakul, S.; Visessanguan, W.; Nagai, T.; Tanaka, M. Characterisation of acid-soluble collagen from skin and bone of bigeye snapper (Priacanthus tayenus). Food Chem. 2005, 89, 363–372. [Google Scholar] [CrossRef]
- Zylberberg, L.; Bereiter-Hahn, J.; Sire, J.-Y. Cytoskeletal organization and collagen orientation in the fish scales. Cell Tissue Res. 1988, 253, 597–607. [Google Scholar] [CrossRef]
- Nalinanon, S.; Benjakul, S.; Visessanguan, W.; Kishimura, H. Use of pepsin for collagen extraction from the skin of bigeye snapper (Priacanthus tayenus). Food Chem. 2007, 104, 593–601. [Google Scholar] [CrossRef]
- Regenstein, J.; Zhou, P. Collagen and gelatin from marine by-products. In Maximising the Value of Marine by-Products, 1st ed.; Shahidi, F., Ed.; Woodhead Publishing Limited: Cambridge, UK; CRC Press LLC: Boca Raton, FL, USA, 2006; pp. 273–303. [Google Scholar]
- Sadowska, M.; Kołodziejska, I.; Niecikowska, C. Isolation of collagen from the skins of baltic cod (Gadus morhua). Food Chem. 2003, 81, 257–262. [Google Scholar] [CrossRef]
- Bakar, J.; Hartina, U.M.R.; Hashim, M.D.; Sazili, A.Q. Properties of collagen from barramundi (Lates calcarifer) skin. Int. Food. Res. J. 2013, 20, 835–884. [Google Scholar]
- Liua, W.; Zhanga, Y.; Cuic, N.; Wang, T. Extraction and characterization of pepsin-solubilized collagen from snakehead (Channa argus) skin: Effects of hydrogen peroxide pretreatments and pepsin hydrolysis strategies. Process Biochem. 2019, 76, 194–202. [Google Scholar] [CrossRef]
- Benjakul, S.; Thiansilakul, Y.; Visessanguan, W.; Roytrakul, S.; Kishimura, H.; Prodpran, T. Extraction and characterisation of pepsin solubilised collagens from the skin of bigeye snapper (Priacanthus tayenus and Priacanthus macracanthus). J. Sci. Food Agric. 2010, 90, 132–138. [Google Scholar] [CrossRef] [PubMed]
- Ogawa, M.; Portier, R.J.; Moody, M.W.; Bell, J.; Schexnayder, M.A.; Losso, J.N. Biochemical properties of bone and scale col-lagens isolated from the subtropical fish black drum (Pogonia cromis) and sheepshead seabream (Archosargus probatocephalus). Food Chem. 2004, 88, 495–501. [Google Scholar] [CrossRef]
- Hadfi, N.; Sarbon, N. Physicochemical properties of silver catfish (Pangasius sp.) skin collagen as influenced by acetic acid concentration. Food Res. 2019, 3, 783–790. [Google Scholar] [CrossRef]
- Wu, Q.-Q.; Li, T.; Wang, B.; Ding, G.-F. Preparation and characterization of acid and pepsin-soluble collagens from scales of croceine and redlip croakers. Food Sci. Biotechnol. 2015, 24, 2003–2010. [Google Scholar] [CrossRef]
- Yu, D.; Chi, C.-F.; Wang, B.; Ding, G.-F.; Li, Z.-R. Characterization of acid-and pepsin-soluble collagens from spines and skulls of skipjack tuna (Katsuwonus pelamis). Chin. J. Nat. Med. 2014, 12, 712–720. [Google Scholar] [CrossRef]
- Chen, S.; Chen, H.; Xie, Q.; Hong, B.; Chen, J.; Hua, F.; Bai, K.; He, J.; Yi, R.; Wu, H. Rapid isolation of high purity pep-sin-soluble type I collagen from scales of red drum fish (Sciaenops ocellatus). Food Hydrocoll. 2016, 52, 468–477. [Google Scholar] [CrossRef]
- Kozlowska, J.; Sionkowska, A.; Skopinska-Wisniewska, J.; Piechowicz, K. Northern pike (Esox lucius) collagen: Extraction, characterization and potential application. Int. J. Biol. Macromol. 2015, 81, 220–227. [Google Scholar] [CrossRef]
- Iswariya, S.; Velswamy, P.; Uma, T.S. Isolation and Characterization of Biocompatible Collagen from the Skin of Puffer Fish (Lagocephalus inermis). J. Polym. Environ. 2018, 26, 2086–2095. [Google Scholar] [CrossRef]
- Chen, J.; Li, L.; Yi, R.; Xu, N.; Gao, R.; Hong, B. Extraction and characterization of acid-soluble collagen from scales and skin of tilapia (Oreochromis niloticus). LWT Food Sci. Technol. 2016, 66, 453–459. [Google Scholar] [CrossRef]
- Doyle, B.B.; Bendit, E.G.; Blout, E.R. Infrared spectroscopy of collagen and collagen-like polypeptides. Biopolymers 1975, 14, 937–957. [Google Scholar] [CrossRef] [PubMed]
- Abe, Y.; Krimm, S. Normal vibrations of crystalline polyglycine I. Biopolymers 1972, 11, 1817–1839. [Google Scholar] [CrossRef] [Green Version]
- Muyonga, J.H.; Cole, C.G.B.; Duodu, K.G. Fourier transform infrared (FTIR) spectroscopic study of acid soluble collagen and gelatin from skins and bones of young and adult nile perch (Lates niloticus). Food Chem. 2004, 86, 325–332. [Google Scholar] [CrossRef]
- Nikoo, M.; Benjakul, S.; Ocen, D.; Yang, N.; Xu, B.; Zhang, L.; Xu, X. Physical and chemical properties of gelatin from the skin of cultured amur sturgeon (Acipenser schrenckii). J. Appl. Ichthyol. 2013, 29, 943–950. [Google Scholar] [CrossRef]
- Plepis, A.M.D.G.; Goissis, G.; Das-Gupta, D.K. Dielectric and pyroelectric characterization of anionic and native collagen. Polym. Eng. Sci. 1996, 36, 2932–2938. [Google Scholar] [CrossRef]
- Ong, T.; Shaik, M.; Sarbon, N. Isolation and characterization of acid and pepsin soluble collagen extracted from sharpnose stingray (Dasyatis zugei) skin. Food Res. 2021, 5, 214–224. [Google Scholar] [CrossRef]
- Zhang, F.; Wang, A.; Lijun, S.; He, S.; Shao, L. Preparation and Characterisation of Collagen from Freshwater Fish Scales. Food Nutr. Sci. 2011, 2, 818–823. [Google Scholar] [CrossRef] [Green Version]
- Reátegui-Pinedo, N.; Salirrosas, D.; Sánchez-Tuesta, L.; Quiñones, C.; Jáuregui-Rosas, S.R.; Barraza, G.; Cabrera, A.; Ayala-Jara, C.; Martinez, R.M.; Baby, A.R.; et al. Characterization of Collagen from Three Genetic Lines (Gray, Red and F1) of Oreochromis niloticus (tilapia) Skin in Young and Old Adults. Molecules 2022, 27, 1123. [Google Scholar] [CrossRef]
- Sun, L.; Hou, H.; Li, B.; Zhang, Y. Characterization of acid- and pepsin-soluble collagen extracted from the skin of Nile tilapia (Oreochromis niloticus). Int. J. Biol. Macromol. 2017, 99, 8–14. [Google Scholar] [CrossRef]
- Bae, I.; Osatomi, K.; Yoshida, A.; Osako, K.; Yamaguchi, A.; Hara, K. Biochemical properties of acid-soluble collagens extracted from the skins of underutilised fishes. Food Chem. 2008, 108, 49–54. [Google Scholar] [CrossRef]
- Zhang, J.; Duan, R.; Ye, C.; Konno, K. Isolation and Characterization of Collagens from Scale of silver carp (Hypophthalmichthys molitrix). J. Food Biochem. 2010, 34, 1343–1354. [Google Scholar] [CrossRef]
- Schuetz, T.; Richmond, N.; Harmon, M.E.; Schuetz, J.; Castaneda, L.; Slowinska, K. The microstructure of collagen type I gel cross-linked with gold nanoparticles. Colloids Surf. B Biointerfaces 2012, 101, 118–125. [Google Scholar] [CrossRef] [Green Version]
- Bhuimbar, M.V.; Bhagwat, P.K.; Dandge, P.B. Extraction and characterization of acid soluble collagen from fish waste: De-velopment of collagen-chitosan blend ad food packaging film. J. Environ. Chem. Eng. 2019, 7, 102983. [Google Scholar] [CrossRef]
- Veeruraj, A.; Arumugam, M.; Balasubramanian, T. Isolation and characterization of thermostable collagen from the marine eel-fish (Evenchelys macrura). Process Biochem. 2013, 48, 1592–1602. [Google Scholar] [CrossRef]
- Mosquera, M.; Giménez, B.; da Silva, I.M.; Boelter, J.F.; Montero, P.; Gómez-Guillén, M.C.; Brandelli, A. Nanoencapsulation of an active peptidic fraction from sea bream scales collagen. Food Chem. 2014, 156, 144–150. [Google Scholar] [CrossRef]
- Bergman, I.; Loxley, R. Two Improved and Simplified Methods for the Spectrophotometric Determination of Hydroxyproline. Anal. Chem. 1963, 35, 1961–1965. [Google Scholar] [CrossRef]
- Huda, N.; Seow, E.K.; Normawati, M.; Aisyah, N.N. Preliminary Study on Physicochemical Properties of Duck Feet Collagen. Int. J. Poult. Sci. 2013, 12, 615–621. [Google Scholar] [CrossRef] [Green Version]
- Briones, V.; Aguilera, J.M. Image analysis of changes in surface color of chocolate. Food Res. Int. 2005, 38, 87–94. [Google Scholar] [CrossRef]
- Laemmli, U.K. Cleavage of Structural Proteins during the Assembly of the Head of Bacteriophage T4. Nature 1970, 227, 680–685. [Google Scholar] [CrossRef]
- Lowry, O.H.; Rosebrough, N.J.; Farr, A.L.; Randall, R.J. Protein measurement with the Folin phenol reagent. J. Biol. Chem. 1951, 193, 265–275. [Google Scholar] [CrossRef]


| Sample | Yield (g/100 g) | Hyp (mg/g) | Total Collagen (mg/g) | References |
|---|---|---|---|---|
| AScC | 0.18 ± 0.03 a | 83.29 ± 0.42 a | 641.34 ± 0.34 a | This study |
| LScC | 0.16 ± 0.04 a | 78.39 ± 0.1 c | 603.64 ± 0.87 c | This study |
| CScC | 0.13 ± 0.02 a | 80.94 ± 0.20 b | 623.22 ± 1.51 b | This study |
| CSkC | - | 91.10 | 701.47 | [18] |
| BTcC | 0.05 ± 0.01 | 87.31 | 672.29 | [8] |
| SBcC | 0.38 | 85 | 654.50 | [27] |
| SGcC | 0.46 | 72 | 554.40 | [28] |
| MCcC | 0.64 | 85 | 654.50 | [18] |
| TScC | 0.77 | 86 | 662.20 | [29] |
| Sample | Color Attributes | References | |||
|---|---|---|---|---|---|
| L* | a* | b* | WI | ||
| AScC | 79.94 ± 0.06 a | 1.41 ± 0.15 c | 3.67 ± 0.12 a | 79.56 ± 0.58 a | This study |
| LScC | 76.25 ± 0.11 b | 3.11 ± 0.40 a | 8.21 ± 0.58 a | 74.68 ± 0.12 c | This study |
| CScC | 79.52 ± 0.36 a | 2.15 ± 0.15 b | 4.80 ± 0.57 a | 78.86 ± 0.36 b | This study |
| CSkC | 78.93 ± 0.59 a | −0.07 ± 0.03 d | 1.42 ± 0.27 b | 78.88 ± 0.58 b | This study |
| BSkC | 65.41 ± 0.08 | 0.14 ± 0.01 | 3.16 ± 0.03 | 65.27 | [35] |
| SSkC | 89.49 ± 0.28 | −0.30 ± 0.01 | 5.60 ± 0.13 | 88.09 | [36] |
| Peak Area | Peak Assignment | References | |||
|---|---|---|---|---|---|
| AScC | LScC | CScC | CSkC | ||
| 3276.41 | 3296.91 | 3285.73 | 3309.01 | Mainly N-H stretching coupled with hydrogen bond (Amide A) | [46] |
| 2931.62 | 2935.35 | 2926.03 | 2921.47 | CH2 asymmetric stretching (Amide B) | [47] |
| 1628.89 | 1628.89 | 1628.89 | 1635.87 | C=O stretching/hydrogen bond coupled with COO- (Amide I) | [48] |
| 1541.29 | 1541.29 | 1541.29 | 1542.71 | N-H bend coupled with C-N stretching (Amide II) | [48] |
| 1235.64 | 1235.64 | 1237.51 | 1237.15 | N-H bend coupled with C-H stretching (Amide III) | [48] |
Publisher’s Note: MDPI stays neutral with regard to jurisdictional claims in published maps and institutional affiliations. |
© 2022 by the authors. Licensee MDPI, Basel, Switzerland. This article is an open access article distributed under the terms and conditions of the Creative Commons Attribution (CC BY) license (https://creativecommons.org/licenses/by/4.0/).
Share and Cite
Jaziri, A.A.; Shapawi, R.; Mokhtar, R.A.M.; Noordin, W.N.M.; Huda, N. Biochemical and Microstructural Properties of Lizardfish (Saurida tumbil) Scale Collagen Extracted with Various Organic Acids. Gels 2022, 8, 266. https://doi.org/10.3390/gels8050266
Jaziri AA, Shapawi R, Mokhtar RAM, Noordin WNM, Huda N. Biochemical and Microstructural Properties of Lizardfish (Saurida tumbil) Scale Collagen Extracted with Various Organic Acids. Gels. 2022; 8(5):266. https://doi.org/10.3390/gels8050266
Chicago/Turabian StyleJaziri, Abdul Aziz, Rossita Shapawi, Ruzaidi Azli Mohd Mokhtar, Wan Norhana Md. Noordin, and Nurul Huda. 2022. "Biochemical and Microstructural Properties of Lizardfish (Saurida tumbil) Scale Collagen Extracted with Various Organic Acids" Gels 8, no. 5: 266. https://doi.org/10.3390/gels8050266
APA StyleJaziri, A. A., Shapawi, R., Mokhtar, R. A. M., Noordin, W. N. M., & Huda, N. (2022). Biochemical and Microstructural Properties of Lizardfish (Saurida tumbil) Scale Collagen Extracted with Various Organic Acids. Gels, 8(5), 266. https://doi.org/10.3390/gels8050266