
Investigation of Thermal Gel Formation of Methylcellulose in Glycols Using DSC and XRD

Abstract
:1. Introduction
2. Results and Discussion
2.1. Rheology
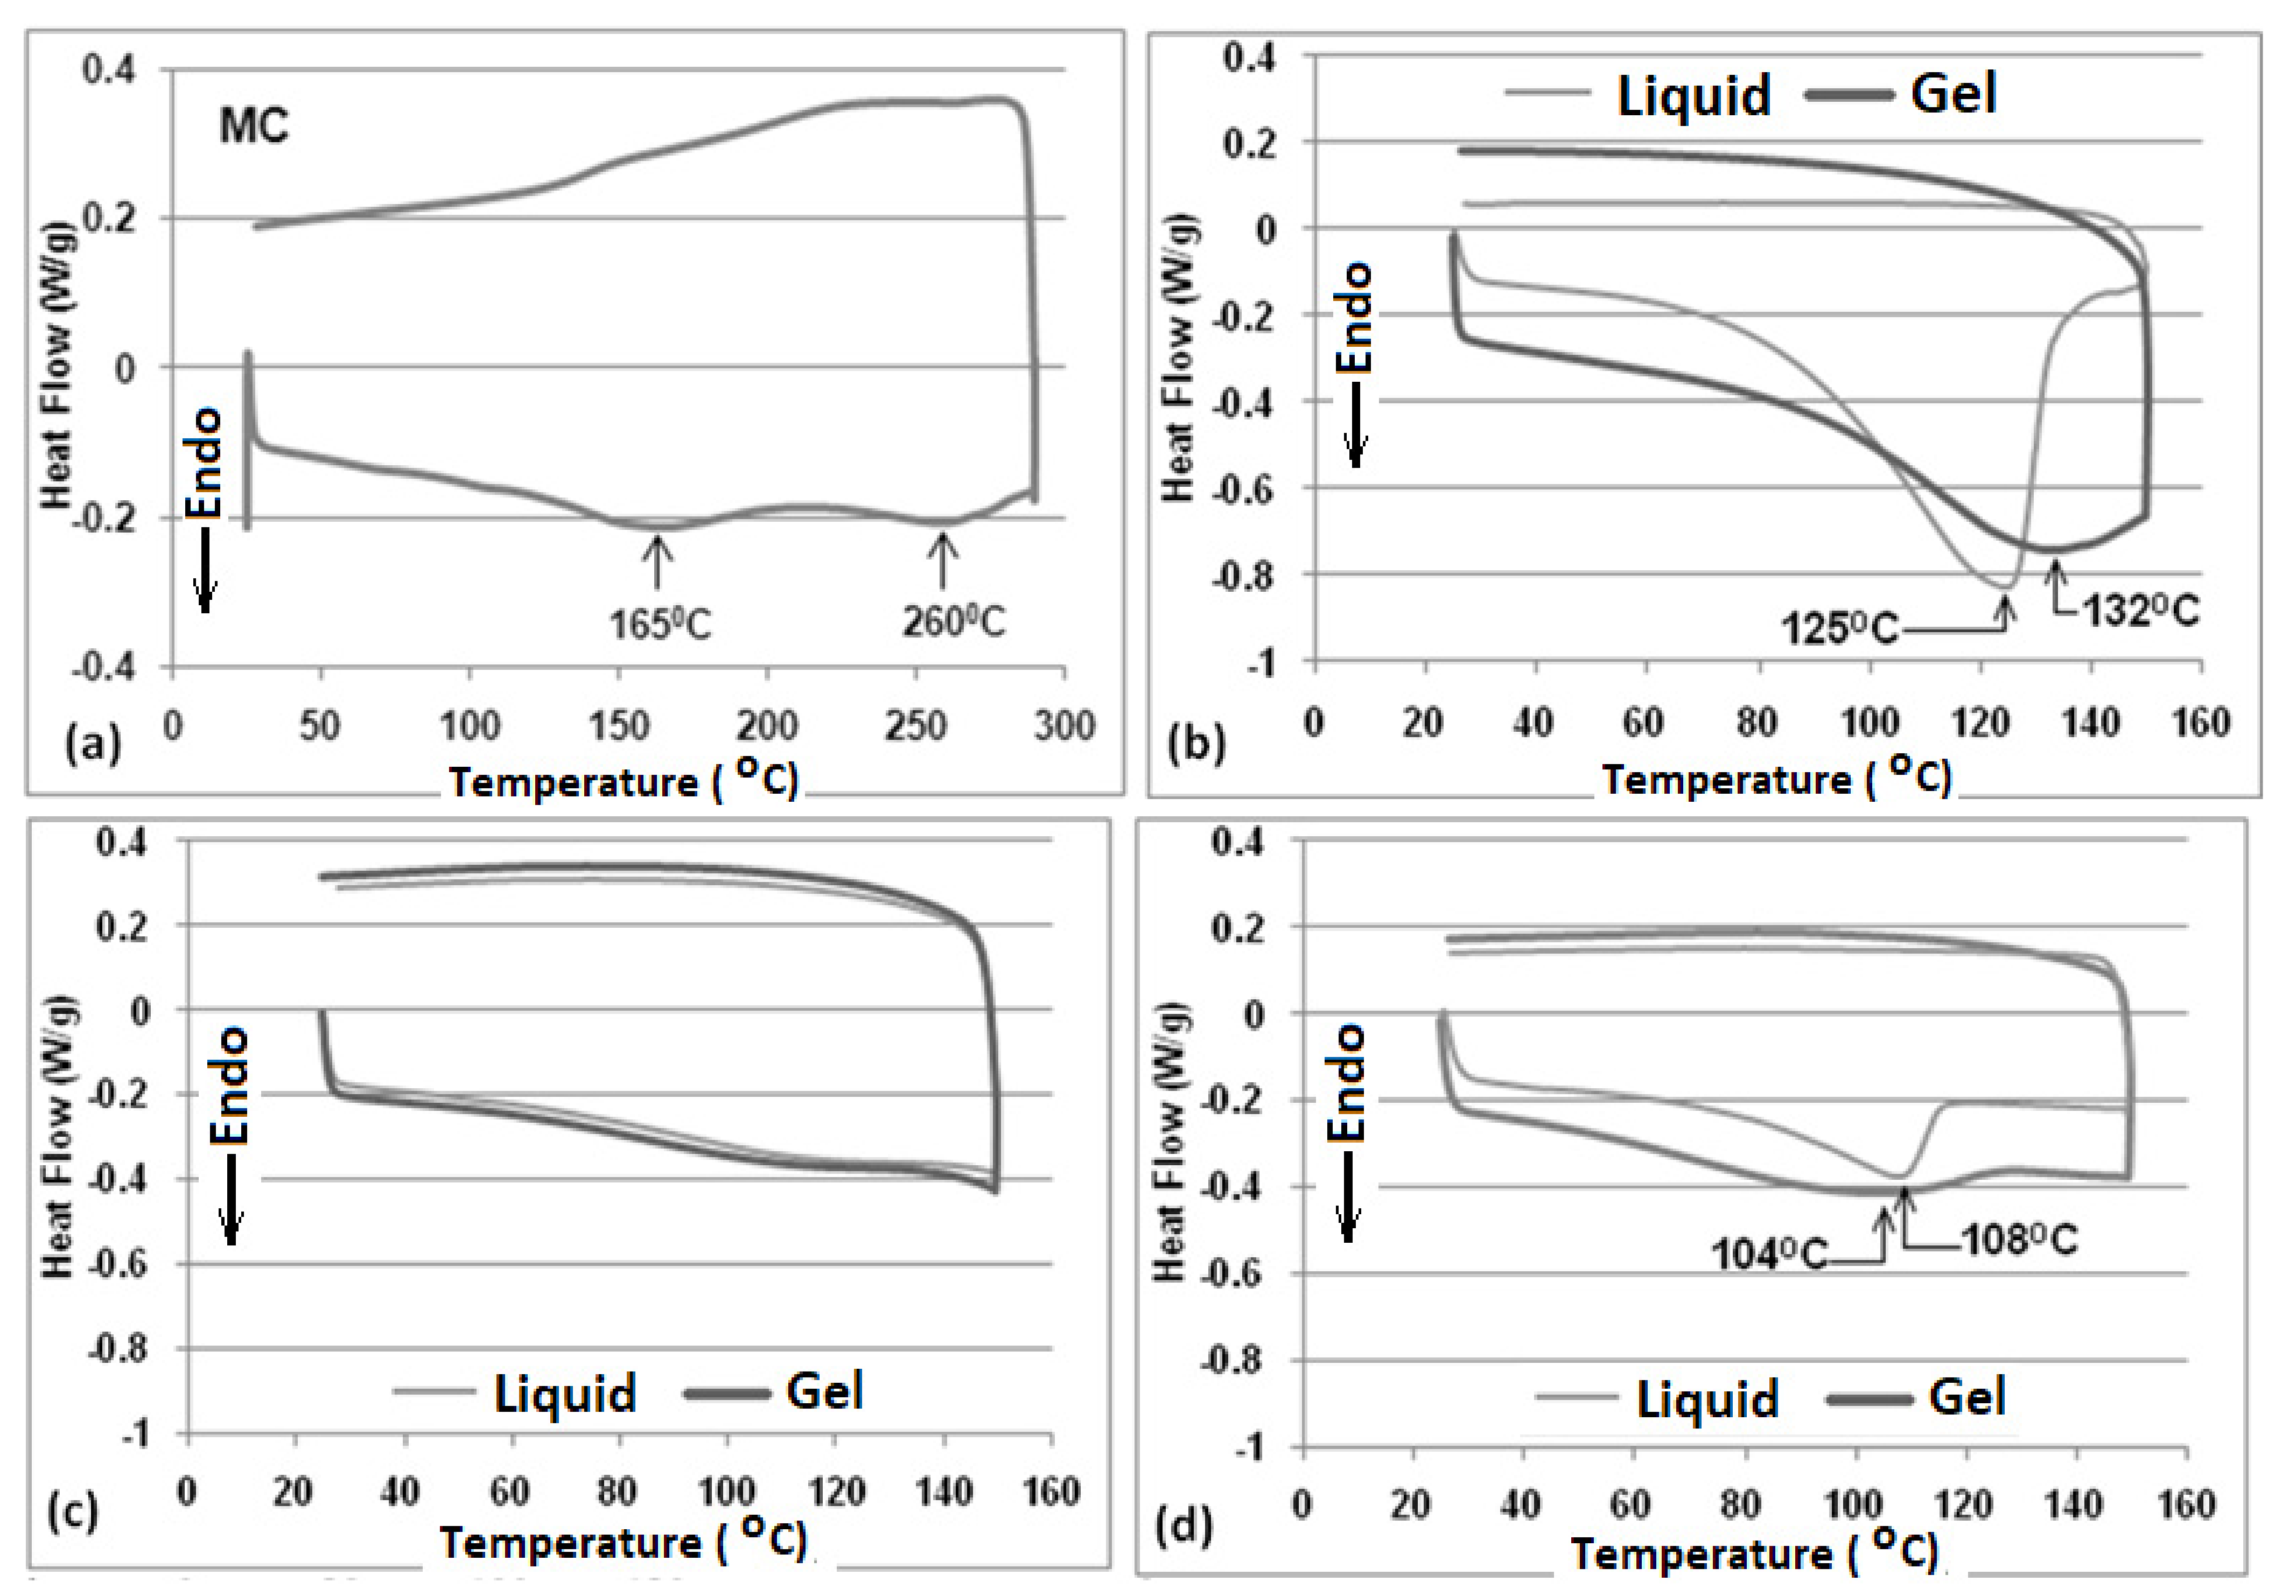
2.2. DSC
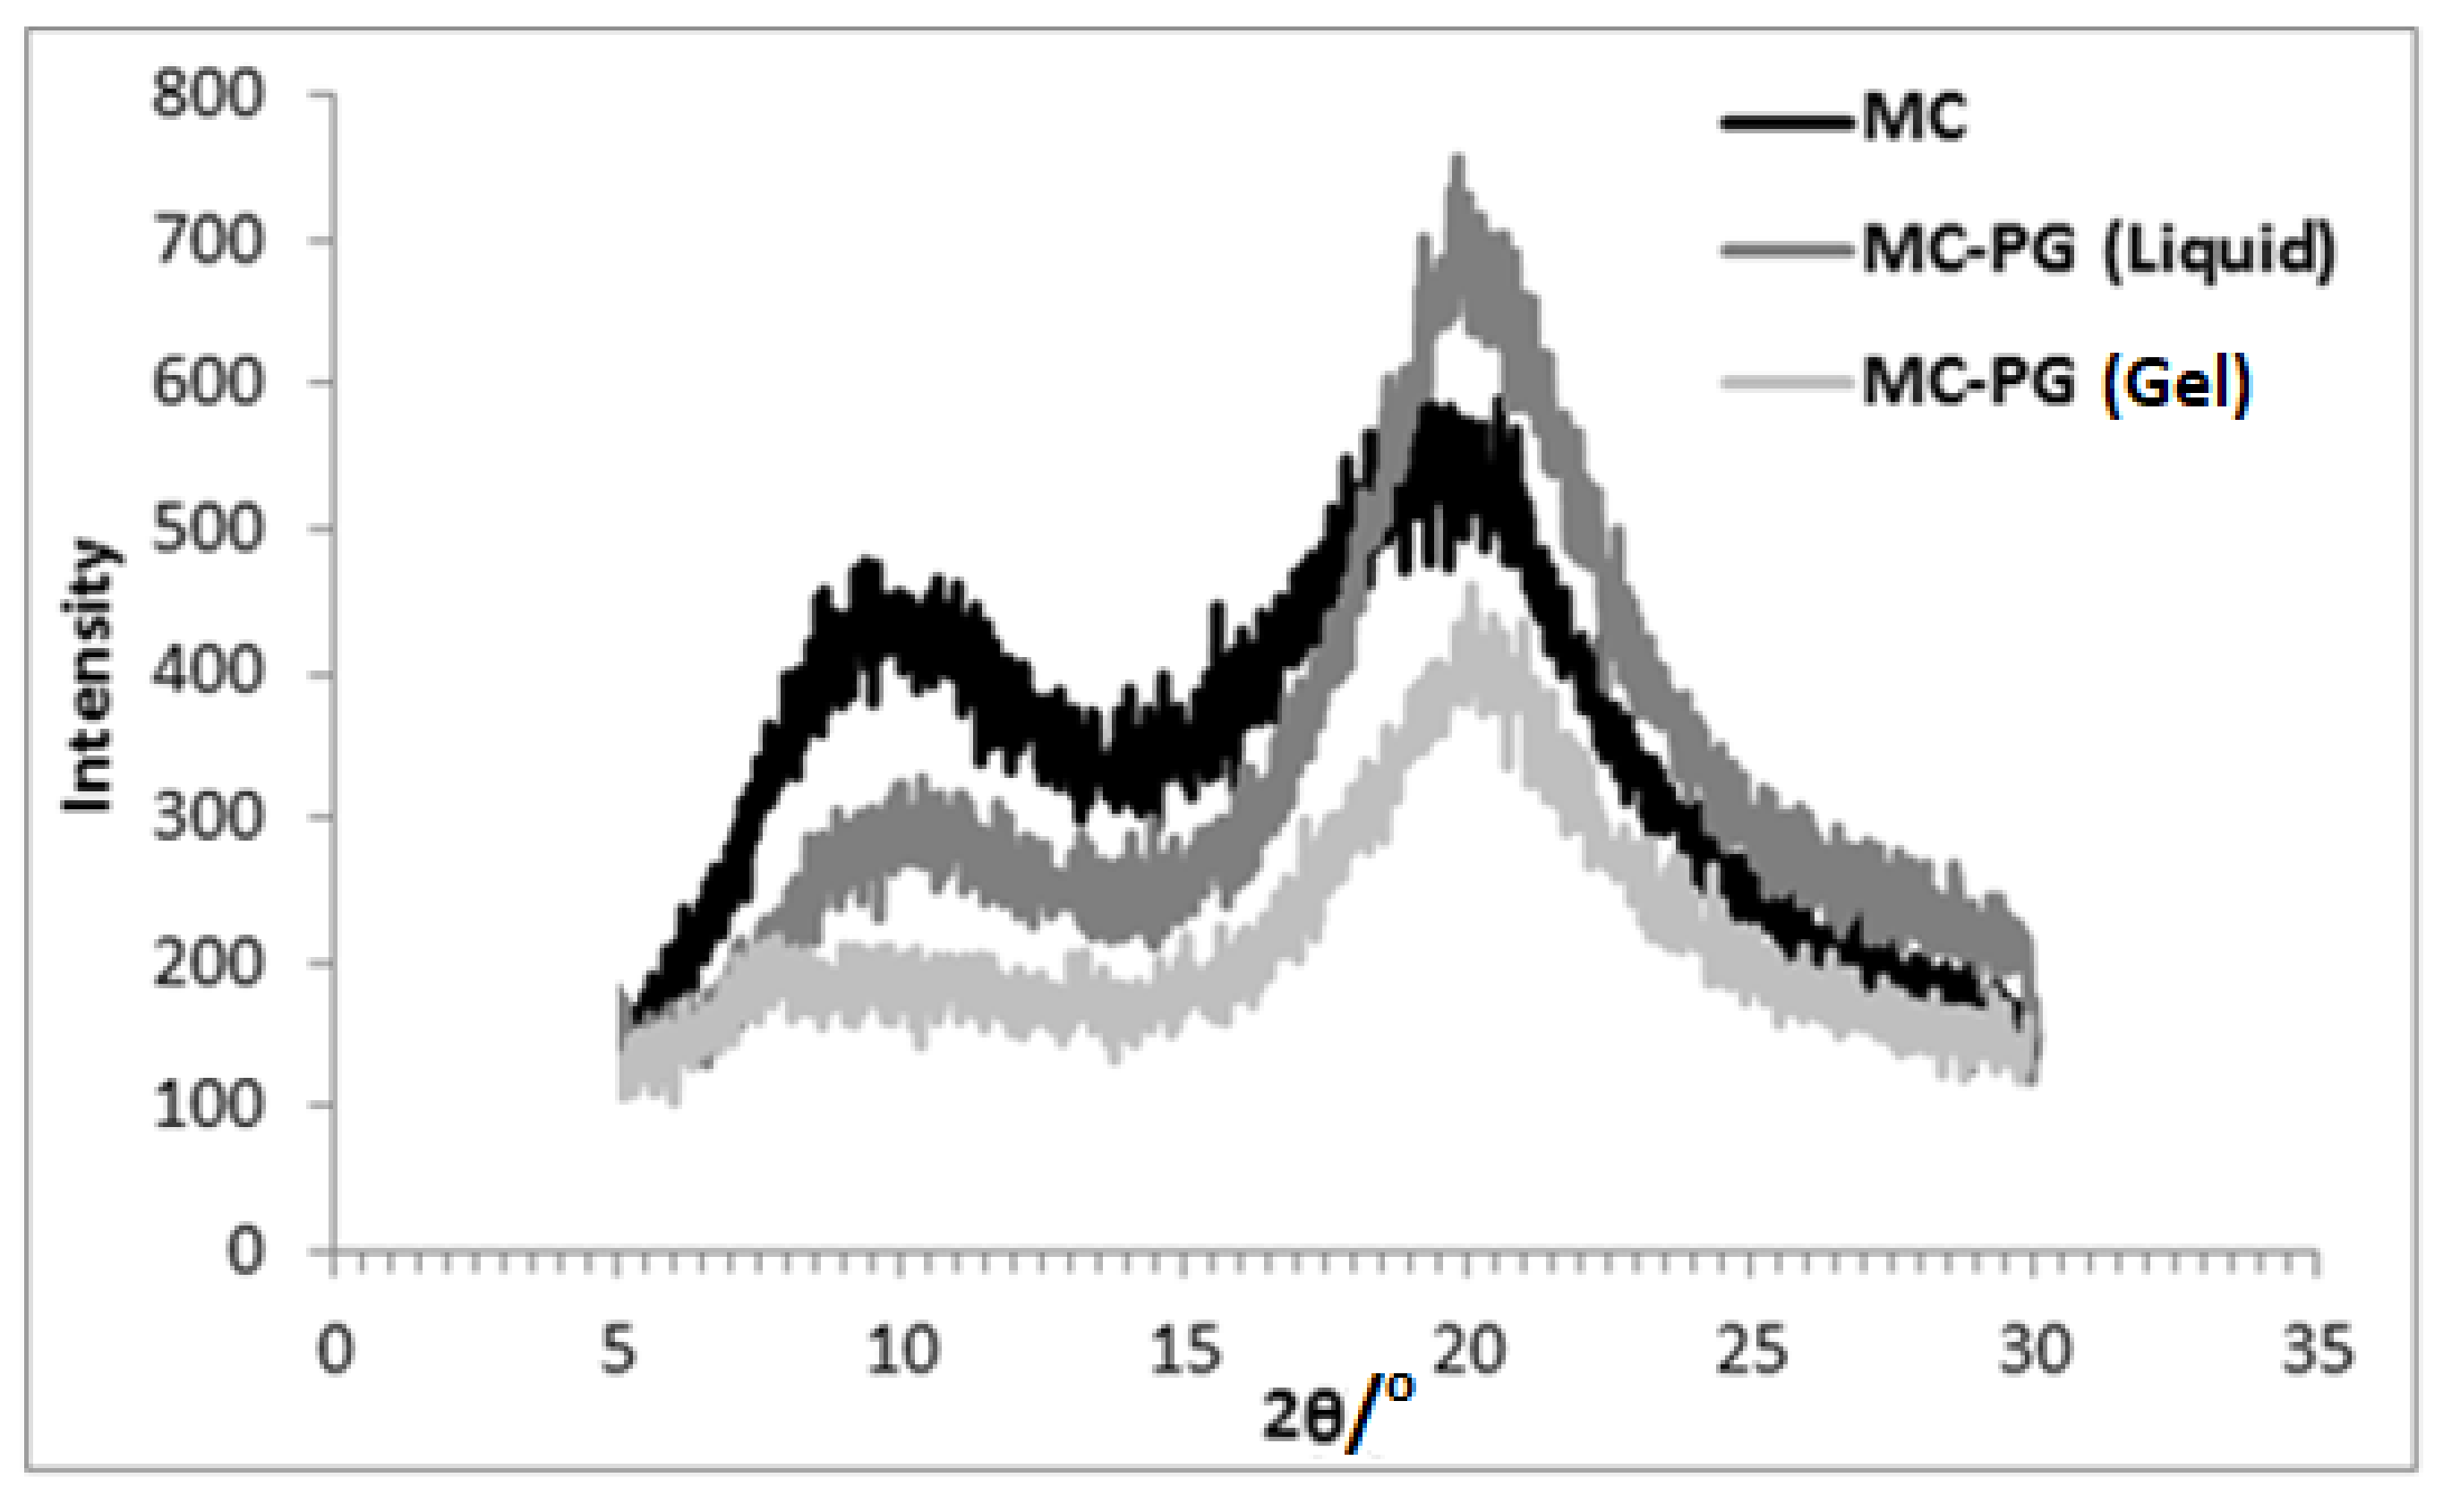
2.3. XRD
2.4. Discussion
3. Conclusions
4. Materials and Methods
4.1. Materials
4.2. Sample Preparation
4.3. Rheology
4.4. Differential Scanning Calorimetry (DSC)
4.5. X-ray Diffraction (XRD)
Author Contributions
Funding
Institutional Review Board Statement
Informed Consent Statement
Conflicts of Interest
References
- Williams, P.A. Gelling Agents. In Handbook of Industrial Water Soluble Polymers; Williams, P.A., Ed.; Blacwell Publishing Ltd.: Oxford, UK, 2007. [Google Scholar]
- Nussinovitch, A. Hydrocolloid Applications—Gum Technology in the Food and Other Industries; Chapman & Hall: London, UK, 1997. [Google Scholar]
- Majewicz, T.G.; Podlas, T.J. Cellulose Ethers. In Kirk-Othmer Concise Encyclopedia of Chemical Technology; Kroschwitz, J.I., Ed.; Wiley-Interscience: Hoboken, NJ, USA, 2005. [Google Scholar]
- Heymann, E. Studies on sol-gel transformations. I. The inverse sol-gel transformation of methylcellulose in water. Trans. Faraday Soc. 1935, 31, 846–864. [Google Scholar] [CrossRef]
- Sarkar, N. Thermal gelation properties of methyl and hydroxypropyl methylcellulose. J. Appl. Polym. Sci. 1979, 24, 1073–1087. [Google Scholar] [CrossRef]
- Haque, A.; Morris, H.R. Thermogelation of methylcellulose. Part I: Molecular structures and processes. Carbohydr. Polym. 1993, 22, 161–173. [Google Scholar] [CrossRef]
- Sarkar, N. Kinetics of thermal gelation of methylcellulose and hydroxypropylmethylcellulose in aqueous solutions. Carbohydr. Polym. 1995, 26, 195–203. [Google Scholar] [CrossRef]
- Nishinari, K.; Hofmann, K.E.; Moritaka, H.; Kohyama, K.; Nishinari, N. Gel-sol transition of methylcellulose. Macromol. Chem. Phys. 1997, 198, 1217–1226. [Google Scholar] [CrossRef]
- Viridn, A.; Wittgren, B.; Andersson, T.; Abrahmsn-Alami, S.; Larsson, A. Influence of Substitution Pattern on Solution Behavior of Hydroxypropyl Methylcellulose. Biomacromolecules 2009, 10, 522–529. [Google Scholar] [CrossRef] [PubMed]
- Bochek, A.M.; Zabivalova, N.M.; Lavrent’ev, V.K.; Lebedeva, M.F.; Sukhanova, T.E.; Petropavlovskii, G.A. Formation of Physical Thermally Reversible Gels in Solutions of Methyl Cellulose in Water and Dimethylacetamide and Properties of Films Thereof. Russ. J. Appl. Chem. 2001, 74, 1358–1363. [Google Scholar] [CrossRef]
- Desbrières, J.; Hirrien, M.; Rinaudo, M. A Calorimetric Study of Methylcellulose Gelation. Carbohydr. Polym. 1998, 37, 145–152. [Google Scholar] [CrossRef]
- Kundu, P.P.; Kundub, M.; Sinhaa, M.; Choec, S.; Chattopadhayayd, D. Effect of alcoholic, glycolic, and polyester resin additives on the gelation of dilute solution (1%) of methylcellulose. Carbohydr. Polym. 2003, 51, 57–61. [Google Scholar] [CrossRef]
- Guillot, S.; Lairez, D.; Axelos, M.A.V. Non-self-similar aggregation of methylcellulose. J. Appl. Crystallogr. 2000, 33, 669–672. [Google Scholar] [CrossRef] [Green Version]
- Kobayashi, K.; Huang, C.; Lodge, T.P. Thermoreversible Gelation of Aqueous Methylcellulose Solutions. Macromolecules 1999, 32, 7070–7077. [Google Scholar] [CrossRef]
- Li, L.; Shan, H.; Yue, Y.; Lam, Y.C.; Tam, K.C.; Hu, X. Thermally Induced Association and Dissociation of Methylcellulose in Aqueous Solutions. Langmuir 2002, 18, 7291–7298. [Google Scholar] [CrossRef]
- Wang, Q.; Li, L. Effects of molecular weight on thermoreversible gelation and gel elasticity of methylcellulose in aqueous solution. Carbohydr. Polym. 2005, 62, 232–238. [Google Scholar] [CrossRef]
- Funami, T.; Kataoka, Y.; Hiroe, M.; Asai, I.; Takahashi, R.; Nishinari, K. Thermal aggregation of methylcellulose with different molecular weights. Food Hydrocoll. 2007, 21, 46–58. [Google Scholar] [CrossRef]
- Fathi, S.; Dickens, P. Droplet analysis in an inkjet-integrated manufacturing process for nylon 6. Int. J. Adv. Manuf. Technol. 2013, 69, 269–275. [Google Scholar] [CrossRef]
- Khodabakhshi, K.; Gilbert, M.; Fathi, S.; Dickens, P. Anionic polymerisation of caprolactam at the small-scale via DSC investigations. J. Therm. Anal. Calorim. 2014, 115, 383–391. [Google Scholar] [CrossRef]
- Fahad, M.; Gilbert, M.; Dickens, P. Novel polymeric support materials for jetting based additive manufacturing processes. Rapid Prototyp. J. 2013, 19, 230–239. [Google Scholar] [CrossRef]
- Archer, W.A. Determination of Hansen Solubility Parameters for Selected Cellulose Ether Derivatives. Ind. Eng. Chem. Res. 1991, 30, 2292–2298. [Google Scholar] [CrossRef]
- Hansen, C.M. Hansen Solubility Parameters: A User’s Handbook, 2nd ed.; CRC Press: Boca Raton, FL, USA, 2007. [Google Scholar]
- Fahad, M.; Gilbert, M.; Dickens, P. Microscopy and FTIR investigations of the thermal gelation of methylcellulose in glycols. Polym. Sci. Ser. A 2017, 59, 88–97. [Google Scholar] [CrossRef]
- Singh, R.P.; Kundu, P.P. DSC and micro structural studies of methylcellulose gels in N, N dimethylformamide. J. Polym. Res. 2013, 20, 226. [Google Scholar] [CrossRef]
- Singh, R.P.; Kundu, P.P. Thermogelation of methylcellulose from solution in N,N-dimethylformamide and characterization of the transparent gels. J. Appl. Polym. Sci. 2008, 110, 3031–3037. [Google Scholar] [CrossRef]
- Kato, T.; Yokoyama, M.; Takahashi, A. Melting temperatures of thermally reversible gels IV. Methyl cellulose-water gels. Colloid Polym. Sci. 1978, 256, 15–21. [Google Scholar] [CrossRef]
- Yin, J.; Luo, K.; Chen, X.; Khutoryanskiy, V.V. Miscibility studies of the blends of chitosan with some cellulose ethers. Carbohydr. Polym. 2006, 63, 238–244. [Google Scholar] [CrossRef]
- Khomutov, L.I.; Ryskina, I.I.; Panina, N.I.; Dubina, L.G.; Timofeeva, G.N. Structural changes during gelation of aqueous solutions of methylcellulose. Polym. Sci. 1993, 35, 276–279. [Google Scholar]
- Pinotti, A.; García, M.A.; Martino, M.N.; Zaritzky, N.E. Study on microstructure and physical properties of composite films based on chitosan and methylcellulose. Food Hydrocoll. 2007, 21, 66–72. [Google Scholar] [CrossRef]
- Kondo, T.; Koschella, A.; Heublein, B.; Klemm, D.; Heinze, T. Hydrogen bond formation in regioselectively functionalized 3-mono-O-methyl cellulose. Carbohydr. Res. 2008, 343, 2600–2604. [Google Scholar] [CrossRef]
- Aziz, N.A.N.; Idris, N.K.; Isa, M.I.N. Solid Polymer Electrolytes Based on Methylcellulose: FT-IR and Ionic Conductivity Studies. Int. J. Polym. Anal. Charact. 2010, 15, 319–327. [Google Scholar] [CrossRef]
- Filho, G.R.; de Assunção, R.M.N.; Vieira, J.G.; Meireles, C.d.S.; Cerqueira, D.A.; da Silva Barud, H.; Ribeiro, S.J.L.; Messaddeq, Y. Characterization of methylcellulose produced from sugar cane bagasse cellulose: Crystallinity and thermal properties. Polym. Degrad. Stab. 2007, 92, 205–210. [Google Scholar] [CrossRef]
- Schagerlöf, H.; Johansson, M.; Richardson, S.; Brinkmalm, G.; Wittgren, B.; Tjerneld, F. Substituent Distribution and Clouding Behaviour of Hydroxypropyl Methylcellulose Analyzed Using Enzymatic Degradation. Biomacromolecules 2006, 7, 3474–3481. [Google Scholar] [CrossRef]


| Sample | Enthalpy (J/g) | |
|---|---|---|
| 20% MC–EG | Liquid | 322 |
| Gel | 61 | |
| 20% MC–PG | Liquid | 21 |
| Gel | 13 | |
| 20% MC–BG | Liquid | 22 |
| Gel | 22 | |
| Sample | 2θ (Degrees) | d (Å) | |
|---|---|---|---|
| Methylcellulose | 9.36 | 9.5 | |
| 19.2 | 4.6 | ||
| 20% MC-EG | Liquid | - | - |
| 21.92 | 4.1 | ||
| Gel | 7.82 | 11.3 | |
| 21.02 | 4.2 | ||
| 20% MC-PG | Liquid | 10.0 | 8.8 |
| 20.0 | 4.4 | ||
| Gel | 7.8 | 11.3 | |
| 20.0 | 4.4 | ||
| 20% MC-BG | Liquid | - | - |
| 19.56 | 4.5 | ||
| Gel | 7.6 | 11.6 | |
| 19.46 | 4.6 | ||
| Component | Hansen Solubility Parameter ([MPa]1/2) | |||
|---|---|---|---|---|
| δD | δP | δH | δT | |
| MC 1 | 18.0 | 15.3 | 19.4 | 30.6 |
| Ethylene glycol | 17.0 | 11.0 | 26.0 | 32.9 |
| Propylene glycol | 16.8 | 9.4 | 23.3 | 30.2 |
| Butylene glycol | 16.6 | 10.0 | 21.5 | 28.9 |
| Component | Chemical Formula | MW | Boiling Point (°C) |
|---|---|---|---|
| Ethylene Glycol (EG) | C2H6O2 | 62 | 197 |
| Propylene Glycol (PG) | C3H8O2 | 76 | 187 |
| Butylene Glycol (BG) | C4H10O2 | 90 | 203 |
Publisher’s Note: MDPI stays neutral with regard to jurisdictional claims in published maps and institutional affiliations. |
© 2021 by the authors. Licensee MDPI, Basel, Switzerland. This article is an open access article distributed under the terms and conditions of the Creative Commons Attribution (CC BY) license (https://creativecommons.org/licenses/by/4.0/).
Share and Cite
Fahad, M.; Khan, M.A.; Gilbert, M. Investigation of Thermal Gel Formation of Methylcellulose in Glycols Using DSC and XRD. Gels 2021, 7, 205. https://doi.org/10.3390/gels7040205
Fahad M, Khan MA, Gilbert M. Investigation of Thermal Gel Formation of Methylcellulose in Glycols Using DSC and XRD. Gels. 2021; 7(4):205. https://doi.org/10.3390/gels7040205
Chicago/Turabian StyleFahad, Muhammad, Maqsood Ahmed Khan, and Marianne Gilbert. 2021. "Investigation of Thermal Gel Formation of Methylcellulose in Glycols Using DSC and XRD" Gels 7, no. 4: 205. https://doi.org/10.3390/gels7040205
APA StyleFahad, M., Khan, M. A., & Gilbert, M. (2021). Investigation of Thermal Gel Formation of Methylcellulose in Glycols Using DSC and XRD. Gels, 7(4), 205. https://doi.org/10.3390/gels7040205