Article

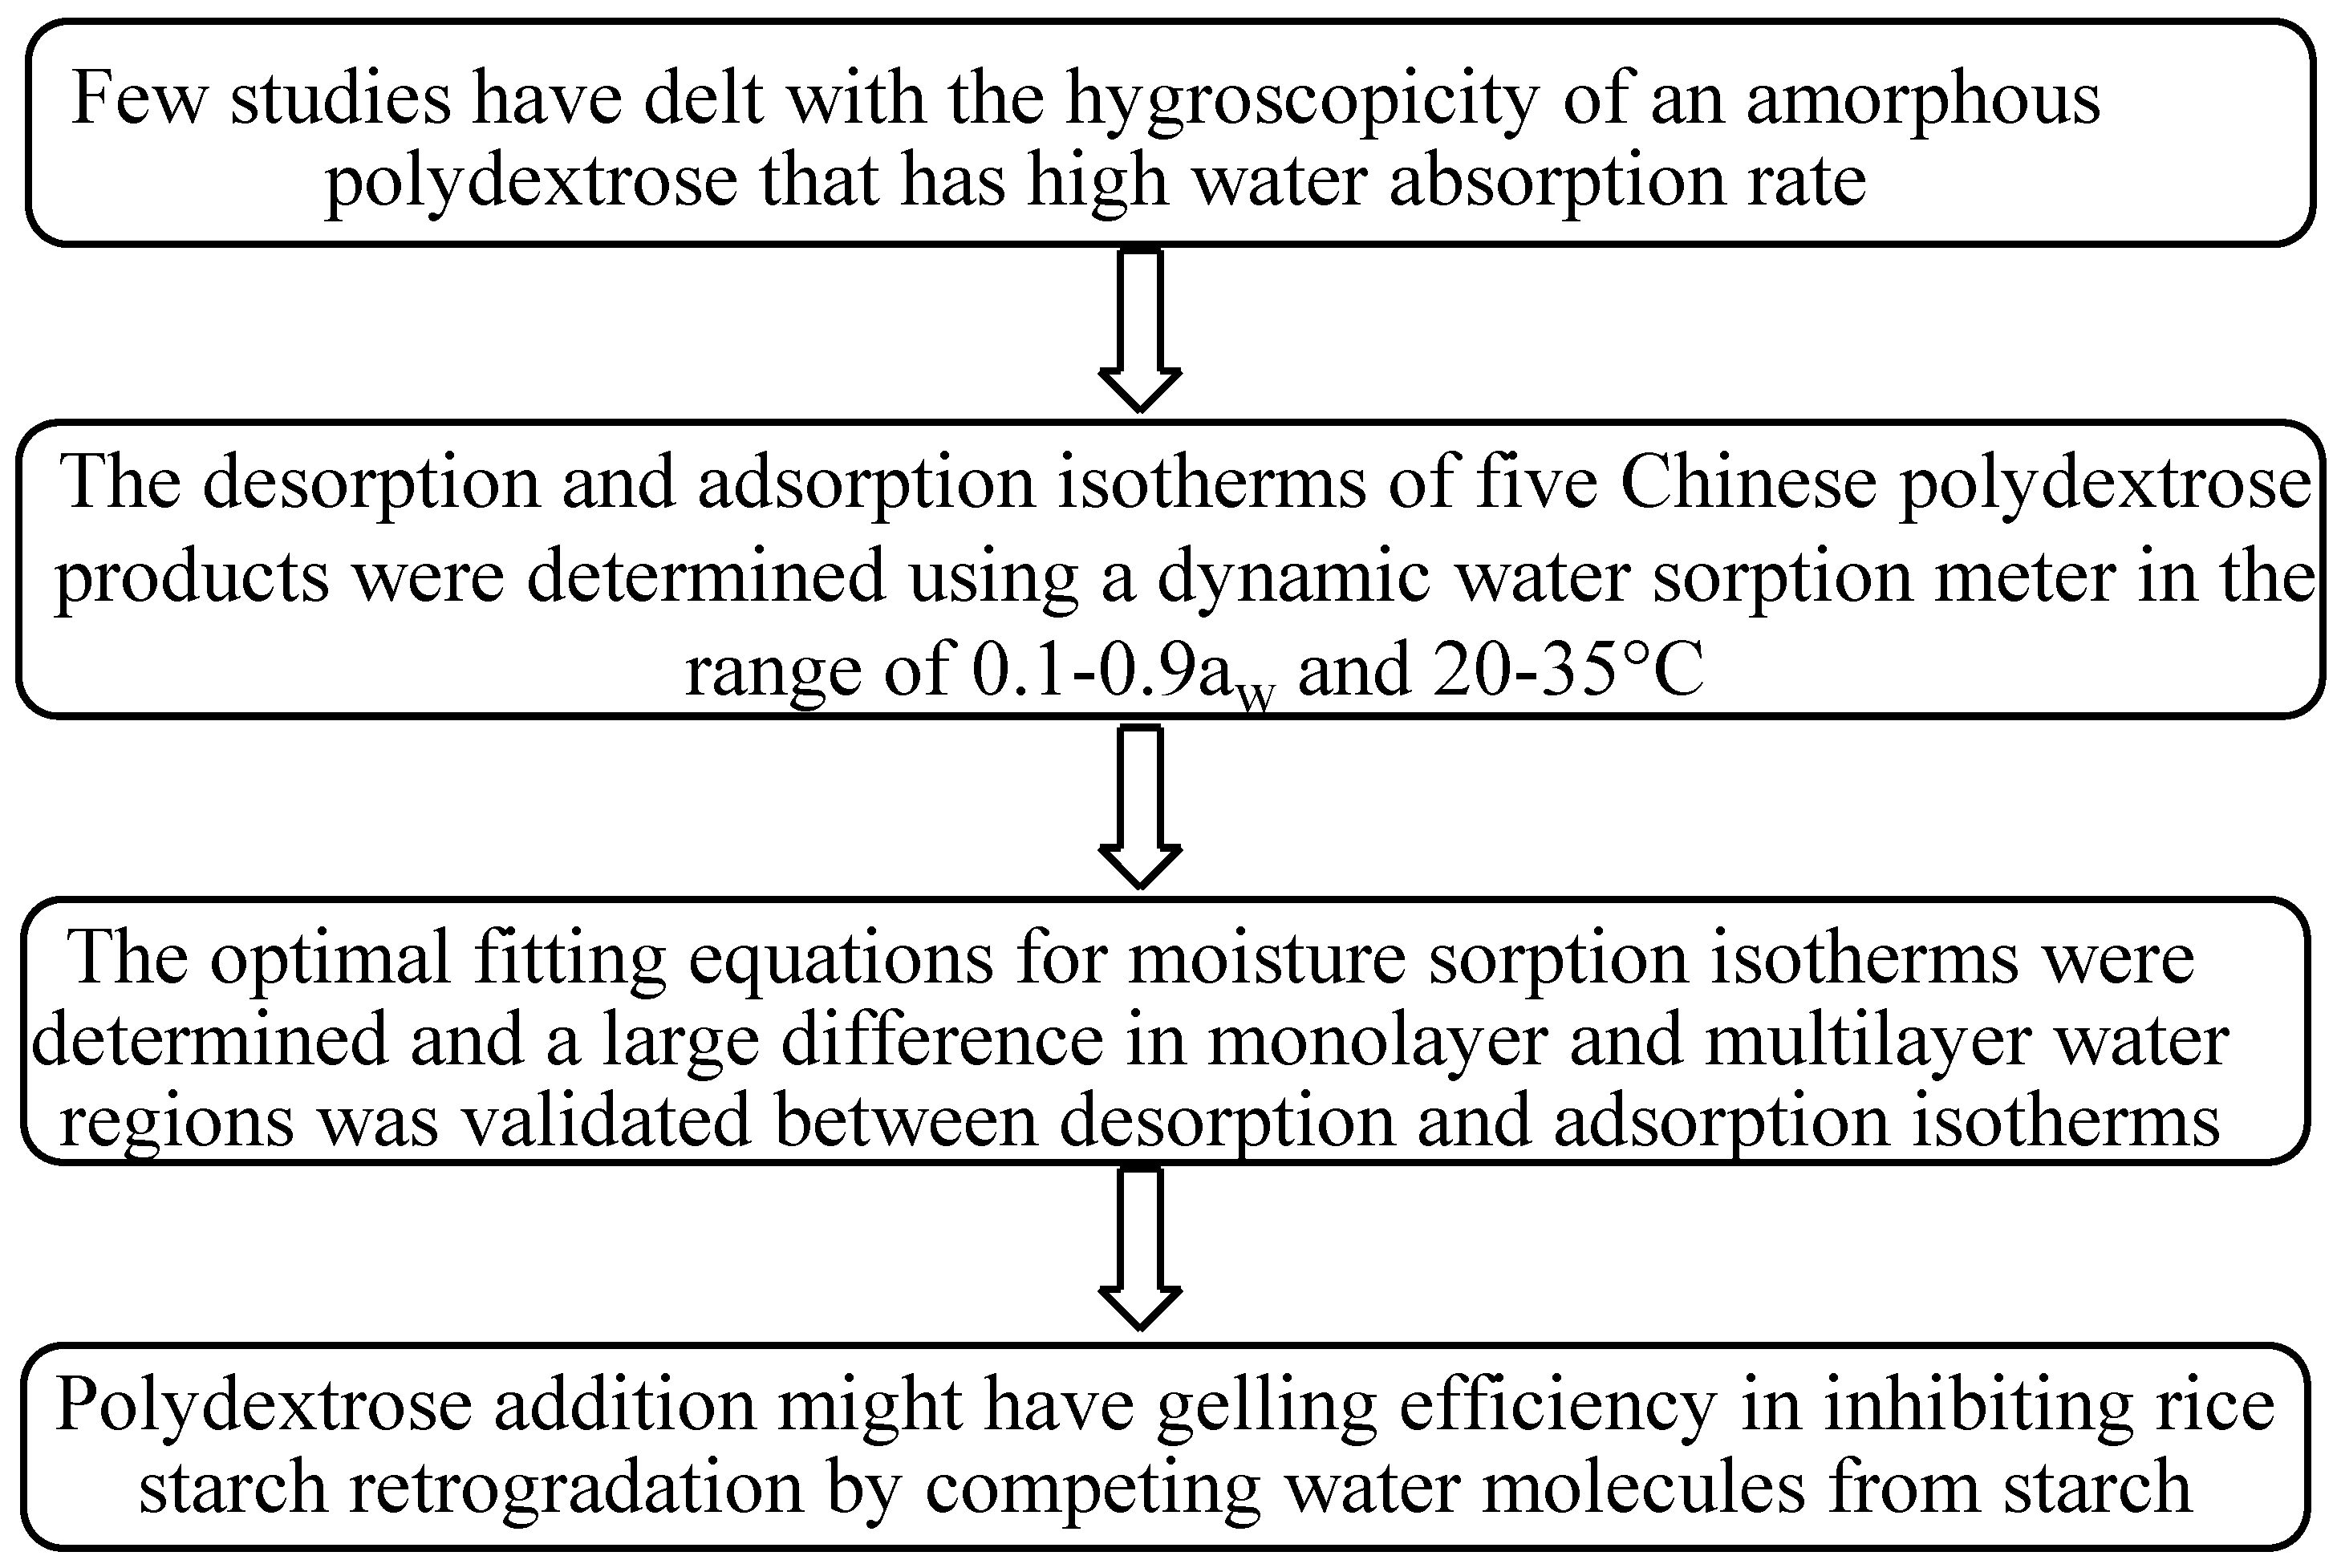
Moisture Sorption Isotherms of Polydextrose and Its Gelling Efficiency in Inhibiting the Retrogradation of Rice Starch

1
National Engineering Research Center for Grain Storage and Transportation, Academy of National Food and Strategic Reserves Administration, Beijing 102209, China
2
College of Health Science and Engineering, University of Shanghai for Science and Technology, Shanghai 200093, China
3
Department of Pharmacy, Sichuan University, Chengdu 610041, China
*
Author to whom correspondence should be addressed.
Gels 2024, 10(8), 529; https://doi.org/10.3390/gels10080529
Submission received: 10 April 2024 / Revised: 22 April 2024 / Accepted: 8 August 2024 / Published: 12 August 2024
(This article belongs to the Special Issue Recent Advance in Food Gels (2nd Edition))

Abstract

As an anti-staling agent in bread, the desorption isotherm of polydextrose has not been studied due to a very long equilibrium time. The adsorption and desorption isotherms of five Chinese polydextrose products were measured in the range of 0.1–0.9 aw and 20–35 °C by a dynamic moisture sorption analyzer. The results show that the shape of adsorption and desorption isotherms was similar to that of amorphous lactose. In the range of 0.1–0.8 aw, the hysteresis between desorption and adsorption of polydextrose was significant. The sorption isotherms of polydextrose can be fitted by seven commonly used models, and our developed seven-parameter polynomial, the adsorption equations of generalized D’Arcy and Watt (GDW) and Ferro-Fontan, and desorption equations of polynomial and Peleg, performed well in the range of 0.1–0.9 aw. The hysteresis curves of polydextrose at four temperatures quickly decreased with aw increase at aw ˂ 0.5, andthereafter slowly decreased when aw ≥ 0.5. The polynomial fitting hysteresis curves of polydextrose were divided into three regions: ˂0.2, 0.2–0.7, and 0.71–0.9 aw. The addition of 0–10% polydextrose to rice starch decreased the surface adsorption and bulk absorption during the adsorption and desorption of rice starch, while it increased the water adsorption value at aw ≥ 0.7 due to polydextrose dissolution. DSC analysis showed that polydextrose as a gelling agent inhibited the retrogradation of rice starch, which could be used to maintain the quality of cooked rice.

1. Introduction

Hydrocolloids are colloidal substances with an affinity for water, and they produce viscous solutions, pseudo-gels, or gels in water [1]. Polydextrose is a high molecular weight polysaccharide that can provide viscosity in the food industry [2]. Polydextrose can be synthesized from D-glucose, sorbitol, and citric acid with a proportion of 89:10:1 in a reaction kettle through high-temperature melting and a vacuum concentration process [3]. The production of synthetic polydextrose in China was 101,000 tons in 2020 with an annual output value of USD 0.143 billion, and expected output will be 135,000 tons in 2026 [4]. This was used in health products, beverages, fermented dairy products, and baked products (39.0%, 21.6%, 16.6%, and 11.8%, respectively) and chocolates, nutrition bars, and other foods (11.0%). Polydextrose is a randomly linked glucose polymer by all possible glycosidic linkages, including α- and β-1–2, 1–3, 1–4, and 1–6, with some branching [2]. It has an average degree of polymerization (DP) of 12. It is an amorphous powder that is weakly acidic, hygroscopic, and water-soluble. As a soluble dietary fiber, synthetic polydextrose is beneficial to human health, although it is costly [5]. Polydextrose has bulking properties with a low sweetness level of only 10% of the sweetness of sucrose [6]. It provides energy of 1 kcal/g and has a 90 g/day consumption threshold because excessive consumption of polydextrose might cause a laxative effect [7]. However, few studies have dealt with the desorption and adsorption isotherms of polydextrose.
Moisture sorption characteristics of biological materials play very important roles in technological processes such as drying, handling, mixing and packaging, storage, and other processes that require the estimation of drying time, prediction of food stability, shelf life, glass transition and texture, and prevention of deteriorative reactions [8]. The understanding of a moisture sorption isotherm model and hysteresis assessment procedures will be useful in development, selection, modeling, and controlling as well as making optimization of appropriate processes for enhanced efficiency in the food processing value chain [9,10]. The commonly used equilibrium moisture content (EMC) models for biological materials, namely Brunauer–Emmett–Teller (BET), Guggenheim–Anderson–deBoer (GAB), modified GAB (MGAB), and modified Hailwood–Horrobin (MHH), as well as modified Halsey (MHE), modified Henderson (MHE), modified Chung–Pfost (MCPE), and modified Oswin (MOE), have been evaluated for different foods, but with the gradual advance in the determination technique of moisture sorption isotherms in recent years [8,11], new or modified equations are still necessary.
Polysaccharides such ascarboxymethyl cellulose (CMC),crude tea polysaccharide,β-glucan, guar gum, and gum arabic (GA), as well as iota-carrageenan, konjac glucomannan, soybean-soluble polysaccharide (SSPS), pectin, and xanthan gum, are used as additives to retard starch retrogradation [12]. The mechanisms for the inhibition of starch retrogradation would be explained in terms of competitionfor water between starch and thesepolymers [13]. The primary effect of polydextrose in reducing the staling rate in baked products is thought to be due to its higher water absorption capacity and diluting of the starch components, thereby reducing the available starch fractions for crystallization [14]. The objective is to investigate the hygroscopic behavior of Chinese polydextrose products and to apply mathematical models to predict their adsorption and desorption isotherms obtained by a dynamic water sorption analyzer (Scheme 1), with an aim to elucidate the mechanism of their moisture retention and gelling efficiency when addedto food.

2. Results and Discussion

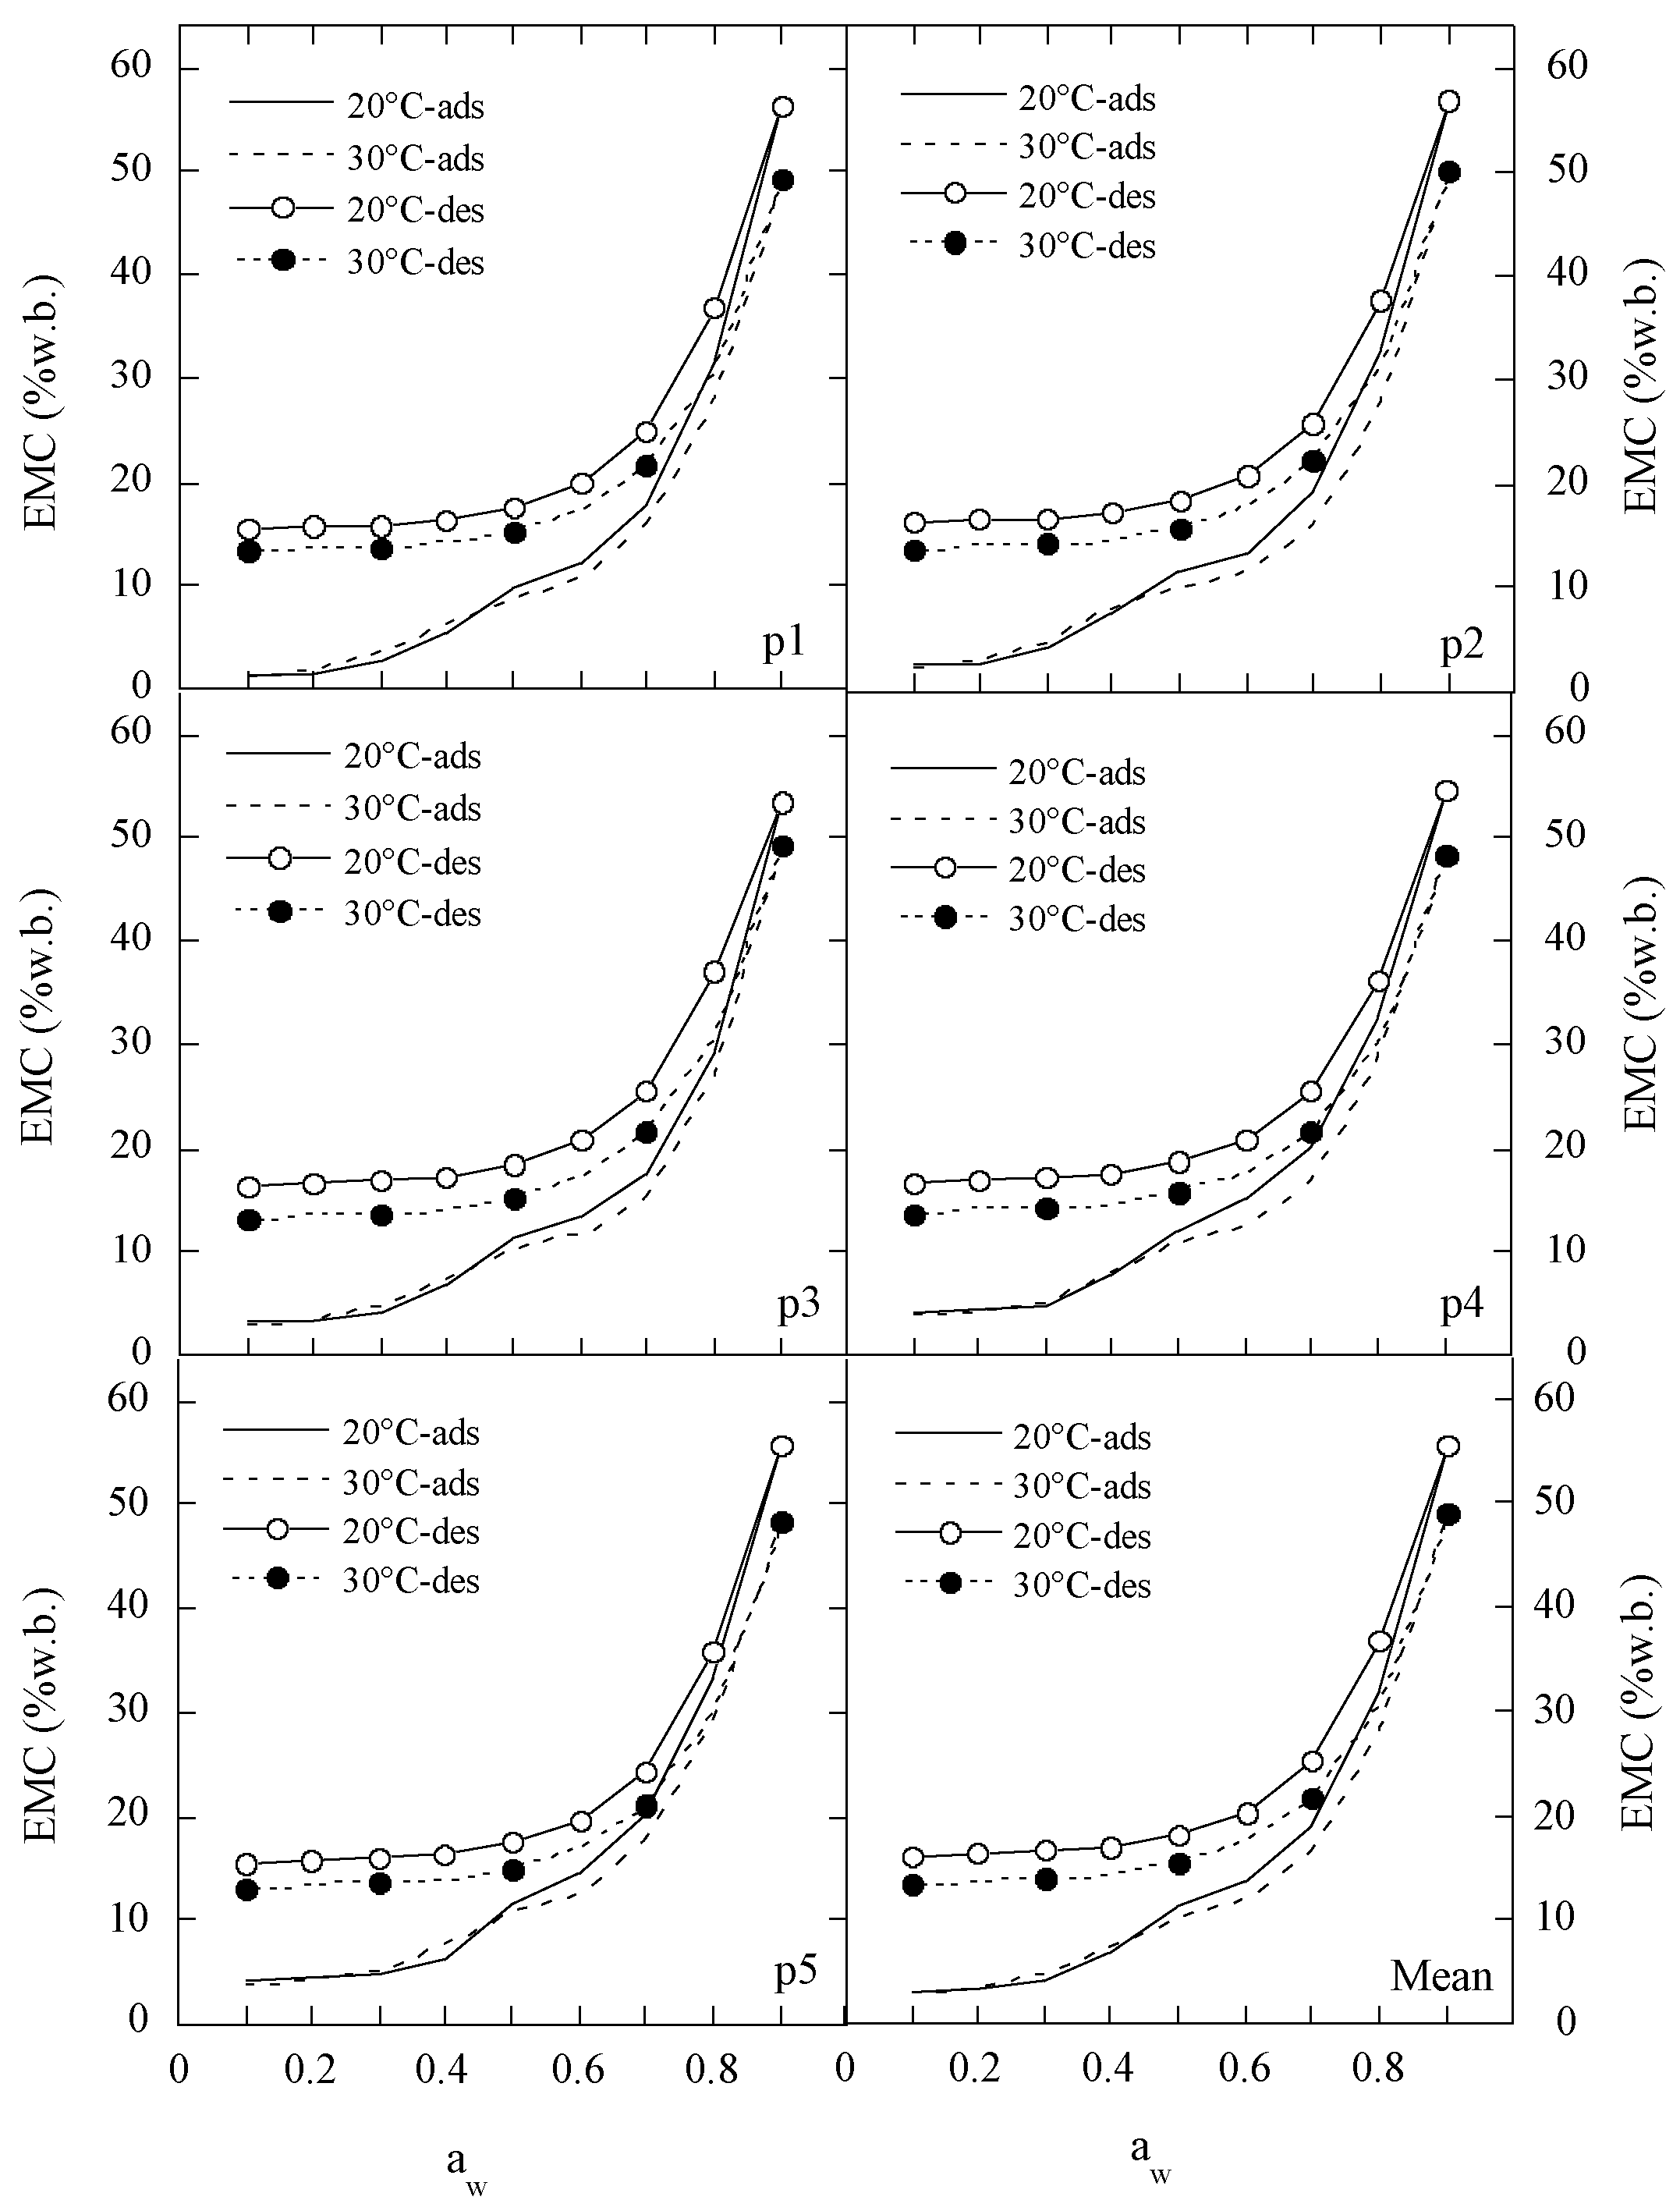
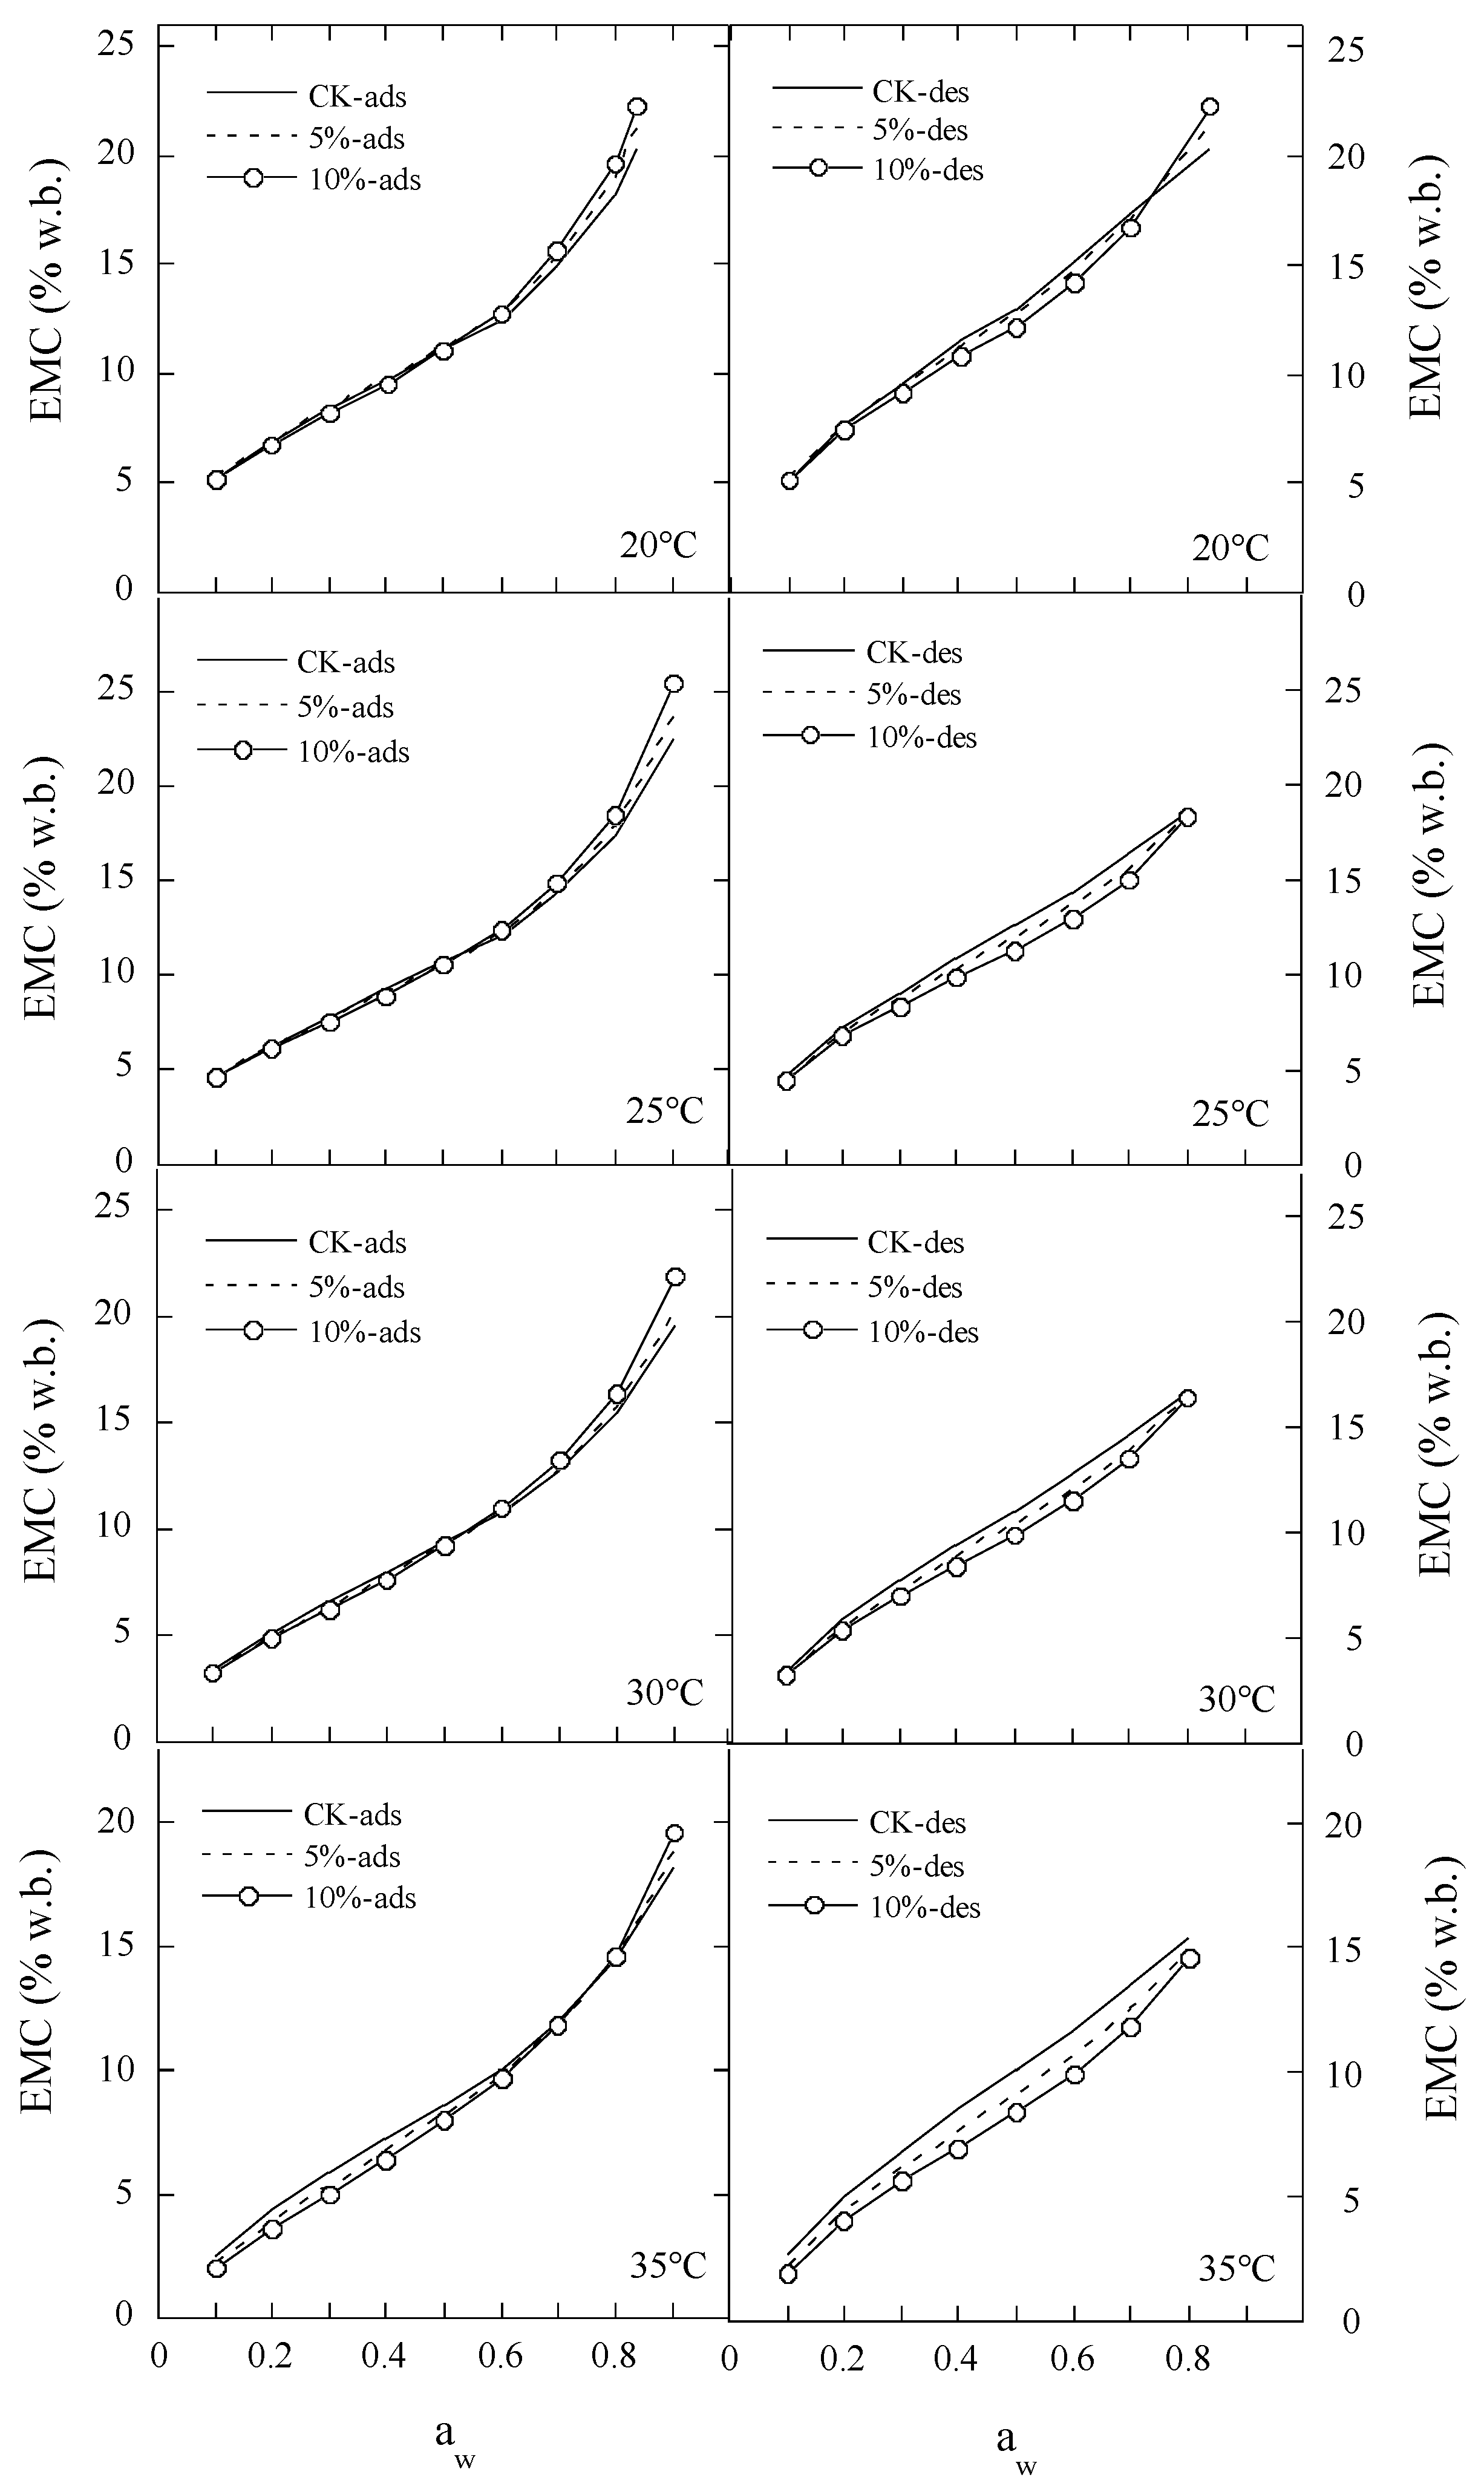
2.1. Experimental EMC/ERH Data for Polydextrose Samples

At water activity ranging from 0.1 to 0.9 and four temperatures (20, 25, 30, and 35 °C), the adsorption and desorption isotherms of five polydextrose samples were measured and are shown for the 20 and 30 °C isotherms in Figure 1. Both adsorption and desorption isotherms were sigmoidal in shape. At the same temperature, there were significantdifferences between adsorption and desorption isotherms in the range of 0.1 to 0.7 aw. With an increase in the initial moisture content (MC) of samples, the isotherms at the same temperature were slightly raised for desorption or adsorption. At 0.3–0.7 aw, there was a significant inflexion point in the adsorption isotherm for five samples, indicating the surface adsorption and bulk absorption.

2.2. Fitting of Sorption Equations to Experimental Sorption Data

The statistical parameters used to compare the model fits (R2, RSS, SE, and MRE) are given in Table 1, Table 2 and Table 3. The eight equations, namely Ferro-Fontan, the generalized D’Arcy and Watt (GDW), Boquet, Lewicki, Iglesias, MGAB, Peleg, and our developed polynomial, all can provide good fits to the experimental sorption isotherm data of polydextrose samples in the range of 0.1–0.9 aw, although Iglesias, MGAB, and polynomial equations gave larger MRE values for adsorptive EMC data.
Further comparisons of the sorption equations were made for five sets of polydextrose isotherm data (Table 4), and average values of the R2 and error parameters (RSS, SE and MRE) were calculated. For the adsorption, the equations were ranked in the following order of accuracy from the highest to the lowest: GDW, Ferro-Fontan, Peleg, MGAB, Boquet, Lewicki, polynomial, and Iglesias. In the case of desorption, the order was polynomial, Peleg, Iglesias, GDW, Boquet, Lewicki, Ferro-Fontan, and MGAB. The adsorption equations of GDW and Ferro-Fontan and the desorption equations of polynomial and Peleg well described the equilibrium moisture data of the five species of polydextrose in the range of 0.1–0.9 aw. The coefficients of the best-fitting equations are summarized in Table 3 and Table 5. These calculated coefficients can be used to describe the process of polydextrose dehydration and improve the physical control of moisture during package and storage.

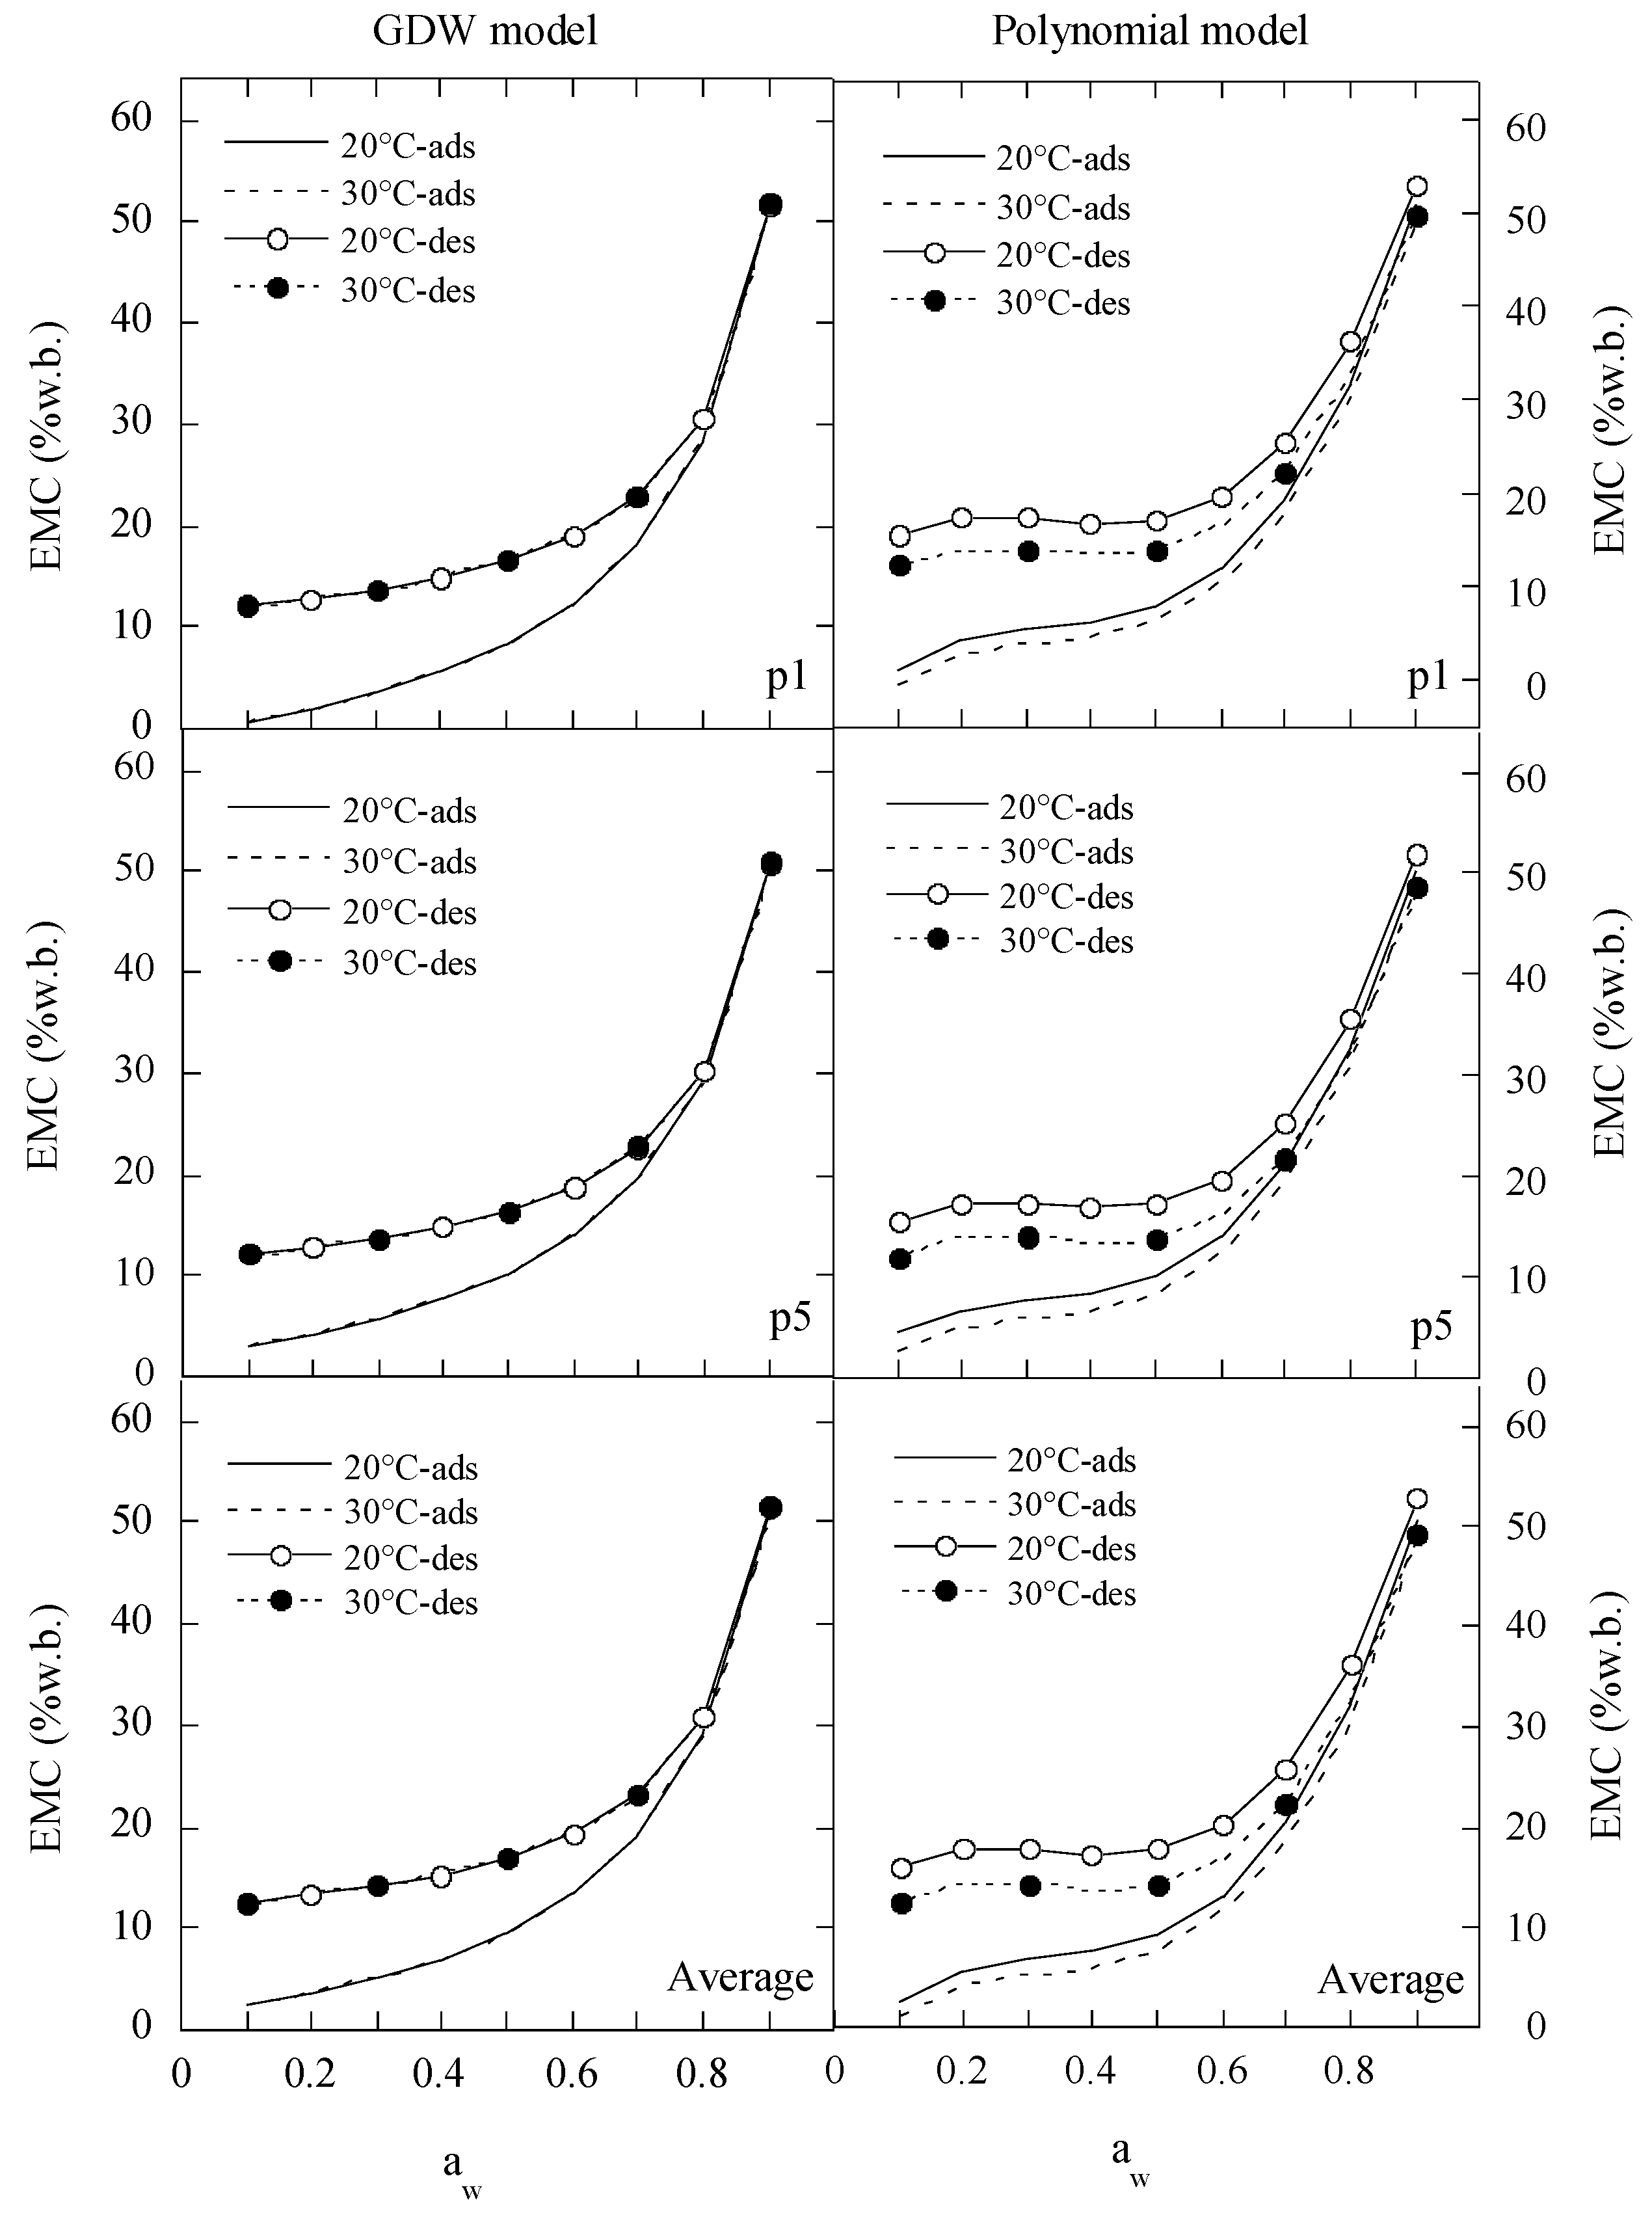
2.3. Prediction of Moisture Sorption Isotherms by the Best Fitting Equation

The predicted sorption isotherms of a1 and a5 polydextrose samples at 20 and 30 °C are displayed in Figure 2. At aw≤ 0.8, the hysteresis between adsorption and desorption becomes bigger with a decrease in aw for two temperatures. At aw ≤ 0.6, the adsorption isotherms of the p5 sample were higher than those of the p1 sample. These results suggest that the difference might occur in the properties of monolayer and multilayer water sorption.

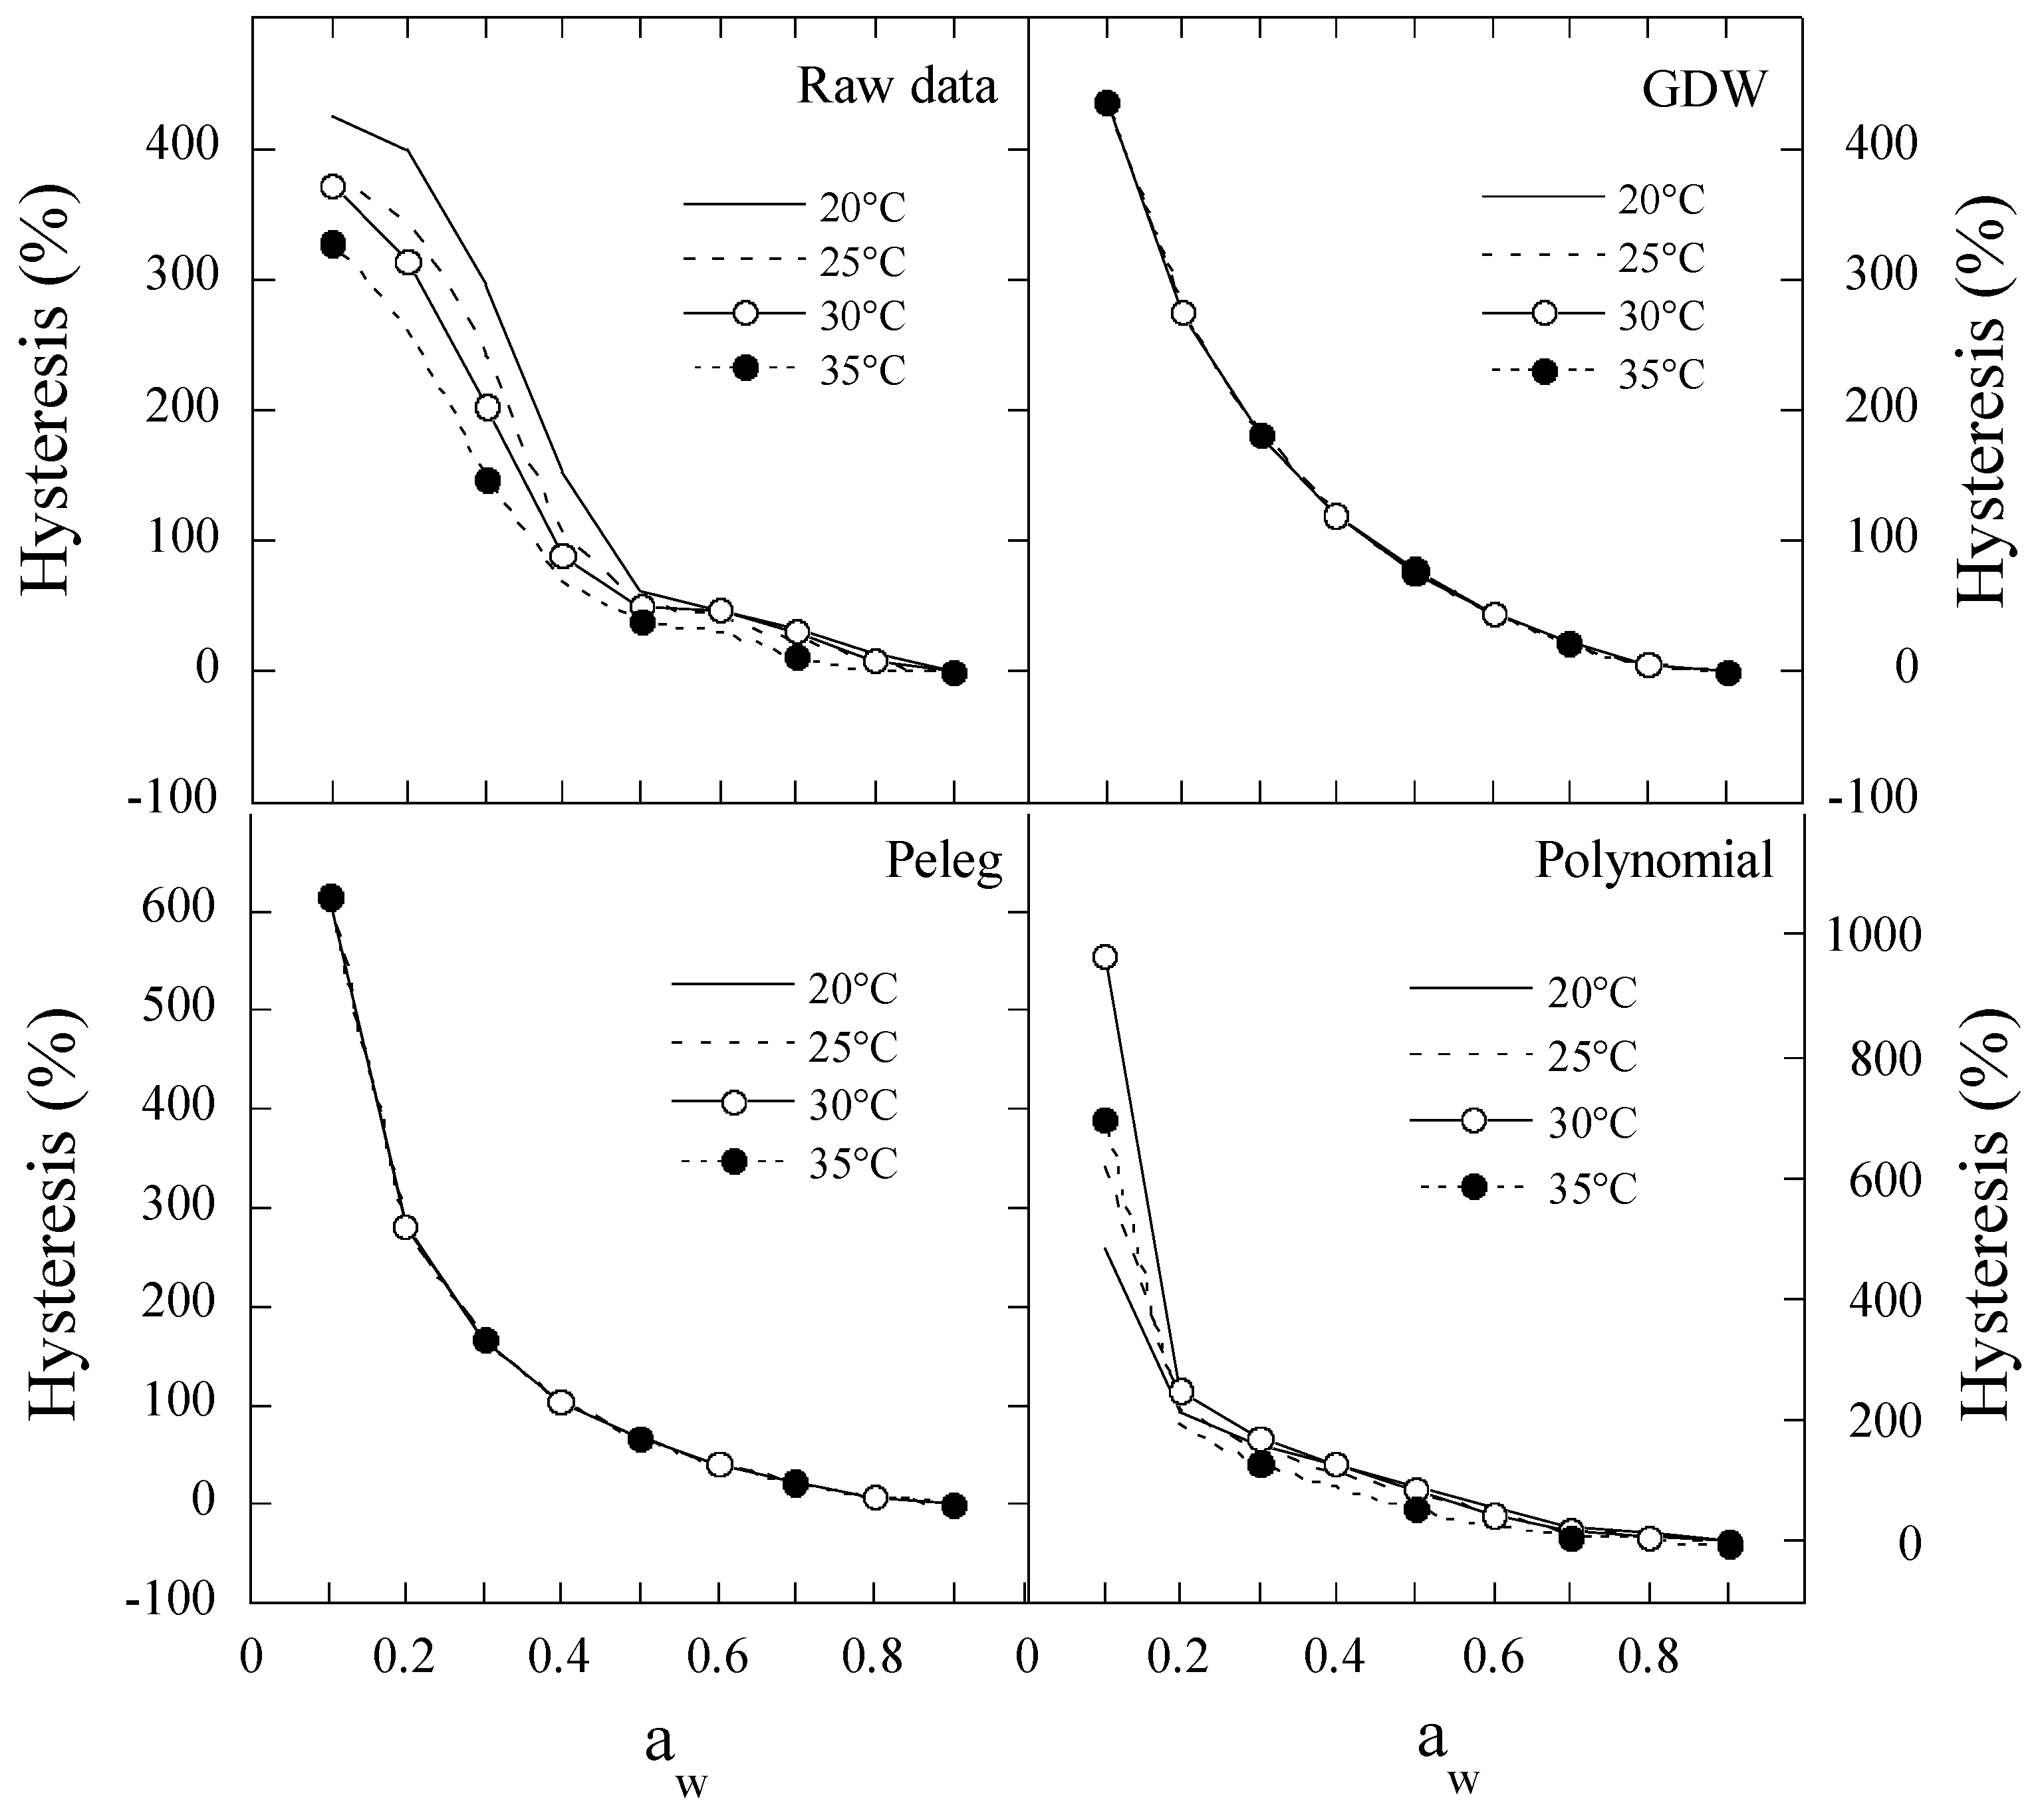
2.4. The Hysteresis Degree between Moisture Desorption and Adsorption of Polydextrose

The raw hysteresis degree curve of moisture sorption in polydextrose decreased sharply with an increase in water activity below 0.5 aw, and then decreased slowly with increasing water activity. With an increase in temperature, hysteresis degree curve moved down (Figure 3). The fitted hysteresis degree curves by the GDW and Peleg equations show hyperbolas and could not distinguish the effect of temperature, but hysteresis degree curves fitted by the polynomial can show the effect of temperature. The hysteresis degree curves fitted by the polynomial can be divided into three stages at ˂ 0.2 aw, 0.2–0.7 aw, and 0.71–0.9 aw, corresponding tothe hysteresis degree decreasing quickly, slowly, and flatly, respectively.

2.5. Change in the Phase State of Rice Starch with Polydextrose Addition

For the moisture adsorption isotherms of rice starch at 20, 25, 30, and 35 °C, amorphous polydextrose addition can increase water adsorptive values after about 0.7 aw due to the dissolution of the polydextrose (Figure 4). With an increase in temperature, polydextrose addition decreased the surface adsorption and bulk absorption in the range of 0.2 to 0.65 aw. For the desorption isotherms of rice starch at 20–35 °C, polydextrose addition decreased the moisture desorption values in the range of 0.2 to 0.75 aw. These results suggest that polydextrose addition decreased the surface adsorption and bulk absorption during moisture adsorption and desorption of rice starch, but increased moisture sorption values after about 0.7 aw due to the dissolution of the polydextrose.
Compared with the control, with an increase in polydextrose addition level from 3% to 10% in rice starch, the To, Tp, peak width, peak height of gelatinization had almost no changes (Table 6), but gelatinization enthalpy and Tc significantly decreased, indicating that amorphous polydextrose addition could inhibit the starch retrogradation and aging and can be used to keep the quality of cooked rice.
There are few studies on the moisture adsorption isotherms of non-crystalline polydextrose. Wong et al. [2] measured the 29 °C isotherm of polydextrose adsorption in the range of 17–87% ERH using saturated salt solution and a static gravimetric technique. They figured out that polydextrose could be classified as a type 2 isotherm (sigmoid shape) because there was an inflexion point in the isotherm. The inflexion point at 0.6–0.75 aw indicates the occurrence of a moisture-induced phase transition, i.e., glass transitions and successive crystallization in the samples [15]. In this study, at 0.3–0.7 aw, there was a significant inflexion point in the adsorption isotherm for five polydextrose samples measured by a dynamic water sorption analyzer (SPS11−10μ), and indicated the surface adsorption and bulk absorption, which is the region of glassy to rubbery phase transition. Similarly, Li and Schmidt [16] determined the polydextrose isotherms in the range of 11.3–84.3% ERH and 20–40 °C using a dynamic vapor sorption (DVS) ramping and equilibrium method, and indicated the surface adsorption and bulk absorption in the range of 0.25–0.65 aw. We also confirmed the region of surface adsorption and bulk absorption with the hysteresis degree curves fitted by a polynomial equation that can be divided into three stages at ˂ 0.2 aw, 0.2–0.7 aw, and 0.71–0.9 aw.
In the present study, the moisture adsorption and desorption isotherm shapes of polydextrose were determined to be similar to those of lactose monohydrate [17]. There was a huge hysteresis between desorption and adsorption isotherm of polydextrose at the same temperature in the range of 0.1–0.8 aw. Li and Schmidt [16] used a four-parameter polynomial equation (Li–Schmidt equation) to fit the experimental adsorption data of polydextrose. In this study, to our knowledge, we are the first to simultaneously determine the adsorption and desorption isotherms of five Chinese polydextrose products, and then used eight equations to fit them, of which MGAB and polynomial contain temperature term, but the other six equations do not have temperature term.The adsorption equations of GDW and Ferro-Fontan, and the desorption equations of polynomial and Peleg were judged as well describing the equilibrium moisture data of the five species of polydextrose in the range of 0.1–0.9 aw. It is interesting that our developed seven-parameter polynomial could show the two transition points at 0.2 aw and 0.7 aw, respectively, for surface adsorption and bulk absorption on the hysteresis degree curves.
When amorphous polydextrose was added to rice starch, the enthalpy and conclusion temperature (Tc) of gelatinization significantly decreased, but the onset temperature (To) and peak temperature (Tp) of gelatinization were not significantly influenced. Tc reduction means the delay or inhibition of starch recrystallization or retrogradation [18]. We explain that, as a gelling agent, polydextrose could adsorb such a high amount of water as to dilute the starch components, thus reducing the available starch fractions for recrystallization. The decrease in surface adsorption and bulk absorption in rice starch by polydextrose addition suggests that the study on glass transition temperature and moisture sorption curves is interesting to elucidate the mechanism of preventing starch retrogradation by adding different polysaccharides or oligosaccharides.

3. Conclusions

The measurement time for the desorption isotherm of amorphous polydextrose was significantly longer than that of the adsorption isotherm at the same temperature, which may be due to the fact that the desorption from solution to surface takes place through the stage of surface desorption plusbulk desorption in the range of 0.7 to 0.3 aw, that is, from the rubber state to the glass state, and it showed that the hysteresis curve of polydextrose decreased rapidly with the increase of water activity in the range of 0.1 ˂ aw ˂ 0.5, and then decreased slowly with the increase of water activity at aw ≥ 0.5. When 3–10% polydextrose was added to rice starch, it was used to reduce the moisture desorption value of rice starch in the range of 0.3–0.7 aw, and significantly decreased the conclusion temperature of rice starch gelatinization and inhibited starch retrogradation. The addition of 3–10% polydextrose has application scenes in inhibiting starch aging in cereal foods.

4. Materials and Methods

4.1. Materials

High-purity nitrogen (99.999%)was purchased from Beiwen Gas Company, Beijing, China; sodium azide (analytical purity) was from GuoyaoJituan, Beijing, China. Rice starch was from Sigma-Aldrich (Shanghai, China) Trading Co., Ltd., Shanghai, China. A dynamic water sorption analyzer (SPS11−10μ) with SPS-Toolbox Basic Rel. 1.15 software was from ProUmid GmbH & Co. KG, Ulm, Germany. Differential scanning calorimeter (DSC, 200F3) was purchased fromNetzsch, Freistaat Bayern, Germany. The six polydextrose samples were collected from five plants in China (Table 7). The initial moisture contents of the samples were determined by the method of AOAC [19].

4.2. Moisture Sorption Isotherms and Their Fitting

Moisture sorption isotherms of the samples were determined with a dynamic water sorption analyzer. This instrument is an integrated system for automatic gravimetric determination of the water vapor adsorption and desorption of multiple samples in a test atmosphere with controlled temperature and water activity (aw). Temperature over time is ±0.1 K, and aw accuracy is ±0.006 at (23 ± 5 °C) for the range of 0–1 aw. The sample turntable with 12 aluminum trays was used, and each tray has a bottom inner-diameter of 5.0 cm, top inner-diameter of 5.5 cm, outer-edge diameter of 6.3 cm and a height of 1.3 cm. The equilibrium moisture contents (EMCs) of each sample (ca. 2.0000 g) at four constant temperatures (20, 25, 30, and 35 °C) over aw range of 0.1–0.9 were determined using deionized water producing humidity and high-purity nitrogen blowing dry and preventing samples from getting moldy. The interval time between gravimetric cycles was set up as 10 min. The measurement cycle was started at 0.1 aw and first increased with a 0.1 step to 0.2 aw. Then, aw was raised to 0.3, 0.4, 0.5, 0.6, 0.7, 0.8, and further to 0.9. The time per cycle was set to a minimum of 50 min and a maximum of 50 h. The default weight limit was +100%, and balance bandwidth (dm/dt) was ±0.01%/40 min. During the measurement cycle, the samples are automatically placed on an analytical balance and weighed. The sample pan remains unloaded and was used for drift compensation of the measured values. The recorded data were analyzed by SPS-Toolbox Basic Rel. 1.15 software.
The experimental EMC/aw data were used to construct isotherm curves in Kaleidagraph for version 4.54 software [20], with aw and EMC data entered onto the x- and the y-axis, respectively. The EMC equations in Table 8 were used to fit the measured moisture isotherms of polydextrose.
In this study, to investigate the effect of temperature on moisture isotherms, we suppose that EMC is the function of temperature and relative humidity, and develop a seven-parameter polynomial,
M = A + B · t + C · t 2 + D · t 3 + E · a w + F · a w 2 + G · a w 3 ,
where M is equilibrium moisture (%), aw is water activity (decimal), t is temperature (°C), and A~G are parameters.
Fitting was conducted by nonlinear regression analysis in SPSS v17.0 for Windows (SPSS Inc., Chicago, IL, USA, [27]). The criteria used to determine the equation for the EMC/ERH data were the determination coefficient (R2), residue sum of squares (RSS), and standard error (SE), as well as mean relative percentage error (MRE). Equations (2)–(5) were used to calculate R2, RSS, SE, and MRE, respectively.
R 2 = 1 i = 1 n ( m i m p i ) 2 / i = 1 n ( m i m m i ) 2
R S S = i = 1 n ( m i m p i ) 2
S E = i = 1 n ( m i m p i ) 2 / ( n 1 )
M R E % = 100 n i = 1 n m i m p i m i
where mi is the experimental value, mpi is the predicted value, mmi is the average of experimental values, and n is the number of observations. The determinationcoefficient was one of the primary criteria for selecting the bestequation to fit the experimental data. The otherstatistical parameters, MRE as a percentage, RSS, and SE, were also usedto determine the quality of the fit. The fit of an equation to the EMC/ERH data was considered satisfactory if the MRE was lower than 10% [28].
Hysteresis degree (Hy) between adsorption and desorption is determined as:
H y % = E M C d e s E M C a d s E M C a d s × 100

4.3. The Addition of Polydextrose in Rice Starch

The p1 polydextrose was added to rice starch with a w/w proportion of 0%, 3%, 5%, 7%, and 10%. The polydextrose-added rice starch samples were used to determine the moisture sorption isotherms of 20–35 °C using the above method. Gelatinization temperatures of the rice starch samples were determined with a differential scanning calorimeter [29]. The sample (5.0–5.1 mg) was weighed into an aluminum crucible, and deionized water was added to give a water/sample ratio of 2:1. The aluminum crucible was immediately sealed and then equilibrated overnight at 4 °C. The DSC temperature was increased from 20 °C to 110 °C at a heating rate of 10 °C min−1.

4.4. Data Analysis

Except for parallel samples for the determination of EMC/aw data, three replicates were tested on each rice starch sample for physicochemical parameters. SPSS software (Version 17.0, SPSS Inc., [27]) was used for data analysis. One-way analysis of variance (ANOVA) and Duncan’s new multiple-range test were used to compare multiple and pairs of means, respectively. Statistical significance was declared at p < 0.05.

Author Contributions

C.L., data collection, methodology, writing, investigation; X.L. (Xiaoyu Li), methodology, mathematic model; H.S., supervision, reviewing; X.L. (Xingjun Li), writing, reviewingand editing, methodology, investigation, supervision, results interpretation, data curation. All authors have read and agreed to the published version of the manuscript.

Funding

This research was funded by the research and development fund for institute–enterprise cooperation (H22076).

Institutional Review Board Statement

This study has no ethical experiment.

Informed Consent Statement

This study has no humans experiment.

Data Availability Statement

The original contributions presented in the study are included in thearticle; further inquiries can be directed to the corresponding author.

Acknowledgments

We thank Guo-qing Ning for supplying the polydextrose samples.

Conflicts of Interest

The authors declare no conflicts of interest.

References

  1. Wüstenberg, T. General overview of food hydrocolloids. In Cellullose and Cellulose Derivatives in the Food Industry: Fundamentals and Application, 1st ed.; Wiley-VCH Verlag GmbH& Co. KGaA: Weinheim, Germany, 2015; pp. 1–68. [Google Scholar]
  2. Wong, K.Y.; Thoo, Y.Y.; Tan, C.P.; Siow, L.F. Moisture absorption behahavior and thermal properties of sucrose replacer mixture containing inulin and polydextrose. Appl. Food Res. 2022, 2, 100089. [Google Scholar] [CrossRef]
  3. Guan, Q.Q.; Shao, X.B.; Yang, T.T.; Dou, G.M.; Xu, T.C.; Gan, Z.B. A study on the preparation process of polydextrose. Agric. Tech. 2018, 38, 247–248. [Google Scholar]
  4. Guanyan Research Report. The Forecast of the Market Competition Pattern and Development Trend of China Polyglucose Industry on the Analysis Report of 2021 Year. Available online: https://market.chinabaogao.com/shipin/101455602R021.html (accessed on 14 October 2021).
  5. Bailey, R.L.; Gahche, J.J.; Lentino, C.V.; Dwyer, J.T.; Engel, J.S.; Thomas, P.R.; Betz, J.M.; Sempos, C.T.; Picciano, M.F. Dietary supplement use in the United States, 2003–2006. J. Nutr. 2011, 141, 261–265. [Google Scholar] [CrossRef] [PubMed]
  6. Afoakwa, E.O.; Paterson, A.; Fowler, M. Factors influencing rheological and textural qualities in chocolate—A review. Trends Food Sci. Technol. 2007, 18, 290–298. [Google Scholar] [CrossRef]
  7. O’Brien-Nabor, L. Alternative Sweetneners, 4th ed.; CRC Press: Boca Raton, FL, USA, 2012. [Google Scholar] [CrossRef]
  8. Aviara, N.A. Moisture Sorption Phenomena in Biological Materials: Isotherm Model Fitting and Hysteresis Assessment Techniques, 1st ed.; Chapter 23, Festschrift in honour of Engr. Prof. Patrick Obi Ngoddy at 80 Promethaean Commentries with Seminal Paper Contributions; Iwe, M.O., Nkama, I., Eds.; University of Nigeria Nsukka Press Ltd.: Nsukka, Nigeria, 2021; pp. 382–402. [Google Scholar]
  9. Fan, K.; Chen, L.B.; Wei, X.H.; He, J.; Yan, P.W. Moisture adsorption isotherms and thermodynamic properties of Auricularia auricular. J. Food Process. Preserv. 2015, 39, 1534–1541. [Google Scholar] [CrossRef]
  10. Li, X.J.; Han, X.; Tao, L.S.; Jiang, P.; Qin, W. Sorption equilibrium moisture and isosteric heat of Chinese wheat bran products added to rice to increase its dietary fibre content. Grain Oil Sci. Technol. 2021, 4, 149–161. [Google Scholar] [CrossRef]
  11. Li, X. The Theory and Practice of Grain Moisture Content; China Light Industry Press: Beijing, China, 2022; pp. 1–100. [Google Scholar]
  12. Wang, S.J.; Li, C.L.; Copeland, L.; Niu, Q.; Wang, S. Starch retrogradation: A comprehensive review. Compr. Rev. Food Sci. Food Saf. 2015, 14, 568–585. [Google Scholar] [CrossRef]
  13. Chang, Q.; Zheng, B.D.; Zhang, Y.; Zeng, H.L. A comprehensive review of the factors influencing the formation of retrograded starch. Int. J. Biol. Macromol. 2021, 186, 163–173. [Google Scholar] [CrossRef] [PubMed]
  14. Margaret, K. Polydextrose as Anti-Staling Agent. PCT/US98/02113, 5 February 1998. [Google Scholar]
  15. Lewicki, P.P. Water as the determinant of food engineering properties—A review. J. Food Eng. 2004, 61, 483–495. [Google Scholar] [CrossRef]
  16. Li, Q.E.; Schmidt, S.J. Use of ramping and equilibrium water-vapor sorption methods to determine the critical relative humidity at which the glassy to rubbery transition occurs in polydextrose. J. Food Sci. 2011, 76, E149–E153. [Google Scholar] [CrossRef] [PubMed]
  17. Vollenbroek, J.; Hebbink, G.A.; Ziffels, S.; Steckel, H. Determination of low levels of amorphous content in inhalation grade lactose by moisture sorption isotherms. Int. J. Pharm. 2010, 395, 62–70. [Google Scholar] [CrossRef] [PubMed]
  18. Fu, Z.; Chen, J.; Luo, S.J.; Liu, C.M.; Liu, W. Effect of food additives on starch retrogradation-a review. Starch-Stärke 2014, 66, 1–10. [Google Scholar] [CrossRef]
  19. AOAC. Official Methods of Analysis of AOAC; Association of Analytical Communities: Gaithersburg, MD, USA, 2000. [Google Scholar]
  20. Synergy Software. Kaleidagraph for Windows Version 4.54 Software; Synergy: Reading, PA, USA, USA, 2021. [Google Scholar]
  21. Saberi, B.; Vuong, Q.V.; Chockchaisawasdee, S.; Golding, J.B.; Scarlett, C.J.; Stathopoulos, C.E. Water sorption isotherms of pea starch edible films and prediction models. Foods 2016, 5, 1. [Google Scholar] [CrossRef] [PubMed]
  22. Furmaniak, S.; Terzyk, P.; Gauden, P.A. The general mechanism of water sorption on foodstuffs-Important of the multitemperature fitting of data and the hierarchy of models. J. Food Eng. 2007, 82, 528–535. [Google Scholar] [CrossRef]
  23. Boquet, R.; Chirife, J.; Iglesias, H.A. Equations for fitting water sorption isotherms of foods, part III: Evaluation of various three-parameter models. J. Food Technol. 1979, 14, 527–534. [Google Scholar] [CrossRef]
  24. Iglesias, H.A.; Chirife, J. An alternative to the Guggenheim Anderson and De boer model for mathematical description of moisture sorption isotherms of foods. Food Res. Int. 1995, 28, 317–321. [Google Scholar] [CrossRef]
  25. Cao, L.F.; Li, B.W.; Zhao, N.; Li, H.; Wang, Y.F.; Yu, X.; Huang, X. Moisture migration analysis of Chinese naked oat during different storage conditions by sorption isotherm model and low-field NMR. Food Sci. Nutr. 2020, 8, 1729–1738. [Google Scholar] [CrossRef] [PubMed]
  26. Peleg, M. Assessment of a semi empirical four parameter general model for sigmoid moisture sorption isotherms. J. Food Process Eng. 1993, 16, 21–37. [Google Scholar] [CrossRef]
  27. SPSS Inc. SPSS for Windows, Release 18.0.1; SPSS Inc.: Chicago, IL, USA, 2017. [Google Scholar]
  28. Han, X.; Wang, X.; Li, X.; Jiang, P. Sorption equilibrium moisture and isosteric heat of Chinese wheat flours. Qual. Assur. Saf. Crops Foods 2017, 9, 435–449. [Google Scholar] [CrossRef]
  29. Tao, L.S.; Qin, W.; Wei, Z.; Li, X.J.; Zhang, H.Q. Effects of small-scale storage on the cooking property and fatty acid profile of sea rice paddy. Appl. Food Res. 2022, 2, 100175. [Google Scholar] [CrossRef]
Scheme 1. Schematic diagram of the present study.
Gels 10 00529 sch001
Figure 1. The measure moisture isotherms of polydextrose. Note: EMC, equilibrium moisture content; w.b., wet basis; aw, water activity; ads, adsorption; des, desorption; p1, p2, p3, p4, and p5 are five polydextrose samples; Mean is the average isotherms of five samples.
Gels 10 00529 g001
Figure 2. The predicted adsorption and desorption isotherms of polydextrose samples. Note: EMC, equilibrium moisture content; w.b., wet basis; aw, water activity; ads, adsorption; des, desorption; GDW, generalized D’Arcy and Watt; p1 and p5 are the samples; Average is the mean of adsorption or desorption isotherms for five samples.
Gels 10 00529 g002
Figure 3. The hysteresis degree of moisture sorption in polydextrose. Note: aw, water activity; GDW, generalized D’Arcy and Watt.
Gels 10 00529 g003
Figure 4. Effect of polydextrose addition on the moisture sorption isotherms of rice starch.Note: EMC, equilibrium moisture content; w.b., wet basis; aw, water activity; CK, the control rice starch; ads, adsorption; des, desorption.
Gels 10 00529 g004
Table 1. The fitting results for the moisture adsorption isotherms of polydextrose.
EquationSampleEquation Parameters Statistical Parameters
abcdRSSSER2MRE (%)
Ferrop11.2442.8410.552 83.14542.51960.990111.3825
-Fontanp21.1194.4030.758 92.12692.79170.98879.2898
p31.0994.8850.814 61.42201.86130.99178.8459
p41.1095.9080.853 76.70372.32440.98948.3734
p51.1085.5180.835 97.55452.95650.98679.8290
GDWp10.672−6.376 × 10160.934−9.80987.74722.74210.989512.4027
p22.2413.603 × 10160.941−9.31194.44292.95130.98858.9501
p32.6333.076 × 10160.942−8.78962.46521.95210.99168.3691
p43.185−4.221 × 10160.926−9.62375.74412.36700.98967.7474
p53.0975.885 × 10160.933−9.28796.68853.02150.98698.6202
Boquetp11.384 × 10−1−1.927 × 10⁻¹−4.296 × 10⁻² 85.18172.58130.989811.3607
p26.955 × 10−2−9.27 × 10−35.449 × 10−2 99.86863.02630.987810.7312
p35.971 × 10−22.001 × 10−27.405 × 10−2 71.0006 2.1515 0.990410.5478
p44.544 × 10−2−9.275 × 10−35.449 × 10−2 91.14242.76190.987411.1783
p54.983 × 10−23.389 × 10−27.733 × 10−2 116.61563.53380.984213.0292
Lewickip138.6910.399−0.252 91.47942.77210.989111.6048
p215.8020.6260.195 105.90263.20920.987111.1774
p312.8470.6720.457 77.45412.34710.989611.5859
p414.9230.6130.556 100.48133.04490.986112.3879
p515.1210.6150.446 126.61683.83680.982814.0529
Iglesiasp15.8282.111 233.80696.87670.971939.7798
p25.7753.442 214.7136.31510.973723.6655
p35.5023.686 167.76334.93210.977419.8521
p45.4244.706 226.46116.66060.968819.2150
p55.4644.432 230.56236.78120.968717.1287
MGABp111.1460.92419.784 56.48521.71170.993215.3594
p28.8480.94539.663 79.24952.40150.990315.0906
p37.5850.95759.231 62.91301.90640.991513.1556
p48.4810.93861.969 73.52092.22790.989913.4585
p59.2110.93144.778 88.11952.67030.988116.5624
Pelegp120.31172.4721.4167.22776.11932.37870.990912.7732
p218.33377.0651.0277.21382.81872.58810.989911.5972
p317.25174.1450.9477.16656.19711.75620.992411.2992
p415.86168.3920.76686.22176.96542.40520.989410.7701
p513.24970.3880.64745.87592.17692.88050.987510.6562
Note: GDW, generalized D’Arcy and Watt; MGAB, modified Guggenheim–Anderson–de Boer; p1 to p5 are sample numbers; a, b, c, and d are the equation parameters; R2, determination coefficient; RSS, residue sum of squares; SE, standard error; MRE, mean relative percentage error.
Table 2. The fitting results for the moisture desorption isotherms of polydextrose.
EquationSampleEquationParameters StatisticalParameters
abcdRSSSER2MRE (%)
Ferro-p10.939729.1742.474 271.76196.23490.945411.7105
Fontanp20.9361185.8962.599 269.61408.17010.946611.2267
p30.9381130.6462.601 264.50258.01520.943211.8144
p40.9351500.8412.699 290.61198.80640.936512.3165
p50.936917.1592.559 271.80868.23660.942811.8704
GDWp112.538−6.452 × 10170.985−5.126184.76135.77380.96289.1302
p213.377−7.379 × 10170.995−5.161178.99455.59360.96458.7242
p313.095−4.461 × 10170.981−5.111178.64855.58270.96179.4301
p413.346−1.765 × 10180.986−4.849205.69446.42790.955110.2768
p512.6613.323 × 10180.987−4.914188.03575.87610.96049.6024
Boquetp1−5.186 × 10-30.1350.122 187.75475.68950.96239.6116
p2−4.957 × 10-30.1280.115 189.05665.72890.96259.3613
p3−4.957 × 10-30.1290.116 185.28755.61480.96029.8677
p4−5.073 × 10-30.1290.116 222.94866.75610.951311.1029
p5−5.287 × 10-30.1360.122 196.67045.95970.958610.2154
Lewickip110.2930.694866.000 214.29436.49380.956910.4041
p211.0020.674866.000 213.66496.47470.957610.0556
p310.8440.664866.000 208.25696.31080.955310.4865
p410.9250.658866.000 241.94017.33150.947111.5011
p510.3230.685866.000 220.69656.68770.953610.8351
Iglesiasp14.47411.995 191.41315.62980.96158.8098
p24.50912.834 185.60575.45890.96328.4282
p34.31912.644 188.11485.53280.95969.1332
p44.27212.752 210.93276.20390.95399.9994
p54.36812.046 192.76025.66940.95949.3108
MGABp18.8410.9159.553 × 109 290.07648.79020.941712.8749
p29.4070.9061.067 × 1010 306.64599.29230.939212.7336
p39.2690.9018.621 × 109 293.54068.89520.936913.0781
p49.3110.8991.146 × 1010 339.812610.29740.925713.7825
p58.8410.9119.154 × 109 303.47839.19630.936213.1996
Pelegp114.80369.5574.795 × 10−26.175142.76794.46150.97137.1544
p215.64970.0074.615 × 10−26.162137.39414.29360.97287.3192
p315.18566.0774.065 × 10−26.013136.89644.27810.97068.1769
p415.50666.7214.609 × 10−26.226169.01435.28170.96318.7802
p514.83168.3984.708 × 10−26.238149.82774.68210.96858.4051
Note: GDW, generalized D’Arcy and Watt; MGAB, modified Guggenheim–Anderson–de Boer; p1 to p5 are sample numbers;a, b, c, and d are the equation parameters; R2, determination coefficient; RSS, residue sum of squares; SE, standard error; MRE, mean relative percentage error.
Table 3. The fitting results of our developed polynomial on moisture desorption isotherms of polydextrose.
TypeSampleEquationParameters StatisticalParameters
ABCDEFGR2MRE (%)
Adsp16.485−0.9582.071 × 10−2−1.180 × 10−484.302−229.706228.2850.986633.7978
p2−10.3941.192−6.541 × 10−29.960 × 10−492.916−249.788240.7070.984822.7372
p3−71.0237.841−2.974 × 10−13.640 × 10−383.347−227.405223.0180.985819.7183
p4−9.0241.397−7.000 × 10−21.010 × 10−366.456−183.069191.3130.986714.8199
p527.979−2.8228.911 × 10−2−9.540 × 10−465.568−186.908196.6870.986214.9129
Aver-ads−13.2511.539−7.190 × 10−29.990 × 10−479.082−217.042217.2890.986519.0038
Desp199.812−9.6243.376 × 10−1−3.990 × 10−369.7483−221.873218.4860.99074.5319
p265.482−5.5371.832 × 10−1−2.090 × 10−370.029−222.948219.7520.99184.2282
p362.348−5.0441.608 × 10−1−1.780 × 10−364.764−207.252206.1030.99413.8077
p4104.235−9.9053.454 × 10−1−4.080 × 10−367.713−214.584210.4580.99273.9853
p559.269−5.0221.688 × 10−1−1.980 × 10−369.376−220.301215.9930.99074.4116
Aver-des77.473−6.9462.360 × 10−1−2.750 × 10−368.274−217.403214.3240.99254.1292
Mean32.109−2.7038.220 × 10−2−8.760 × 10−473.678−217.223215.8070.98977.7274
Note: Ads, adsorption; Des, desorption; p1 to p5 are sample numbers; Aver-ads is the average of adsorption data; Aver-des is the average of desorption data; Mean is the average of adsorption and desorption data; A, B, C, D, E, F, and G are the equation parameters; R2, determination coefficient; MRE, mean relative percentage error.
Table 4. Determination of the best-fitting equations for polydextrose.
TypesEquationStatisticalParameters Order
RSSSER2MRE (%)
AdsorptionFerro-Fontan82.1905 ± 14.1148 2.4907 ± 0.4278 0.9893 ± 0.00189.5441 ± 1.16012
GDW83.4176 ± 14.2680 2.6068 ± 0.4458 0.9892 ± 0.0017 9.2179 ± 1.8340 1
Boquet92.7618 ± 16.9791 2.8110 ± 0.5145 0.9879 ± 0.002411.3694 ± 0.9841 5
Lewicki100.3868 ± 18.1913 3.0420 ± 0.5512 0.9869 ± 0.0027 12.1618 ± 1.1444 6
Iglesias214.6613 ± 27.1940 6.3131 ± 0.8007 0.9721 ± 0.0036 23.9282 ± 9.1707 8
MGAB72.0576 ± 12.6291 2.1836 ± 0.3827 0.9906 ± 0.0019 14.7253 ± 1.4124 4
Peleg76.8555 ± 13.2063 2.4017 ± 0.4127 0.9900 ± 0.0018 11.4192 ± 0.8490 3
Polynomial107.8395 ± 10.64173.7186 ± 0.36690.9860 ± 0.000821.1972 ± 7.80227
DesorptionFerro-Fontan273.6598 ± 9.93267.8926 ± 0.9738 0.9429 ± 0.003911.7877 ± 0.38987
GDW187.2269 ± 11.05835.8508 ± 0.3456 0.9609 ± 0.0036 9.4327 ± 0.57774
Boquet196.3436 ± 15.4681 5.9498 ± 0.4688 0.9589 ± 0.0046 10.0318 ± 0.6771 5
Lewicki219.7705 ± 13.1546 6.6597 ± 0.3986 0.9541 ± 0.0042 10.6565 ± 0.5475 6
Iglesias193.7653 ± 9.9971 5.6989 ± 0.29400.9595 ± 0.0035 9.1363 ± 0.5881 3
MGAB306.7108 ± 19.7252 9.2943 ± 0.59770.9359 ± 0.0061 13.1337 ± 0.4048 8
Peleg147.1801 ± 13.2734 4.5994 ± 0.4148 0.9693 ± 0.0038 7.9672 ± 0.7031 2
Polynomial38.5874 ± 8.01251.3306 ± 0.27630.9920 ± 0.00144.1929 ± 0.29811
Note: GDW, generalized D’Arcy and Watt; MGAB, modified Guggenheim–Anderson–de Boer; R2, determination coefficient; RSS, residue sum of squares; SE, standard error; MRE, mean relative percentage error.
Table 5. The parameters for the optimal equations.
EquationTypesEquationParameters StatisticalParameters
abcdR2MRE (%)
Ferro-FontanAds1.1254.5010.763 0.99058.6309
Des0.9371052.9592.584 0.943811.7343
Mean0.98238.3771.544 0.97799.4624
GDWAds1.3761.090 × 10120.9366.7640.99028.3919
Des11.9979.200 × 10110.9850.4210.96189.3906
Mean6.7498.550 × 1070.9611.0360.98367.1238
BoquetAds6.820 × 10−2−6.640 × 10−35.520 × 10−2 0.989111.0751
Des−5.100 × 10−30.1320.118 0.96019.9857
Mean−1.300 × 10−30.1510.144 0.98386.6885
PelegAds16.83773.0320.9446.7660.991110.9682
Des15.16668.2524.423 × 10−26.1480.97047.9234
Mean13.24171.5320.23046.0260.98617.0115
Note: GDW, generalized D’Arcy and Watt; Ads, adsorption; Des, desorption; mean is the average of desorption and adsorption isotherms; a, b, c, and d are the equation parameters; R2, determination coefficient; RSS, residue sum of squares; SE, standard error; MRE, mean relative percentage error.
Table 6. Effect of polydextrose addition on the gelatinization properties of rich starch.
SampleΔH (J/g)To (°C)Tp (°C)Tc (°C)Peak Width (°C)Peak Height
(0.01 mW/mg)
CK9.63 ± 0.03 a64.00 ± 0.10 a70.63 ± 0.31 ab78.50 ± 0.44 a7.70 ± 0.20 a16.37 ± 0.53 a
3%PD9.26 ± 0.29 b64.00 ± 0.20 a70.47 ± 0.15 b77.30 ± 0.17 b7.57 ± 0.12 a16.2 ± 0.43 a
5%PD8.91 ± 0.26 bc64.07 ± 0.23 a70.37 ± 0.15 b77.20 ± 0.46 b7.53 ± 0.21 a15.6 ± 0.95 a
7%PD8.82 ± 0.09 c64.15 ± 0.21 a70.90 ± 0.14 a77.55 ± 0.35 b7.50 ± 0.28 ab15.3 ± 0.55 a
10%PD8.81 ± 0.39 bc64.10 ± 0.20 a71.07 ± 0.32 a77.47 ± 0.35 b7.23 ± 0.06 b15.8 ± 0.44 a
Note: CK, the control rice starch, PD, polydextrose; ΔH, enthalpy of gelatinization; To, the onset temperature of gelatinization; Tp, the peak temperature of gelatinization; Tc, the conclusion temperature of gelatinization. Data are expressed as mean ± standard deviation (SD), number of repetitions n = 3. Means with the different superscript letters in a column are different significantly (p < 0.05) among different polydextrose added samples.
Table 7. The polydextrose samples used in this study.
NoProducing PlantRegionMoisture Content
(% Wet Basis)
p1Renliang Biotechnology Co., LTD.Shanghai, China1.00
p2Taili Jie Biotechnology Co., LTD.Mengzhou, Henan province, China2.60
p3Baoling Bao Biotechnology Co., LTD.Yucheng, Shandong province, China3.31
p4BailongChuangyuan Biotechnology Co., LTD.Yucheng, Shandong province, China4.42
p5XingguangShouchuang Biotechnology Co., LTD.Dezhou, Shandong province, China4.66
Table 8. EMC equations used in this study.
Equation NameFormulaReference
Ferro-Fontan M = b l n a a w 1 / c Saberi, et al. [21]
GDW M = a · b · a w 1 + b · a w · 1 c · 1 d · a w 1 c · a w Furmaniak, et al. [22]
Boquet M = a w a + b · a w + c · a w 2 Boquet, et al. [23]
Lewicki M = a 1 a w b a 1 + a w c Saberi, et al. [21]
Iglesias–Chirife M = a a w 1 a w + b Iglesias and Chirife [24]
MGAB M = a · b · c / t · a w ( 1 b · a w ) 1 b · a w + b · c / t · a w Cao, et al. [25]
Peleg M = a · a w c + b · a w d Peleg [26]
Note: GDW, generalized D’Arcy and Watt; MGAB, modified Guggenheim–Anderson–de Boer; M is equilibrium moisture (%), aw is water activity, t is temperature (°C). a, b, c, and d are the equation parameters.
Disclaimer/Publisher’s Note: The statements, opinions and data contained in all publications are solely those of the individual author(s) and contributor(s) and not of MDPI and/or the editor(s). MDPI and/or the editor(s) disclaim responsibility for any injury to people or property resulting from any ideas, methods, instructions or products referred to in the content.

