2.4.1. Effects of pH and Cationic Degree of CAmGs
Among the external parameters that can affect the adsorption of dyes onto ionic gels, the pH of the adsorption system is the most important [
25,
26]. In addition, the charge balance between the cationic and anionic groups of an ionic gel may have a great influence on its dye adsorption [
27,
28,
29]. Therefore, the effects of these parameters on the adsorption of anionic dyes onto CAmGs
1–
3 and CMCG were assessed using AR9 as the anionic dye.
Figure 6 shows the AR9 color removal by the hydrogels at various pH values ranging between 2 and 12; photographs of the AR9 solutions with CAmG
3 at pH 3 and pH 6 are also shown in this figure. Color removal by CAmGs
1–
3 reached over 95% at pH values of 2 and 3, an amount that was sharply reduced as the solutions’ pH values increased in value from 4 to 6, and that was almost constant at pH values between 7 and 12. The CAmGs’ ranking in decreasing order of color removal over the whole pH region is as follows: CAmG
3 > CAmG
2 > CAmG
1. These findings indicate that the adsorption of AR9 was mainly caused by the electrostatic attraction forces between the anionic dye and the cationic groups of the gels, because the carboxymethyl groups of the CAmGs lost negative charge at pH values of 2 and 3 due to protonation, but are charged negatively in neutral and alkaline solutions. This results in a drastic decrease of color removal at higher pH values, due to the electrostatic repulsion between the anionic dye and the anionic carboxymethyl groups. For CMCG, although almost no color removal could be observed in the neutral and alkaline region due to the electrostatic repulsion between the dye and the carboxylate anion of CMCG, only 8% color removal was detected in solutions in the pH range of 2‒4.
Figure 6.
(A) Effect of pH on the color removal of AR9 by CAmGs 1‒3 and CMCG. The color removal was performed under the following conditions: hydrogel content (dried): 20 mg; AR9 initial concentration: 200 mg/L; 298 K; contact time: 24 h; and volume of AR9 solution: 10 mL; (B) Photographs of the adsorption of AR9, AR13, and AB92 onto CAmG 3 at pH 3 and 6.
2.4.3. Adsorption Kinetics
The contact time between the adsorbent and the dye molecules is another important parameter for the adsorption process because it can provide information on the kinetics of the dye for a given initial concentration of adsorbent [
20,
28]. Therefore, the effect of contact time on the adsorption ability of CAmGs
1–
3 for AR9, AR13, and AB92 was investigated at pH 3; these data are shown in
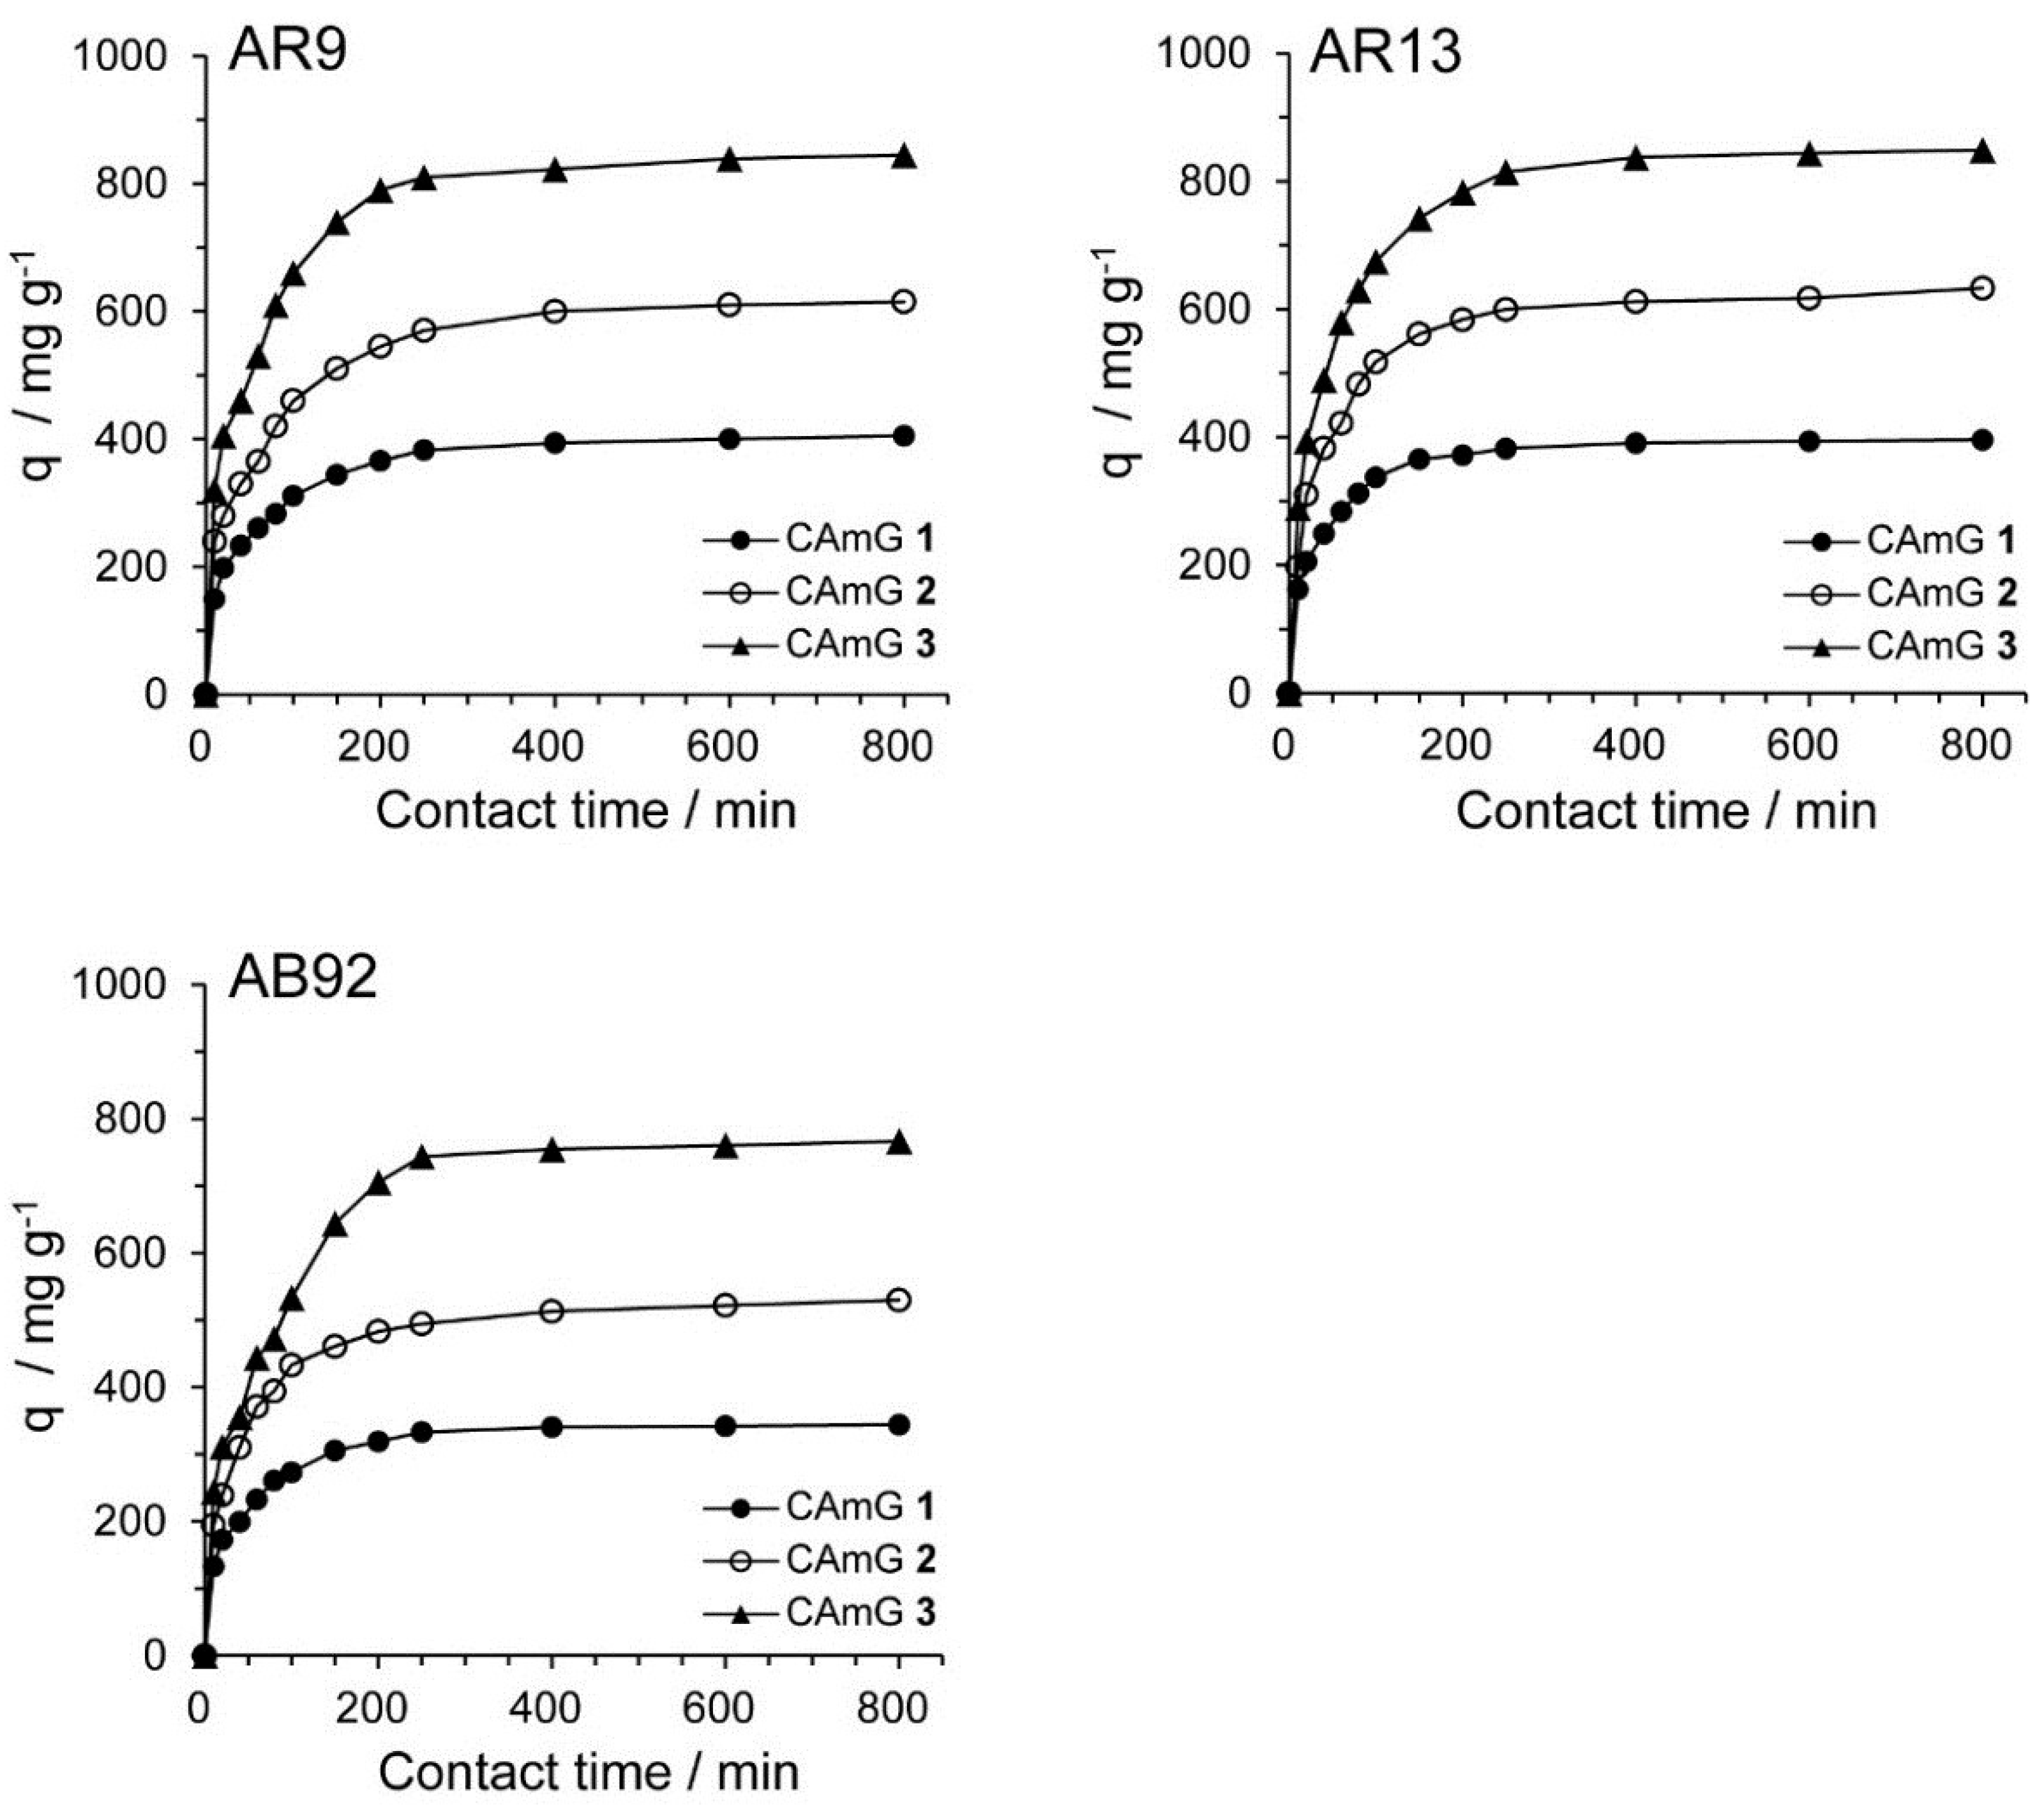
Figure 8. The adsorption behavior of AR9, AR13, and AB92 onto each CAmG can be divided into three regions: the adsorption rapidly increased in the first 30 min, then gradually increased until equilibrium was reached at a contact time of 250 min, after which it remained constant. The behavior in the first region is due to the rapid diffusion of the anionic dye to the cationic groups on the surface of CAmGs and the subsequent charge neutralization. The second region, with a slower increase in the adsorption of the dyes, is due to the decrease of the effective cationic charge on the CAmGs’ surfaces and the adsorption of dye molecules onto the inside of the gels. After 250 min, the third region begins, where there is almost no further increase in dye adsorption onto the CAmGs, indicating that the equilibrium time for their dye adsorption is about 250 min.
Figure 8.
Effect of contact time on the adsorption ability of CAmGs 1‒3 toward AR9, AR13, and AB92. The adsorption experiments were performed under the following conditions: hydrogel content (dried): 20 mg; initial concentration of each dye: 200 mg/L; 298 K; pH 3; and volume of each dye solution: 10 mL.
Several kinetic models have been previously used to describe the kinetics of dye adsorption by hydrogels [
31], activated carbons [
32], and others. Among these models, a pseudo-first order [
33] and a pseudo-second order kinetic model [
34] have been frequently used to describe dye adsorption onto ionic hydrogels. The pseudo-first order and pseudo-second order kinetic models are expressed by
respectively, where
k1 and
k2 are the rate constants for the pseudo-first order and pseudo-second order kinetic models, while
qe and
qt are the adsorption abilities of each hydrogel at equilibrium and at contact time
t, respectively. Based on
Figure 8, ln(
qe −
qt) was plotted
versus t (
Figure 9A) and the slopes and intercepts of the plots were used to determine the pseudo-first order rate constant
k1 and the theoretical adsorption ability at equilibrium,
qe,cal. Likewise, to discover if the pseudo-second order model was applicable, the slopes and intercepts of plots of
t/
qt versus t were used to determine the pseudo-second order rate constants
k2 and the corresponding theoretical adsorption abilities at equilibrium
qe,cal (
Figure 9B). The kinetic parameters for the two kinetic models determined from the curve-fitting plots are presented in
Table 3 and
Table 4. The correlation coefficients (
R2) for the pseudo-second order kinetic model are in the range of 1.000–0.997, considerably higher than those for the pseudo-first order model (
R2 = 0.842–0.980). In
Figure 8, the equilibrium time for the adsorption was defined to be 800 min, and each
qt value at
t = 800 min was used for
qe. Moreover, it was found that the theoretical
qe,cal values determined by the pseudo-second order model were more consistent with the experimentally determined
qe at 800 min, compared with the
qe,cal determined by the pseudo-first order kinetic model, suggesting that the pseudo-second order adsorption mechanism was predominant for the adsorption of these anionic dyes onto the CAmGs. Similar kinetic behavior has been reported for the electrostatic adsorption of ionic dyes onto polysaccharide-based hydrogels [
35,
36]. Therefore, it is possible to predict the flocculation behavior of anionic dyes in the presence of CAmGs over the entire range of contact time by using the rate constant values (
k2) determined for the pseudo-second order kinetic model.
Figure 9.
Pseudo-first order (A) and pseudo-second order (B) kinetic plots for the adsorption of AR9, AR13, and AB92 onto the CAmGs 1‒3.
Figure 9.
Pseudo-first order (A) and pseudo-second order (B) kinetic plots for the adsorption of AR9, AR13, and AB92 onto the CAmGs 1‒3.
Table 3.
Kinetics parameters for the adsorption of AR9, AR13, and AB92 onto CAmGs 1‒3, determined by fitting to the pseudo-first order kinetic model.
Table 3.
Kinetics parameters for the adsorption of AR9, AR13, and AB92 onto CAmGs 1‒3, determined by fitting to the pseudo-first order kinetic model.
| Dye | Adsorbent | qe, t = 800 min a/mg·g−1 | k1/min−1 | qe,cal/mg·g−1 | R2 |
|---|
| AR9 | CAmG 1 | 405 | 0.00716 | 223 | 0.943 |
| CAmG 2 | 615 | 0.00775 | 386 | 0.980 |
| CAmG 3 | 845 | 0.00796 | 469 | 0.943 |
| AR13 | CAmG 1 | 396 | 0.00859 | 187 | 0.935 |
| CAmG 2 | 633 | 0.00613 | 291 | 0.842 |
| CAmG 3 | 849 | 0.00857 | 477 | 0.955 |
| AB92 | CAmG 1 | 344 | 0.00877 | 185 | 0.941 |
| CAmG 2 | 530 | 0.00666 | 266 | 0.918 |
| CAmG 3 | 767 | 0.00859 | 503 | 0.931 |
Table 4.
Kinetics parameters for the adsorption of AR9, AR13, and AB92 onto CAmGs 1‒3, determined by fitting to the pseudo-second order kinetic model.
Table 4.
Kinetics parameters for the adsorption of AR9, AR13, and AB92 onto CAmGs 1‒3, determined by fitting to the pseudo-second order kinetic model.
| Dye | Adsorbent | qe, t = 800 min a/mg·g−1 | k2/g mg−1·min−1 | qe,cal/mg·g−1 | R2 |
|---|
| AR9 | CAmG 1 | 405 | 8.32 × 10⁻⁵ | 411 | 0.999 |
| CAmG 2 | 615 | 4.79 × 10⁻⁵ | 621 | 0.998 |
| CAmG 3 | 845 | 4.15 × 10⁻⁵ | 850 | 0.999 |
| AR13 | CAmG 1 | 396 | 1.23 × 10⁻⁵ | 398 | 1.000 |
| CAmG 2 | 633 | 6.35 × 10⁻⁵ | 644 | 1.000 |
| CAmG 3 | 849 | 4.36 × 10⁻⁵ | 852 | 0.999 |
| AB92 | CAmG 1 | 344 | 1.15 × 10⁻⁵ | 346 | 0.999 |
| CAmG 2 | 530 | 7.34 × 10⁻⁵ | 532 | 1.000 |
| CAmG 3 | 767 | 3.28 × 10⁻⁵ | 772 | 0.997 |
In general, the shape and particle size of the adsorbent affect the diffusion of adsorbate within the adsorbent particles [
37]. Therefore, the adsorption kinetics strongly depend on the parameters of the adsorbent. In this study, even if the particle shapes of CAmGs were irregular, adsorption kinetics of anionic dyes onto CAmGs could be fitted by the pseudo-second order kinetic model. This indicated that particles in each CAmG have a different adsorption ability towards anionic dyes and that the adsorption ability of each CAmG was the averaged ability of all particles contained in the hydrogel.
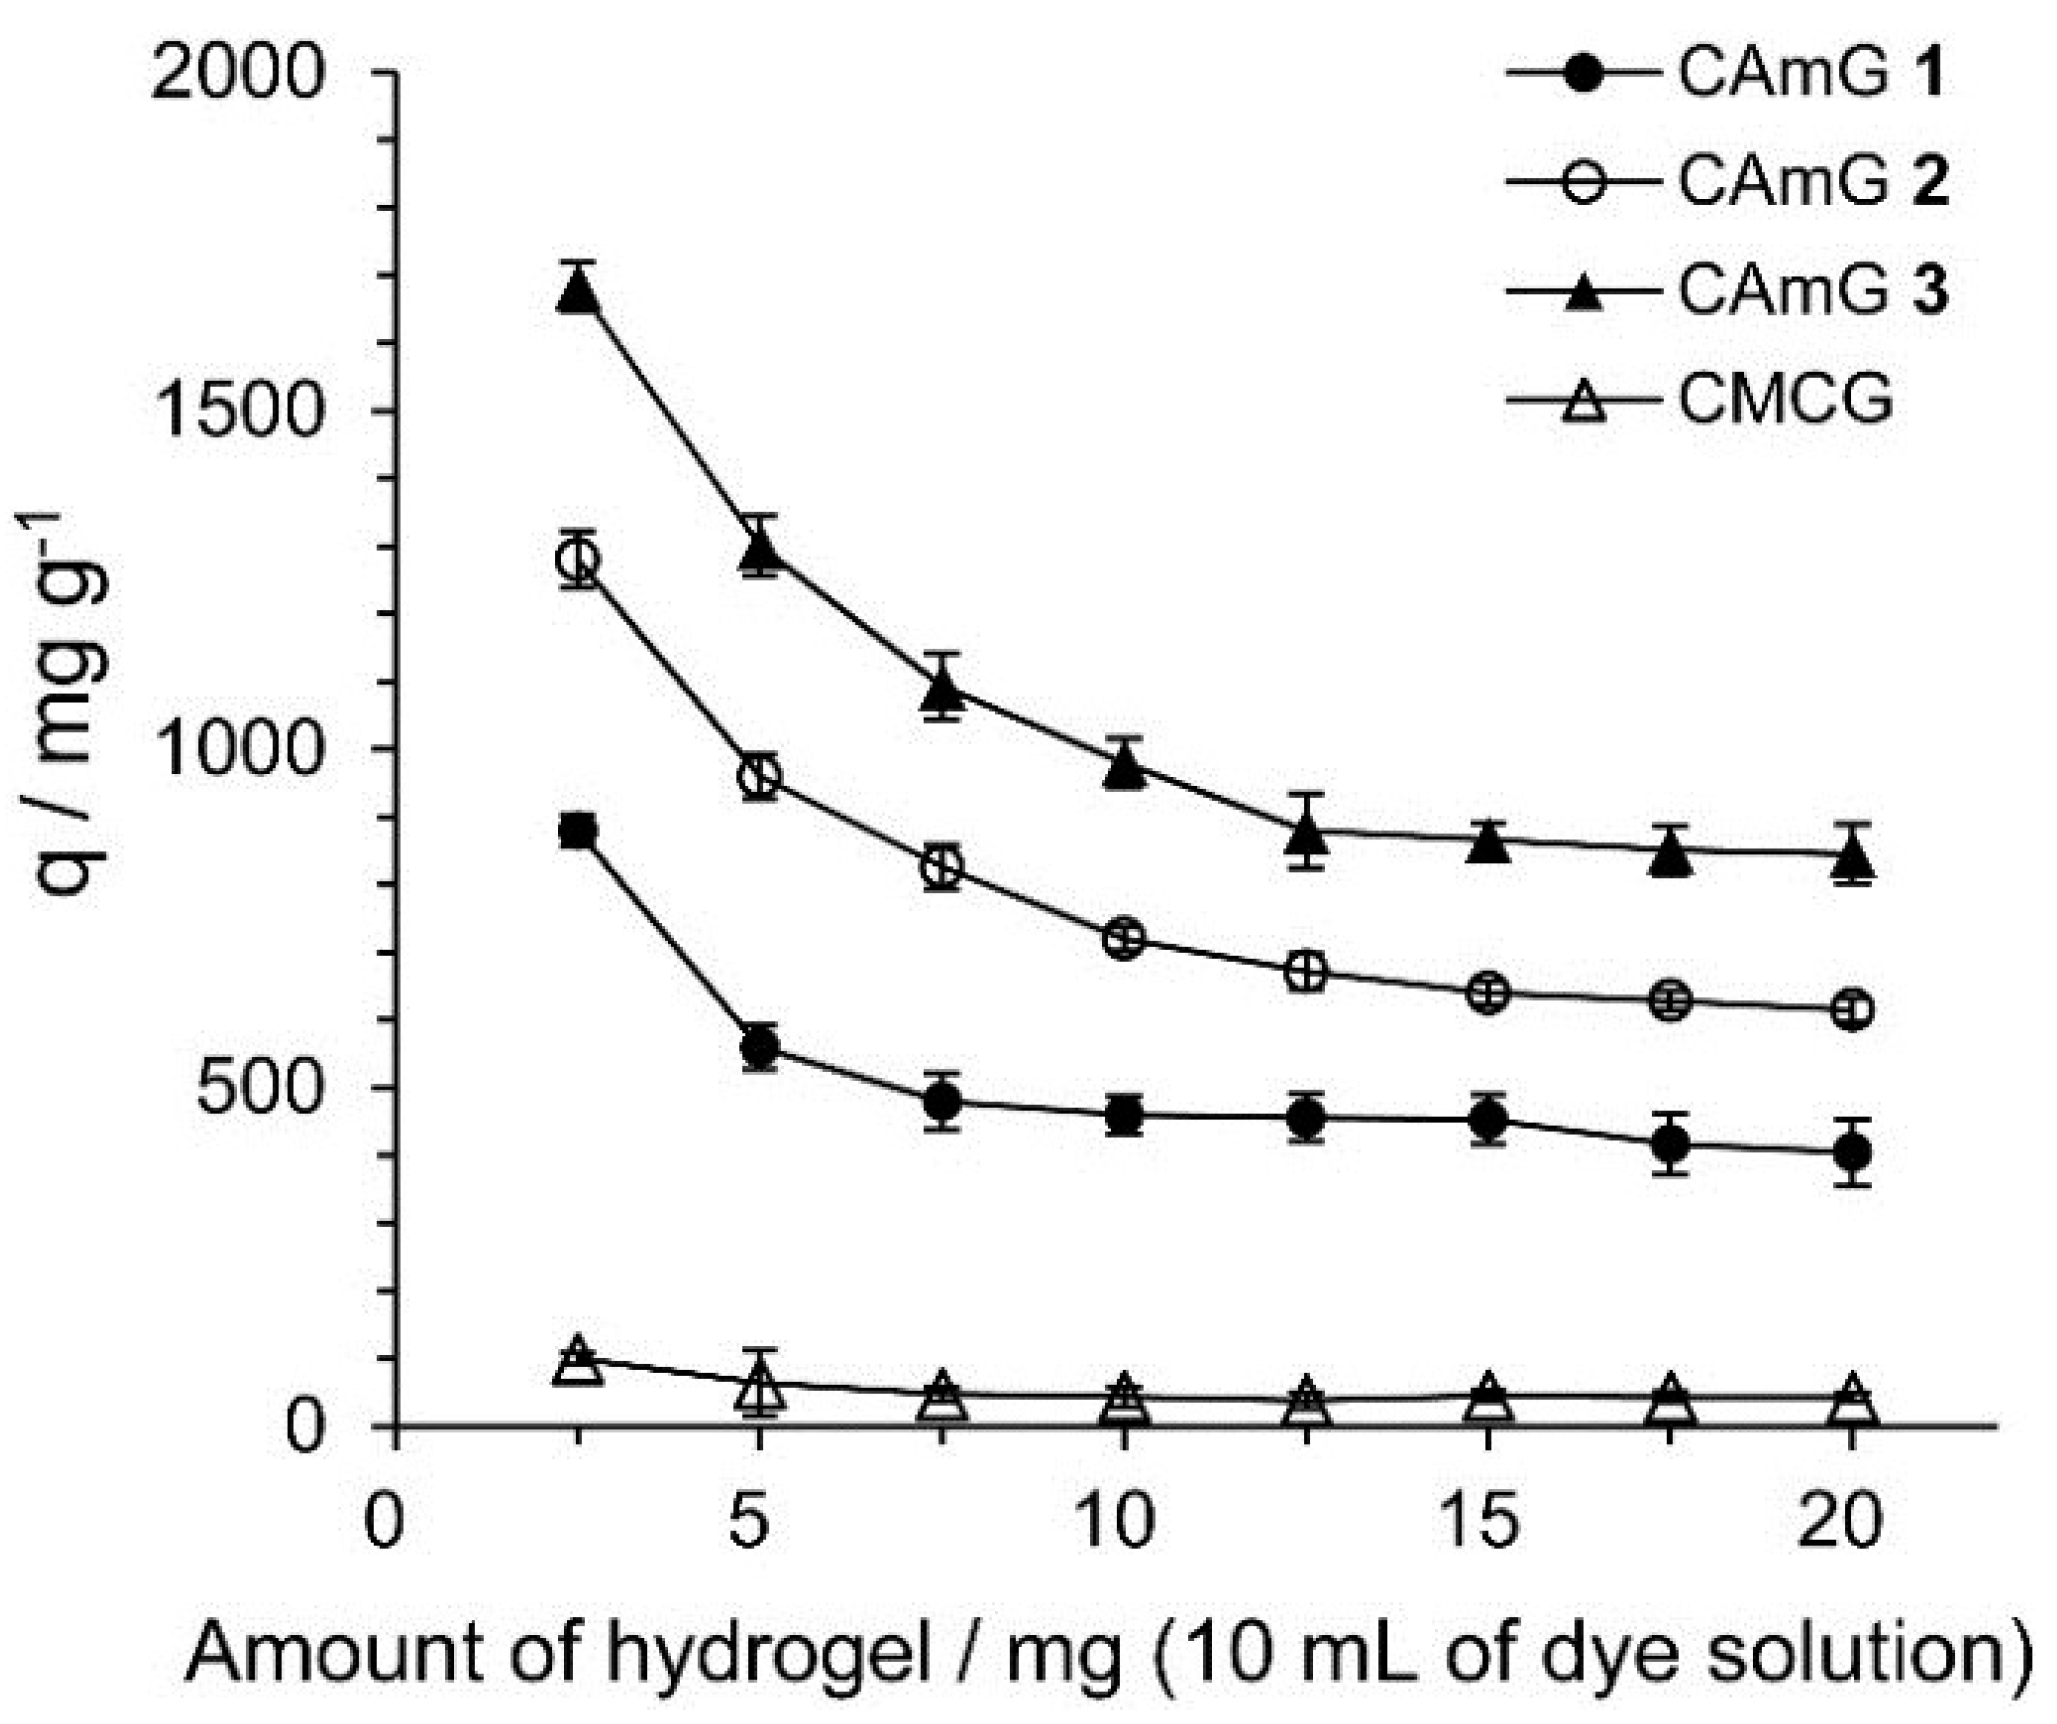
2.4.4. Adsorption Isotherms
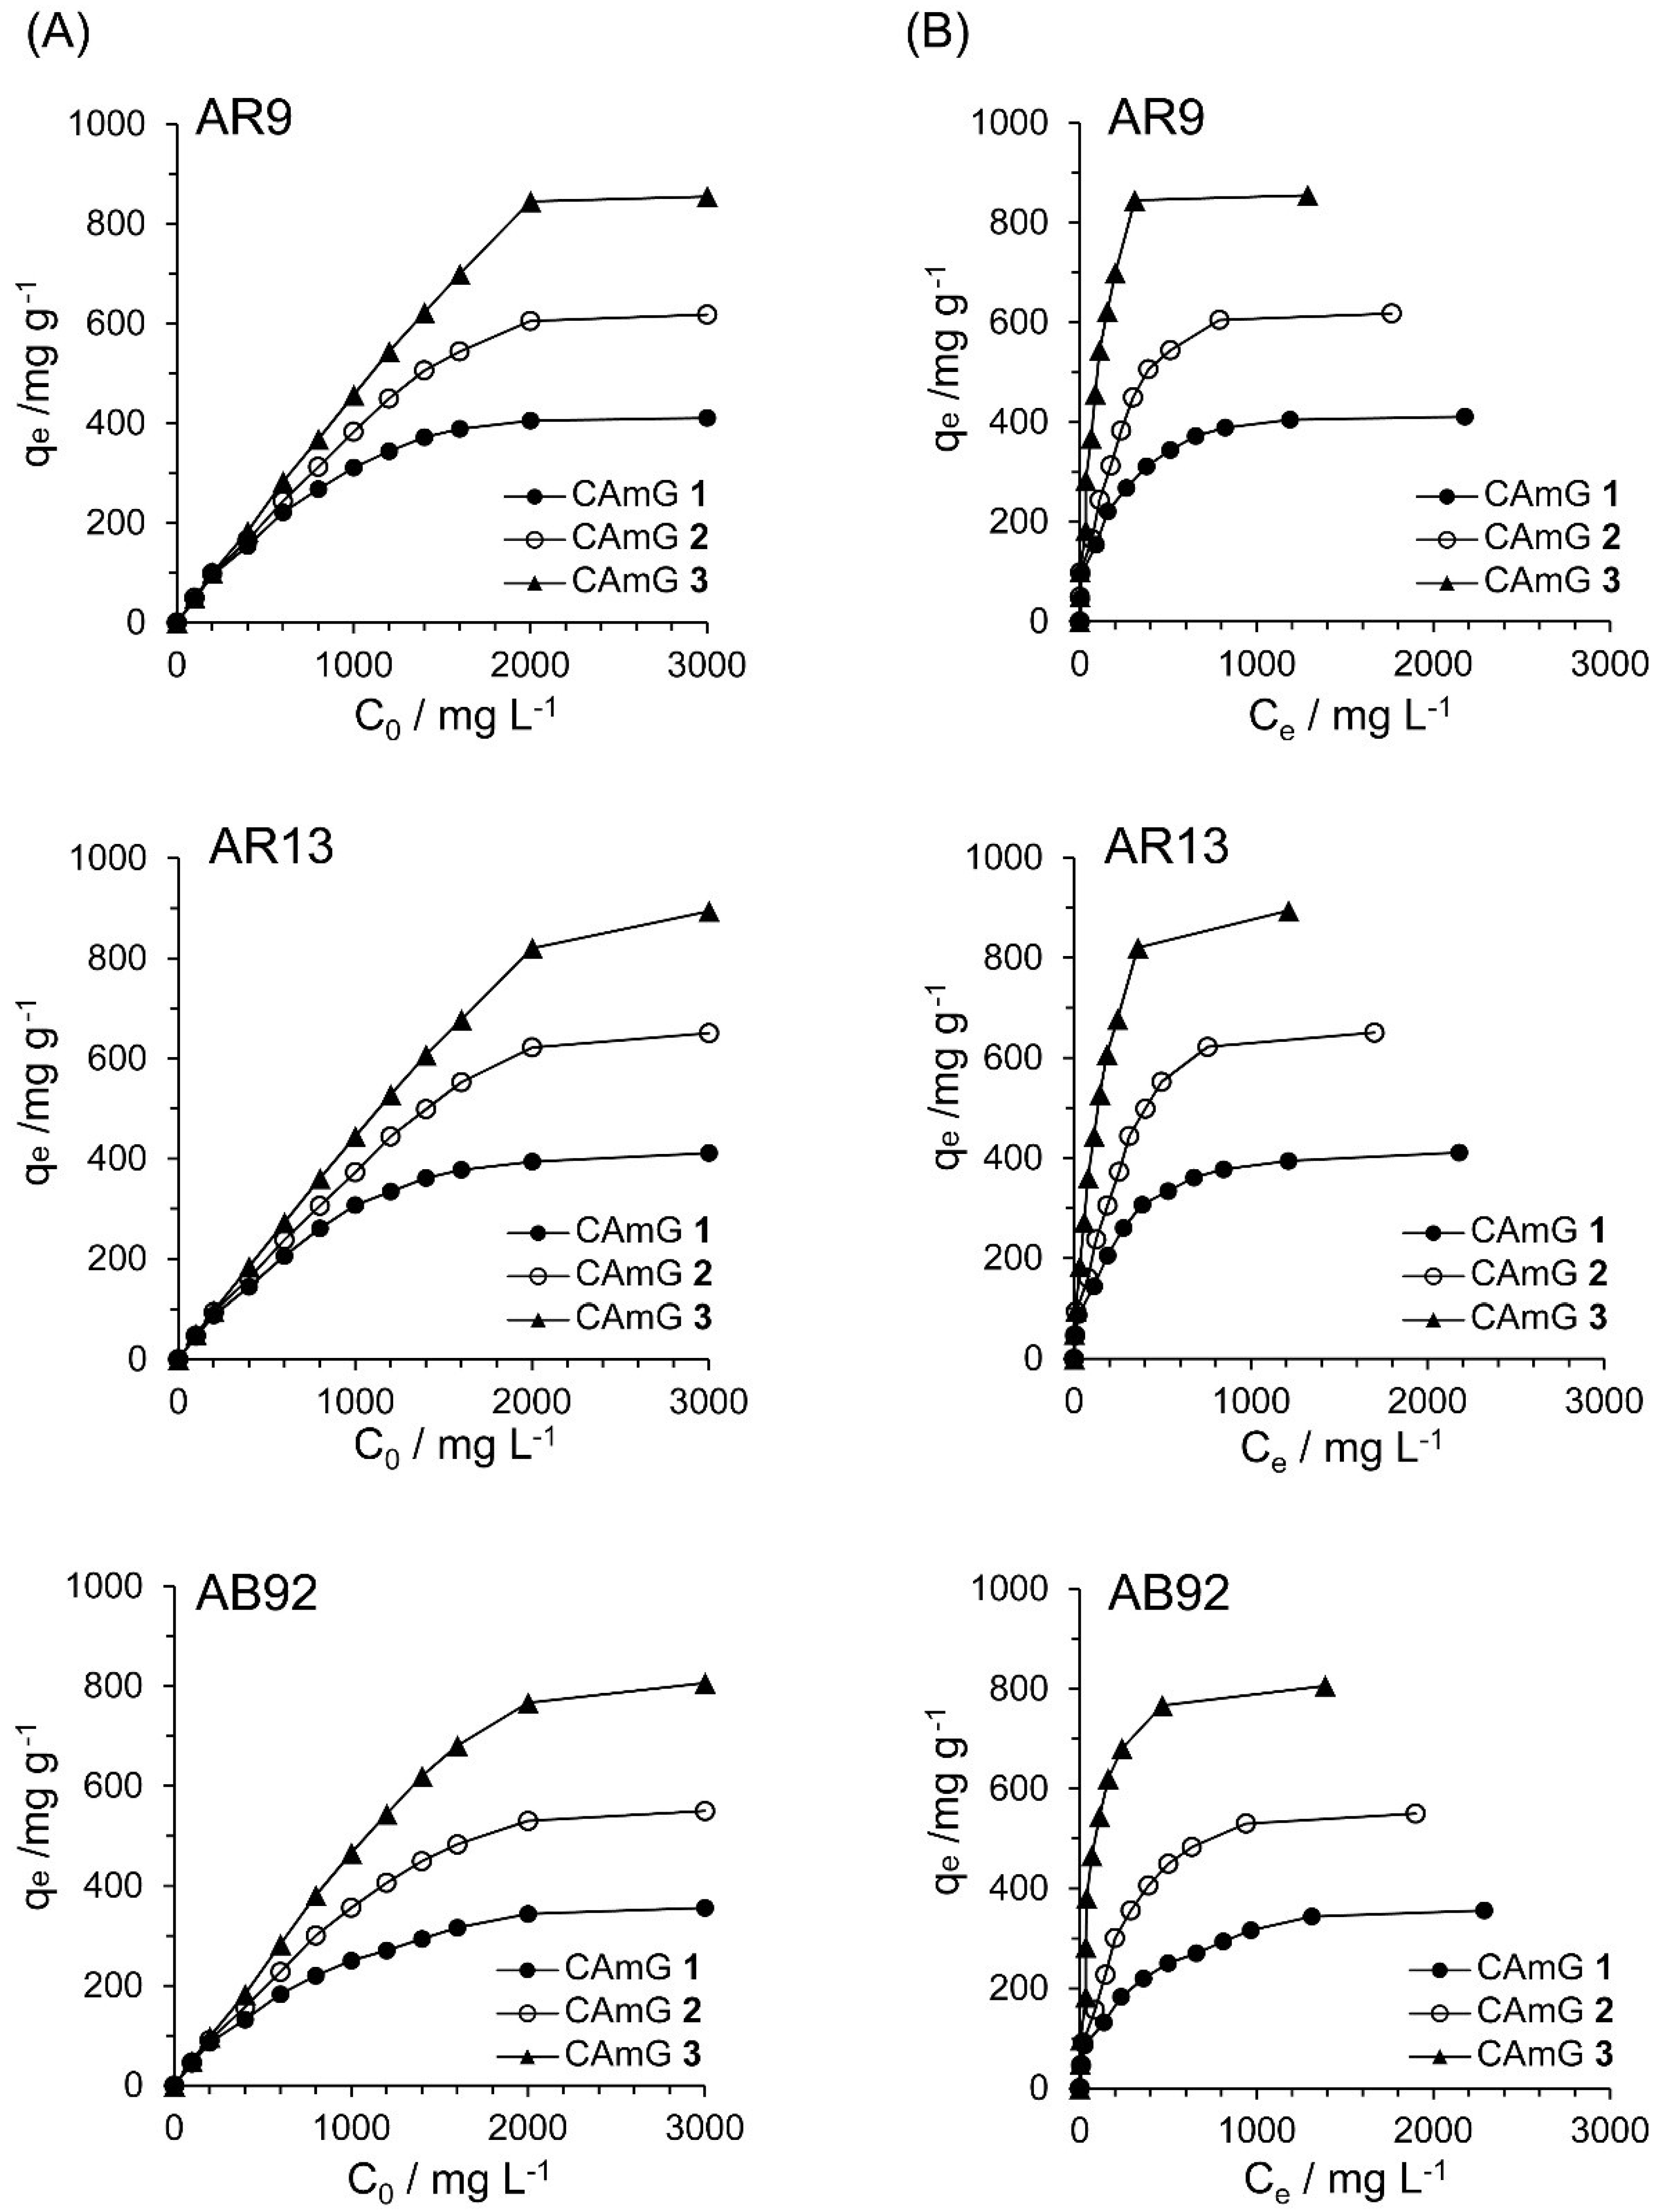
Figure 10A shows the effect of the initial dye concentration (
C0) of dyes AR9, AR13, and AB92 on the flocculation ability at equilibrium (
qe) of each CAmG at pH 3. For all cationic dyes, elevated
qe values were observed with an increase in
C0, and saturation levels were gradually achieved at initial concentrations of over 2000 mg·L
−1. In addition, a ranking of the CAmGs according to their saturated
qe values for all dyes, in increasing order, is CAmG
1 < CAmG
2 < CAmG
3, indicating that the anionic dyes were adsorbed via the charge neutralization mechanism.
Figure 10.
Effects of initial concentration (A) and equilibrium concentration (B) of AR9, AR13, and AB92 on the qe of CAmGs 1‒3 toward AR9, AR13, and AB92. The adsorption experiments were performed under the following conditions: hydrogel content (dried): 20 mg; 298 K; pH 3; and volume of each dye solution: 10 mL.
Adsorption is commonly described through the use of isotherms, meaning the amount of adsorbate on the adsorbent as a function of pressure, in the case of a gas, or concentration, in the case of a liquid, at a constant temperature. The adsorption isotherm is important for describing the interaction of the adsorbates with the adsorbents, and for optimizing the use of adsorbents. Among a number of isotherm models, the Langmuir and Freundlich ones [
35,
36,
38,
39], which are frequently used to model the adsorption of dye onto polymer surfaces, were applied here to the adsorption of the anionic dyes by CAmGs
1‒
3.
The basic assumption of the Langmuir isotherm model is that adsorption occurs at specific homogeneous sites on the adsorbent. It is further assumed that once an adsorbate occupies a site, no further adsorption can take place at that site [
40]. Therefore, the linear form of the Langmuir equation can be expressed by
where
qe is amount of adsorbate on the adsorbent at equilibrium (mg·g
−1),
Q0 is the adsorbate’s maximum monolayer coverage capacity (mg·g
−1),
b is the Langmuir isotherm constant (L·mg
−1), and
Ce is the equilibrium concentration of adsorbate (mg·L
−1) in solution. Moreover, a dimensionless constant, commonly known as the separation factor (
RL) defined by Weber and Chakravorti [
39], can be represented as
Based on its
RL value, an adsorption process can be categorized as unfavorable (
RL > 1), linear (
RL = 1), favorable (0 <
RL < 1), or irreversible (
RL = 0). On the other hand, the linearized form of the Freundlich isotherm equation is given by [
39],
where
KF is the Freundlich isotherm constant, which relates to the adsorption capacity, and the dimensionless constant
n−1 is an empirical constant, which gives valuable information about the isotherm’s shape. Based on the
n−1 values, the adsorption process may be classified as irreversible (
n−1 = 0), favorable (0 <
n−1 < 1), or unfavorable (
n−1 > 1).
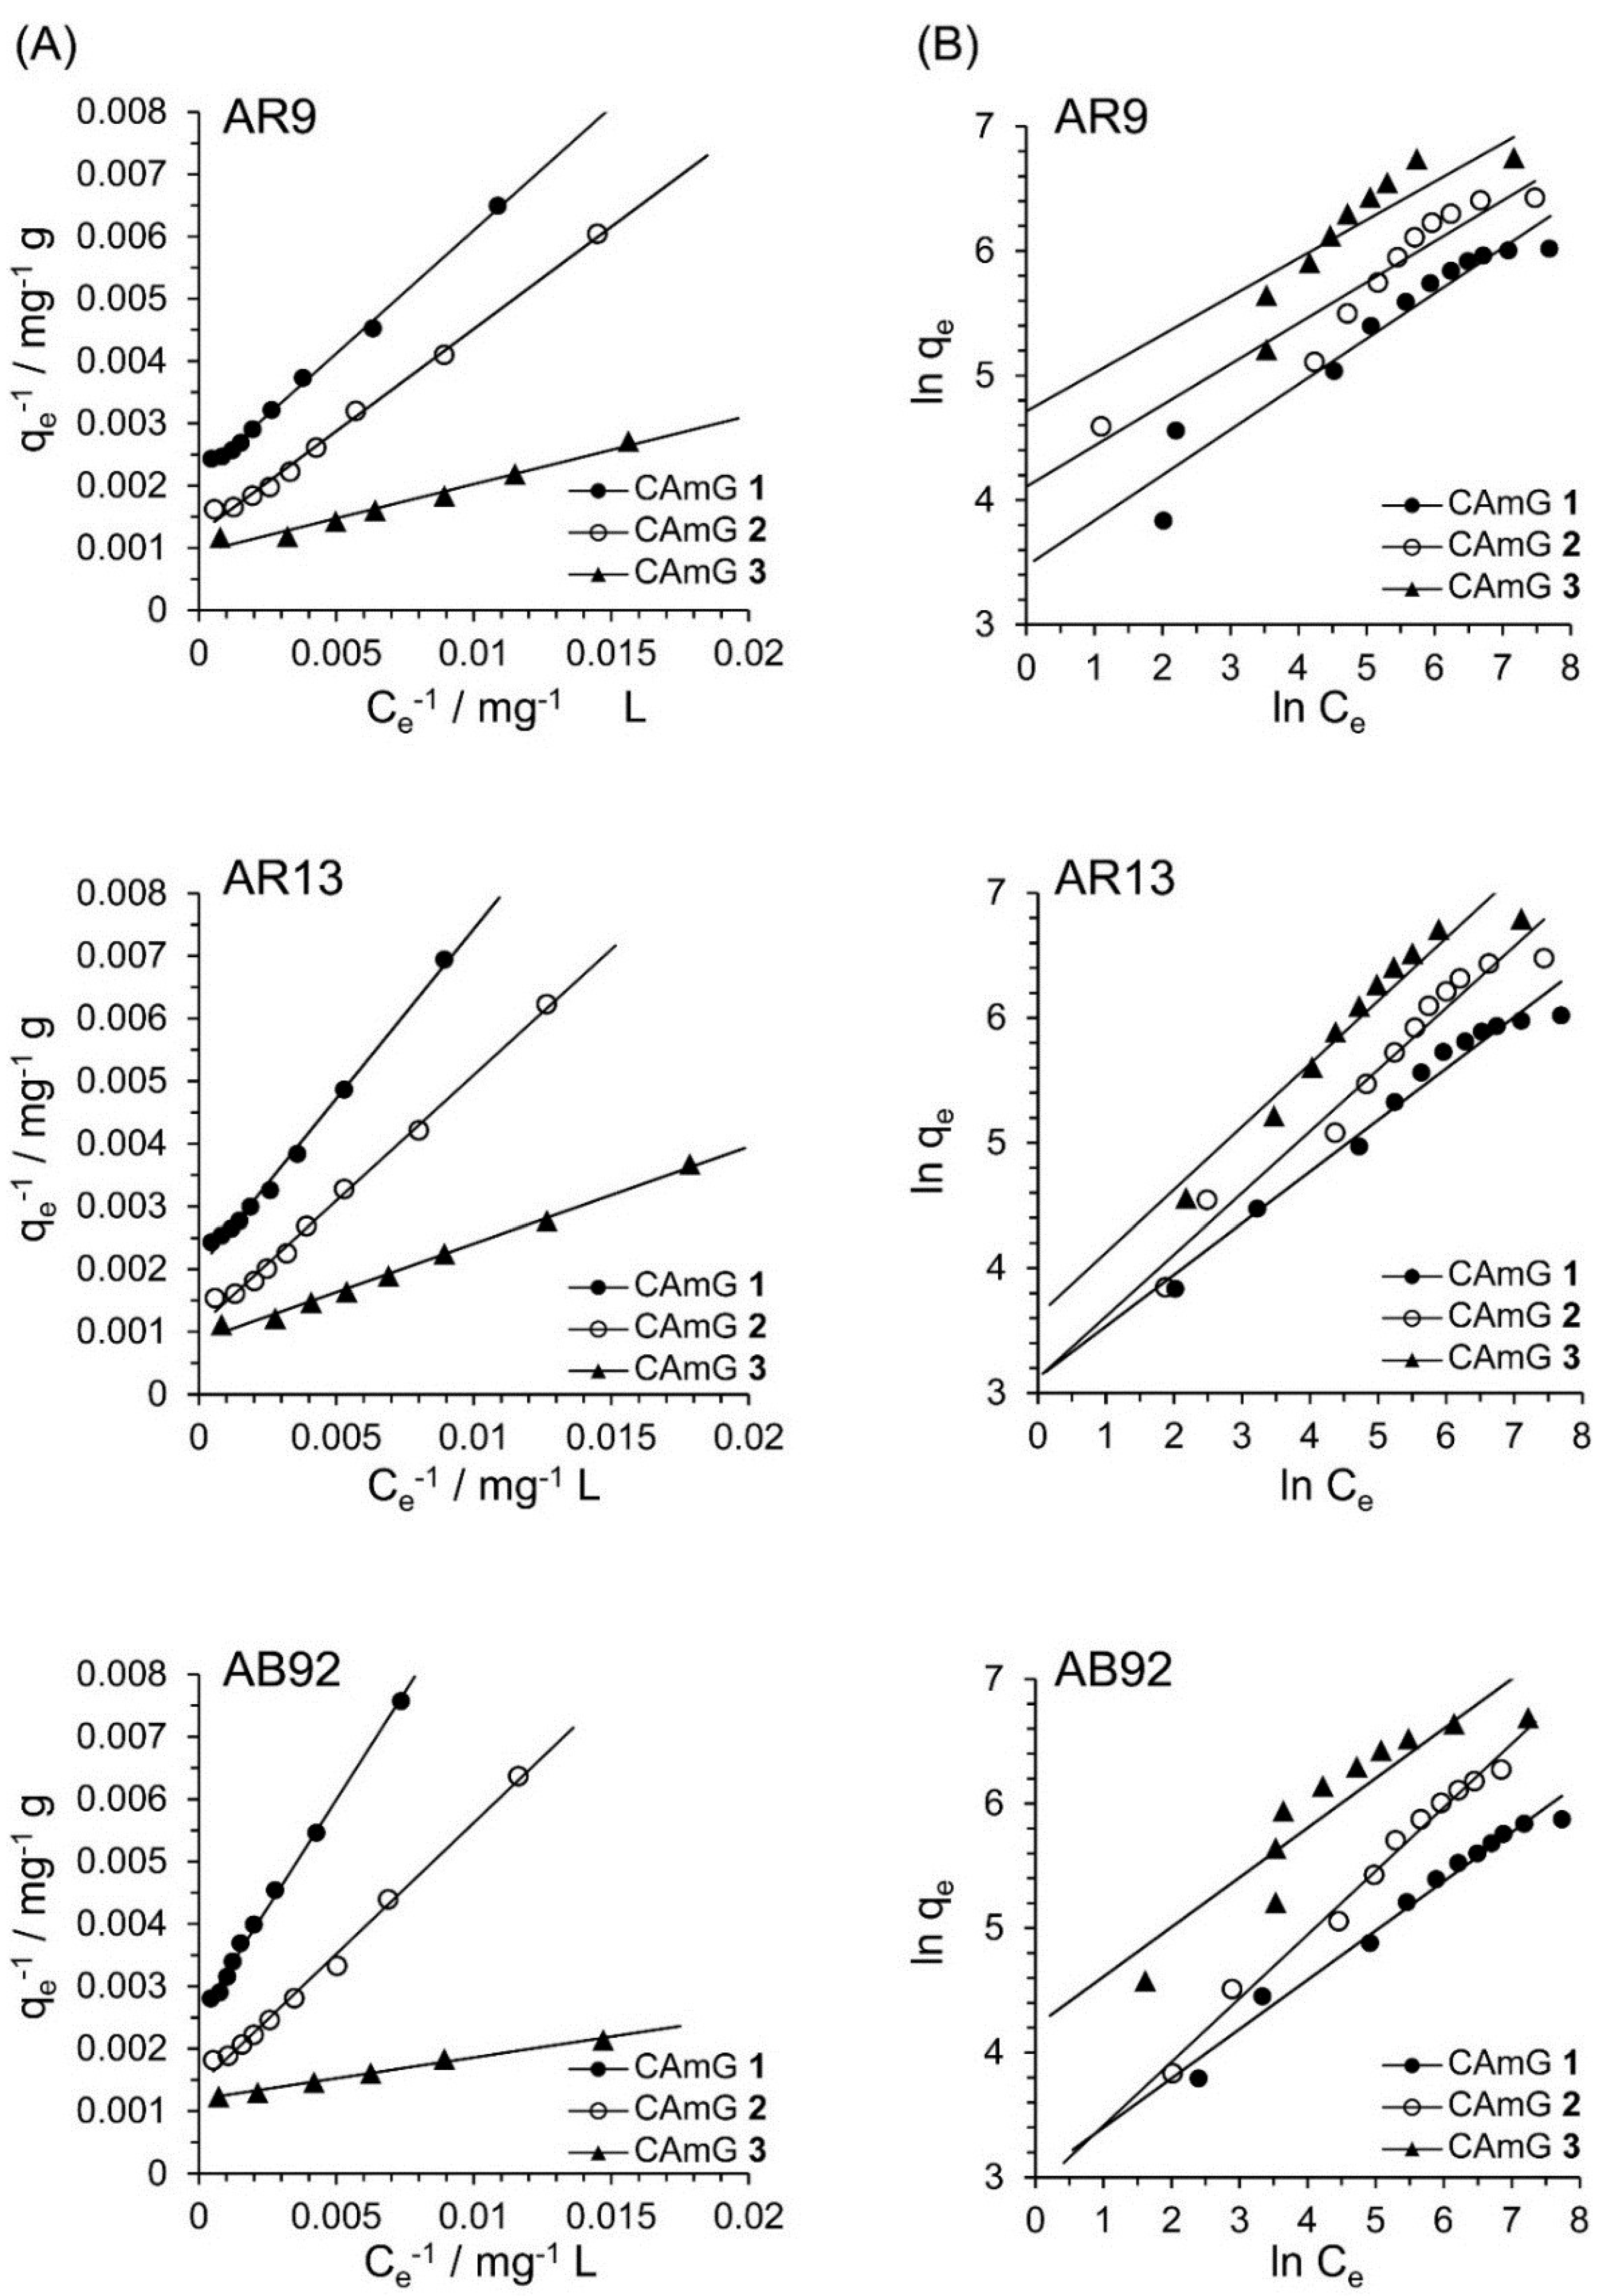
Based on
Figure 10A, the effects of the equilibrium concentrations of the anionic dyes on the adsorption abilities of CAmGs
1‒
3 are shown in
Figure 10B, and linear plots corresponding to the Langmuir and Freundlich isotherm models for the adsorption of each anionic dye on the CAmGs are presented in
Figure 11. The linearized isotherm coefficients for these models, determined from the plots, are summarized in
Table 5 and
Table 6. The values of the dimensionless constant
RL obtained from the Langmuir model fall in range of 0.115–0.255, indicating the favorable adsorption of all of the anionic dyes onto each CAmG. Additionally, for the Freundlich model, the values of the empirical constant
n−1 lie in the range of 0.655–0.908, also indicating the favorable adsorption of the dyes onto the CAmGs. However, the correlation coefficients
R2 for the Langmuir model are in range of 0.996–0.999, while those for the Freundlich model are lower, in the range of 0.942–0.991. In addition, as shown in
Table 5, the maximum monolayer coverage capacities (
Q0) of the CAmGs for the anionic dyes were in good agreement with the equilibrium adsorption abilities of the CAmGs. These data imply that the adsorption of the anionic dyes onto the CAmGs follows a Langmuir-type adsorption mechanism. The values of the Langmuir constant b, which represents the constant of dissociation of adsorbed dye molecules to free anionic dyes, are on the order of 10
−2–10
−3, indicating that the flocculi formed by the anionic dyes and the CAmGs are very stable in solution.
Figure 11.
Langmuir isotherm (A) and Freundlich isotherm (B) for the encapsulation of AR9, AR13, and AB92 adsorption in the CAmGs at pH 3 and 298 K.
Figure 11.
Langmuir isotherm (A) and Freundlich isotherm (B) for the encapsulation of AR9, AR13, and AB92 adsorption in the CAmGs at pH 3 and 298 K.
Table 5.
Langmuir isotherm coefficients for the adsorptions of AR9, AR13, and AB92 onto CAmGs.
Table 5.
Langmuir isotherm coefficients for the adsorptions of AR9, AR13, and AB92 onto CAmGs.
| Dye | Adsorbent | Q0/mg·g−1 | b/mg−1·L | RL | R2 |
|---|
| AR9 | CAmG 1 | 419 | 0.00604 | 0.0523 | 0.997 |
| CAmG 2 | 644 | 0.00474 | 0.0658 | 0.996 |
| CAmG 3 | 866 | 0.01051 | 0.0307 | 0.976 |
| AR13 | CAmG 1 | 410 | 0.00450 | 0.0690 | 0.996 |
| CAmG 2 | 651 | 0.00383 | 0.0801 | 0.996 |
| CAmG 3 | 911 | 0.00710 | 0.0448 | 0.994 |
| AB92 | CAmG 1 | 371 | 0.00389 | 0.0789 | 0.997 |
| CAmG 2 | 561 | 0.00424 | 0.0729 | 0.996 |
| CAmG 3 | 816 | 0.01831 | 0.0179 | 0.994 |
Table 6.
Freundlich isotherm coefficients for the adsorptions of AR9, AR13, and AB92 onto CAmGs.
Table 6.
Freundlich isotherm coefficients for the adsorptions of AR9, AR13, and AB92 onto CAmGs.
| Dye | Adsorbent | KF/mg·L−1 | n−1 | R2 |
|---|
| AR9 | CAmG 1 | 32.1 | 0.365 | 0.931 |
| CAmG 2 | 60.8 | 0.328 | 0.956 |
| CAmG 3 | 111.4 | 0.307 | 0.866 |
| AR13 | CAmG 1 | 22.7 | 0.412 | 0.968 |
| CAmG 2 | 22.6 | 0.493 | 0.961 |
| CAmG 3 | 37.2 | 0.504 | 0.934 |
| AB92 | CAmG 1 | 20.2 | 0.395 | 0.977 |
| CAmG 2 | 18.4 | 0.510 | 0.986 |
| CAmG 3 | 67.5 | 0.398 | 0.844 |
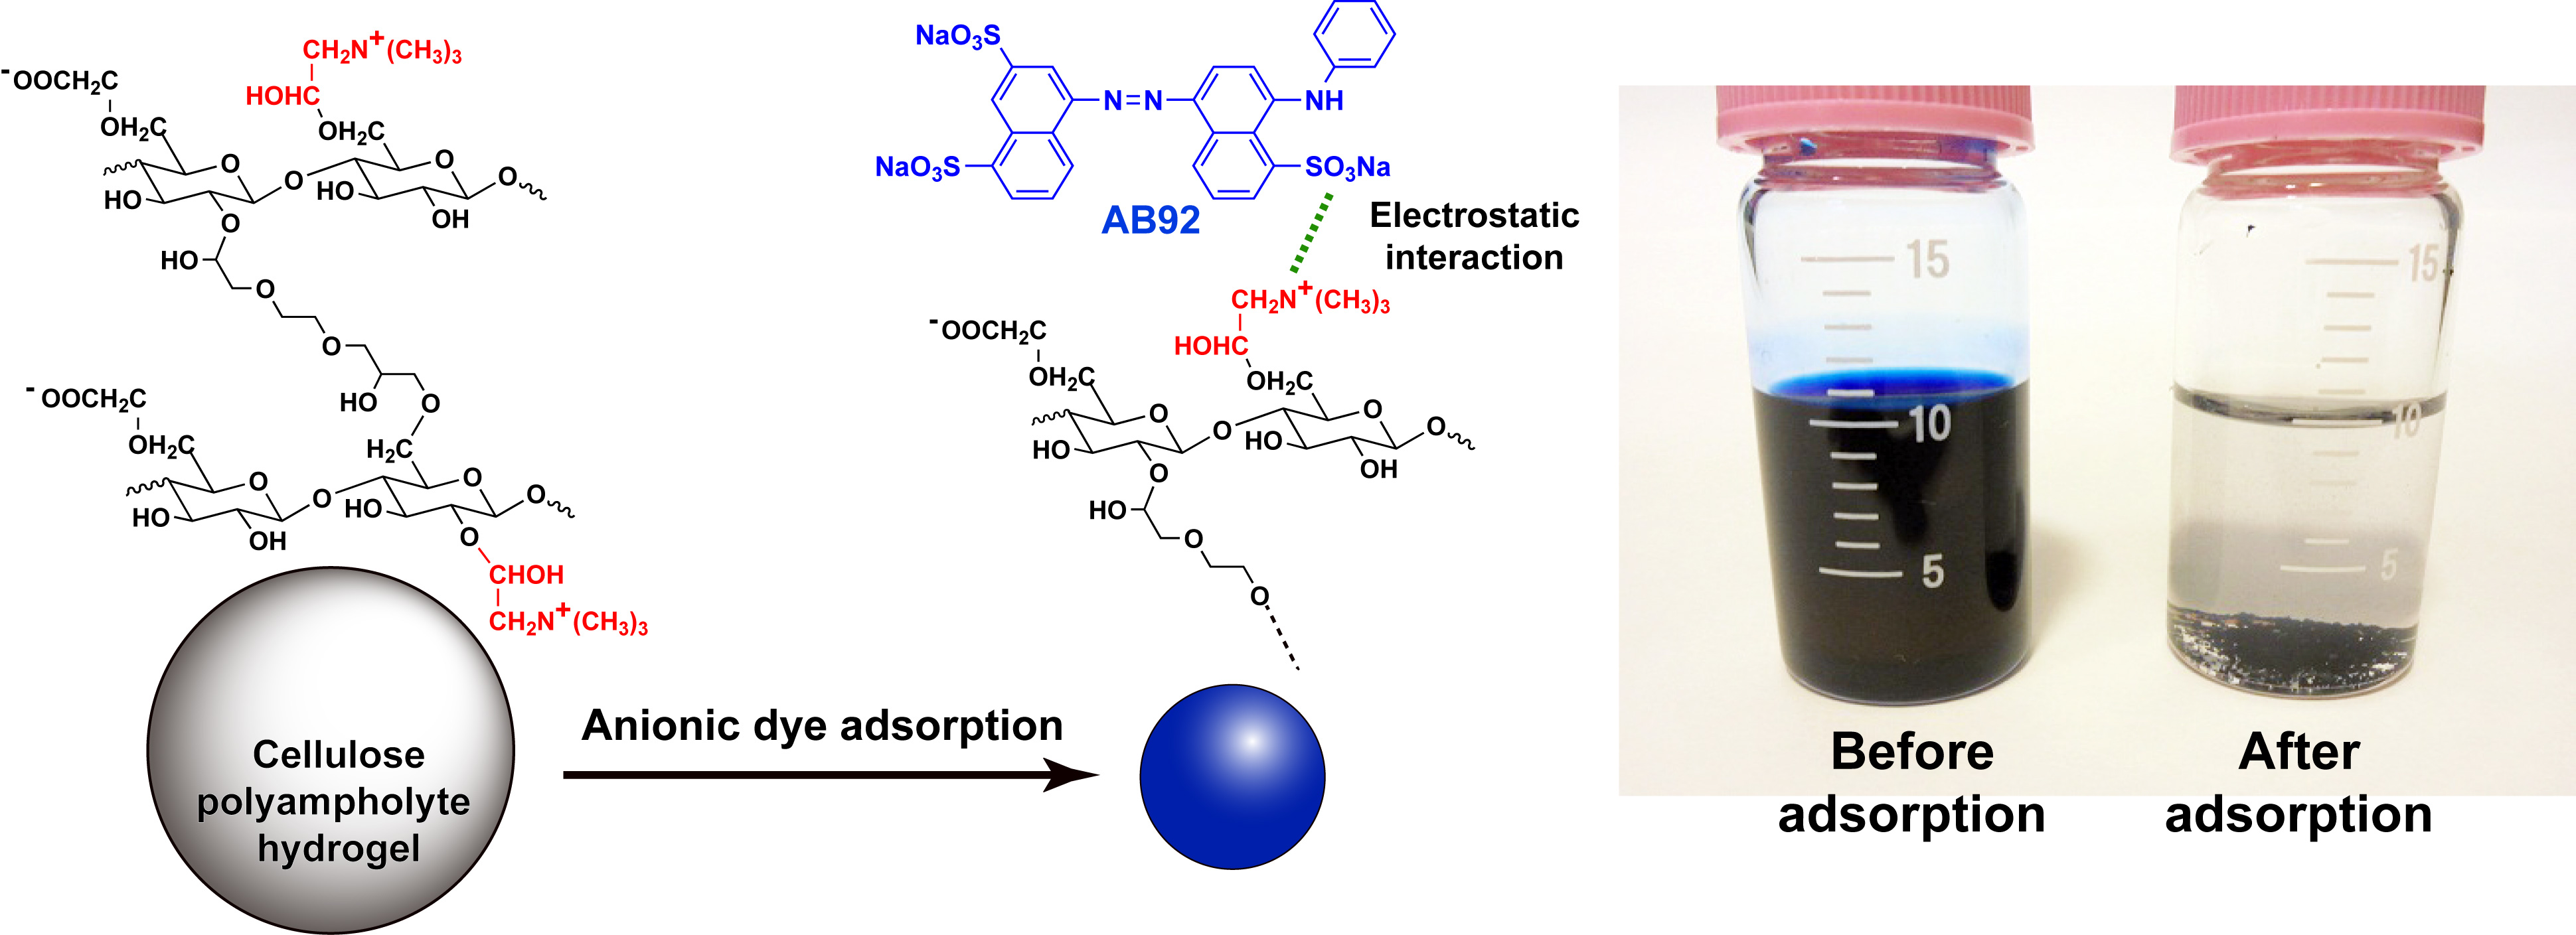
2.4.5. Adsorption Mechanism
As discussed in the preceding section, the adsorption of anionic dyes onto CAmGs
1‒
3 follows the Langmuir adsorption isotherm model. This adsorption model is constructed based on the following assumptions [
39]:
The entire surface of the adsorbent is uniform, and all the adsorption sites are equivalent.
There is no interaction between the adsorbed molecules.
All adsorbate molecules absorb onto the adsorbent by the same mechanism.
The adsorbate molecules adsorb only onto the surface of the adsorbent, not onto previously adsorbed molecules.
Therefore, the adsorption of dye molecules onto the CAmGs is a homogeneous mechanism based on the charge neutralization between the dye molecules and the cationic surface of the CAmGs. This suggests that the hydrophobic interaction between the dye molecules, for example, π–π stacking interactions between aromatic rings of the anionic dyes [
40], is so small as to be negligible compared with the electrostatic interaction between the anionic dyes and the cationic groups of the CAmGs. If such an interaction played an important role in the adsorption of anionic dye, apart from the electrostatic interaction, the adsorption isotherm would fit or be close to the Freundlich adsorption isotherm model, because the Freundlich isotherm is generally used to describe heterogeneous adsorption systems.
Except for the adsorption phenomenon of anionic dyes at cationic sites of the CAmGs, the adsorption mechanisms resulting from these systems are rather complex: the adsorption mechanisms are related to the swelling of CAmGs, the diffusion of dyes from the dye medium toward the hydrogel mass. Lamberti
et al. and Cacavavo
et al. reported that the swelling/diffusion process can be mathematically described using a physical model proposed by their groups [
41,
42,
43]. Therefore, theoretical approaches for the phenomena including gel swelling as well as dye diffusion are required to precisely reveal the adsorption mechanism.


