
Light-Induced Changes in Secondary Metabolite Production of Trichoderma atroviride

 , , ,
, , ,  ,
,  and
and 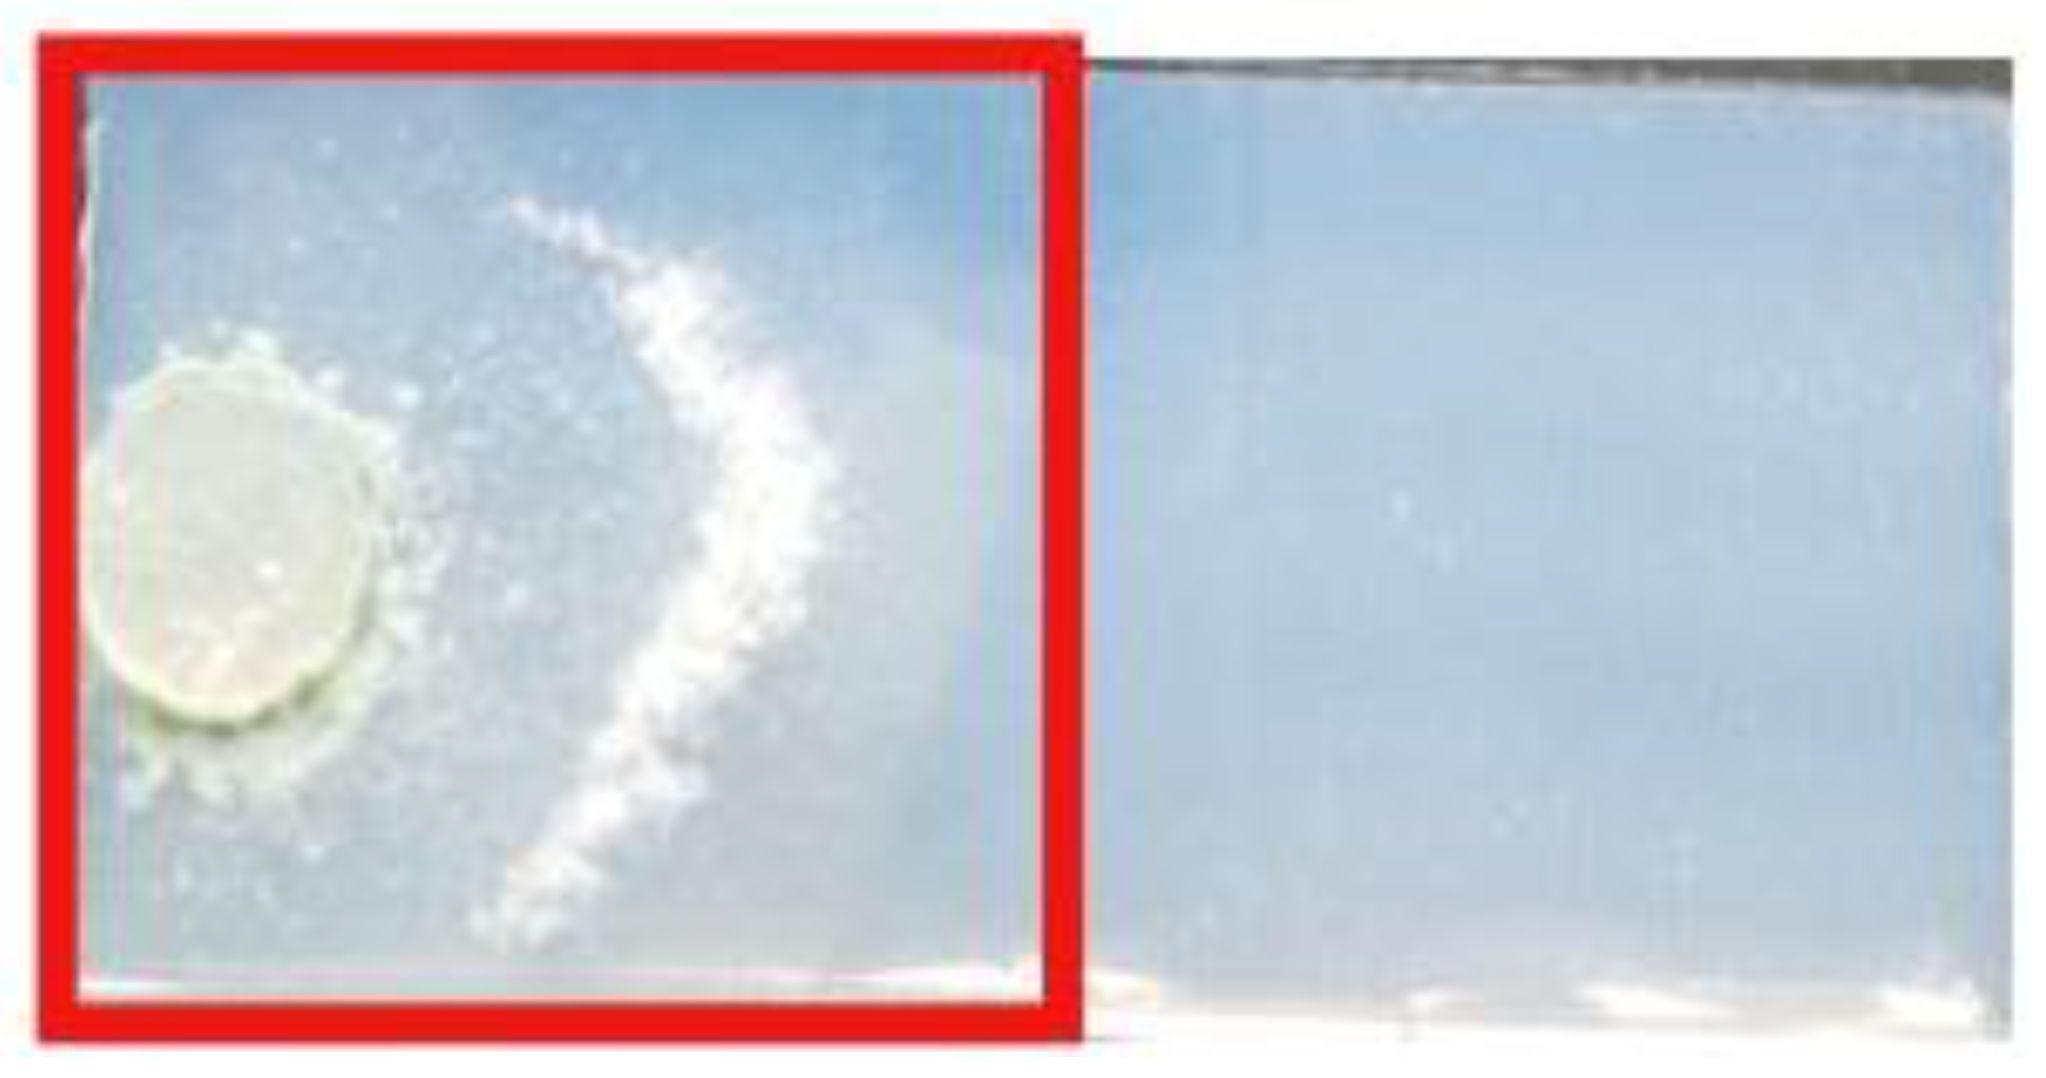
Abstract
1. Introduction
2. Materials and Methods
2.1. Cultivation and Growth Conditions
2.1.1. Cultivation on Solid Minimal Medium
2.1.2. Cultivation in a Miniaturized Growth Assay
2.2. Sample Preparation
2.2.1. Comparison of the Three Light Conditions
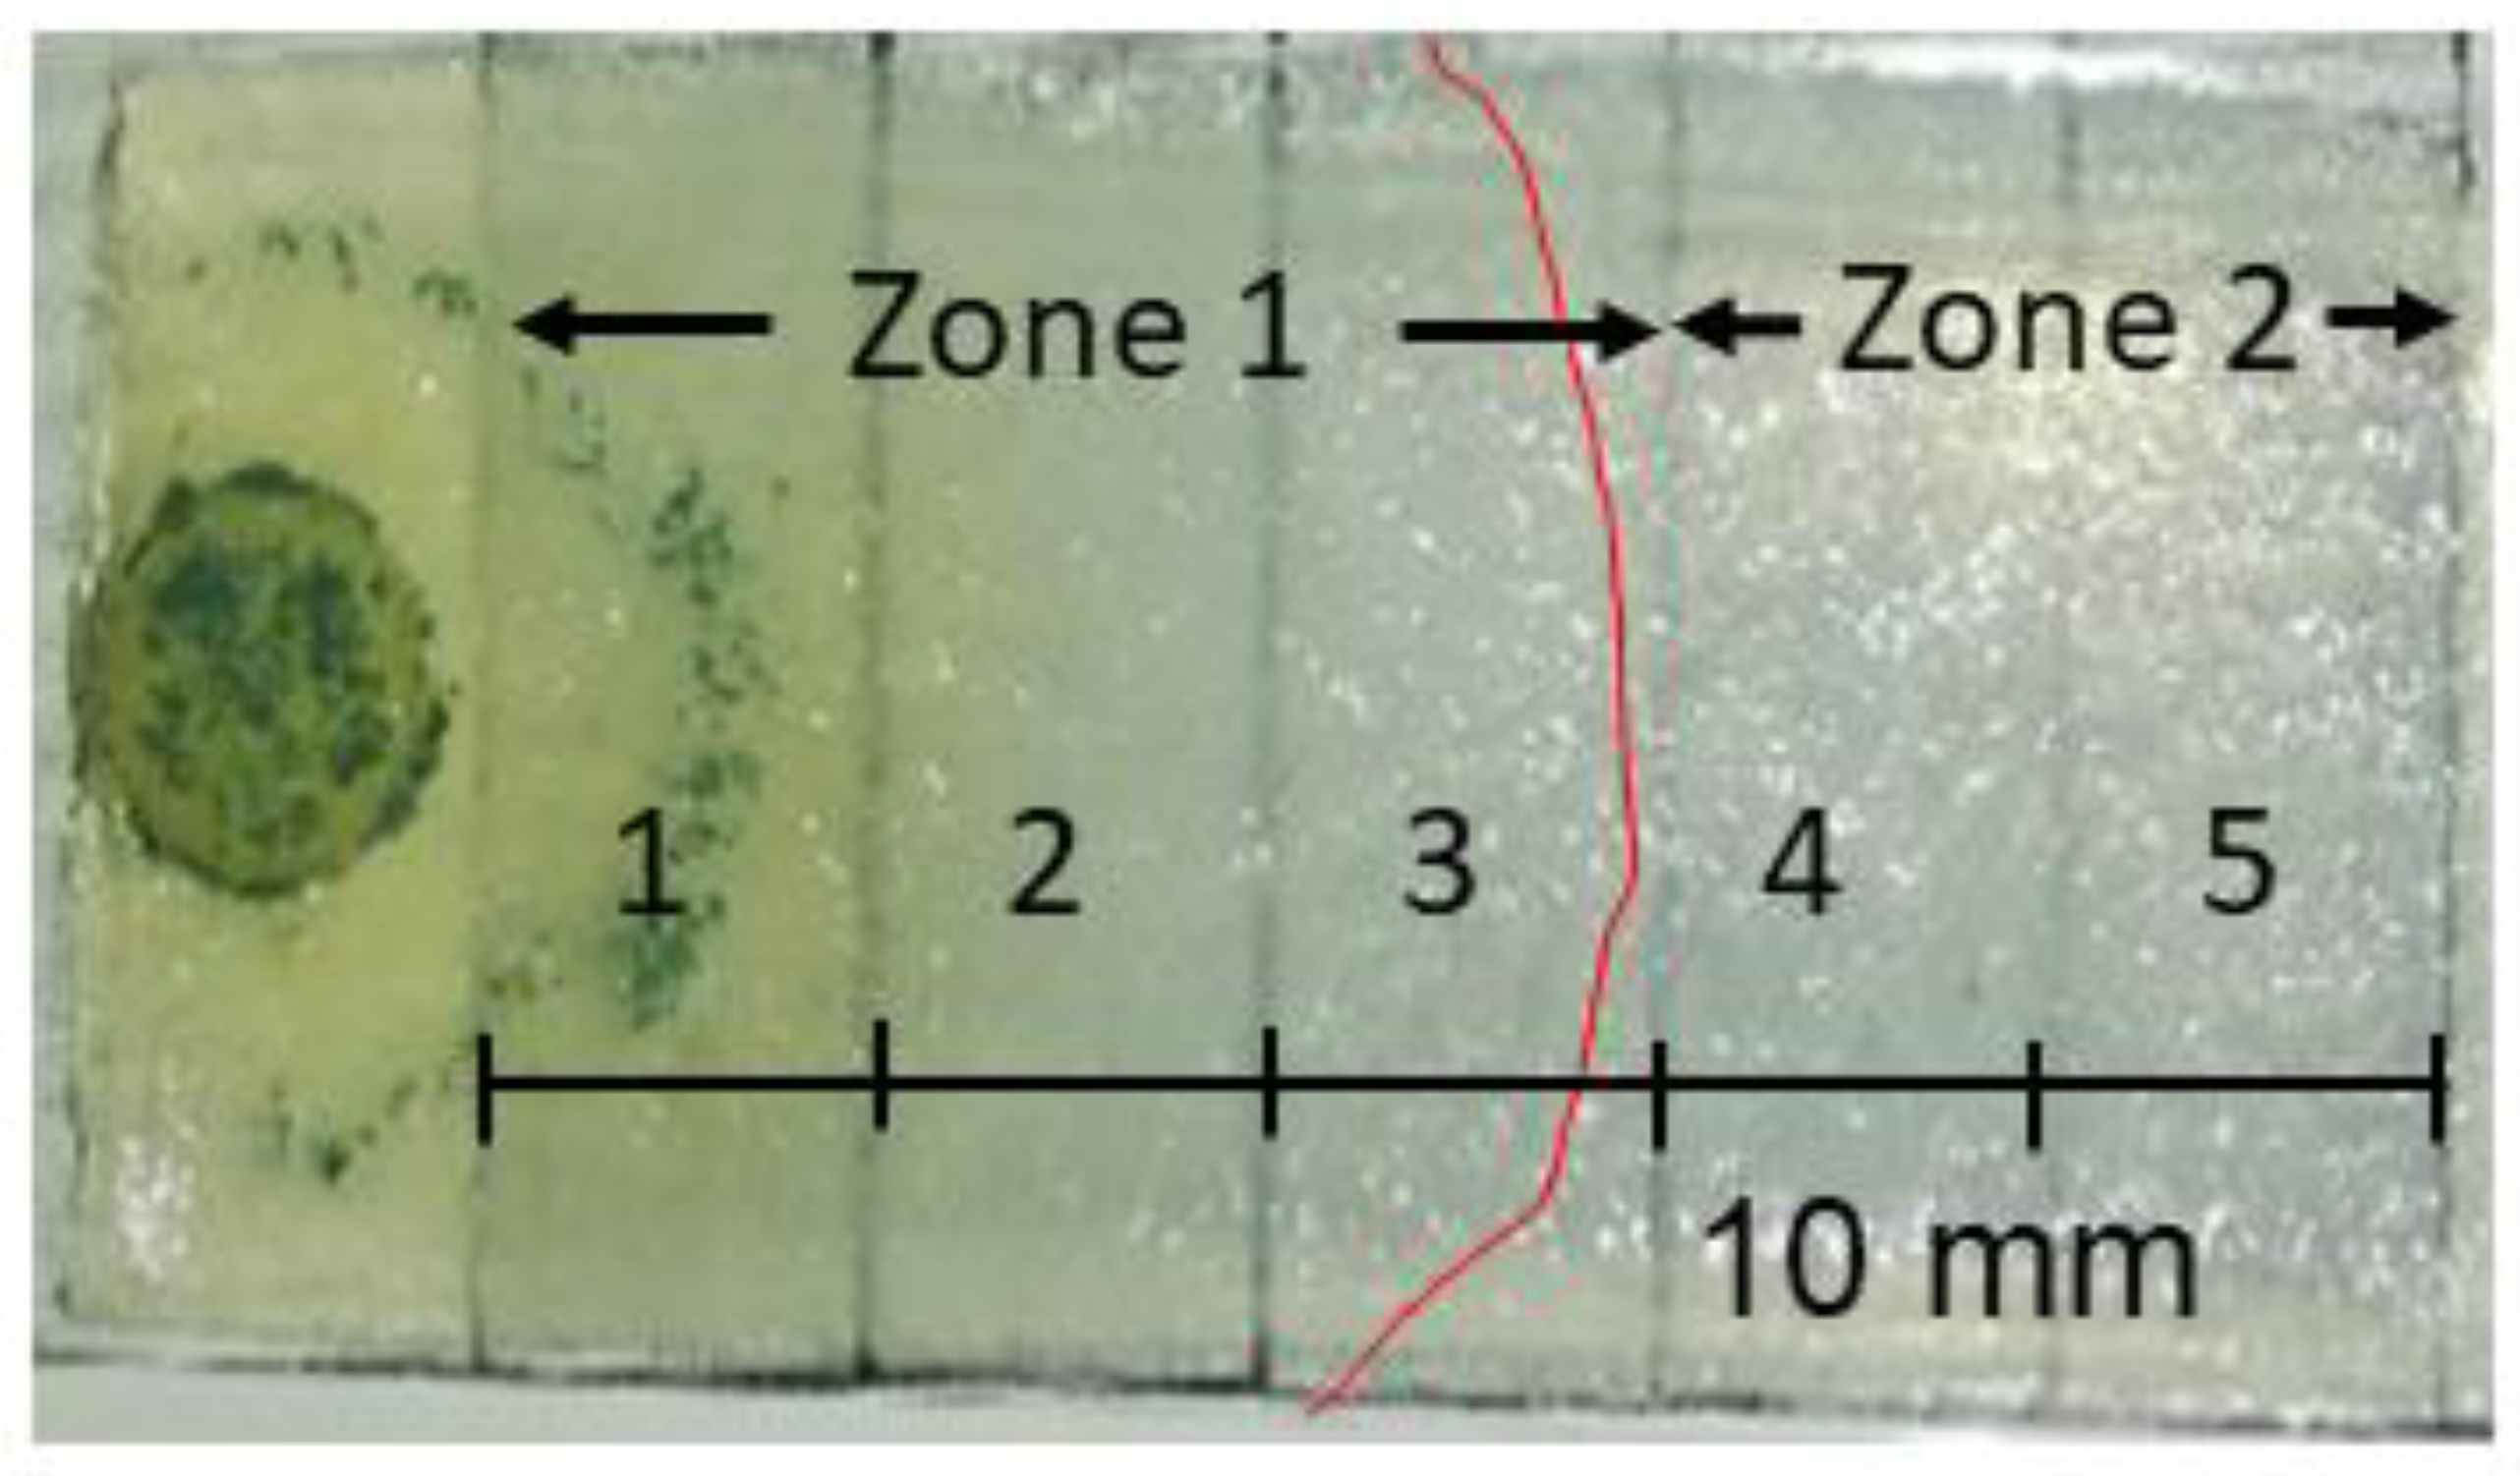
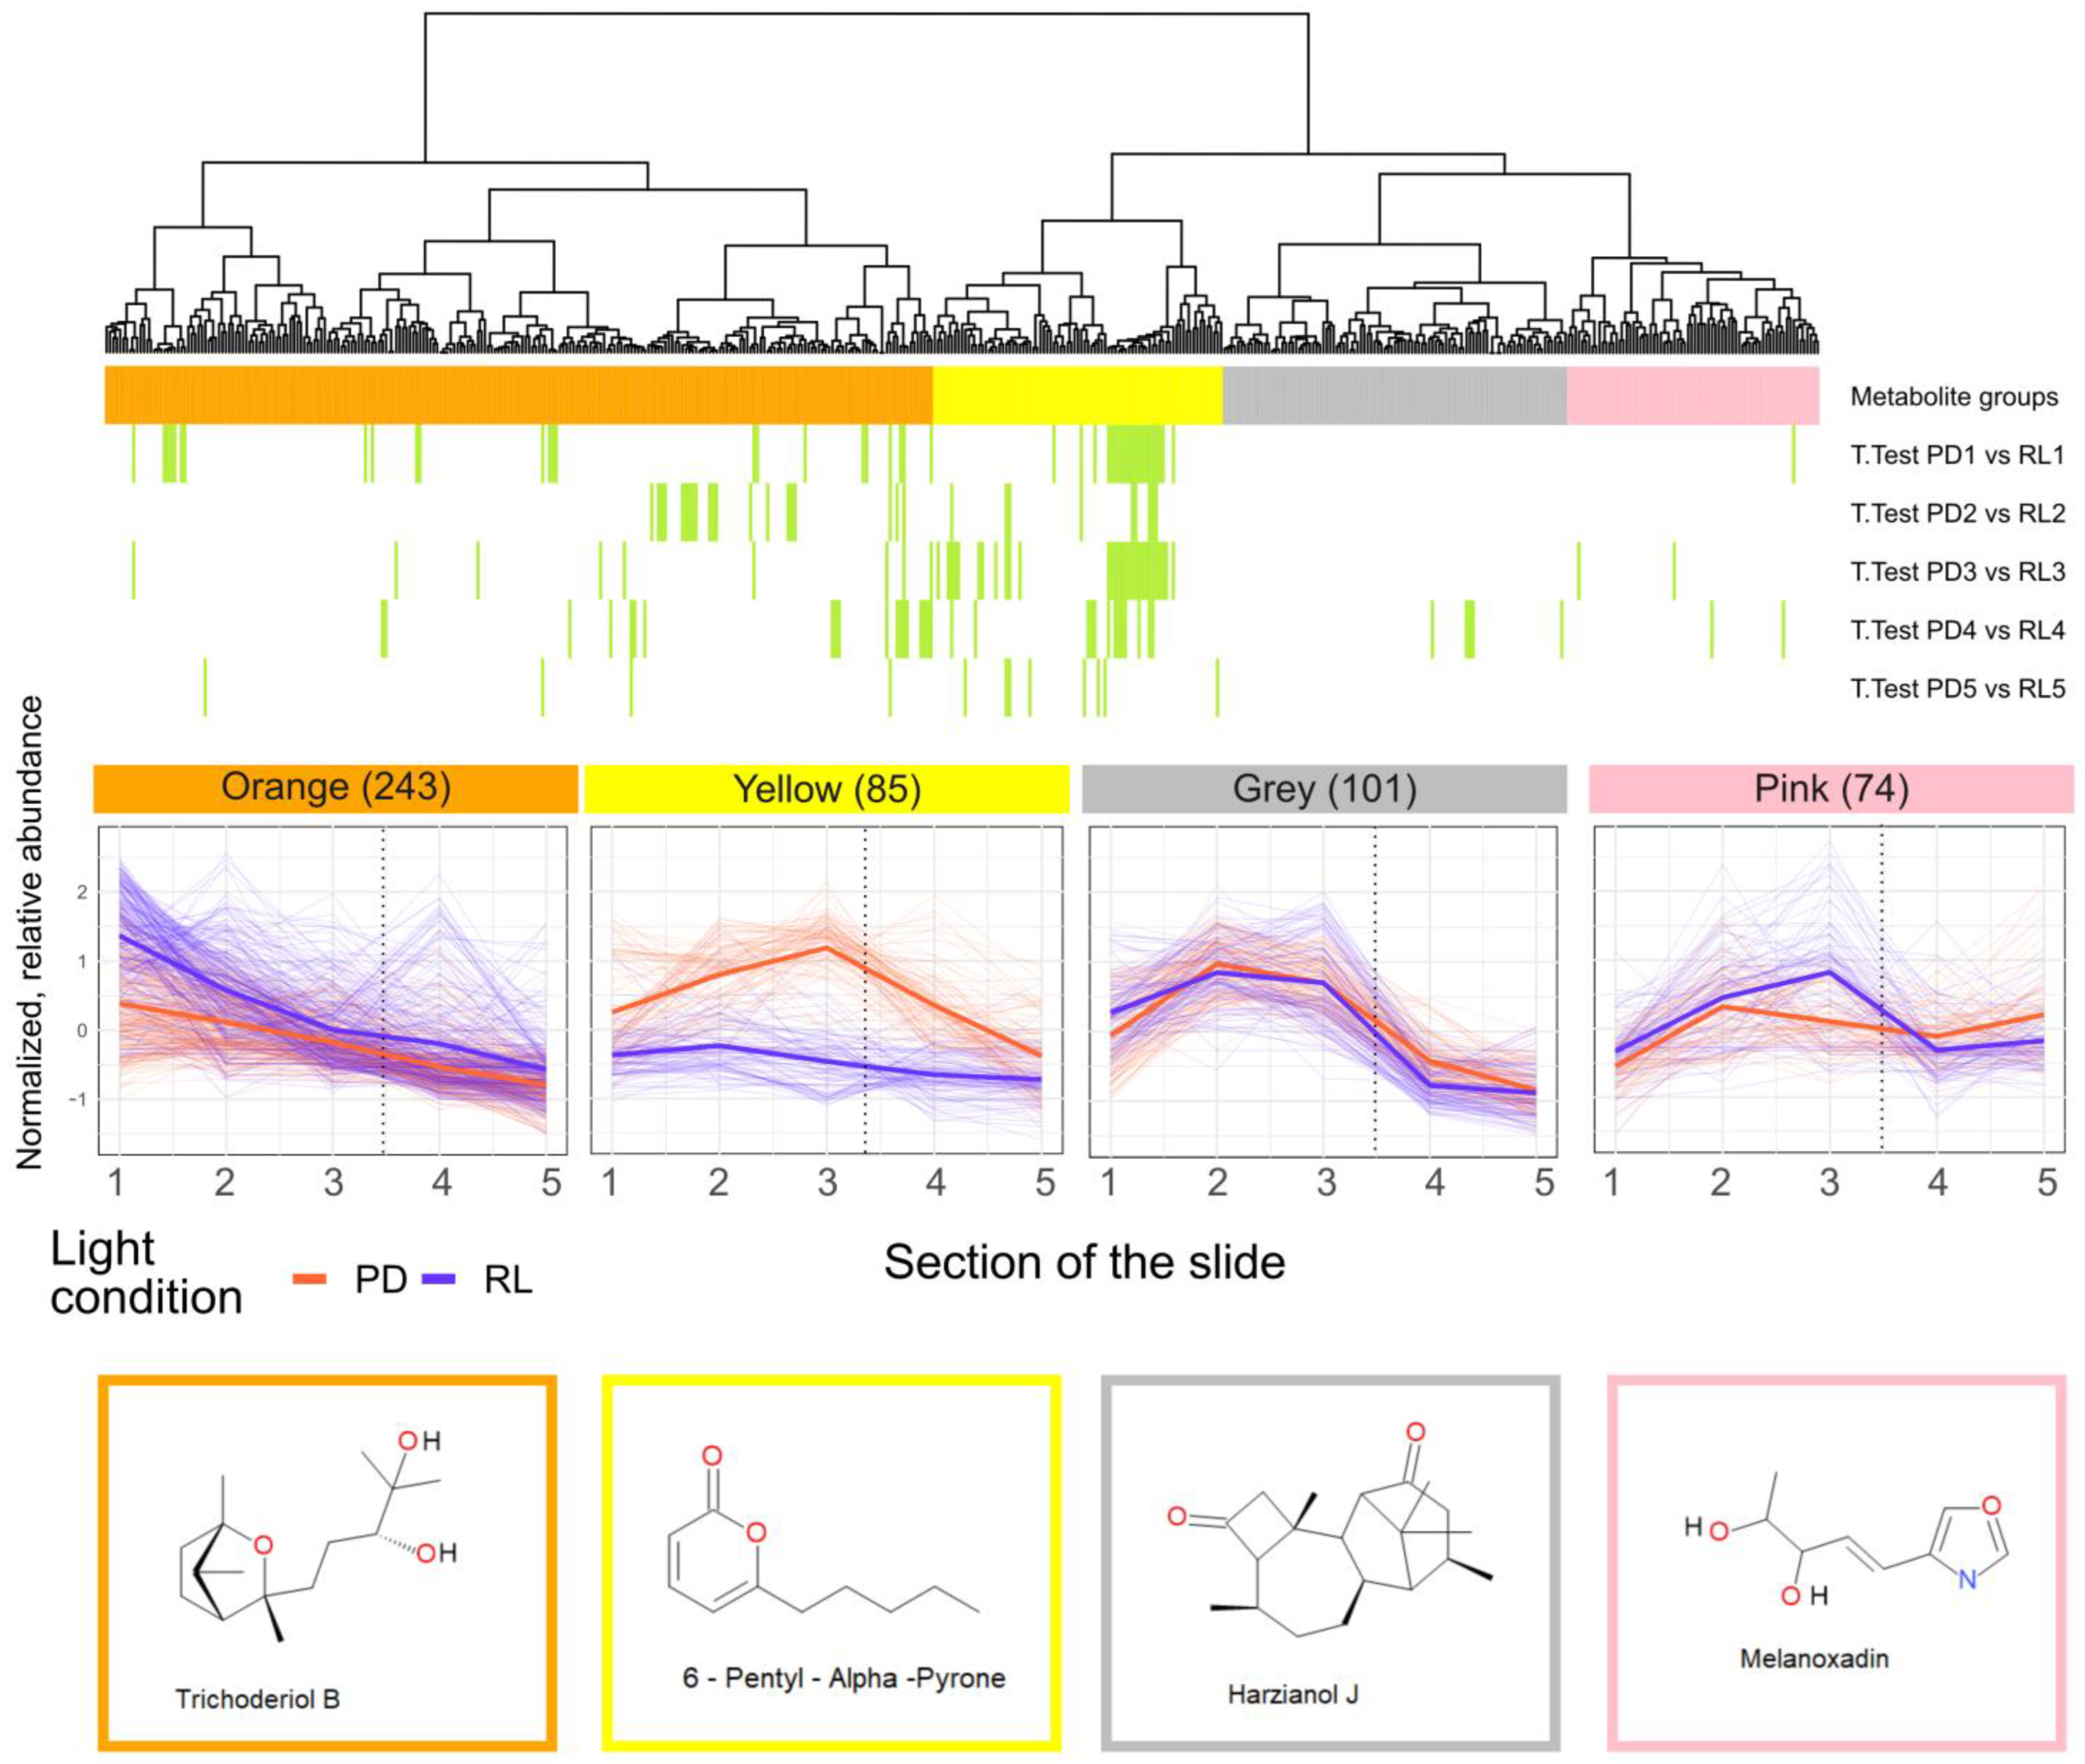
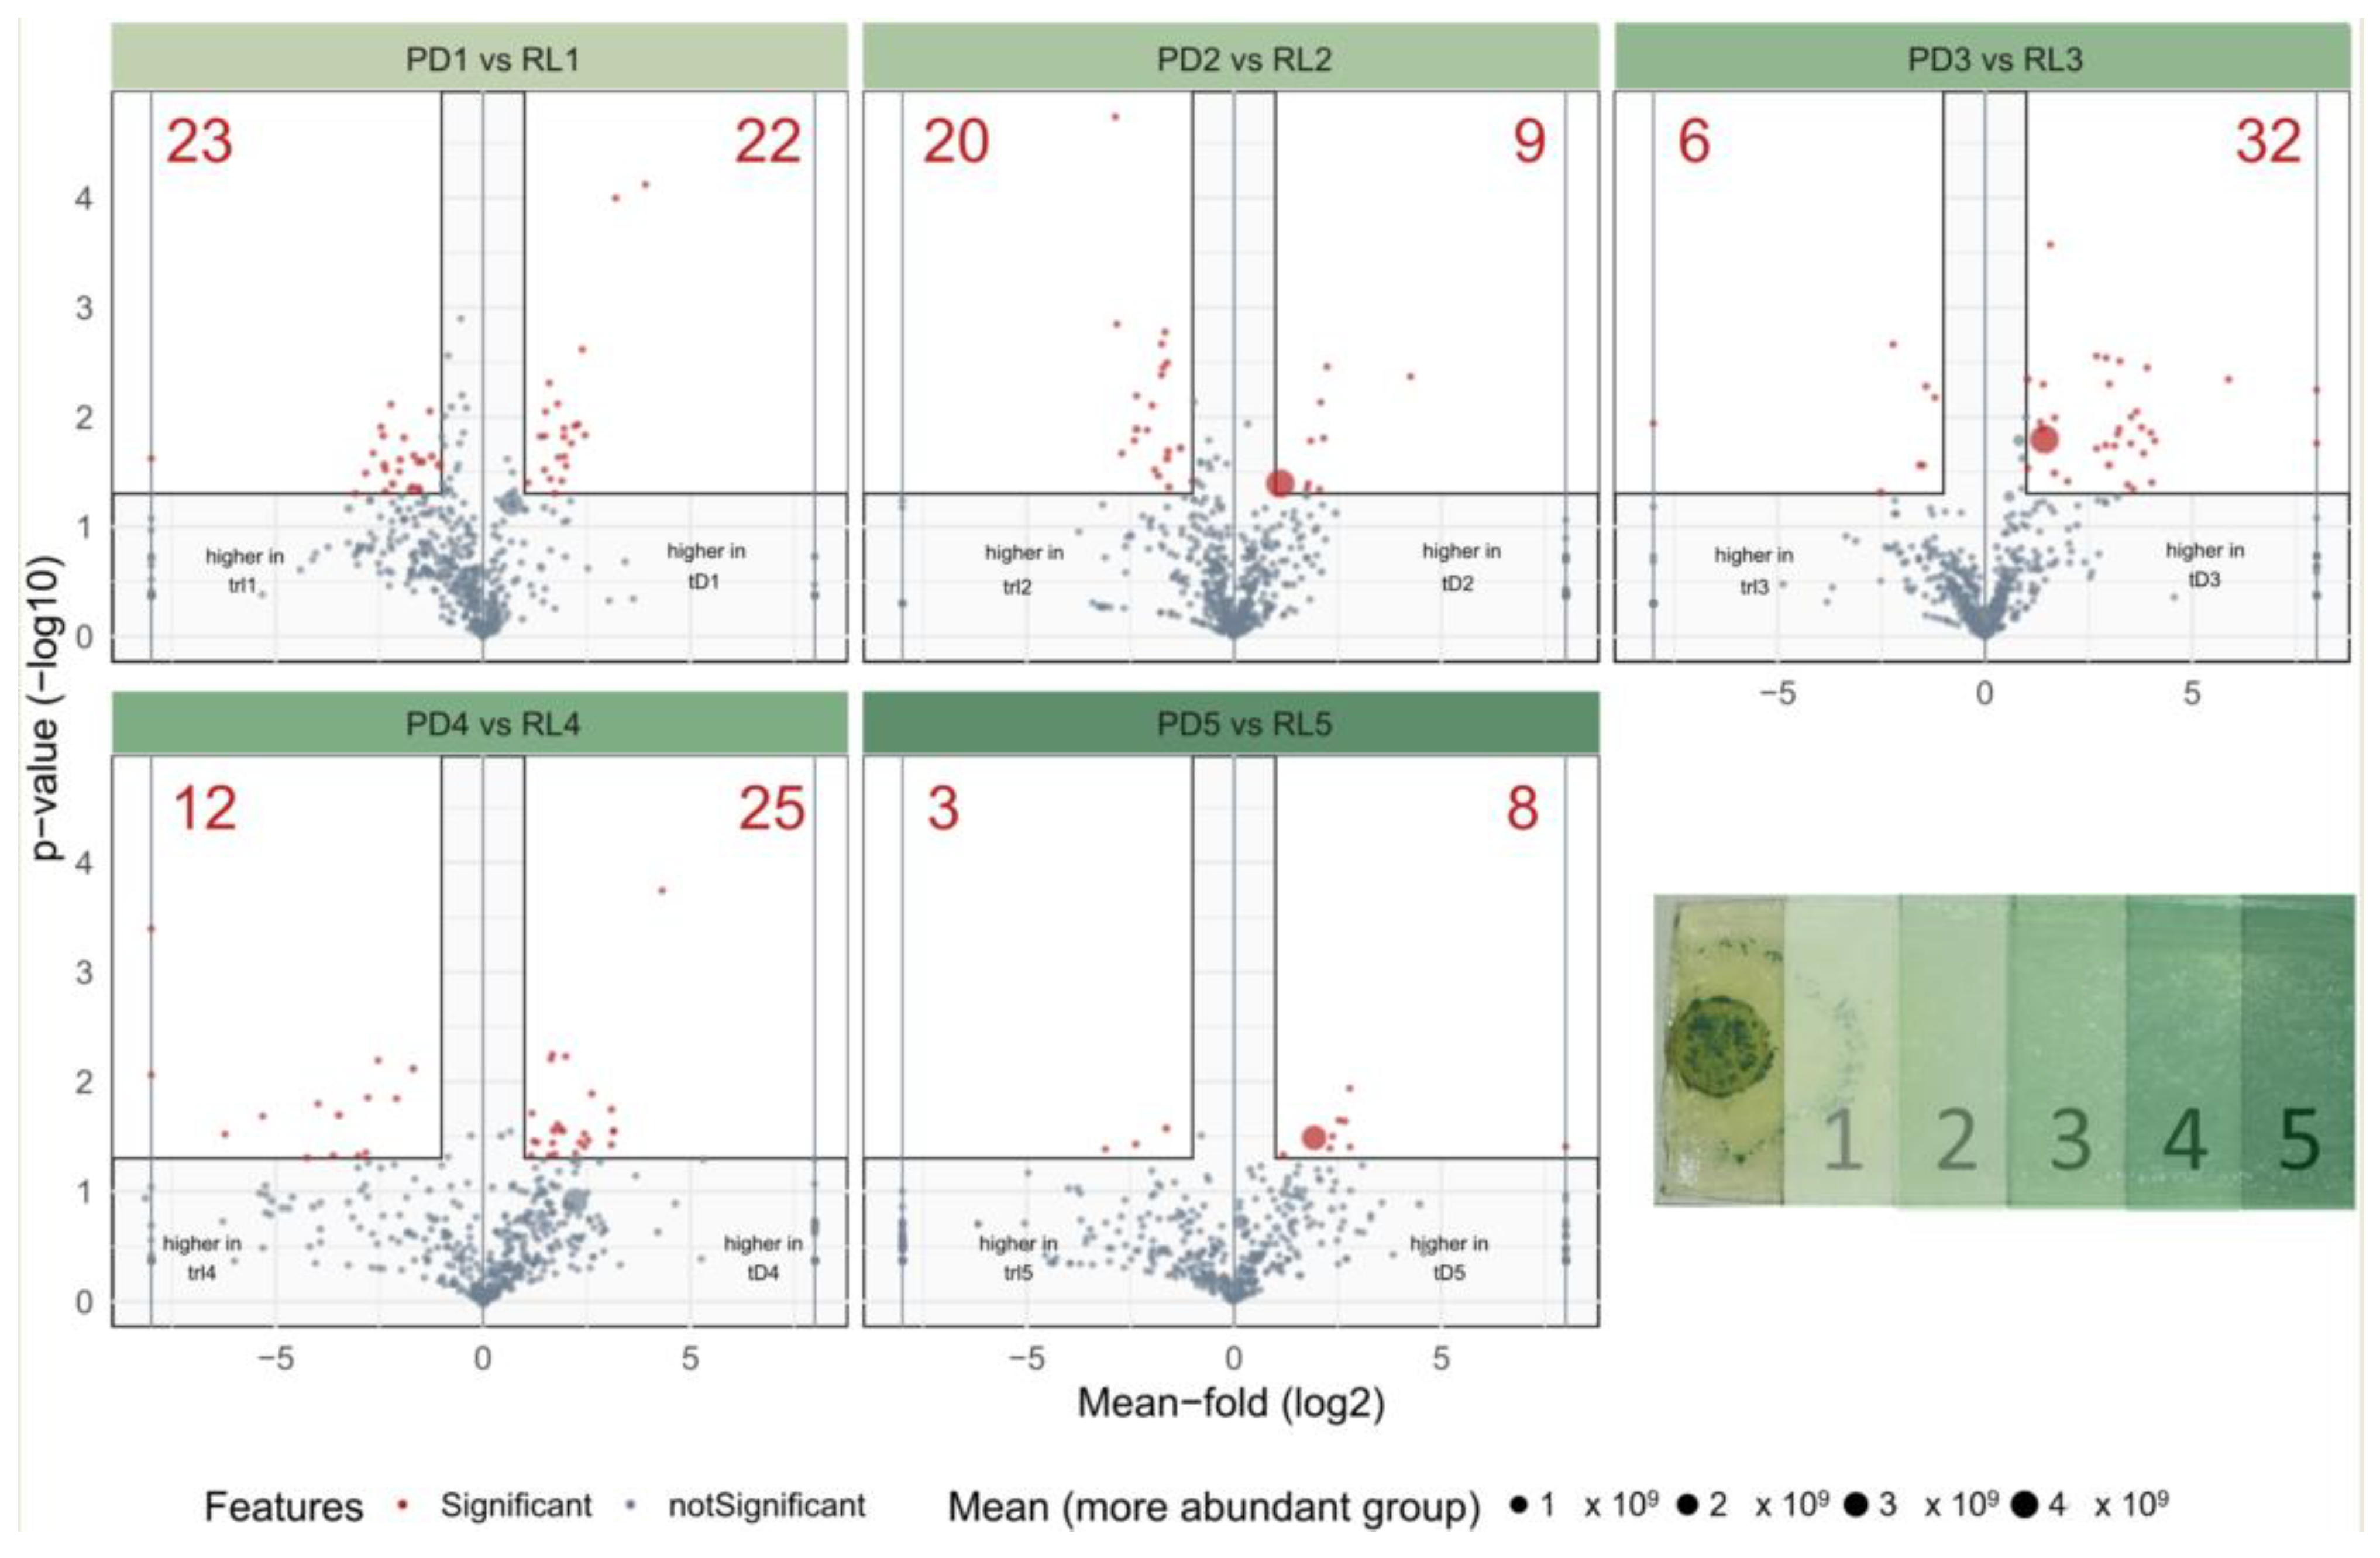
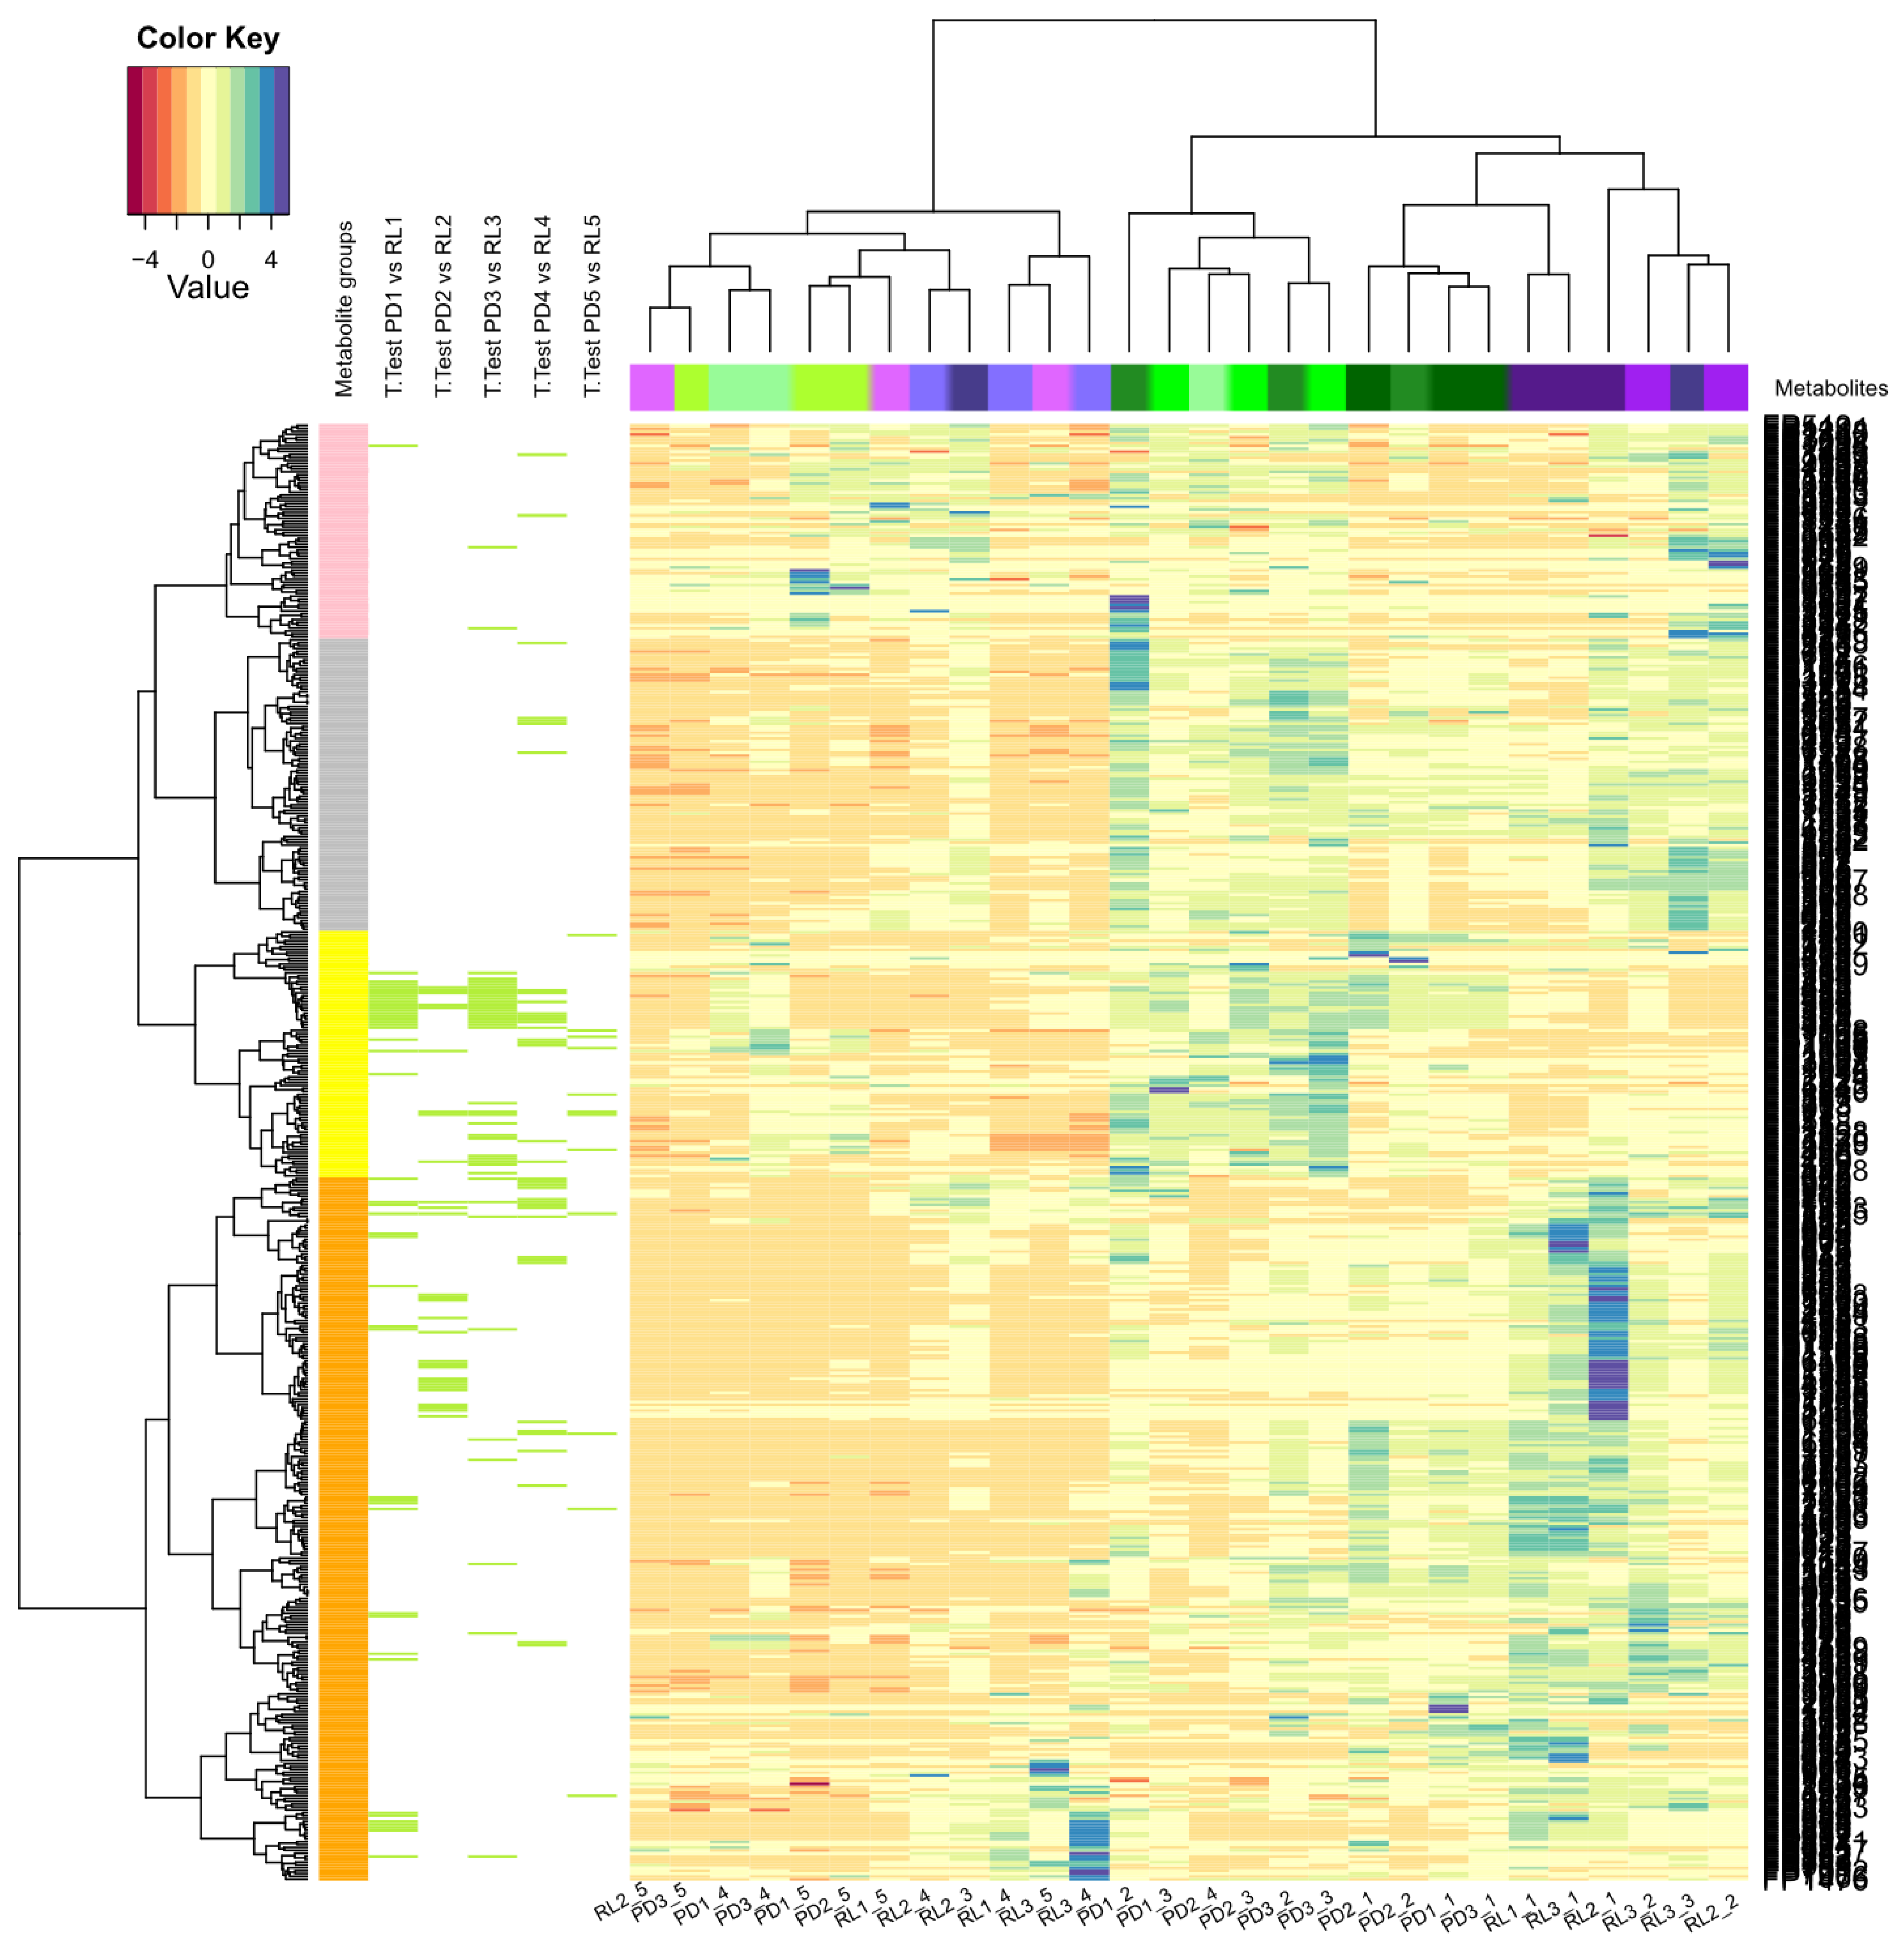
2.2.2. Analysis of Spatial Metabolite Distribution
2.2.3. Sample Extraction
2.2.4. Internal Standardization with the Pooled Labeled Extract
2.3. LC-HRMS/MS Measurements
2.3.1. Determination of Glucose Concentration
2.3.2. LC-HRMS Analysis
2.3.3. LC-HRMS/MS Measurements
2.4. Data Processing
2.4.1. Conversion of LC-HRMS File Format
2.4.2. MetExtract II Data Processing, Metabolite Annotation of, and Integration between the Two Experiments
2.4.3. HILIC Data Evaluations
2.4.4. Molecular Networking
2.5. Statistical Data Evaluation
3. Results
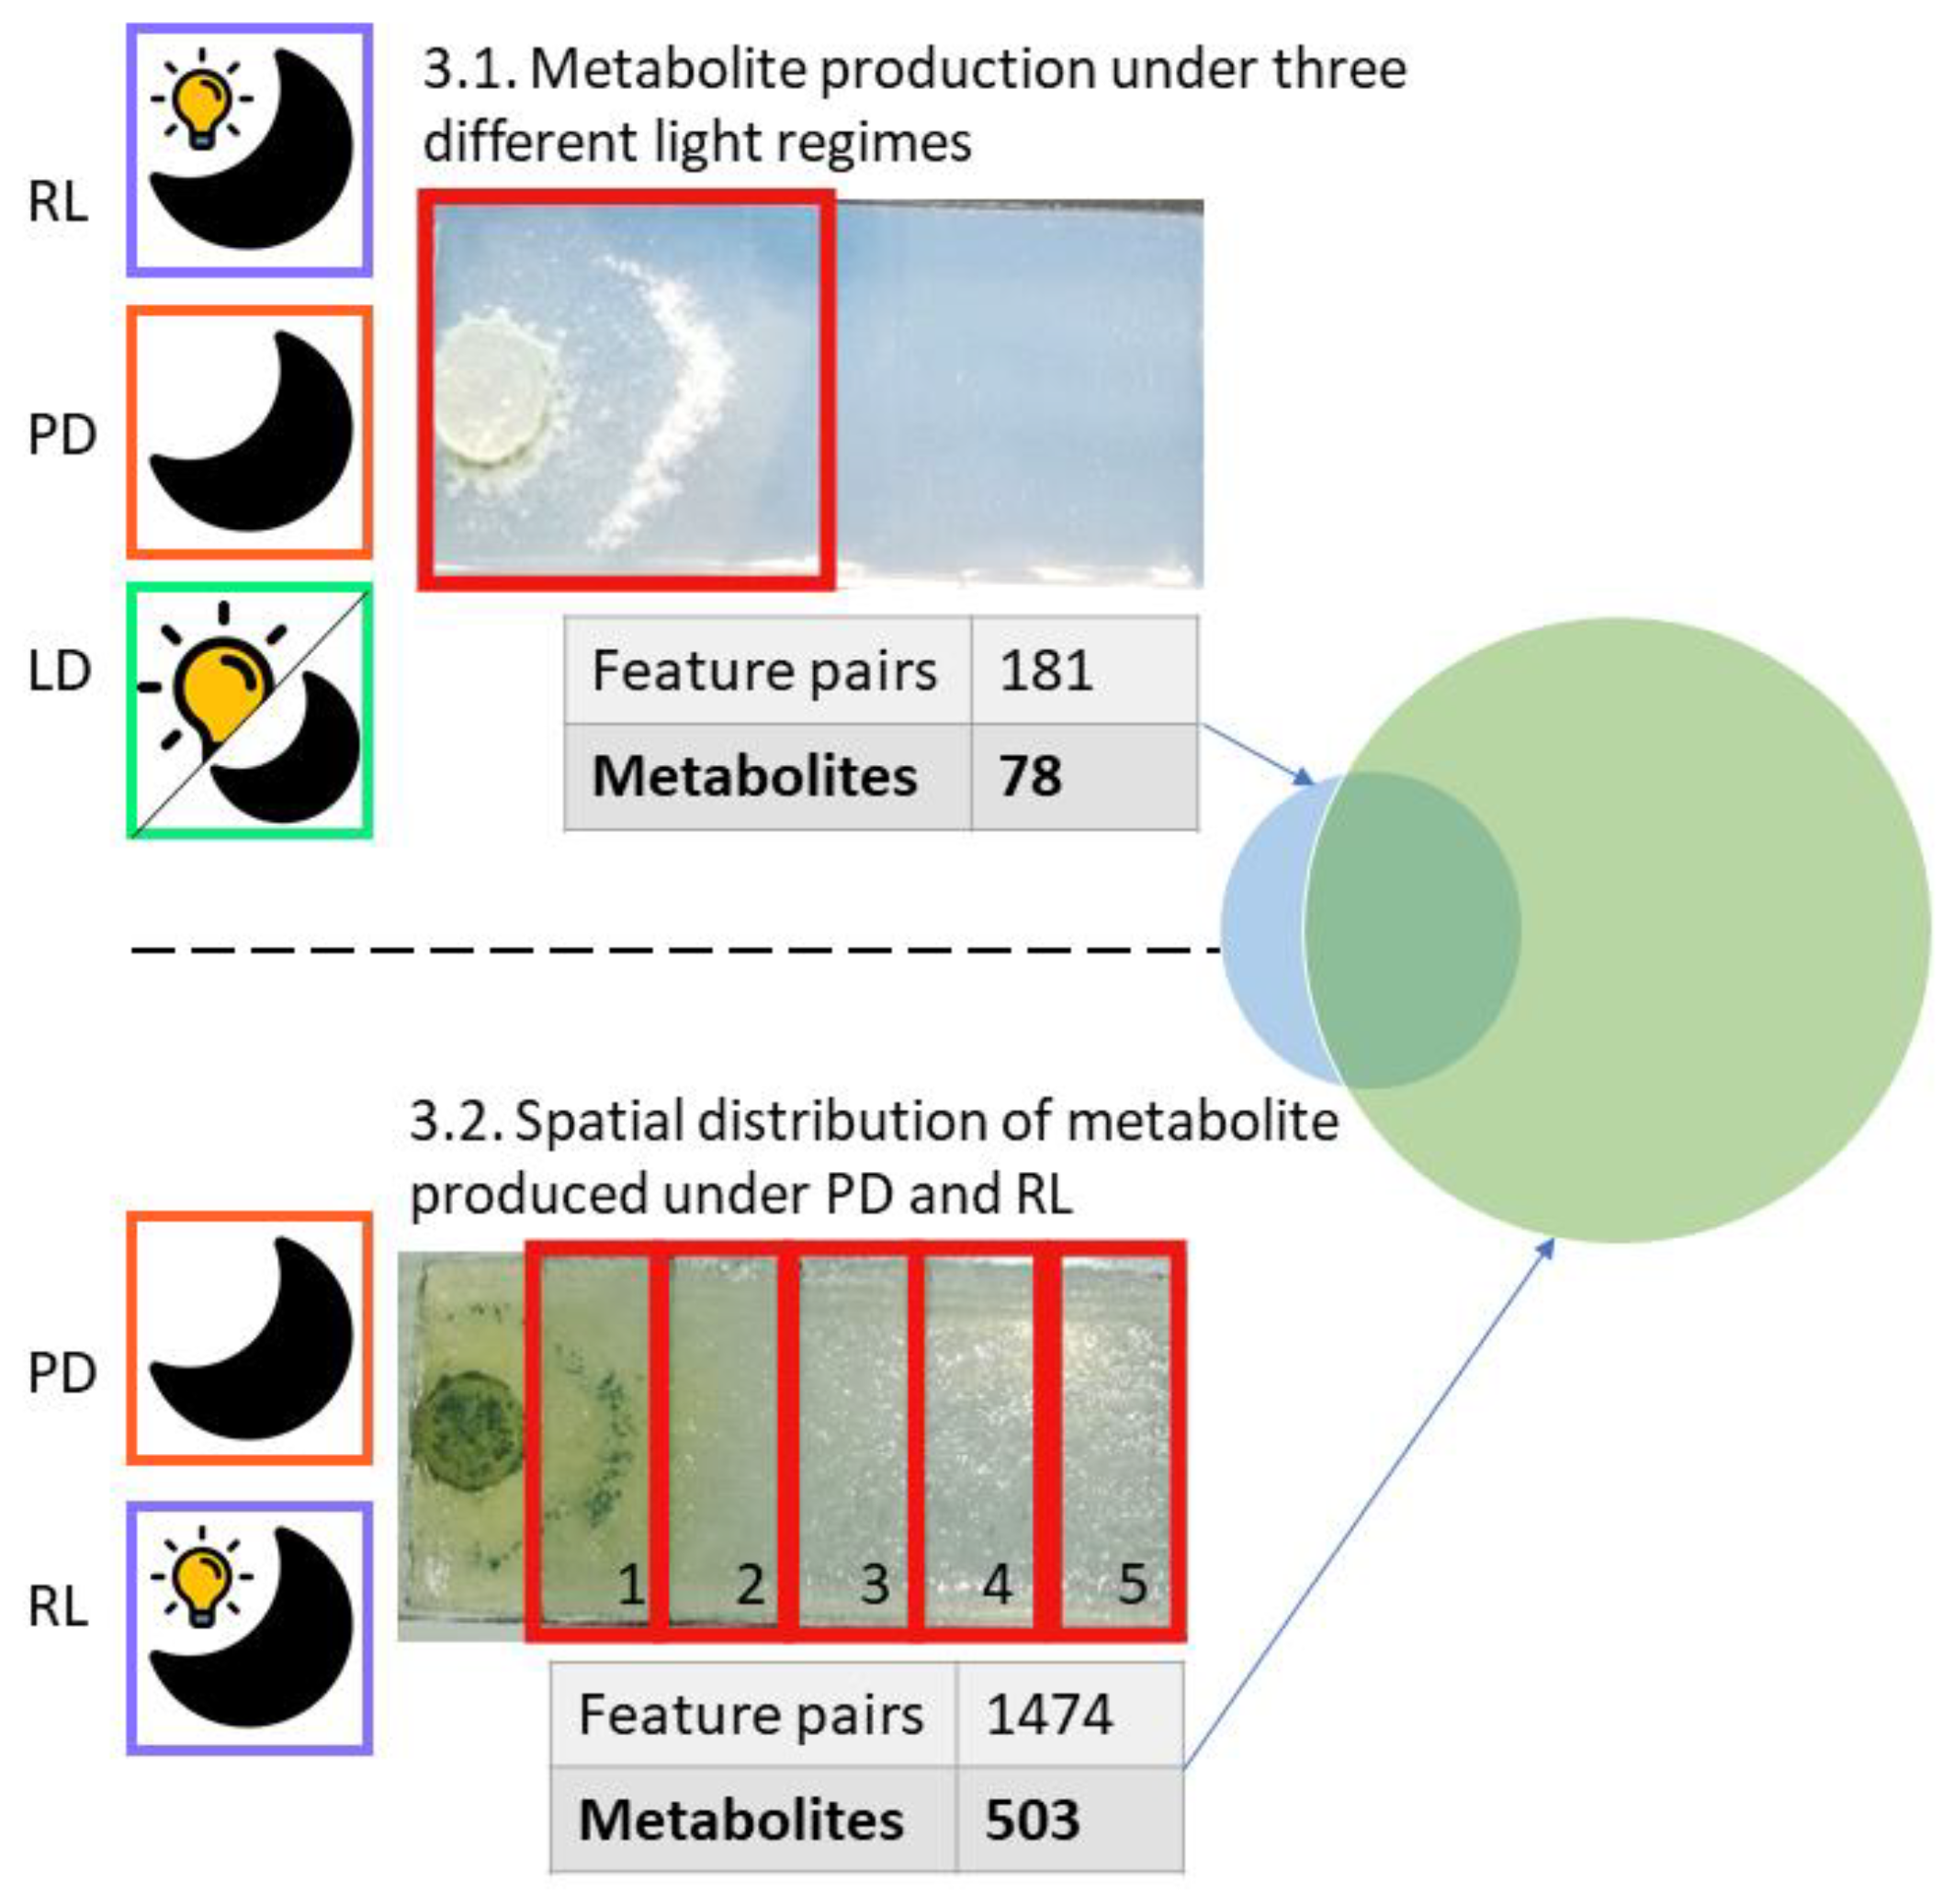
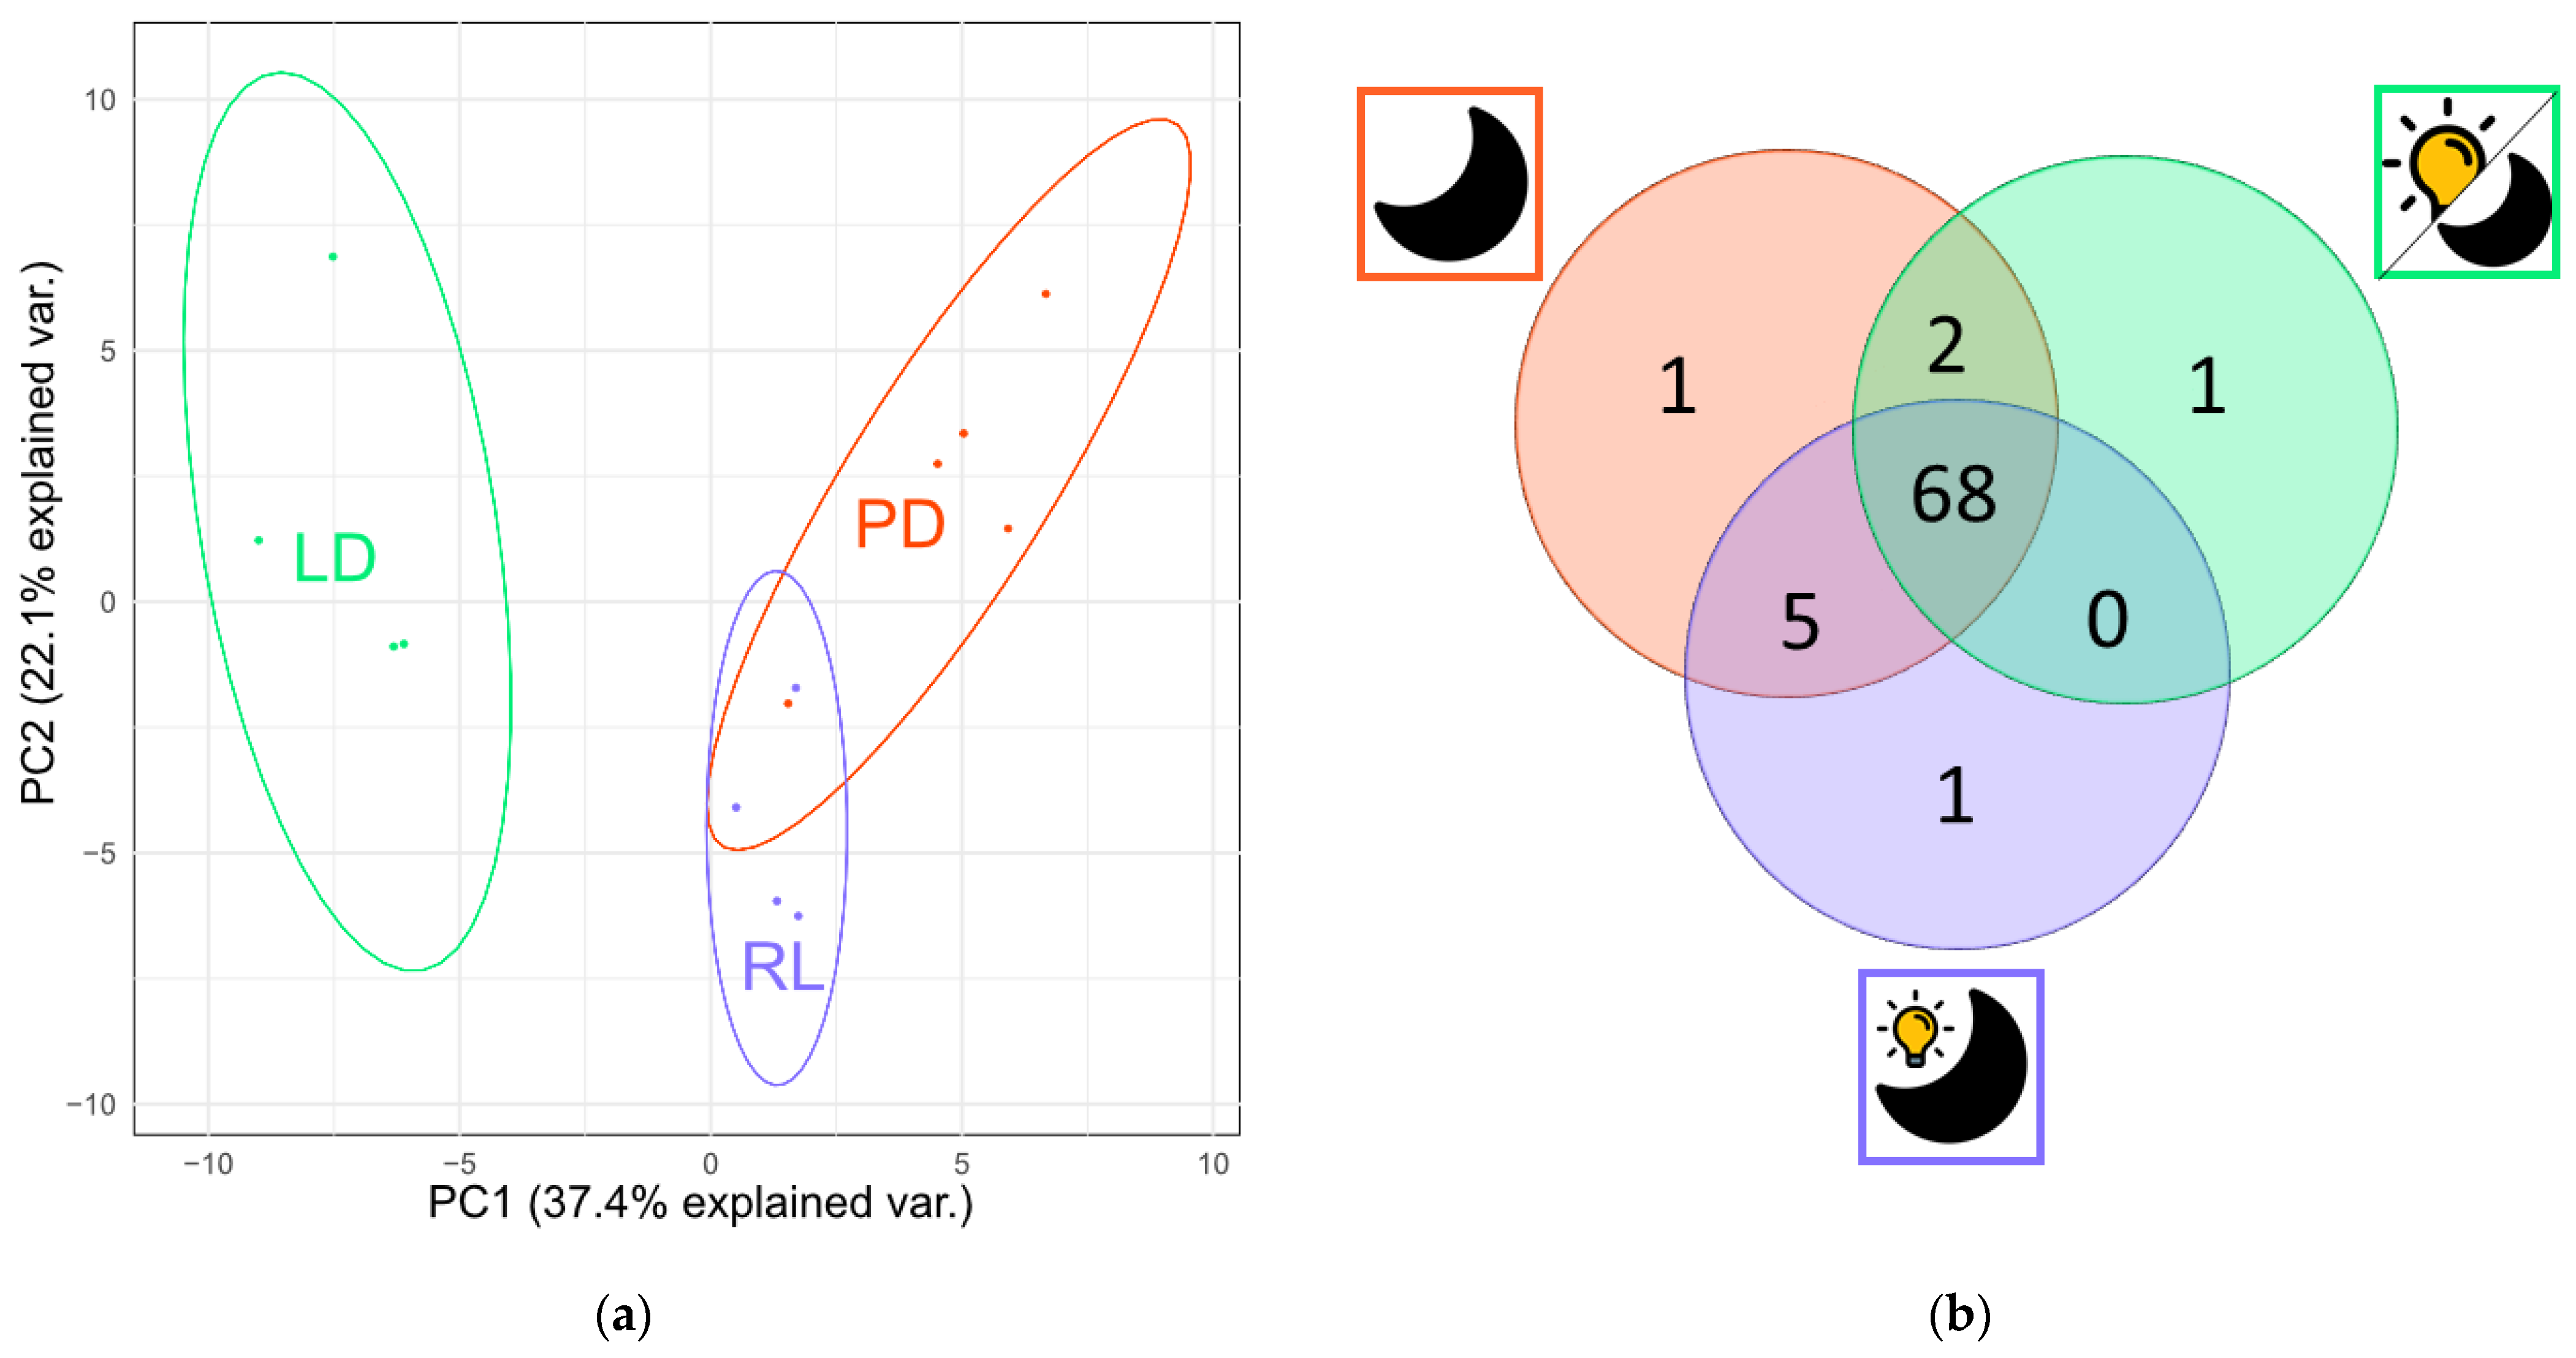
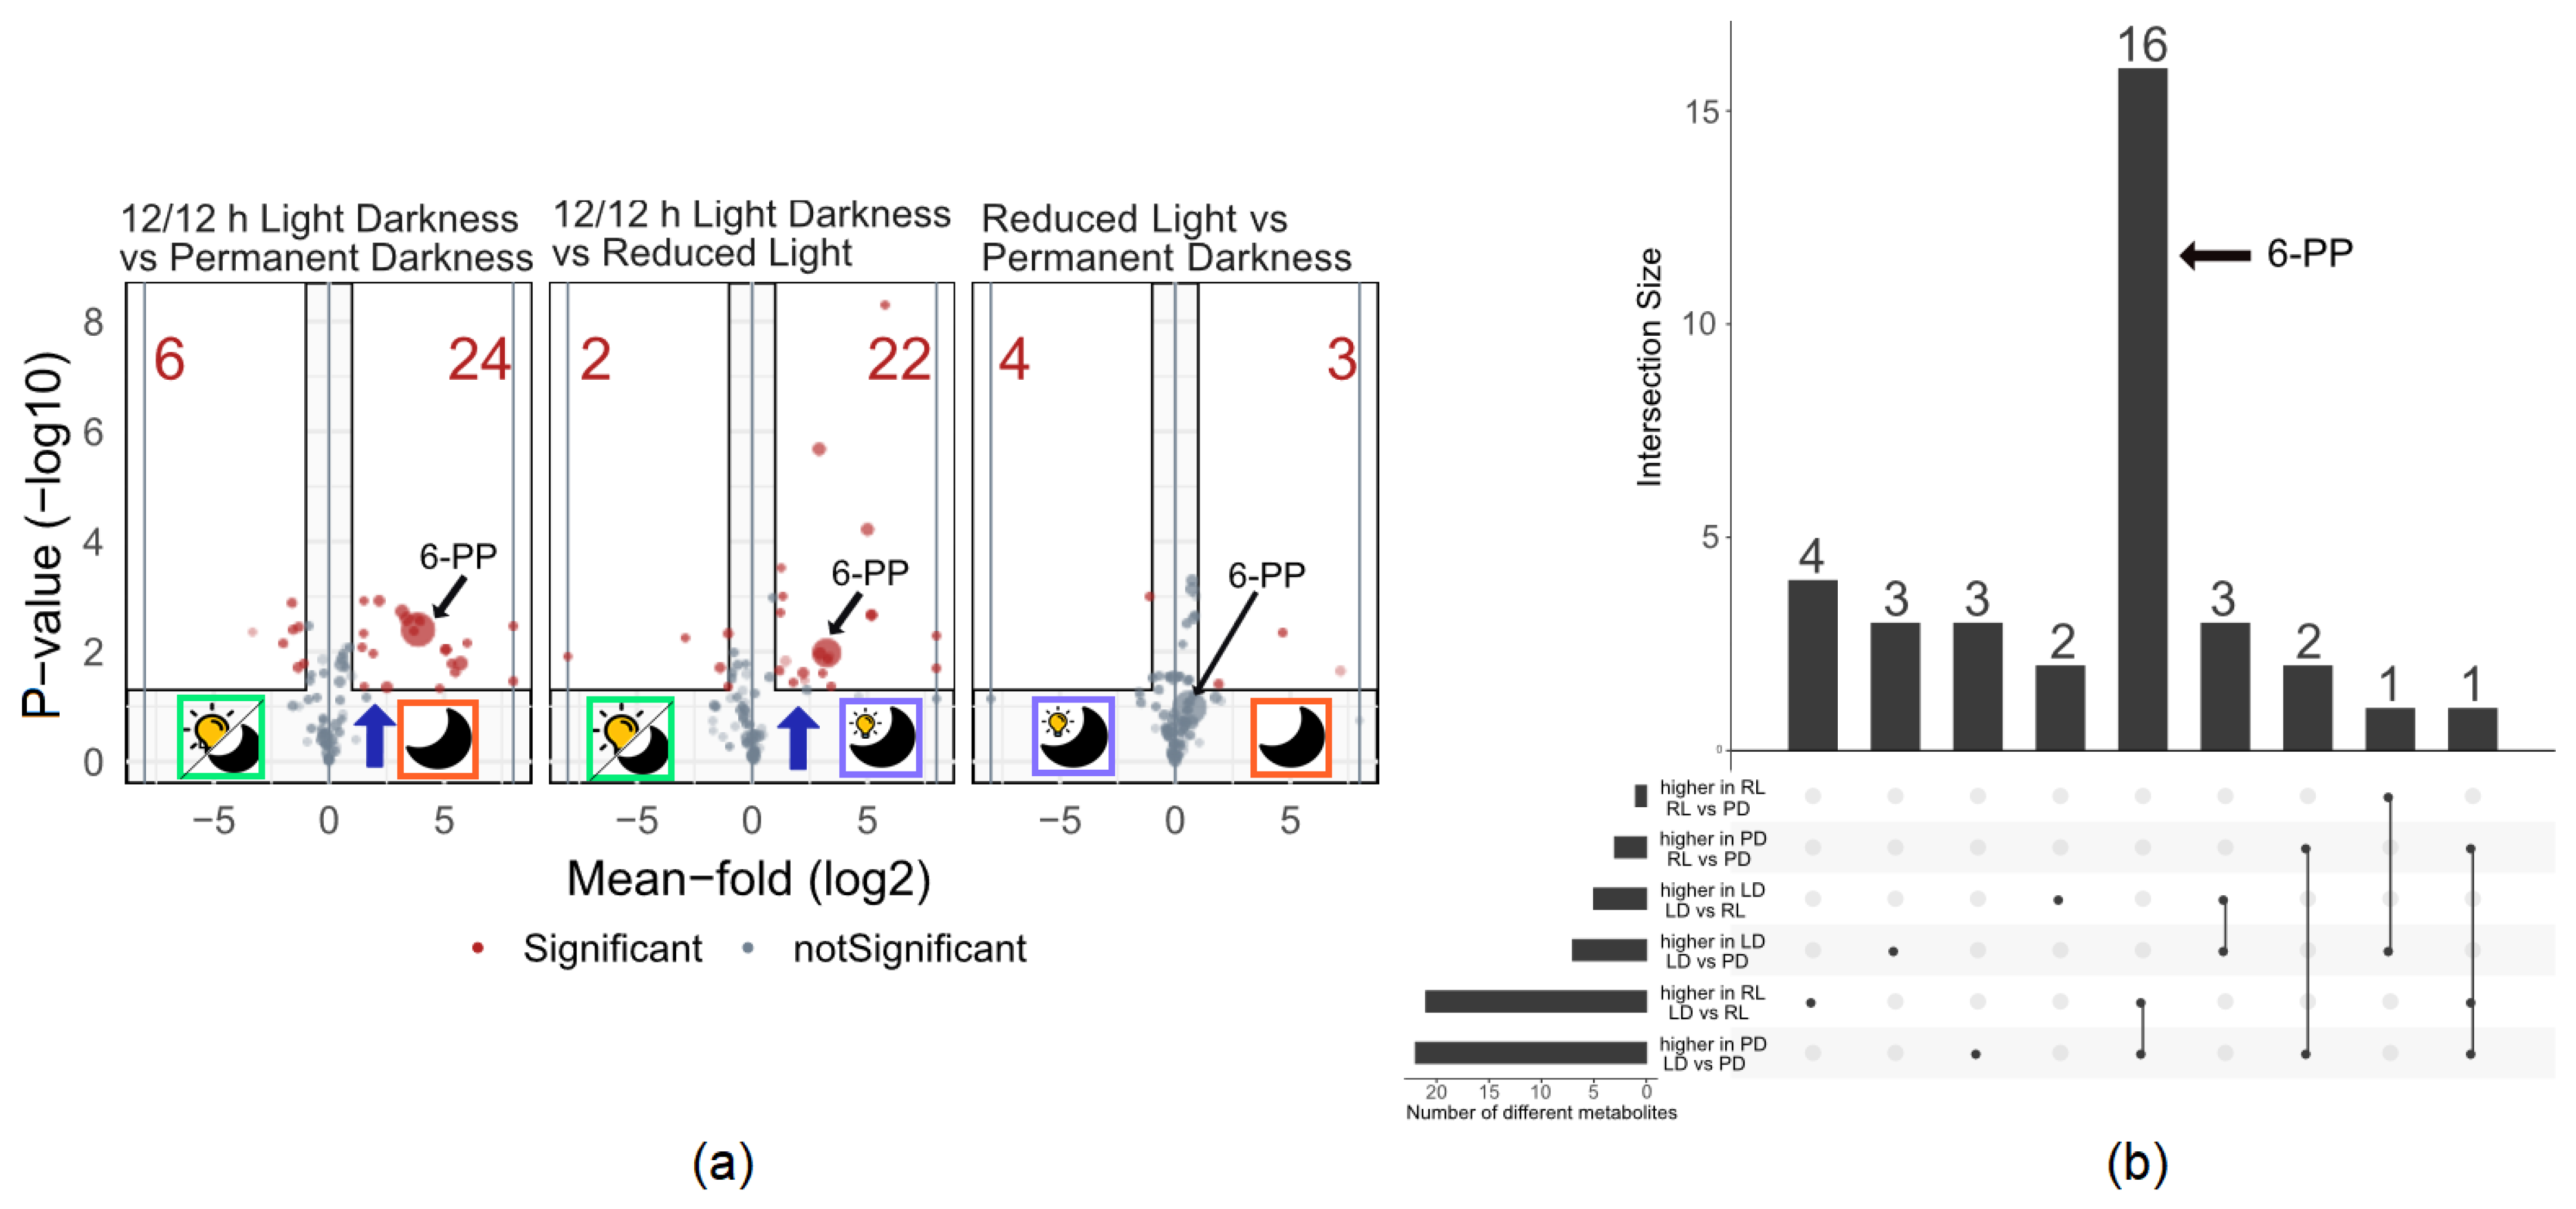
3.1. Metabolite Production under Three Different Light Regimes
3.2. Spatial Distribution of Metabolites Produced under PD and RL
4. Discussion
4.1. Metabolite Production under Three Different Light Regimes
4.2. Spatial Distribution of Metabolites Produced under PD and RL
Supplementary Materials
Author Contributions
Funding
Institutional Review Board Statement
Informed Consent Statement
Data Availability Statement
Acknowledgments
Conflicts of Interest
Appendix A


References
- Macias-Rodriguez, L.; Contreras-Cornejo, H.A.; Adame-Garnica, S.G.; del-Val, E.; Larsen, J. The interactions of Trichoderma at multiple trophic levels: Inter-kingdom communication. Microbiol. Res. 2020, 240, 126552. [Google Scholar] [CrossRef] [PubMed]
- Zin, N.A.; Badaluddin, N.A. Biological functions of Trichoderma spp. for agriculture applications. Ann. Agr. Sci. 2020, 65, 168–178. [Google Scholar] [CrossRef]
- Bhandari, S.; Pandey, K.; Joshi, Y.R.; Lamichhane, S. An Overview of Multifaceted Role of Trichoderma spp. for Sustainable Agriculture. Arch. Agric. Environ. Sci. 2021, 6, 72–79. [Google Scholar] [CrossRef]
- Manzar, N.; Kashyap, A.S.; Goutam, R.S.; Rajawat, M.V.S.; Sharma, P.K.; Sharma, S.K.; Singh, H.V. Trichoderma: Advent of Versatile Biocontrol Agent, Its Secrets and Insights into Mechanism of Biocontrol Potential. Sustainability 2022, 14, 12786. [Google Scholar] [CrossRef]
- Mukherjee, P.K.; Mendoza-Mendoza, A.; Zeilinger, S.; Horwitz, B.A. Mycoparasitism as a mechanism of Trichoderma-mediated suppression of plant diseases. Fungal Biol. Rev. 2022, 39, 15–33. [Google Scholar] [CrossRef]
- Alfiky, A.; Weisskopf, L. Deciphering Trichoderma-Plant-Pathogen Interactions for Better Development of Biocontrol Applications. J. Fungi 2021, 7, 61. [Google Scholar] [CrossRef]
- Contreras-Cornejo, H.A.; Macías-Rodríguez, L.; del-Val, E.; Larsen, J. Ecological functions of Trichoderma spp. and their secondary metabolites in the rhizosphere: Interactions with plants. FEMS Microbiol. Ecol. 2016, 92, fiw036. [Google Scholar] [CrossRef]
- Zeilinger, S.; Gruber, S.; Bansal, R.; Mukherjee, P.K. Secondary metabolism in Trichoderma–Chemistry meets genomics. Fungal Biol. Rev. 2016, 30, 74–90. [Google Scholar] [CrossRef]
- Shenouda, M.L.; Cox, R.J. Molecular methods unravel the biosynthetic potential of Trichoderma species. RSC Adv. 2021, 11, 3622–3635. [Google Scholar] [CrossRef]
- Brakhage, A.A. Regulation of fungal secondary metabolism. Nat. Rev. Microbiol. 2013, 11, 21–32. [Google Scholar] [CrossRef]
- Medema, M.H.; Kottmann, R.; Yilmaz, P.; Cummings, M.; Biggins, J.B.; Blin, K.; de Bruijn, I.; Chooi, Y.H.; Claesen, J.; Coates, R.C.; et al. Minimum Information about a Biosynthetic Gene cluster. Nat. Chem. Biol. 2015, 11, 625–631. [Google Scholar] [CrossRef] [PubMed]
- Mukherjee, P.K.; Horwitz, B.A.; Kenerley, C.M. Secondary metabolism in Trichoderma—A genomic perspective. Microbiology 2012, 158, 35–45. [Google Scholar] [CrossRef] [PubMed]
- Knowles, S.L.; Raja, H.A.; Roberts, C.D.; Oberlies, N.H. Fungal-fungal co-culture: A primer for generating chemical diversity. Nat. Prod. Rep. 2022, 39, 1557–1573. [Google Scholar] [CrossRef]
- Hautbergue, T.; Jamin, E.L.; Debrauwer, L.; Puel, O.; Oswald, I.P. From genomics to metabolomics, moving toward an integrated strategy for the discovery of fungal secondary metabolites. Nat. Prod. Rep. 2018, 35, 147–173. [Google Scholar] [CrossRef]
- Zhang, X.F.; Hindra; Elliot, M.A. Unlocking the trove of metabolic treasures: Activating silent biosynthetic gene clusters in bacteria and fungi. Curr. Opin. Microbiol. 2019, 51, 9–15. [Google Scholar] [CrossRef]
- Lucking, R.; Aime, M.C.; Robbertse, B.; Miller, A.N.; Aoki, T.; Ariyawansa, H.A.; Cardinali, G.; Crous, P.W.; Druzhinina, I.S.; Geiser, D.M.; et al. Fungal taxonomy and sequence-based nomenclature. Nat. Microbiol. 2021, 6, 540–548. [Google Scholar] [CrossRef]
- Steyaert, J.M.; Weld, R.J.; Mendoza-Mendoza, A.; Stewart, A. Reproduction without sex: Conidiation in the filamentous fungus Trichoderma. Microbiology 2010, 156, 2887–2900. [Google Scholar] [CrossRef]
- Demain, A.L. Regulation of secondary metabolism in fungi. Pure Appl. Chem. 1986, 58, 219–226. [Google Scholar] [CrossRef]
- Keller, N.P. Fungal secondary metabolism: Regulation, function and drug discovery. Nat. Rev. Microbiol. 2019, 17, 167–180. [Google Scholar] [CrossRef] [PubMed]
- Laatsch, H. AntiBase: The Natural Compound Identifier; Wiley-Vch: Weinheim, Germany, 2017. [Google Scholar]
- Zheng, C.J.; Sun, P.X.; Jin, G.L.; Qin, L.P. Sesquiterpenoids from Trichoderma atroviride, an endophytic fungus in Cephalotaxus fortunei. Fitoterapia 2011, 82, 1035–1038. [Google Scholar] [CrossRef]
- de Carvalho, C.C.C.R.; da Fonseca, M.M.R. Biotransformation of terpenes. Biotechnol. Adv. 2006, 24, 134–142. [Google Scholar] [CrossRef]
- Degenhardt, J.; Kollner, T.G.; Gershenzon, J. Monoterpene and sesquiterpene synthases and the origin of terpene skeletal diversity in plants. Phytochemistry 2009, 70, 1621–1637. [Google Scholar] [CrossRef] [PubMed]
- Keller, N.P.; Turner, G.; Bennett, J.W. Fungal secondary metabolism—From biochemistry to genomics. Nat. Rev. Microbiol. 2005, 3, 937–947. [Google Scholar] [CrossRef] [PubMed]
- Stoppacher, N.; Reithner, B.; Omann, M.; Zeilinger, S.; Krska, R.; Schuhmacher, R. Profiling of trichorzianines in culture samples of Trichoderma atroviride by liquid chromatography/tandem mass spectrometry. Rapid Commun. Mass Spectrom. 2007, 21, 3963–3970. [Google Scholar] [CrossRef]
- Degenkolb, T.; Bruckner, H. Peptaibiomics: Towards a myriad of bioactive peptides containing C-alpha-dialkylaimino acids? Chem. Biodivers. 2008, 5, 1817–1843. [Google Scholar] [CrossRef] [PubMed]
- Oh, S.U.; Lee, S.J.; Kim, J.H.; Yoo, I.D. Structural elucidation of new antibiotic peptides, atroviridins A, B and C from Trichoderma atroviride. Tetrahedron Lett. 2000, 41, 61–64. [Google Scholar] [CrossRef]
- Stoppacher, N.; Zeilinger, S.; Omann, M.; Lassahn, P.G.; Roitinger, A.; Krska, R.; Schuhmacher, R. Characterisation of the peptaibiome of the biocontrol fungus Trichoderma atroviride by liquid chromatography/tandem mass spectrometry. Rapid Commun. Mass Spectrom. 2008, 22, 1889–1898. [Google Scholar] [CrossRef] [PubMed]
- Chandrasekaran, M.; Paramasivan, M.; Sahayarayan, J.J. Microbial Volatile Organic Compounds: An Alternative for Chemical Fertilizers in Sustainable Agriculture Development. Microorganisms 2023, 11, 42. [Google Scholar] [CrossRef]
- Collins, R.P.; Halim, A.F. Characterization of the major aroma constituent of the fungus Trichoderma viride. J. Agric. Food Chem. 1972, 20, 437–438. [Google Scholar] [CrossRef]
- Rao, Y.X.; Zeng, L.Z.; Jiang, H.; Mei, L.; Wang, Y.J. Trichoderma atroviride LZ42 releases volatile organic compounds promoting plant growth and suppressing Fusarium wilt disease in tomato seedlings. BMC Microbiol. 2022, 22, 88. [Google Scholar] [CrossRef]
- Moreno-Ruiz, D.; Lichius, A.; Turra, D.; Di Pietro, A.; Zeilinger, S. Chemotropism Assays for Plant Symbiosis and Mycoparasitism Related Compound Screening in Trichoderma atroviride. Front. Microbiol. 2020, 11, 601251. [Google Scholar] [CrossRef]
- Contreras-Cornejo, H.A.; Orozco-Granados, O.; Ramirez-Ordorica, A.; Garcia-Juarez, P.; Lopez-Bucio, J.; Macias-Rodriguez, L. Light and mycelial injury influences the volatile and non-volatile metabolites and the biocontrol properties of Trichoderma atroviride. Rhizosphere 2022, 22, 100511. [Google Scholar] [CrossRef]
- Speckbacher, V.; Ruzsanyi, V.; Martinez-Medina, A.; Hinterdobler, W.; Doppler, M.; Schreiner, U.; Bohmdorfer, S.; Beccaccioli, M.; Schuhmacher, R.; Reverberi, M.; et al. The Lipoxygenase Lox1 Is Involved in Light- and Injury-Response, Conidiation, and Volatile Organic Compound Biosynthesis in the Mycoparasitic Fungus Trichoderma atroviride. Front. Microbiol. 2020, 11, 2004. [Google Scholar] [CrossRef] [PubMed]
- Rahimi Tamandegani, P.; Marik, T.; Zafari, D.; Balázs, D.; Vágvölgyi, C.; Szekeres, A.; Kredics, L. Changes in peptaibol production of Trichoderma species during in vitro antagonistic interactions with fungal plant pathogens. Biomolecules 2020, 10, 730. [Google Scholar] [CrossRef] [PubMed]
- Lombardi, N.; Vitale, S.; Turra, D.; Reverberi, M.; Fanelli, C.; Vinale, F.; Marra, R.; Ruocco, M.; Pascale, A.; d’Errico, G.; et al. Root Exudates of Stressed Plants Stimulate and Attract Trichoderma Soil Fungi. Mol. Plant-Microbe Interact. 2018, 31, 982–994. [Google Scholar] [CrossRef]
- Daryaei, A.; Jones, E.E.; Glare, T.R.; Falloon, R.E. pH and water activity in culture media affect biological control activity of Trichoderma atroviride against Rhizoctonia solani. Biol. Control 2016, 92, 24–30. [Google Scholar] [CrossRef]
- Nielsen, K.F.; Larsen, T.O. The importance of mass spectrometric dereplication in fungal secondary metabolite analysis. Front. Microbiol. 2015, 6, 71. [Google Scholar] [CrossRef]
- Speckbacher, V.; Ruzsanyi, V.; Wigger, M.; Zeilinger, S. The Trichoderma atroviride Strains P1 and IMI 206040 Differ in Their Light-Response and VOC Production. Molecules 2020, 25, 208. [Google Scholar] [CrossRef]
- Moreno-Ruiz, D.; Fuchs, A.; Missbach, K.; Schuhmacher, R.; Zeilinger, S. Influence of Different Light Regimes on the Mycoparasitic Activity and 6-Pentyl-alpha-pyrone Biosynthesis in Two Strains of Trichoderma atroviride. Pathogens 2020, 9, 860. [Google Scholar] [CrossRef]
- Daryaei, A.; Jones, E.E.; Ghazalibiglar, H.; Glare, T.R.; Falloon, R.E. Effects of temperature, light and incubation period on production, germination and bioactivity of Trichoderma atroviride. J. Appl. Microbiol. 2016, 120, 999–1009. [Google Scholar] [CrossRef]
- Esquivel-Naranjo, E.U.; Garcia-Esquivel, M.; Medina-Castellanos, E.; Correa-Perez, V.A.; Parra-Arriaga, J.L.; Landeros-Jaime, F.; Cervantes-Chavez, J.A.; Herrera-Estrella, A. A Trichoderma atroviride stress-activated MAPK pathway integrates stress and light signals. Mol. Microbiol. 2016, 100, 860–876. [Google Scholar] [CrossRef] [PubMed]
- Bueschl, C.; Kluger, B.; Lemmens, M.; Adam, G.; Wiesenberger, G.; Maschietto, V.; Marocco, A.; Strauss, J.; Bödi, S.; Thallinger, G.G.; et al. A novel stable isotope labelling assisted workflow for improved untargeted LC–HRMS based metabolomics research. Metabolomics 2014, 10, 754–769. [Google Scholar] [CrossRef] [PubMed]
- Bueschl, C.; Kluger, B.; Neumann, N.K.N.; Doppler, M.; Maschietto, V.; Thallinger, G.G.; Meng-Reiterer, J.; Krska, R.; Schuhmacher, R. MetExtract II: A Software Suite for Stable Isotope-Assisted Untargeted Metabolomics. Anal. Chem. 2017, 89, 9518–9526. [Google Scholar] [CrossRef]
- Kessner, D.; Chambers, M.; Burke, R.; Agus, D.; Mallick, P. ProteoWizard: Open source software for rapid proteomics tools development. Bioinformatics 2008, 24, 2534–2536. [Google Scholar] [CrossRef] [PubMed]
- Smith, C.A.; Want, E.J.; O’Maille, G.; Abagyan, R.; Siuzdak, G. XCMS: Processing mass spectrometry data for metabolite profiling using Nonlinear peak alignment, matching, and identification. Anal. Chem. 2006, 78, 779–787. [Google Scholar] [CrossRef] [PubMed]
- Wang, M.X.; Carver, J.J.; Phelan, V.V.; Sanchez, L.M.; Garg, N.; Peng, Y.; Nguyen, D.D.; Watrous, J.; Kapono, C.A.; Luzzatto-Knaan, T.; et al. Sharing and community curation of mass spectrometry data with Global Natural Products Social Molecular Networking. Nat. Biotechnol. 2016, 34, 828–837. [Google Scholar] [CrossRef]
- Shannon, P.; Markiel, A.; Ozier, O.; Baliga, N.S.; Wang, J.T.; Ramage, D.; Amin, N.; Schwikowski, B.; Ideker, T. Cytoscape: A software environment for integrated models of biomolecular interaction networks. Genome Res. 2003, 13, 2498–2504. [Google Scholar] [CrossRef]
- Doppler, M.; Bueschl, C.; Ertl, F.; Woischitzschlaeger, J.; Parich, A.; Schuhmacher, R. Towards a broader view of the metabolome: Untargeted profiling of soluble and bound polyphenols in plants. Anal. Bioanal. Chem. 2022, 414, 7421–7433. [Google Scholar] [CrossRef]
- Šidák, Z. Rectangular Confidence Regions for the Means of Multivariate Normal Distributions. J. Am. Stat. Assoc. 1967, 62, 626–633. [Google Scholar] [CrossRef]
- Conway, J.R.; Lex, A.; Gehlenborg, N. UpSetR: An R package for the visualization of intersecting sets and their properties. Bioinformatics 2017, 33, 2938–2940. [Google Scholar] [CrossRef]
- Lex, A.; Gehlenborg, N.; Strobelt, H.; Vuillemot, R.; Pfister, H. UpSet: Visualization of Intersecting Sets. IEEE Trans. Vis. Comput. Graph. 2014, 20, 1983–1992. [Google Scholar] [CrossRef]
- Reithner, B.; Schuhmacher, R.; Stoppacher, N.; Pucher, M.; Brunner, K.; Zeilinger, S. Signaling via the Trichoderma atroviride mitogen-activated protein kinase Tmk1 differentially affects mycoparasitism and plant protection. Fungal Genet. Biol. 2007, 44, 1123–1133. [Google Scholar] [CrossRef]
- Macias-Rodriguez, L.; Guzman-Gomez, A.; Garcia-Juarez, P.; Contreras-Cornejo, H.A. Trichoderma atroviride promotes tomato development and alters the root exudation of carbohydrates, which stimulates fungal growth and the biocontrol of the phytopathogen Phytophthora cinnamomi in a tripartite interaction system. FEMS Microbiol. Ecol. 2018, 94, fiy137. [Google Scholar] [CrossRef] [PubMed]
- Hilje-Rodríguez, I.; Albertazzi, F.J.; Rivera-Coto, G.; Molina-Bravo, R. A multiplex qPCR TaqMan-assay to detect fungal antagonism between Trichoderma atroviride (Hypocreaceae) and Botrytis cinerea (Sclerotiniaceae) in blackberry fruits using a de novo tef1-α- and an IGS-sequence based probes. Biotechnol. Rep. 2020, 27, e00447. [Google Scholar] [CrossRef]
- Coninck, E.; Scauflaire, J.; Gollier, M.; Lienard, C.; Foucart, G.; Manssens, G.; Munaut, F.; Legreve, A. Trichoderma atroviride as a promising biocontrol agent in seed coating for reducing Fusarium damping-off on maize. J. Appl. Microbiol. 2020, 129, 637–651. [Google Scholar] [CrossRef] [PubMed]
- Cetz-Chel, J.E.; Balcazar-Lopez, E.; Esquivel-Naranjo, E.U.; Herrera-Estrella, A. The Trichoderma atroviride putative transcription factor Blu7 controls light responsiveness and tolerance. BMC Genom. 2016, 17, 327. [Google Scholar] [CrossRef]
- Fuller, K.K.; Loros, J.J.; Dunlap, J.C. Fungal photobiology: Visible light as a signal for stress, space and time. Curr. Genet. 2015, 61, 275–288. [Google Scholar] [CrossRef]
- Casas-Flores, S.; Rios-Momberg, M.; Rosales-Saavedra, T.; Martinez-Hernandez, P.; Olmedo-Monfil, V.; Herrera-Estrella, A. Cross talk between a fungal blue-light perception system and the cyclic AMP signaling pathway. Eukaryot. Cell 2006, 5, 499–506. [Google Scholar] [CrossRef]
- Bai, B.; Liu, C.; Zhang, C.; He, X.; Wang, H.; Peng, W.; Zheng, C. Trichoderma species from plant and soil: An excellent resource for biosynthesis of terpenoids with versatile bioactivities. J. Adv. Res. 2023, 49, 81–102. [Google Scholar] [CrossRef]
- Amirzakariya, B.Z.; Shakeri, A. Bioactive terpenoids derived from plant endophytic fungi: An updated review (2011–2020). Phytochemistry 2022, 197, 113130. [Google Scholar] [CrossRef] [PubMed]
- Sofian, F.F.; Warahapsari, F.A.; Yoshida, J.; Ito, Y.; Koseki, T.; Shiono, Y. Two new octahydronaphthalene derivatives, trichodermic acids C and D produced by Trichoderma sp. HN-1.1. Nat. Prod. Res. 2023, 37, 484–493. [Google Scholar] [CrossRef]
- Klitgaard, A.; Nielsen, J.B.; Frandsen, R.J.N.; Andersen, M.R.; Nielsen, K.F. Combining Stable Isotope Labeling and Molecular Networking for Biosynthetic Pathway Characterization. Anal. Chem. 2015, 87, 6520–6526. [Google Scholar] [CrossRef] [PubMed]
- Huang, Q.; Tezuka, Y.; Hatanaka, Y.; Kikuchi, T.; Nishi, A.; Tubaki, K. Studies on Metabolites of Mycoparasitic Fungi. 3. New Sesquiterpene Alcohol from Trichoderma-koningii. Chem. Pharm. Bull. 1995, 43, 1035–1038. [Google Scholar] [CrossRef]
- Stoppacher, N.; Kluger, B.; Zeilinger, S.; Krska, R.; Schuhmacher, R. Identification and profiling of volatile metabolites of the biocontrol fungus Trichoderma atroviride by HS-SPME-GC-MS. J. Microbiol. Methods 2010, 81, 187–193. [Google Scholar] [CrossRef] [PubMed]
- Demain, A.L.; Fang, A. The Natural Functions of Secondary Metabolites. In History of Modern Biotechnology I; Fiechter, A., Ed.; Springer: Berlin/Heidelberg, Germany, 2000; pp. 1–39. [Google Scholar]
- Druzhinina, I.S.; Seidl-Seiboth, V.; Herrera-Estrella, A.; Horwitz, B.A.; Kenerley, C.M.; Monte, E.; Mukherjee, P.K.; Zeilinger, S.; Grigoriev, I.V.; Kubicek, C.P. Trichoderma: The genomics of opportunistic success. Nat. Rev. Microbiol. 2011, 9, 749–759. [Google Scholar] [CrossRef] [PubMed]
- Thrane, U.; Anderson, B.; Frisvad, J.C.; Smedsgaard, J. The exo-metabolome in filamentous fungi. In Metabolomics: A Powerful Tool in Systems Biology; Nielsen, J., Jewett, M.C., Eds.; Springer: Berlin/Heidelberg, Germany, 2007; pp. 235–252. [Google Scholar]
- Barreto, M.C.; Frisvad, J.C.; Larsen, T.O.; Mogensen, J.; San-Romão, M.V. Exo-metabolome of some fungal isolates growing on cork-based medium. Eur. Food Res. Technol. 2011, 232, 575–582. [Google Scholar] [CrossRef]
- Wang, W.-J.; Li, D.-Y.; Li, Y.-C.; Hua, H.-M.; Ma, E.-L.; Li, Z.-L. Caryophyllene Sesquiterpenes from the Marine-Derived Fungus Ascotricha sp. ZJ-M-5 by the One Strain–Many Compounds Strategy. J. Nat. Prod. 2014, 77, 1367–1371. [Google Scholar] [CrossRef]
- Henriquez-Urrutia, M.; Spanner, R.; Olivares-Yanez, C.; Seguel-Avello, A.; Perez-Lara, R.; Guillen-Alonso, H.; Winkler, R.; Herrera-Estrella, A.H.; Canessa, P.; Larrondo, L.F. Circadian oscillations in Trichoderma atroviride and the role of core clock components in secondary metabolism, development, and mycoparasitism against the phytopathogen Botrytis cinerea. eLife 2022, 11, e71358. [Google Scholar] [CrossRef]
- Kramer, R.; Abraham, W.-R. Volatile sesquiterpenes from fungi: What are they good for? Phytochem. Rev. 2012, 11, 15–37. [Google Scholar] [CrossRef]


Disclaimer/Publisher’s Note: The statements, opinions and data contained in all publications are solely those of the individual author(s) and contributor(s) and not of MDPI and/or the editor(s). MDPI and/or the editor(s) disclaim responsibility for any injury to people or property resulting from any ideas, methods, instructions or products referred to in the content. |
© 2023 by the authors. Licensee MDPI, Basel, Switzerland. This article is an open access article distributed under the terms and conditions of the Creative Commons Attribution (CC BY) license (https://creativecommons.org/licenses/by/4.0/).
Share and Cite
Missbach, K.; Flatschacher, D.; Bueschl, C.; Samson, J.M.; Leibetseder, S.; Marchetti-Deschmann, M.; Zeilinger, S.; Schuhmacher, R. Light-Induced Changes in Secondary Metabolite Production of Trichoderma atroviride. J. Fungi 2023, 9, 785. https://doi.org/10.3390/jof9080785
Missbach K, Flatschacher D, Bueschl C, Samson JM, Leibetseder S, Marchetti-Deschmann M, Zeilinger S, Schuhmacher R. Light-Induced Changes in Secondary Metabolite Production of Trichoderma atroviride. Journal of Fungi. 2023; 9(8):785. https://doi.org/10.3390/jof9080785
Chicago/Turabian StyleMissbach, Kristina, Daniel Flatschacher, Christoph Bueschl, Jonathan Matthew Samson, Stefan Leibetseder, Martina Marchetti-Deschmann, Susanne Zeilinger, and Rainer Schuhmacher. 2023. "Light-Induced Changes in Secondary Metabolite Production of Trichoderma atroviride" Journal of Fungi 9, no. 8: 785. https://doi.org/10.3390/jof9080785
APA StyleMissbach, K., Flatschacher, D., Bueschl, C., Samson, J. M., Leibetseder, S., Marchetti-Deschmann, M., Zeilinger, S., & Schuhmacher, R. (2023). Light-Induced Changes in Secondary Metabolite Production of Trichoderma atroviride. Journal of Fungi, 9(8), 785. https://doi.org/10.3390/jof9080785