Article

Triphenylphosphonium (TPP)-Conjugated Quinolone Analogs Displayed Significantly Enhanced Fungicidal Activity Superior to Its Parent Molecule

1
College of Science, China Agricultural University, Beijing 100193, China
2
Pharmaceutical Institute, Xinjiang University, Urumqi 830046, China
*
Author to whom correspondence should be addressed.
These authors contributed equally to this work.
J. Fungi 2023, 9(6), 685; https://doi.org/10.3390/jof9060685
Submission received: 25 May 2023 / Revised: 14 June 2023 / Accepted: 15 June 2023 / Published: 19 June 2023
(This article belongs to the Special Issue Control of Crop Fungal Diseases)

Abstract

:
Although 1-hydroxy-4-quinolone derivatives, such as 2-heptyl-4-hydroxyquinoline-N-oxide (HQNO), aurachin C, and floxacrine, have been reported as effective cytochrome bc1 complex inhibitors, the bioactivity of these products is not ideal, presumably due to their low bioavailability in tissues, particularly their poor solubility and low mitochondrial accumulation. In order to overcome the drawbacks of these compounds and develop their use as agricultural fungicides acting by cytochrome bc1 inhibition, in this study, three novel mitochondria-targeting quinolone analogs (mitoQNOs) were designed and synthesized by conjugating triphenylphosphonium (TPP) with quinolone. They exhibited greatly enhanced fungicidal activity compared to the parent molecule, especially mitoQNO11, which showed high antifungal activity against Phytophthora capsici and Sclerotinia sclerotiorum with EC50 values of 7.42 and 4.43 μmol/L, respectively. In addition, mitoQNO11 could inhibit the activity of the cytochrome bc1 complex of P. capsici in a dose-dependent manner and effectively depress its respiration and ATP production. The greatly decreased mitochondrial membrane potential and massively generated reactive oxygen species (ROS) strongly suggested that the inhibition of complex III led to the leakage of free electrons, which resulted in the damage of the pathogen cell structure. The results of this study indicated that TPP-conjugated QNOs might be used as agricultural fungicides by conjugating them with TPP.

1. Introduction

Since the first quinolone derivative nalidixic acid was reported in 1962, more than 100,000 quinolone derivatives have been synthesized, which has been one of the hot spots in drug development [1]. Quinolones have demonstrated antiviral, antituberculotic, anticancer, fungicidal, and other beneficial biological activities and act on different targets [2,3]. Among them, 2-heptyl-4-hydroxyquinoline-N-oxide (HQNO, Figure 1) is reported to be a cytochrome bc1 complex (complex III) inhibitor, mainly used against Staphylococcus aureus. As an analog in the ubiquinone, it can occupy the quinone reduction site (Qi site) of cyt. bc1 complex to block electron transfer of electron transfer chain (ETC) [3,4]. Aurachin C is a natural product isolated from Stigmatella aurantiaca strain Sg a15 [5] and its analogs are usually effective inhibitors of Qi site [6,7], whereas floxacrine is an antimalarial drug also acting as cyt. bc1 complex inhibitor [8,9]. Because all of these compounds contain a 1-hydroxy-4-quinolone (QNO) framework, which is structurally similar to ubiquinone in mitochondria, they exhibit good enzyme inhibitory activity on cyt. bc1 complex. However, most of them show poor activity in vivo, presumably due to their poor solubility and mitochondrial accumulation [10,11]
The cyt. bc1 complex, as a central component of the mitochondrial respiratory chain, mainly catalyzes the transfer of electrons from hydroquinone to the water-soluble electron receptor cytochrome c, accompanied by transmembrane transferring of protons [12]. In agricultural production, fungicides targeting complex III have been the most successful crop protection products for the past 30 years [6,13]. However, frequent and extensive field applications have caused serious resistance of phytopathogens to these fungicides, and new fungicides or resistance management strategies are urgently needed. Moreover, so far there are no reports on the effects and applications of 1-hydroxy-4-quinolone derivatives against plant pathogenic fungi.
Cations such as triphenylphosphonium (TPP) can be accumulated rapidly and efficiently in mitochondria due to their excellent affinity to the negatively charged mitochondrial membrane and high lipophilicity; therefore, TPP is frequently used in mitochondria-targeting drug research [14]. By conjugating TPP to a traditional amide fungicide, we obtained novel mitochondria-targeting succinate dehydrogenase (SDH) inhibitors with high efficiency and low resistance risk, which proved their potential in the development of new ETC inhibitors [15]. To overcome the drawbacks of poor solubility and less efficiency in mitochondrial accumulation of MQNO, the purposes of this study are to (i) synthesize mitochondria-targeted quinolones, termed mitoQNOs, which consist of an active ingredient, a linker, and a mitochondria-targeting group TPP (Figure 1); (ii) investigate the antifungal efficacy of these compounds; and (iii) derive mechanistic insights into the action of mitoQNOs.

2. Materials and Methods

Instrumentation and Materials. The chemicals and reagents used were obtained from commercial sources without further purification. The 1H NMR (300 MHz) and 13C NMR (75 MHz) spectra were obtained on a Bruker AVANCE DPX300 spectrometer (Bruker Corp., Billerica, MA, USA) using tetramethylsilane as the internal standard. High-resolution mass spectra (HRMS) were obtained on an Agilent-ESI-Q-TOF spectrometer (Agilent Tech. Inc., Lexington, CA, USA). FL × 800 Fluorescent microplate reader (BioTek, Winooski, VT, USA), PowerWave XS2 microplate reader (BioTek, Winooski, VT, USA), and Olympus CCD−DP72 fluorescent microscope (Olympus Co., TKY, Japan) were used for fluorescence measurement. Melting point was recorded on a Yanagimoto MFG apparatus, and the thermometer was uncorrected.
Synthetic Procedures.
Synthesis of compound 1. A mixture of 75 mmol of aniline, 3.5 mL of acetic acid, and 75 mmol of ethyl acetoacetate in 90 mL of toluene was refluxed to dehydration via azeotropic distillation. After 6 h, the reaction was completed, and the mixture was concentrated to dryness in vacuo to afford 1 as crude product, which was directly used in the next step without further purification.
Synthesis of compound 2. Diphenyl ether (70 mL) was added to crude 1, and the mixture was allowed to reflux for 10 min. After cooling, 200 mL ethyl acetate was added, and the precipitated solid was collected and washed with ethyl acetate. An amount of 8.7 g of compound 2 was obtained as white powder with 73% yield, mp. 233.8–234.4 °C. 1H NMR (300 MHz, DMSO-d6) δ 10.65 (s, 1H), 8.37–8.23 (m, 1H), 8.11 (qd, J = 6.8, 3.3 Hz, 1H), 7.85–7.75 (m, 1H), 7.23 (s, 1H), 2.82 (s, 2H).
Synthesis of compound 3. Potassium tert-butoxide (100 mmol) was added to a solution of 50 mmol compound 2 in 100 mL THF and the mixture was stirred for 1 h at room temperature. The reaction mixture was cooled in an ice bath, 52 mmol of dimethylcarbamic chloride was dropped in, and the reaction was continued for 2 h below 10 °C. It was extracted with ethyl acetate (3 × 100 mL) and the combined organic phase was dried over anhydrous sodium sulfate and then filtered. The filtrate was evaporated to dryness under reduced pressure, and the residue was purified by silica gel chromatography to afford 3 as white powder with 93% yield, mp. 129.6–131.8 °C. 1H NMR (300 MHz, DMSO-d6) δ 10.65 (s, 1H), 8.37–8.23 (m, 1H), 8.11 (qd, J = 6.8, 3.3 Hz, 1H), 7.85–7.75 (m, 1H), 7.23 (s, 1H), 2.82 (s, 2H).
Synthesis of compound 4. Compound 3 (40 mmol) was dissolved in 150 mL of dichloromethane, then 60 mmol of 85% meta-chloroperbenzoic acid (MCPBA) was added slowly under ice-bath cooling, and the reaction was continued for 5 h at room temperature. It was washed with saturated aqueous sodium bicarbonate (2 × 60 mL), and the combined organic phase was dried over anhydrous sodium sulfate and then filtered. The filtrate was evaporated to dryness under reduced pressure, and the residue was purified by silica gel chromatography to afford 4 as brown powder with 90% yield, mp. 236.2–237.8 °C. 1H NMR (300 MHz, CDCl3) δ 7.99 (dd, J = 25.2, 7.9 Hz, 1H), 7.74–7.64 (m, 1H), 7.48 (t, J = 7.2 Hz, 1H), 7.27 (s, 1H), 3.23 (s, 3H), 3.07 (s, 3H), 2.74 (s, 3H).
Synthesis of compound 5. Compound 4 (30 mmol) was hydrolyzed with 30 mL of 5 mol/L potassium hydroxide at room temperature for 2 h. It was adjusted pH = 2 with 5 mol/L hydrochloride and the precipitated grey solid was collected and dried, obtaining 5 g compound 5 with 96% yield, mp. 266.0–267.5 °C. 1H NMR (300 MHz, DMSO-d6) δ 9.76 (s, 1H), 8.37–8.22 (m, 2H), 8.16–8.03 (m, 1H), 7.80 (t, J = 7.3 Hz, 1H), 7.22 (s, 1H), 2.81 (s, 3H).
General synthetic procedure of compound 6. A mixture of 8.6 mmol of compound 5, 25.8 mmol trimethylamine, and 50 mL dichloromethane was stirred for 30 min in an ice bath. ω-bromoaliphatic acyl chloride (9.04 mmol) was added slowly and the reaction was continued for 2 h at ambient temperature. The mixture was extracted with dichloromethane (3 × 100 mL), and the combined organic phase was dried over anhydrous sodium sulfate and then filtered. The filtrate was evaporated to dryness under reduced pressure, and the residue was purified by silica gel chromatography to afford 6.
Data for 61. White powder, mp. 136.0–138.5 °C, yield 89%. 1H NMR (300 MHz, CDCl3) δ 8.30 (dd, J = 8.1, 1.3 Hz, 1H), 7.57 (ddd, J = 8.5, 7.3, 1.4 Hz, 1H), 7.30 (t, J = 7.6 Hz, 1H), 7.12 (d, J = 8.5 Hz, 1H), 3.39 (t, J = 6.5 Hz, 2H), 2.73 (td, J = 7.3, 2.5 Hz, 2H), 2.22 (s, 3H), 1.96–1.74 (m, 4H), 1.64–1.50 (m, 2H). 13C NMR (75 MHz, CDCl3) δ 176.73, 169.98, 148.14, 138.64, 132.32, 126.17, 124.77, 123.66, 112.08, 108.86, 32.91, 31.69, 30.55, 27.17, 23.32, 17.46. HRMS (ESI) for (C16H18BrNO3) ([M + H]+) 352.0544.
Data for 62. White powder, mp. 144.3–146.0 °C, yield 86%. 1H NMR (300 MHz, CDCl3) δ 8.27 (dd, J = 8.1, 1.3 Hz, 1H), 7.54 (ddd, J = 8.5, 7.2, 1.5 Hz, 1H), 7.31–7.20 (m, 1H), 7.10 (d, J = 8.4 Hz, 1H), 6.02 (s, 1H), 3.33 (t, J = 6.7 Hz, 2H), 2.67 (td, J = 7.4, 2.3 Hz, 2H), 2.19 (s, 3H), 1.84–1.66 (m, 4H), 1.49–1.24 (m, 6H). 13C NMR (75 MHz, CDCl3) δ 176.65, 170.15, 148.20, 138.62, 132.27, 126.05, 124.71, 123.58, 112.13, 108.75, 33.54, 32.14, 30.60, 28.42, 27.80, 27.40, 23.99, 17.41. HRMS (ESI) for (C18H22BrNO3) ([M + H]+) 380.0859.
Data for 63. White powder, mp. 163.0–164.5 °C, yield 83%. 1H NMR (300 MHz, DMSO-d6) δ 8.33 (dd, J = 8.1, 1.4 Hz, 1H), 7.65–7.53 (m, 1H), 7.36–7.29 (m, 1H), 7.16 (d, J = 8.5 Hz, 1H), 3.38 (t, J = 6.8 Hz, 2H), 2.72 (td, J = 7.4, 1.8 Hz, 2H), 2.25 (s, 3H), 1.81 (dq, J = 13.7, 7.0 Hz, 4H), 1.46–1.22 (m, 12H). 13C NMR (75 MHz, CDCl3) δ 176.74, 170.18, 148.11, 138.69, 132.20, 126.20, 124.81, 123.58, 112.07, 108.86, 33.67, 32.39, 30.75, 28.91, 28.83, 28.67, 28.29, 27.71, 24.19, 17.42. HRMS (ESI) for (C21H29BrNO3) ([M + H]+) 422.1321.
General synthetic procedure of mitoQNOs. To a mixture of 3 mmol of compound 6, 3.6 mmol of triphenylphosphine and 0.14 mmol potassium iodide 50 mL acetonitrile were added at argon atmosphere and the mixture was allowed to reflux for 12 h. The solvent was evaporated in vacuo and the residue was purified by silica gel chromatography to afford mitoQNOs.
Data for mitoQNO6. Viscose yellow oil, yield 71%. 1H NMR (300 MHz, CDCl3) δ 8.23 (d, J = 8.2 Hz, 1H), 7.85–7.59 (m, 16H), 7.30 (s, 1H), 7.22 (t, J = 7.7 Hz, 1H), 6.05 (s, 1H), 3.78–3.52 (m, 2H), 2.99–2.75 (m, 2H), 2.19 (s, 3H), 1.96–1.56 (m, 6H). 13C NMR (75 MHz, CDCl3) δ 176.77, 170.19, 148.88, 138.51, 134.84, 134.81, 133.37, 133.24, 133.15, 133.10, 132.91, 130.33, 130.17, 125.83, 124.46, 123.78, 118.14, 117.00, 112.82, 108.63, 30.62, 29.40, 29.19, 23.41, 22.90, 21.97, 21.92, 17.90. 31P NMR (121 MHz, CDCl3) δ 25.02. HRMS (m/z) calcd. for C34H33NO3P+ [M]+ 534.2193, found 534.2191.
Data for mitoQNO8. Yellow solid, m.p. 63.6–64.2 °C, yield 84%. 1H NMR (300 MHz, CDCl3) δ 8.30 (d, J = 7.2 Hz, 1H), 7.89–7.61 (m, 16H), 7.34 (s, 1H), 7.31–7.20 (m, 1H), 6.12 (s, 1H), 3.85–3.65 (m, 2H), 2.97–2.68 (m, 2H), 2.22 (s, 3H), 1.92–1.38 (m, 10H). 13C NMR (75 MHz, CDCl3) δ 176.76, 170.32, 148.75, 138.57, 134.71, 134.67, 133.31, 133.18, 133.08, 132.69, 130.23, 130.06, 125.95, 124.53, 123.72, 118.42, 117.28, 112.55, 108.77, 30.68, 29.68, 29.47, 29.26, 28.12, 27.94, 23.81, 22.68, 22.15, 22.09, 22.01, 17.58. 31P NMR (121 MHz, CDCl3) δ 24.93. HRMS (m/z) calcd. for C36H37NO3P+ [M]+ 562.2506, found 562.2500.
Data for mitoQNO11. Yellow solid, m.p. 85.3–86.2 °C, yield 82%. 1H NMR (300 MHz, CDCl3) δ 8.08 (d, J = 8.0 Hz, 1H), 7.69–7.52 (m, 15H), 7.51–7.45 (m, 1H), 7.15 (t, J = 7.6 Hz, 1H), 7.09 (d, J = 8.5 Hz, 1H), 5.87 (s, 1H), 3.44–3.30 (m, 2H), 2.64 (td, J = 7.3, 2.3 Hz, 2H), 2.13 (s, 3H), 1.71–1.58 (m, 2H), 1.47 (s, 4H), 1.34–1.20 (m, 2H), 1.20–1.01 (m, 8H). 13C NMR (75 MHz, CDCl3) δ 176.57, 170.35, 148.30, 138.57, 134.78, 134.74, 133.18, 133.05, 132.40, 130.25, 130.08, 125.75, 124.59, 123.51, 118.11, 116.97, 112.35, 108.55, 30.80, 30.08, 29.87, 28.60, 28.56, 28.45, 24.03, 22.89, 22.22, 22.15, 22.09, 17.59. 31P NMR (121 MHz, CDCl3) δ 25.05. HRMS (m/z) calcd. for C39H43NO3P+ [M]+ 604.2975, found 604.2971.
In vitro fungicidal activity assay. The in vitro fungicidal activity of the mitoQNOs was determined by mycelium growth rate method, and boscalid (complex II inhibitor) and kresoxim-methyl (cyt. bc1 complex inhibitor) were used as positive controls. When the mycelium in the control group was fully grown in the whole Petri dish, the diameter of the colony in each treating Petri dish was recorded with the criss-cross method, and the inhibition rate of mycelial growth was calculated as follows:
Mycelial growth diameter (mm) = mean diameter (measured three times)–5.0 (diameter of fungus plug).
Mycelial growth inhibition rate (%) = [(mycelium growth diameter of the control group–mycelium growth diameter of the treatment group)/mycelium growth diameter of the control group] × 100%.
The median effect concentration (EC50) values were calculated according to the linear regression of colony diameter on log-transformed fungicide concentrations. The experiment was repeated three times in each group.
Determination of mycelium respiration. Active mycelial cakes were obtained by punching holes at the edge of the activated fungi, and 6–10 pieces of fungus plugs were added to 100 mL of PDB medium. Then the PDB medium was cultured in constant temperature shaker at 25 °C and 160 rpm for 48 h. The hyphae were filtered by vacuum pump, and hyphal respiration was measured by Clark oxygen electrode [16]. The experiment was repeated three times in each group.
Mitochondrial complex III inhibition assay. Hyphal mitochondria were extracted by differential centrifugation. After three times freeze-thaw, samples were treated with different concentrations of mitoQNO11 and pyrimorph, then complex III activity was detected by complex III activity assay kit (Genmed Scientifics Inc., Plymouth, MN, USA, GMS50009) [17]. The experiment was repeated three times in each group.
Measurement of ATP level in mycelium of P. capsici. Hyphae were cultured for 48 h in PDB medium and continued to grow for 3 h after adding fungicides. Then, the hyphae were filtered out in vacuo and cut into 10 mg-sized hyphae with a knife. A total of 0.3 mL of PBS (10 mM) and 0.3 mL pyrolysis solution were added. Ultrasound breaker (G800R3) was used to break the structure of hyphae. The supernatant was centrifuged at 4 °C, 12,000 rpm for 10 min, then taking the supernatant. The ATP level in the supernatant was assessed using the adenosine 5′-triphosphate (ATP) bioluminescent assay kit (Beyotime, S0027) and a fluorescence microplate reader (FL × 800) [18]. The experiment was repeated three times in each group.
Determination of mitochondrial membrane potential (MMP). JC-1 probe was employed to evaluate the MMP in P. capsici strain [19]. Briefly, after 48 h of culturing in PDB, hyphae continued to grow for 3 h after adding fungicides. Then the hyphae were incubated with an equal volume of serum-free medium containing JC-1 dye (5 mg/L) at 25 °C for 30 min and rinsed twice with 1% glucose solution. Finally, images were taken in the green and red fluorescence channel by fluorescence microscope imaging (Olympus CCDDP72 and Leica SP5), and the data analysis of fluorescence intensity was performed by Image J. The experiment was repeated three times in each group.
Measurement of intracellular ROS level. Intracellular ROS level was evaluated in conidia of P. capsici using the fluorescent probe 2′,7′-dichlorofluorescin diacetate (DCFH-DA) [19]. DCFH-DA is a non-fluorescent, lipophilic, and non-ionic compound capable of diffusing and crossing the cell membrane into the cytoplasm. Then DCFH−DA is deacetylated by intracellular esterases, producing 2′,7′-dichlorofluorescin (DCFH), a non-fluorescent and membrane-impermeable compound that reacts with intracellular ROS to generate a green fluorescent 2′,7′-dichlorofluorescin (DCF). Briefly, hyphae after 48 h of culture in PDB medium continued to grow for 0.5 h after adding 1 μL DCFH-DA (10 mmol). After rinsing twice with 1% glucose solution, the tested compounds were added and incubation was continued for 3 h. Finally, images were taken in the green fluorescence channel by fluorescence microscope imaging (Olympus CCDDP72), and the data analysis of fluorescence intensity was performed by Image J. The experiment was repeated three times in each group.

3. Results

Subsection

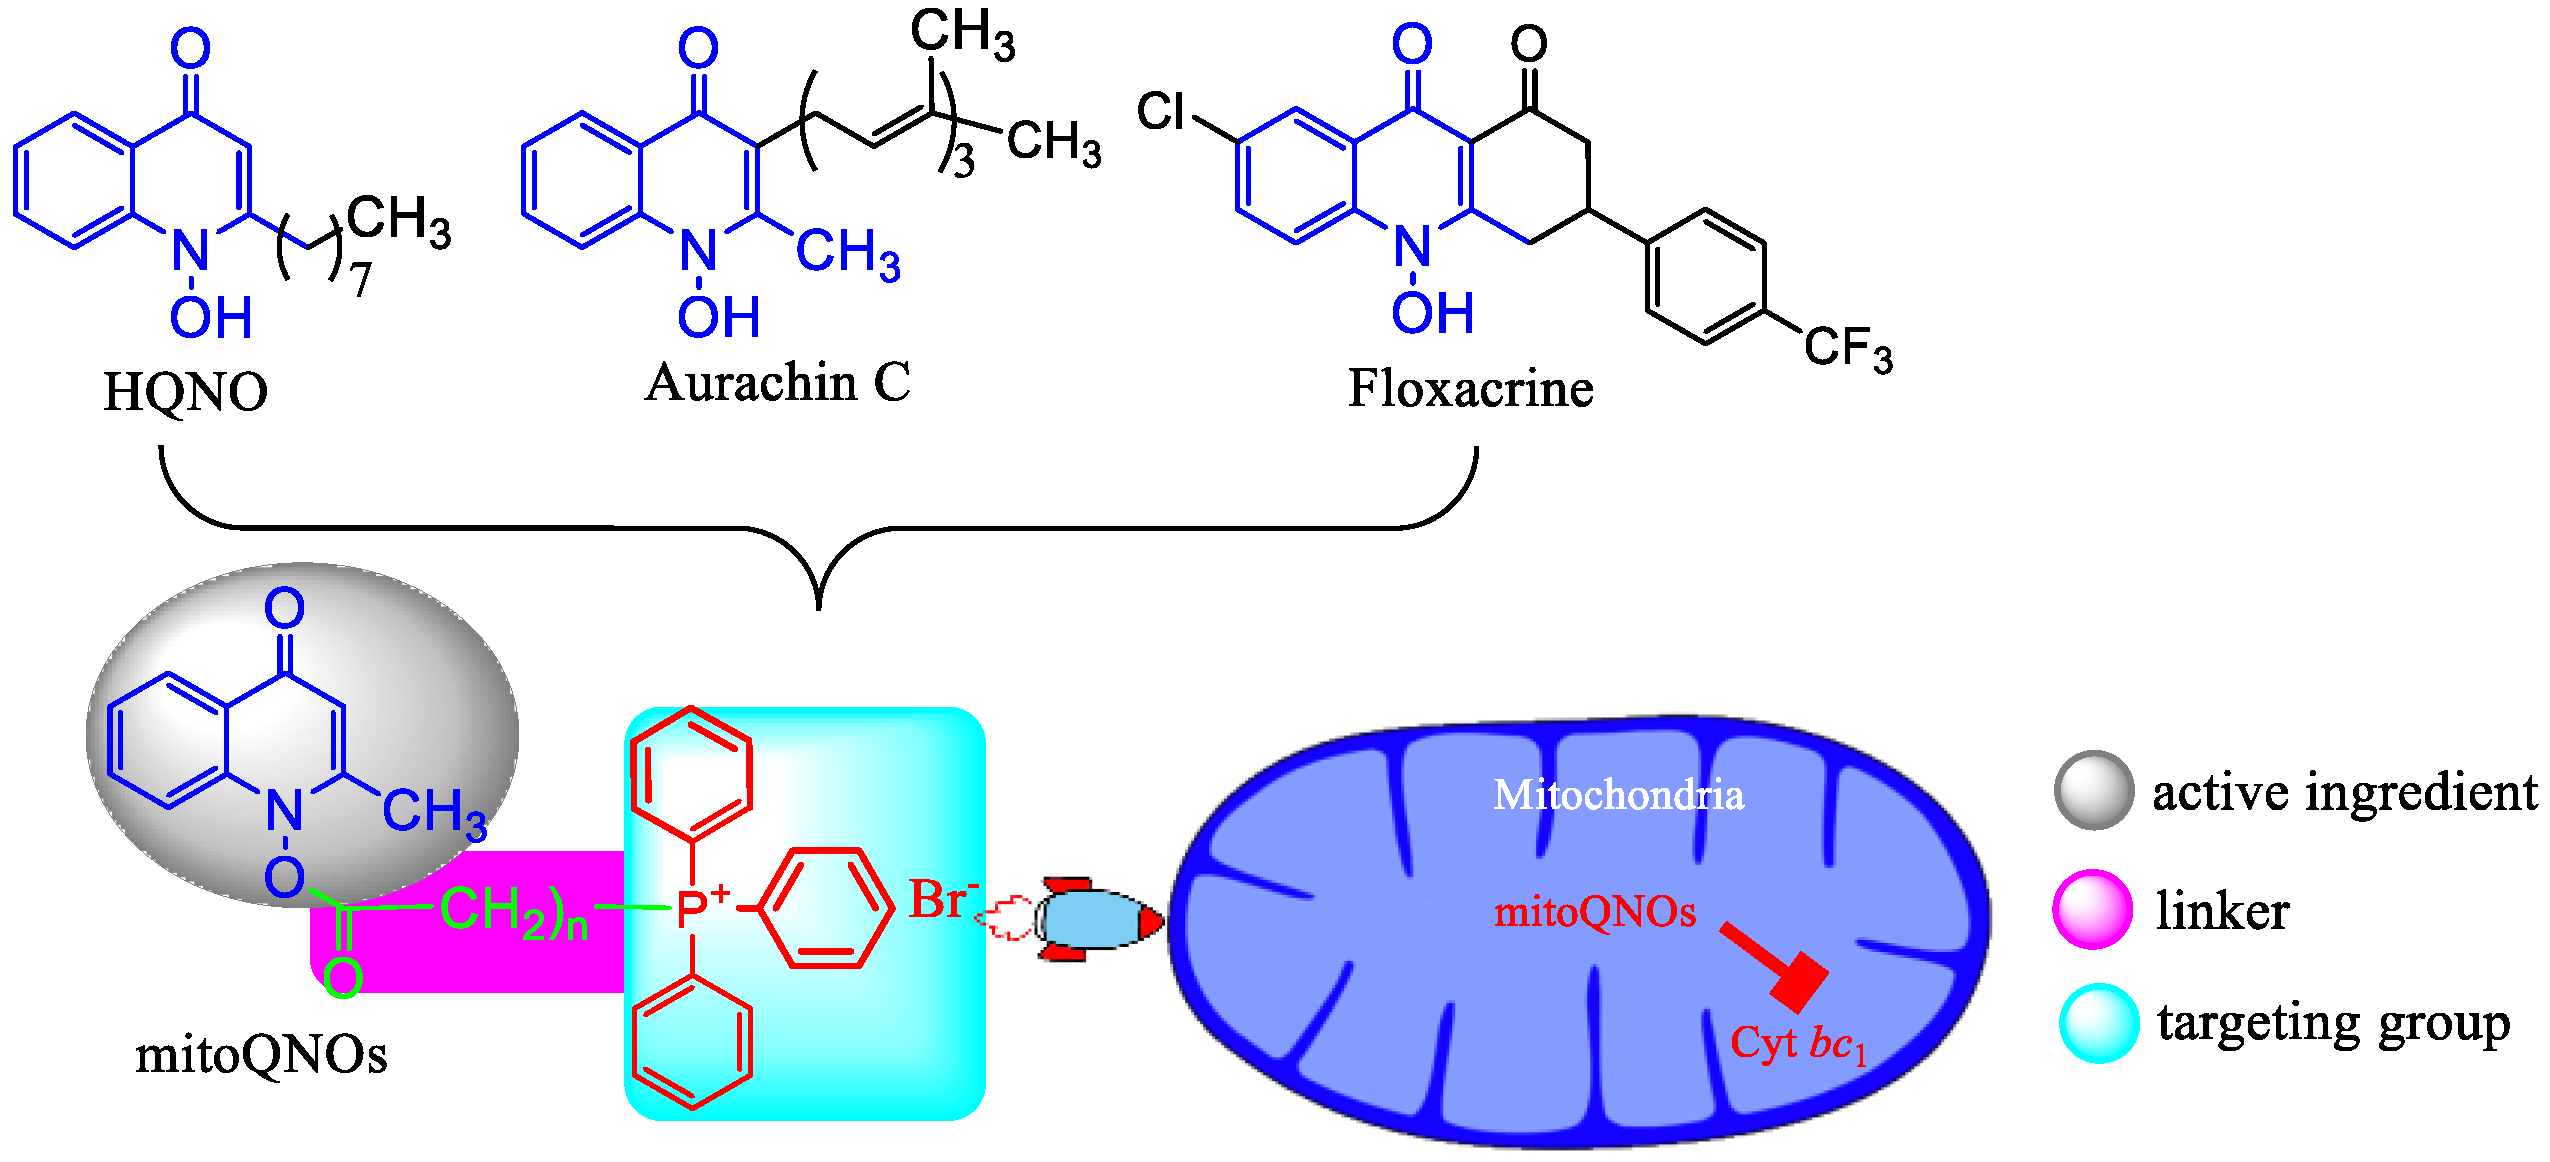
  • Chemistry. The key intermediate 2-methyl-1-hydroxy-4(1H)-quinolone (5) was prepared with a similar method described by Cross and Cornforth [20,21]. It was then acylated to give 6, which reacted with triphenylphosphine by a nucleophilic substitution to afford mitoQNOs (Scheme 1)
    Scheme 1. The synthetic pathway of mitoQNOs.
    Scheme 1. The synthetic pathway of mitoQNOs.
    Jof 09 00685 sch001
  • MitoQNO11 exhibited significantly enhanced fungicidal activity. Results concerning fungicidal activities of mitoQNOs against 11 plant pathogenic fungi, preliminarily determined at a concentration of 70 μmol, are shown in Table 1. As we previously described for SDH inhibition [15], the activity of mitoQNOs was also enhanced with the increase in chain length of the TPP-conjugated linker. For example, the inhibition rates of mitoQNO6, mitoQNO8, and mitoQNO11 against S. sclerotiorum were 19.86%, 45.44%, and 91.47%, respectively. This is mainly because of the increase in liposolubility, which makes it easier to pass through the membrane (Table 1). Meanwhile, it was also found that mitoQNO11 exhibited excellent fungicidal activity against P. aphanidermatum, P. capsica, and B. cinerea, and the inhibition rates were 75.63%, 87.50%, and 78.88%, respectively. Compared with the lead molecule MQNO, mitoQNO11 showed significantly enhanced fungicidal activity against all tested pathogenic fungi.
    Table 1. In vitro fungicidal activity of title compounds.
    Table 1. In vitro fungicidal activity of title compounds.
    Pathogen 1Inhibition Rate (70 μmol/L, %)
    MQNOMitoQNO6MitoQNO8MitoQNO11BoscalidKresoxim-Methyl
    PA15.21 ± 1.060 ± 0.590 ± 0.5175.63 ± 0.889.79 ± 1.0681.25 ± 7.14
    PC10.90 ± 0.542.70 ± 0.3129.96 ± 1.6687.5 ± 1.3217.11 ± 1.2530.19 ± 0.54
    SS14.75 ± 1.5919.86 ± 2.6345.44 ± 2.6591.47 ± 2.6895.31 ± 0.6040.32 ± 0.60
    BC13.01 ± 7.970 ± 0.590 ± 0.5978.88 ± 5.3392.05 ± 0.5930.78 ± 0.30
    BB18.10 ± 3.850 ± 0.540 ± 0.3141.67 ± 0.5954.79 ± 1.9372.08 ± 0.78
    ET2.15 ± 0.332.86 ± 0.884.73 ± 0.3324.86 ± 0.5795.32 ± 0.6626.5 ± 0.66
    CA2.95 ± 0.550 ± 0.633.61 ± 1.0919.23 ± 0.6394.65 ± 1.0950.47 ± 1.09
    FO5.18 ± 0.835.18 ± 1.146.29 ± 0.8749.58 ± 1.2638.20 ± 0.3259.39 ± 0.63
    RS5.42 ± 1.180.42 ± 0.590.42 ± 0.5945.00 ± 1.0287.08 ± 0.5972.92 ± 0.29
    PI0 ± 0.655.55 ± 1.727.15 ± 0.1515.64 ± 3.2457.36 ± 1.4963.09 ± 0.32
    CL9.35 ± 2.033.12 ± 1.486.00 ± 0.6815.83 ± 1.0240.53 ± 1.481.44 ± 1.02
    logP 20.495.656.668.164.644.13
    1. PA = Pythium aphanidermatum; PC = Phytophthora capsici; SS = Sclerotinia sclerotiorum; BC = Botrytis cinerea; BB = Botryosphaeria berengeriana; ET = Exserohilum turcicum; CA = Cercospora arachidicola Hori; FO = Fusarium oxysporum f.sp. vasinfectum; RS = Rhizoctonia solani; PI = Phytophthora infestans; CL = Colletotrichum lagenarium. 2. Calculated by Molinspiration Cheminformatics 2019.
  • In order to verify the effectiveness of mitoQNO11, we further determined its precision toxicity against four pathogenic fungi (Table 2). Compared with the selected fungicides that act on the mitochondrial respiratory chain, mitoQNO11 showed good inhibitory effects towards the four tested strains. The EC50 values for P. capsici, P. aphanidermatum, B. cinereal, and S. sclerotiorum were 7.42, 51.42, 21.73, and 4.43 μmol/L, respectively. Especially, mitoQNO11 exhibited excellent fungicidal activity against P. capsici, a pathogenic fungus causing phytophthora blight of pepper, which has become increasingly serious in recent years [22].
    Table 2. Precision toxicity of mitoQNO11 against four pathogenic fungi.
    Table 2. Precision toxicity of mitoQNO11 against four pathogenic fungi.
    CompoundEC50 (μmol/L)
    P. capsiciS. sclerotiorumB. cinereaP. aphanidermatum
    MQNO>140>140>140>140
    mitoQNO117.42 ± 0.734.43 ± 1.5121.73 ± 1.7151.42 ± 3.67
    boscalid>1400.83 ± 0.076.79 ± 0.64>140
    kresoxim-methyl>14071.41 ± 18.88>14051.56 ± 18.63
    pyrimorph3.77 ± 0.1974.33 ± 8.59>140>140
  • MitoQNO11 effectively inhibited the activity of cytochrome bc1 complex. Most of the 1-hydroxy-4-quinolone derivatives were reported as cytochrome bc1 complex inhibitors, so the effect of mitoQNO11 on bc1 complex was also investigated. As shown in Figure 2A, mitoQNO11 exhibited more effective inhibitory ability against cytochrome bc1 complex compared to pyrimorph (a potent fungicide against P. capsici mainly acting on cell wall syntheses well as on bc1 complex) [23]. The IC50 values of mitoQNO11 and pyrimorph were 3.33 and 6.89 μmol/L, respectively (Table S1). Therefore, mitoQNO11 is a highly potent inhibitor of bc1 complex, even though it might have other action mechanisms.
    Figure 2. Influences comparison of mitoQNO11 with pyrimorph on the respiration and ATP production of P. capsici. (A) Column chart depicting the inhibition rate of cytochrome bc1 complex of P. capsica. (B) Column chart depicting the respiratory inhibiting rate of P. capsica. (C) Changes of ATP content in hyphae after treatment with mitoQNO11. (D) ATP inhibitory rate of mitoQNO11 and pyrimorph. Data points correspond to the mean of three independent experiments ± standard error of the mean.
    Figure 2. Influences comparison of mitoQNO11 with pyrimorph on the respiration and ATP production of P. capsici. (A) Column chart depicting the inhibition rate of cytochrome bc1 complex of P. capsica. (B) Column chart depicting the respiratory inhibiting rate of P. capsica. (C) Changes of ATP content in hyphae after treatment with mitoQNO11. (D) ATP inhibitory rate of mitoQNO11 and pyrimorph. Data points correspond to the mean of three independent experiments ± standard error of the mean.
    Jof 09 00685 g002
  • MitoQNO11 strongly suppressed mycelium respiration. As an important part of ETC, the inhibition of the bc1 complex results in the inhibition of mitochondria respiration. Therefore, the influence of mitoQNO11 on the mycelium respiration of P. capsici was measured. As shown in Figure 2B, at a concentration of 35 μmol/L, the inhibition rate of mitoQNO11 was 4.2 times higher than that of pyrimorph, and the inhibition was dose-dependent.
  • MitoQNO11 strongly inhibited ATP generation. Inhibition of respiration implies a significant reduction in ATP synthesis by the pathogen. Therefore, we monitored the changes in cellular ATP of P. capsici after drug treatment by firefly luciferase. After three hours of treatment at a concentration of 35 μmol/L, the ATP level in the mitoQNO11 group was reduced by 50%, whereas in the pyrimorph group, it was reduced by less than 10% (Figure 2C); the inhibition was found to be dose-dependent. Even at 140 μmol/L, the ATP level in the pyrimorph group decreased by less than half, whereas the inhibition rate of mitoQNO11 reached to 85.08% after three hours of treatment at the same concentration (Figure 2D).
  • MitoQNO11 strongly reduced mitochondrial membrane potential. The integrity of the ETC function is the critical element in maintaining MMP (∆Ψm). Next, we investigated the impact of mitoQNO11 on ∆Ψm by using a cationic dye JC-1, a potent indicator of MMP changes due to the formation of red fluorescent ‘J-aggregates’.
  • The mycelium of P. capsici was treated with mitoQNO11, pyrimorph, or FCCP (a well-known uncoupler that can easily cause a reduction in mitochondrial membrane potential), respectively, at 20 μmol/L for 3 h at 25 °C, followed by staining with JC-1. As shown in Figure 3A, in the control group the granular mitochondria in hyphae emitted red fluorescence, whereas no obvious green fluorescence was observed, indicating high ∆Ψm. In the mitoQNO11 group, we observed the obvious disappearance of red fluorescence and an enhancement of green fluorescence, indicating the decrease in ∆Ψm. By analyzing its mean fluorescence intensity (Figure 3B), it was found that the intensity of red fluorescence decreased by half compared to the control group, whereas the intensity of green fluorescence was three times higher than that of the control group (Figure 3C). However, there was no decrease in red fluorescence in pyrimorph treatment group compared with the control group, and similar results were obtained by analyzing the mean fluorescence intensity. As a positive control, after treatment with FCCP, the obvious disappearance of red fluorescence and the enhancement of green fluorescence were also observed (Figure 3A,B). These results indicated that the MMP of P. capsici was strongly reduced by mitoQNO11.
    Figure 3. Effect of mitoQNO11 on mitochondrial membrane potential as monitored by JC-1 staining. JC-1 aggregates accumulate in the mitochondrial matrix with high ∆Ψm, emitting orange-red fluorescence; upon depolarization of the mitochondrial membrane, JC-1 aggregates dissipate into the cytoplasm as monomers emitting green fluorescence. (A) JC-1 staining was observed by fluorescence microscopy after treatment with mitoQNO11, pyrimorph, and FCCP at 20 μmol/L. Scale bar 50 μm. (B) Change in mean fluorescence intensity (MFI) of red fluorescence (JC-1 aggregates) after treatment with mitoQNO11, pyrimorph, and FCCP, respectively, at 20 μmol/L. (C) Change in mean fluorescence intensity of green fluorescence (JC-1 monomer) after treatment with mitoQNO11, pyrimorph, and FCCP at 20 μmol/L. Data points correspond to the mean of three independent experiments ± standard error of the mean.
    Figure 3. Effect of mitoQNO11 on mitochondrial membrane potential as monitored by JC-1 staining. JC-1 aggregates accumulate in the mitochondrial matrix with high ∆Ψm, emitting orange-red fluorescence; upon depolarization of the mitochondrial membrane, JC-1 aggregates dissipate into the cytoplasm as monomers emitting green fluorescence. (A) JC-1 staining was observed by fluorescence microscopy after treatment with mitoQNO11, pyrimorph, and FCCP at 20 μmol/L. Scale bar 50 μm. (B) Change in mean fluorescence intensity (MFI) of red fluorescence (JC-1 aggregates) after treatment with mitoQNO11, pyrimorph, and FCCP, respectively, at 20 μmol/L. (C) Change in mean fluorescence intensity of green fluorescence (JC-1 monomer) after treatment with mitoQNO11, pyrimorph, and FCCP at 20 μmol/L. Data points correspond to the mean of three independent experiments ± standard error of the mean.
    Jof 09 00685 g003
  • MitoQNO11 strongly induced ROS production. Mitochondrial dysfunction is closely related to the excessive reactive oxygen species (ROS) and the respiratory chain is the main source of ROS in eukaryote. The inhibition of the respiratory chain can lead to the disruption of oxidative stress balance. Then we examined the changes of intracellular ROS level using an oxidation-sensitive probe, 2′,7′-dichlorofluorescin diacetate (DCFH-DA).
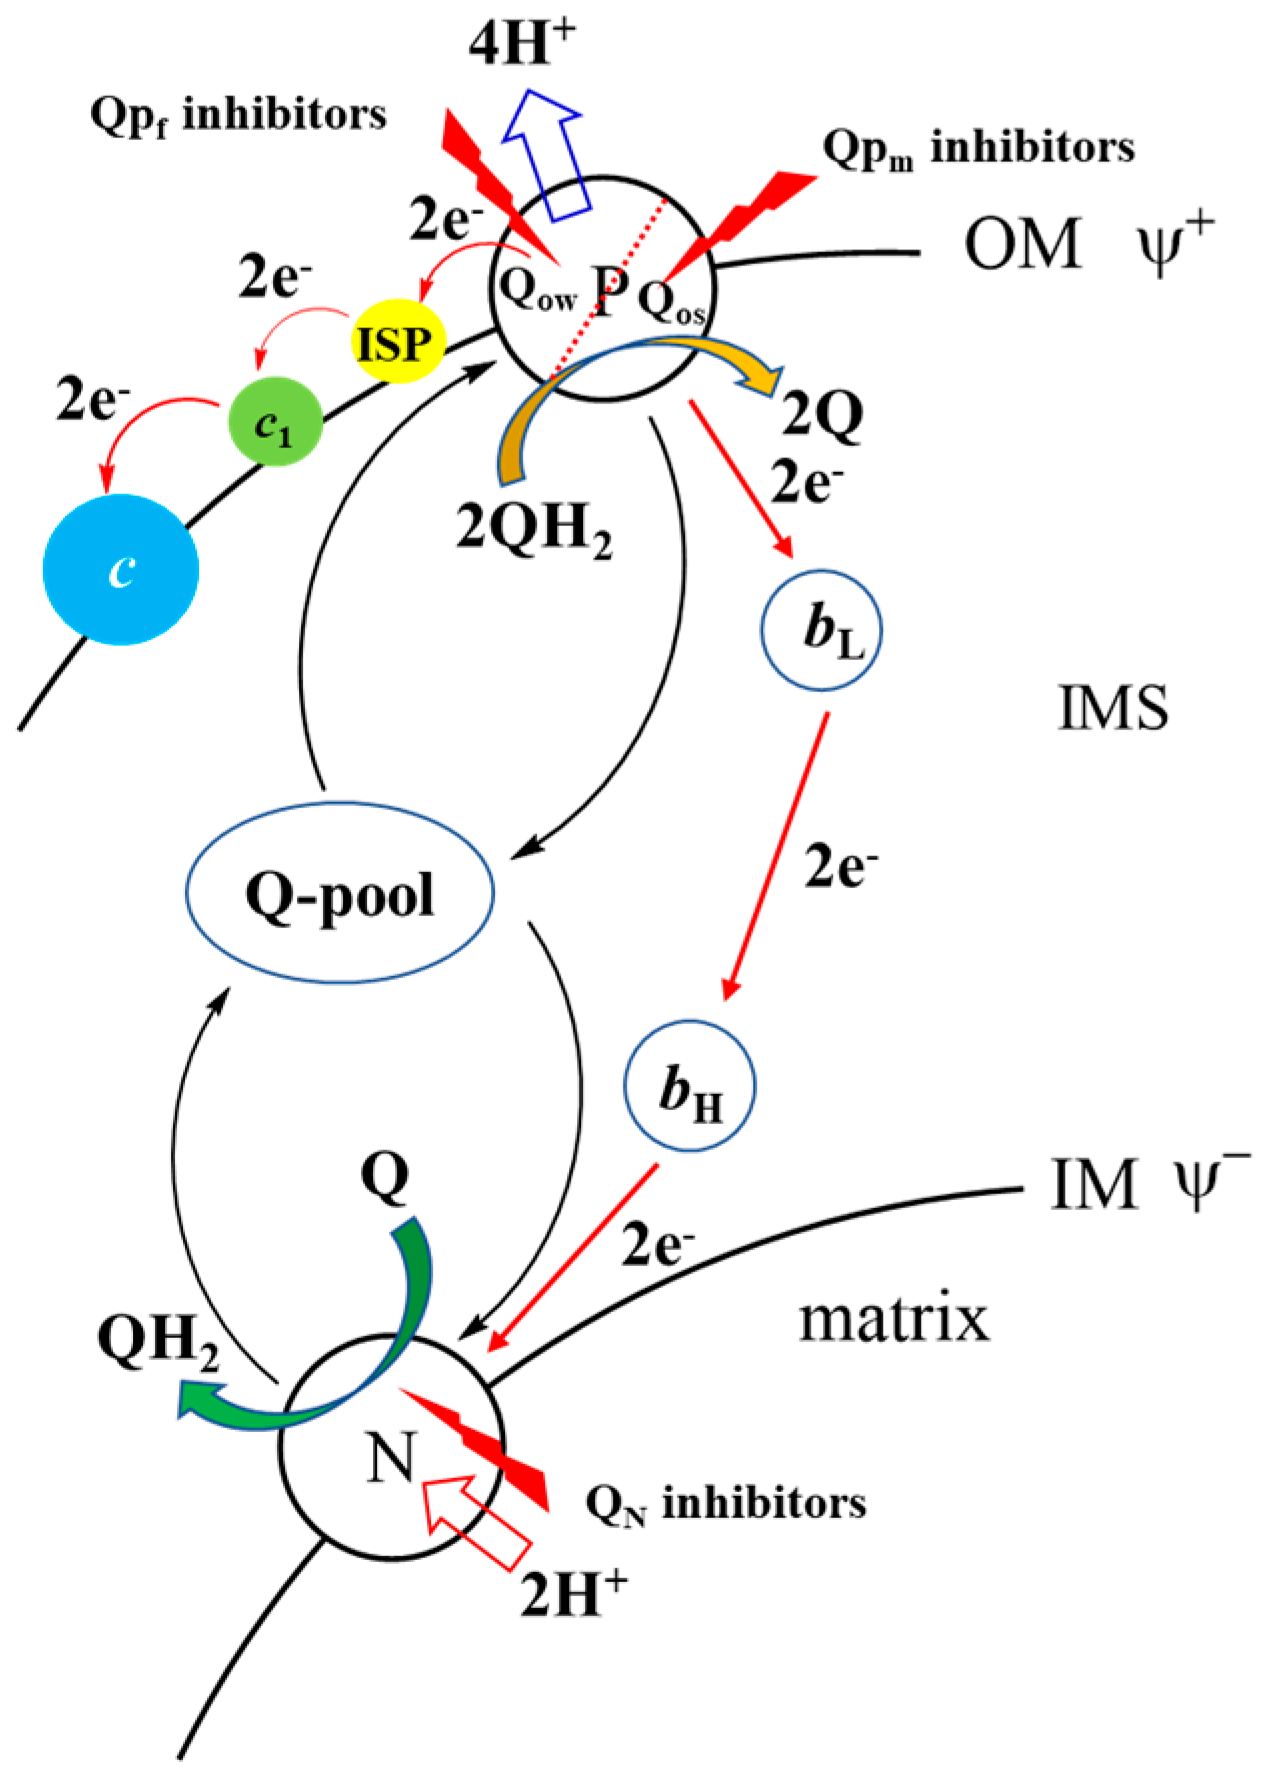
  • As shown in the control group, no fluorescence signal was observed (Figure 4). However, obvious green fluorescence was observed in the mitoQNO11 group, and we could see bright green fluorescence distributed in dots on the hyphae. In stark contrast, there was no obvious green fluorescence in the pyrimorph group. By analyzing mean fluorescence intensity, it was found that the green fluorescence intensity doubled after mitoQNO11 treatment. These observations suggested that mitoQNO11 has a strong capability to induce ROS generation in phytopathogens. Considering that the cytochrome bc1 complex is one of the main sources of mitochondrial ROS and that 1-hydroxy-4-quinolone derivatives mainly target the Qi site [24,25,26], we propose that the primary mechanism of action of mitoQNO11 is that it accumulates in mitochondria and binds to the Qi site of cytochrome bc1 complex, thus leading to the leakage of electrons differentiated from the Qo site, resulting in the production of large amounts of ROS (Figure 5).

4. Discussion

In summary, in order to remedy the defects of 1-hydroxy-4-quinolones, three derivatives of QNO termed mitoQNOs were designed and synthesized by conjugation with triphenylphosphonium. The results suggested that the fungicidal activity of mitoQNOs increased with the increase in alkyl chain length, which is consistent with the findings in TPP-driven SDHIs [15]. MitoQNO11 exhibited excellent fungicidal activity against P. capsici, P. aphanidermatum, B. cinereal, and S. sclerotiorum, which has been confirmed by further precise toxicity experiments. Extensive studies suggested that mitoQNO11 is a strong cytochrome bc1 complex inhibitor, leading to a series of subsequent effects, such as inhibition of hyphal respiration and the generation of ATP, and reduction in membrane potential. Moreover, the vast generation of ROS after treatment with mitoQNO11 was also observed. This is believed to depend on the inhibition of the Qi site which resulted in the blocking of electron transfer from the reduced cytochrome b562 to the oxidized quinone, thus leading to the accumulation of semiquinone radicals at Qo sites and causing electron leakage to generate large amounts of ROS [26,27]. Furthermore, when the cytochrome bc1 complex was inhibited, the blockage of the respiratory chain could cause the inhibition of hyphal respiration; meanwhile, the blockage of electron transfer could lead to the reduction in mitochondrial membrane potential. On the other hand, due to the coupling of the respiratory chain and oxidative phosphorylation, ATP synthesis was suppressed. All of these results confirm that targeting bioactive molecules to mitochondria by conjugating the lipophilic TPP cation represents an effective fungicidal strategy. However, despite the reasonable analysis of the experimental results, the actual mechanism of action may be much more complicated. For example, the Qi site is probably not the only site of MitoQNO11, and other active sites which use Q/QH2 as the substrate are also potential targets. In addition, the damage to the cell membrane caused by the surface effect of TPP itself should also be a concern. Therefore, to accurately describe its action mechanism, more experimental evidence is needed.

Supplementary Materials

The following supporting information can be downloaded at: https://www.mdpi.com/article/10.3390/jof9060685/s1, Figure S1: Spectra of title compounds; Table S1: IC50 value of MitoQNO11 and pyrimorph on cytochrome bc1 complex of P. capsici.

Author Contributions

J.W.: writing—original draft, methodology, writing—review and editing. X.L.: writing—original draft, methodology, writing—review and editing. F.Y.: writing—original draft, writing—review and editing. Y.X.: writing—review and editing. B.F.: writing—review and editing. J.L.: writing—review and editing. Z.Q.: writing—original draft, methodology, writing—review and editing. All authors have read and agreed to the published version of the manuscript.

Funding

This research was funded by the National Natural Science Foundation of China, grant number No. 21877125.

Institutional Review Board Statement

Not applicable.

Informed Consent Statement

Not applicable.

Data Availability Statement

Not applicable.

Conflicts of Interest

The authors declare no conflict of interest.

References

  1. Chen, H.-J. Research progress of quinolone compounds. Liaoning Chem. Ind. 2019, 48, 792–795, 799. [Google Scholar]
  2. Mohammed, H.H.; Abuo-Rahma, G.E.-D.A.; Abbas, S.; Abdelhafez, E.-S.M. Current Trends and Future Directions of Fluoroquinolones. Curr. Med. Chem. 2019, 26, 3132–3149. [Google Scholar] [CrossRef]
  3. Chu, X.-M.; Wang, C.; Liu, W.; Liang, L.-L.; Gong, K.-K.; Zhao, C.-Y.; Sun, K.-L. Quinoline and quinolone dimers and their biological activities: An overview. Eur. J. Med. Chem. 2019, 161, 101–117. [Google Scholar] [CrossRef]
  4. Refojo, P.N.; Teixeira, M.; Pereira, M.M. The alternative complex III of Rhodothermus marinus and its structural and functional association with caa3 oxygen reductase. Biochim. Biophys. Acta 2010, 1797, 1477–1482. [Google Scholar] [CrossRef] [PubMed] [Green Version]
  5. Hoefle, G.; Kunze, B. Biosynthesis of Aurachins A-L in Stigmatella aurantiaca: A Feeding Study. J. Nat. Prod. 2008, 71, 1843–1849. [Google Scholar] [CrossRef] [PubMed]
  6. Hoefnagel, M.H.N.; Wiskich, J.T.; Madgwick, S.A.; Patterson, Z.; Oettmeier, W.; Rich, P.R. New inhibitors of the ubiquinol oxidase of higher plant mitochondria. Eur. J. Biochem. 1995, 233, 531–537. [Google Scholar] [CrossRef] [PubMed]
  7. Yap, L.L.; Lin, M.T.; Ouyang, H.; Samoilova, R.I.; Dikanov, S.A.; Gennis, R.B. The quinone-binding sites of the cytochrome bo3 ubiquinol oxidase from Escherichia coli. Biochim. Biophys. Acta Bioenerg. 2010, 1797, 1924–1932. [Google Scholar] [CrossRef] [PubMed] [Green Version]
  8. Carrasco, M.P.; Gut, J.; Rodrigues, T.; Ribeiro, M.H.; Lopes, F.; Rosenthal, P.J.; Moreira, R.; dos Santos, D.J.V.A. Exploring the Molecular Basis of Qo bc1 Complex Inhibitors Activity to Find Novel Antimalarials Hits. Mol. Inform. 2013, 32, 659–670. [Google Scholar] [CrossRef]
  9. Romero, A.H. Role of Trifluoromethyl Substitution in Design of Antimalarial Quinolones: A Comprehensive Review. Top. Curr. Chem. 2019, 377, 9. [Google Scholar] [CrossRef]
  10. Liu, X.D.; Wang, D.W.; Xie, L. Correlation between quinolone uptakes by BCECs in vitro and brain-to-plasma concentration ratios in rats. Eur. J. Drug Metab. Pharmacokinet. 2005, 30, 249–254. [Google Scholar] [CrossRef] [PubMed]
  11. Ogbolu, D.O.; Daini, O.A.; Alli, A.O.T.; Webber, M.A. Reduced intracellular drug accumulation augments fluoroquinolone and β-lactam drugs resistance in clinical Gram negative bacteria from Nigeria. Afr. J. Microbiol. Res. 2015, 9, 1082–1088. [Google Scholar]
  12. Ndi, M.; Marin-Buera, L.; Salvatori, R.; Singh, A.P.; Ott, M. Biogenesis of the bc1 Complex of the Mitochondrial Respiratory Chain. J. Mol. Biol. 2018, 430, 3892–3905. [Google Scholar] [CrossRef] [PubMed]
  13. Zhao, P.; Yan, Q.; Li, X.; Zhang, M. Current status of resistance and development of strobilurin fungicide. Agrochemicals. 2011, 50, 547–551, 572. [Google Scholar]
  14. Wang, J.; Li, J.; Xiao, Y.; Fu, B.; Qin, Z. TPP-based mitocans: A potent strategy for anticancer drug design. RSC Med. Chem. 2020, 11, 858–875. [Google Scholar] [CrossRef] [PubMed]
  15. Wang, J.; Liu, X.; Zhang, X.; Du, S.; Han, X.; Li, J.-Q.; Xiao, Y.; Xu, Z.; Wu, Q.; Xu, L.; et al. Fungicidal Action of the Triphenylphosphonium-Driven Succinate Dehydrogenase Inhibitors Is Mediated by Reactive Oxygen Species and Suggests an Effective Resistance Management Strategy. J. Agric. Food Chem. 2022, 70, 111–123. [Google Scholar] [CrossRef]
  16. Hughes, J.K.; Hodge, A.; Fitter, A.H.; Atkin, O.K. Mycorrhizal respiration: Implications for global scaling relationships. Trends Plant Sci. 2008, 13, 583–588. [Google Scholar] [CrossRef]
  17. Chen, W.; Wang, P.; Lu, Y.; Jin, T.; Lei, X.; Liu, M.; Zhuang, P.; Liao, J.; Lin, Z.; Li, B.; et al. Decreased expression of mitochondrial miR-5787 contributes to chemoresistance by reprogramming glucose metabolism and inhibiting MT-CO3 translation. Theranostics 2019, 9, 5739–5754. [Google Scholar] [CrossRef]
  18. Li, Q.; Zhang, T.; Wang, J.; Zhang, Z.; Zhai, Y.; Yang, G.-Y.; Sun, X. Rapamycin attenuates mitochondrial dysfunction via activation of mitophagy in experimental ischemic stroke. Biochem. Biophys. Res. Commun. 2014, 444, 182–188. [Google Scholar] [CrossRef]
  19. Zhang, Z.-J.; Jiang, Z.-Y.; Zhu, Q.; Zhong, G.-H. Discovery of β-Carboline Oxadiazole Derivatives as Fungicidal Agents against Rice Sheath Blight. J. Agric. Food Chem. 2018, 66, 9598–9607. [Google Scholar] [CrossRef]
  20. Cornforth, J.W.; James, A.T. Structure of naturally occurring antagonist of dihydrostreptomycin. Biochem. J. 1956, 63, 124–130. [Google Scholar] [CrossRef] [PubMed] [Green Version]
  21. Cross, R.M.; Manetsch, R. Divergent Route to Access Structurally Diverse 4-Quinolones via Mono or Sequential Cross-Couplings. J. Org. Chem. 2010, 75, 8654–8657. [Google Scholar] [CrossRef] [PubMed]
  22. Chen, F.-J.; Long, X.-H.; Li, E.-Z. Evaluation of antifungal phenolics from Helianthus tuberosus L. leaves against Phytophthora capsici Leonian by chemometric analysis. Molecules 2019, 24, 4300. [Google Scholar] [CrossRef] [PubMed] [Green Version]
  23. Xiao, Y.-M.; Esser, L.; Zhou, F.; Li, C.; Zhou, Y.-H.; Yu, C.-A.; Qin, Z.-H.; Xia, D. Studies on inhibition of respiratory cytochrome bc1 complex by the fungicide pyrimorph suggest a novel inhibitory mechanism. PLoS ONE 2014, 9, e93765. [Google Scholar] [CrossRef] [Green Version]
  24. Cooley, J.W.; Ohnishi, T.; Daldal, F. Binding dynamics at the quinone reduction (Qi) site influence the equilibrium interactions of the iron sulfur protein and hydroquinone oxidation (Qo) site of the cytochrome bc1 complex. Biochemistry 2005, 44, 10520–10532. [Google Scholar] [CrossRef] [Green Version]
  25. David Hong, W.; Leung, S.C.; Amporndanai, K.; Davies, J.; Priestley, R.S.; Nixon, G.L.; Berry, N.G.; Samar Hasnain, S.; Antonyuk, S.; Ward, S.A.; et al. Potent Antimalarial 2-Pyrazolyl Quinolone bc1 (Qi) Inhibitors with Improved Drug-Like Properties. ACS Med. Chem. Lett. 2018, 9, 1205–1210. [Google Scholar] [CrossRef]
  26. Thierbach, S.; Birmes, F.S.; Letzel, M.C.; Hennecke, U.; Fetzner, S. Chemical Modification and Detoxification of the Pseudomonas aeruginosa Toxin 2-Heptyl-4-hydroxyquinoline N-Oxide by Environmental and Pathogenic Bacteria. ACS Chem. Biol. 2017, 12, 2305–2312. [Google Scholar] [CrossRef]
  27. Kowaltowski, A.J.; de Souza-Pinto, N.C.; Castilho, R.F.; Vercesi, A.E. Mitochondria and reactive oxygen species. Free Radical Biol. Med. 2009, 47, 333–343. [Google Scholar] [CrossRef] [PubMed]
Figure 1. Design strategy of mitoQNOs.
Jof 09 00685 g001
Figure 4. Effect of MitoQNO11 on ROS was monitored by DCFH-DA staining and observed by fluorescence microscopy after treatment with 20 μmol/L MitoQNO11 or 20 μmol/L pyrimorph for 3 h at 25 °C. Scale bar, 50 μm. MFI: mean fluorescence intensity. Data points correspond to the mean of three independent experiments ± standard error of the mean.
Jof 09 00685 g004
Figure 5. Schematic diagram of working principle of Complex III and targeting site of inhibitors.
Jof 09 00685 g005
Disclaimer/Publisher’s Note: The statements, opinions and data contained in all publications are solely those of the individual author(s) and contributor(s) and not of MDPI and/or the editor(s). MDPI and/or the editor(s) disclaim responsibility for any injury to people or property resulting from any ideas, methods, instructions or products referred to in the content.

