Article

The Effect of Dekkera bruxellensis Concentration and Inoculation Time on Biochemical Changes and Cellulose Biosynthesis by Komagataeibacter intermedius

by
Putu Virgina Partha Devanthi
1,*,
Ferren Pratama
1,
Katherine Kho
1,
Mohammad J. Taherzadeh
2 and
Solmaz Aslanzadeh
1,*
1
Indonesia International Institute for Life Sciences, Pulomas Barat Kavling 88, Jakarta 13210, Indonesia
2
Swedish Centre for Resource Recovery, University of Borås, 50190 Borås, Sweden
*
Authors to whom correspondence should be addressed.
J. Fungi 2022, 8(11), 1206; https://doi.org/10.3390/jof8111206
Submission received: 20 October 2022 / Revised: 3 November 2022 / Accepted: 11 November 2022 / Published: 15 November 2022

Abstract

:
Bacterial Cellulose (BC) is a biopolymer with numerous applications. The growth of BC-producing bacteria, Komagataeibacter intermedius, could be stimulated by Dekkera bruxellensis, however, the effect on BC yield needs further investigation. This study investigates BC production and biochemical changes in the K. intermedius-D. bruxellensis co-culture system. D. bruxellensis was introduced at various concentrations (103 and 106 CFU/mL) and inoculation times (days 0 and 3). BC yield was ~24% lower when D. bruxellensis was added at 103 CFU/mL compared to K. intermedius alone (0.63 ± 0.11 g/L). The lowest BC yield was observed when 103 CFU/mL yeast was added on day 0, which could be compromised by higher gluconic acid production (10.08 g/L). In contrast, BC yields increased by ~88% when 106 CFU/mL D. bruxellensis was added, regardless of inoculation time. High BC yield might correlate with faster sugar consumption or increased ethanol production when 106 CFU/mL D. bruxellensis was added on day 0. These results suggest that cell concentration and inoculation time have crucial impacts on species interactions in the co-culture system and product yield.

1. Introduction

Bacterial cellulose (BC) refers to the biomaterial of glucose monomers produced by bacteria [1]. Cellulose is mainly obtained from plants. However, BC was reported to possess attractive properties, including higher purity, crystallinity, tensile strength, water-holding capacity, thermal stability and malleability [2,3]. Hence, BC is used for different applications, such as wound healing, drug delivery, as potential electric capacitors, and as a food additive [1,2].
The bacteria genus Komagataeibacter is well known for its ability to produce BC [4]. This genus is also abundant during the production of kombucha, a fermented sweetened tea, where they also form BC [5]. However, kombucha is not produced by the bacteria alone but with the co-culture of various yeasts species [5]. It is believed that the yeasts break down sucrose to glucose and fructose, while the bacteria utilize it to form BC and carboxylic acids [4,6]. In addition, yeasts can also produce ethanol, which was reported to increase BC production and reduce the presence of non-BC producing bacteria [7,8]. Lastly, the bacteria can convert the ethanol to acetic acid, which has also been found to increase BC yield [9]. Due to the ability to increase the amount of reducing sugars and advantageous metabolites, it is, therefore, likely that the presence of yeasts can potentially promote BC production.
Komagataeibacter intermedius is one of the BC-producing bacteria found in kombucha and was isolated in a previous study [10]. K. intermedius was reported to produce more BC than Komagataeibacter xylinus, the model BC producer [11,12,13]. K. intermedius also produced a high BC yield in sugarcane molasses, a cheap alternative to current commercial media for BC production [10,14]. Additionally, it was also found that the survival rate of K. intermedius increased in the presence of a kombucha isolated yeast, D. bruxellensis; however, BC production in a co-culture required improvement [10]. This result indicates the synergism of the yeast and the bacteria, and further optimization of yeast inoculation is required to achieve a higher BC yield.
Besides the effects of using a co-culture, the concentration of the yeast and the time of addition have also been found to influence not only the co-culture interactions but also the end product’s characteristics. In kombucha, for example, it was reported that a lower yeast concentration increased the amount of glucuronic acid and gluconic acid produced by Gluconacetobacter intermedius [15,16]. Furthermore, adding yeast sequentially has also been reported to impact the properties of other kinds of fermented products. For instance, in sour beer, adding yeast sequentially resulted in a higher yield of lactic acid [17]. In soy sauce, sequentially adding of Zygosaccharomyces rouxii increased the alcohol and ketone content during soy sauce fermentation and prolonged the bacteria’s survival rate [18]. Yet, there has not been any research on the effect of different concentrations of yeast or sequential addition with an emphasis on BC production.
Therefore, this study aimed to investigate the effect of different concentrations of D. bruxellensis added simultaneously and sequentially to the cultivation medium inoculated with K. intermedius. The effect of yeast was analyzed by observing the microbial growth, the BC yield, and metabolites, including ethanol, free amino nitrogen, gluconic and glucuronic acid concentration during the cultivation.

2. Materials and Methods

2.1. Materials

K. intermedius and D. bruxellensis culture used in this study were previously isolated by Devanthi et al. [10] and were stored in 1.5 mL of 20% glycerol solution at −80 °C until use. PT Andalan Furnindo, Indonesia, supplied molasses with brown/black color, containing 77.6% Brix, 46.9% sucrose, 50.8% inverted sugar, 1.4% specific gravity and 60.8% purity. Pure caffeine (PureBulk, Roseburg, OR, USA) was purchased from the local market in Jakarta. The pH of molasses was maintained by adding an acetate buffer prepared using acetic acid (Merck, Darmstadt, Germany) and sodium acetate (Merck, Darmstadt, Germany). Microbiological growth media used were Potato Dextrose Broth (PDB) and Potato Dextrose Agar (PDA) (HiMedia, Mumbai, India) and Hestrin Schramm (HS) comprised of 20 g/L glucose, 5 g/L peptone, 5 g/L yeast extract, 2.7 g/L Na2HPO4, and 1.15 g/L citric acid. For cell enumeration, the bacteria and yeast growth were controlled by supplementing the agar media with acetic acid (Merck, Darmstadt, Germany) and NaCl (Merck, Darmstadt, Germany), respectively.

2.2. Methods

2.2.1. Media and Culture Preparation

K. intermedius and D. bruxellensis cultures were prepared by culturing the frozen stock on HS agar and PDA, respectively, for 5 days at 30 °C. Then, a loopful of each microbe was transferred to 100 mL of the respective broth media and incubated for 24 h at 30 °C under static conditions. K. intermedius cell concentration was adjusted to ~106 CFU/mL. In order to evaluate the effect of D. bruxellensis concentration on BC production, the cell concentrations were adjusted to ~106 CFU/mL and ~103 CFU/mL. The cell concentration for both K. intermedius and D. bruxellensis was adjusted based on the standard curve (OD vs. CFU/mL) generated prior to the experiment. Cultivation media was prepared by dissolving 150 g/L of sugarcane molasses and 500 mg/L of caffeine into acetate buffer (pH 4.75, 0.2 M).

2.2.2. BC Production Set Up

BC production was carried out using 6-well plates. Each well consisted of 9 mL cultivation media inoculated with 1 ml of inoculum. As shown in Table 1, the inoculum contained K. intermedius and D. bruxellensis either in monoculture (B-control and Y-control, respectively) or co-cultures (BYH0, BYL0, BYH3, and BYL3). The concentration of K. intermedius was fixed at ~106 CFU/mL in all samples. Meanwhile, D. bruxellensis concentration was varied; ~106 CFU/mL in Y-Control, BYH0 and BYH3 and ~103 CFU/mL in BYL0 and BYL3. D. bruxellensis was added simultaneously on day 0 in BYH0 and BYL0 or sequentially on day 3 in BYH3 and BYL3. All samples were incubated in a static condition at 30 °C for 14 days. Samples were taken on days 0, 3, 7 and 14. For the sequential culture, extra samples were also collected on day 5. All experiments were conducted in triplicate and were subjected to bacteria and yeast enumeration, as well as pH, sugars, acids, ethanol, and free amino nitrogen analyses.

2.2.3. K. intermedius and D. bruxellensis Cell Enumeration

K. intermedius and D. bruxellensis enumeration was carried out by collecting 0.1 mL of the cultivation broth on each sampling day. The samples were then serially diluted up to 10−8 using 0.85% NaCl solution and were plated on HS agar supplemented with 1% v/v acetic acid and PDA with 2% w/v NaCl for K. intermedius and D. bruxellensis, respectively. A previous study demonstrated that the addition of 2% w/v NaCl or 1% v/v acetic acid was able to inhibit the growth of either K. intermedius or D. bruxellensis, respectively, which allowed the observation of each microbe from the co-culture [19]. The colonies were enumerated after 3 days of incubation at 30 °C.
Specific growth rate μ (h−1) were calculated by Equation (1) [20]:
μ = ln ( X 0 X t ) t t 0
where
Xt and X0 are the microbial population (CFU mL−1) at t and initial time, respectively;
t and t0 are the t and initial time when the sample is measured, respectively;
μ is specific growth rate (1 h−1).

2.2.4. Biochemical Analysis

Changes in pH during the cultivation were monitored using a pH meter (ST300, OHAUS, Parsippany, NJ, USA). Prior to biochemical analysis, samples were centrifuged at 1000× g for 10 min at room temperature. Then, the supernatant was collected into a new tube, and the process was repeated until no pellet was visually observed. Sugars (glucose and fructose) were measured using the K-SUFRG kit, ethanol was measured using K-ETOH kit, and acids (gluconic and glucuronic acids) were measured using K-GATE and K-URONIC kits (Megazyme, International Ireland Ltd., Bray, Ireland), according to the manufacturer’s instructions.
Free amino nitrogen (FAN) concentration was measured using the ninhydrin analysis method [21]. The ninhydrin color reagent consisted of 0.3 g fructose, 6 g KH2PO4, 10 g Na2HPO4 and 0.5 g ninhydrin dissolved in 100 mL of distilled water. A solution mixture was prepared by dissolving 2 g of potassium iodide into 600 mL of distilled water and 400 mL of 96% ethanol. The samples were first diluted 50 times using distilled water. Then, 2 mL of the diluted sample was mixed with 1 mL of the ninhydrin color reagent. The mixture was boiled for 16 minutes and left to cool down to room temperature using an ice bath for 20 min. Afterwards, 5 mL of the previously prepared solution mixture was added to each sample, and the absorbance was measured at 570 nm.

2.2.5. BC Yield Measurement

After 14 days of incubation, BC formed on the surface of the medium were collected and rinsed in distilled water until no excess media remained on the pellicle. The BC samples were then treated using 1 M NaOH at 80 °C for at least an hour to remove the remaining microbes and leftover broth. The treated samples were then rinsed in distilled water to remove the NaOH before being oven dried at 60 °C overnight until a stable weight was achieved. The dried BC weight was measured using an analytical balance, and the BC yield was reported as gram dry weight per liter of culture volume (g/L).

2.2.6. Statistical Analysis

The data were analyzed using R studio program [22] for one-way analysis of variance (ANOVA). One-way ANOVA followed by Tukey HSD test were carried out to investigate if the presence of yeast in each sample had any effect on the final BC yield and glucuronic acid concentration. A two-way ANOVA was also done on BC yield to investigate the interaction effects between the yeast concentration and inoculation time. The effect was considered statistically significant if the p-value was less than or equal to the selected significance level (p-values < 0.05).

3. Results and Discussion

3.1. Effect of D. bruxellensis Concentration and Inoculation Time on Bacteria-Yeast Interactions

In kombucha, yeasts are hypothesized to support bacteria by breaking down sucrose or providing ethanol as an additional carbon source [7]. Bacteria-yeast co-cultures in kefir and sourdough bread were also known to support each other by producing other essential nutrients, such as vitamin B6 and amino acids [23,24]. However, other studies reported that depending on the initial cell ratio, a microbe can outcompete the other by depleting the available nutrients or producing inhibitory compounds [25,26]. Furthermore, adding yeast sequentially can also impact bacterial fermentation, which has been observed in sour beer and soy sauce [17,18]. Therefore, K. intermedius productivity may also be affected by the cell ratio and inoculation time of D. bruxellensis.
As shown in Figure 1, K. intermedius in all samples had a similar specific growth rate (~0.374 h−1), indicating that the D. bruxellensis may not be antagonistic. Furthermore, K. intermedius in samples with D. bruxellensis added sequentially (BYH3 and BYL3) were also able to maintain a high concentration up to day 5 of the experiment. However, similar to B-control, K. intermedius in BYH3 and BYL3 also had no observable growth by the end of cultivation. On the other hand, samples with simultaneous addition of D. bruxellensis had a high concentration of K. intermedius up to day 7 and had observed bacterial growth until the end of cultivation, with 6.14 ± 0.28 log CFU/mL in BYH0 and 3.01 ± 0.54 log CFU/mL in BYL0. The simultaneous addition of D. bruxellensis may have provided the K. intermedius with more resources, such as amino acids and ethanol, which allowed K. intermedius to survive for an extended time [6,8].
D. bruxellensis population in yeast mono (Y-control) and co-cultures was also monitored. The initial counts of D. bruxellensis were lower by 1 log CFU/mL than the adjusted goal, which could be attributed to the accuracy of OD to log CFU/mL conversion, resulting from variations in yeast’s physiological state and ability to grow on the agar. Then, adding the inoculum into the fermentation media would further dilute the cell concentration.
D. bruxellensis in Y-control and BYH0 were observed to grow at a similar rate reaching a final concentration of ~8 log CFU/mL by day 14 (Figure 2). While D. bruxellensis in BYL0 experienced a significantly slower initial growth, it grew to the same concentration as Y-control and BYH0 by day 7. Samples with the sequential addition of D. bruxellensis grew even slower. BYH3 experienced an initial decrease before fluctuating at approximately 5 log CFU/mL until the end of cultivation, while no growth of D. bruxellensis could be observed throughout incubation in BYL3. This suggests that adding D. bruxellensis at the later stage (on day 3), especially at a lower concentration, could be unfavorable for yeast. By that time, K. intermedius almost enters the stationary phase (Figure 1), leaving less resources available and more harmful inhibitory compounds, such as acetaldehyde [27,28], creating a hostile environment for D. bruxellensis.

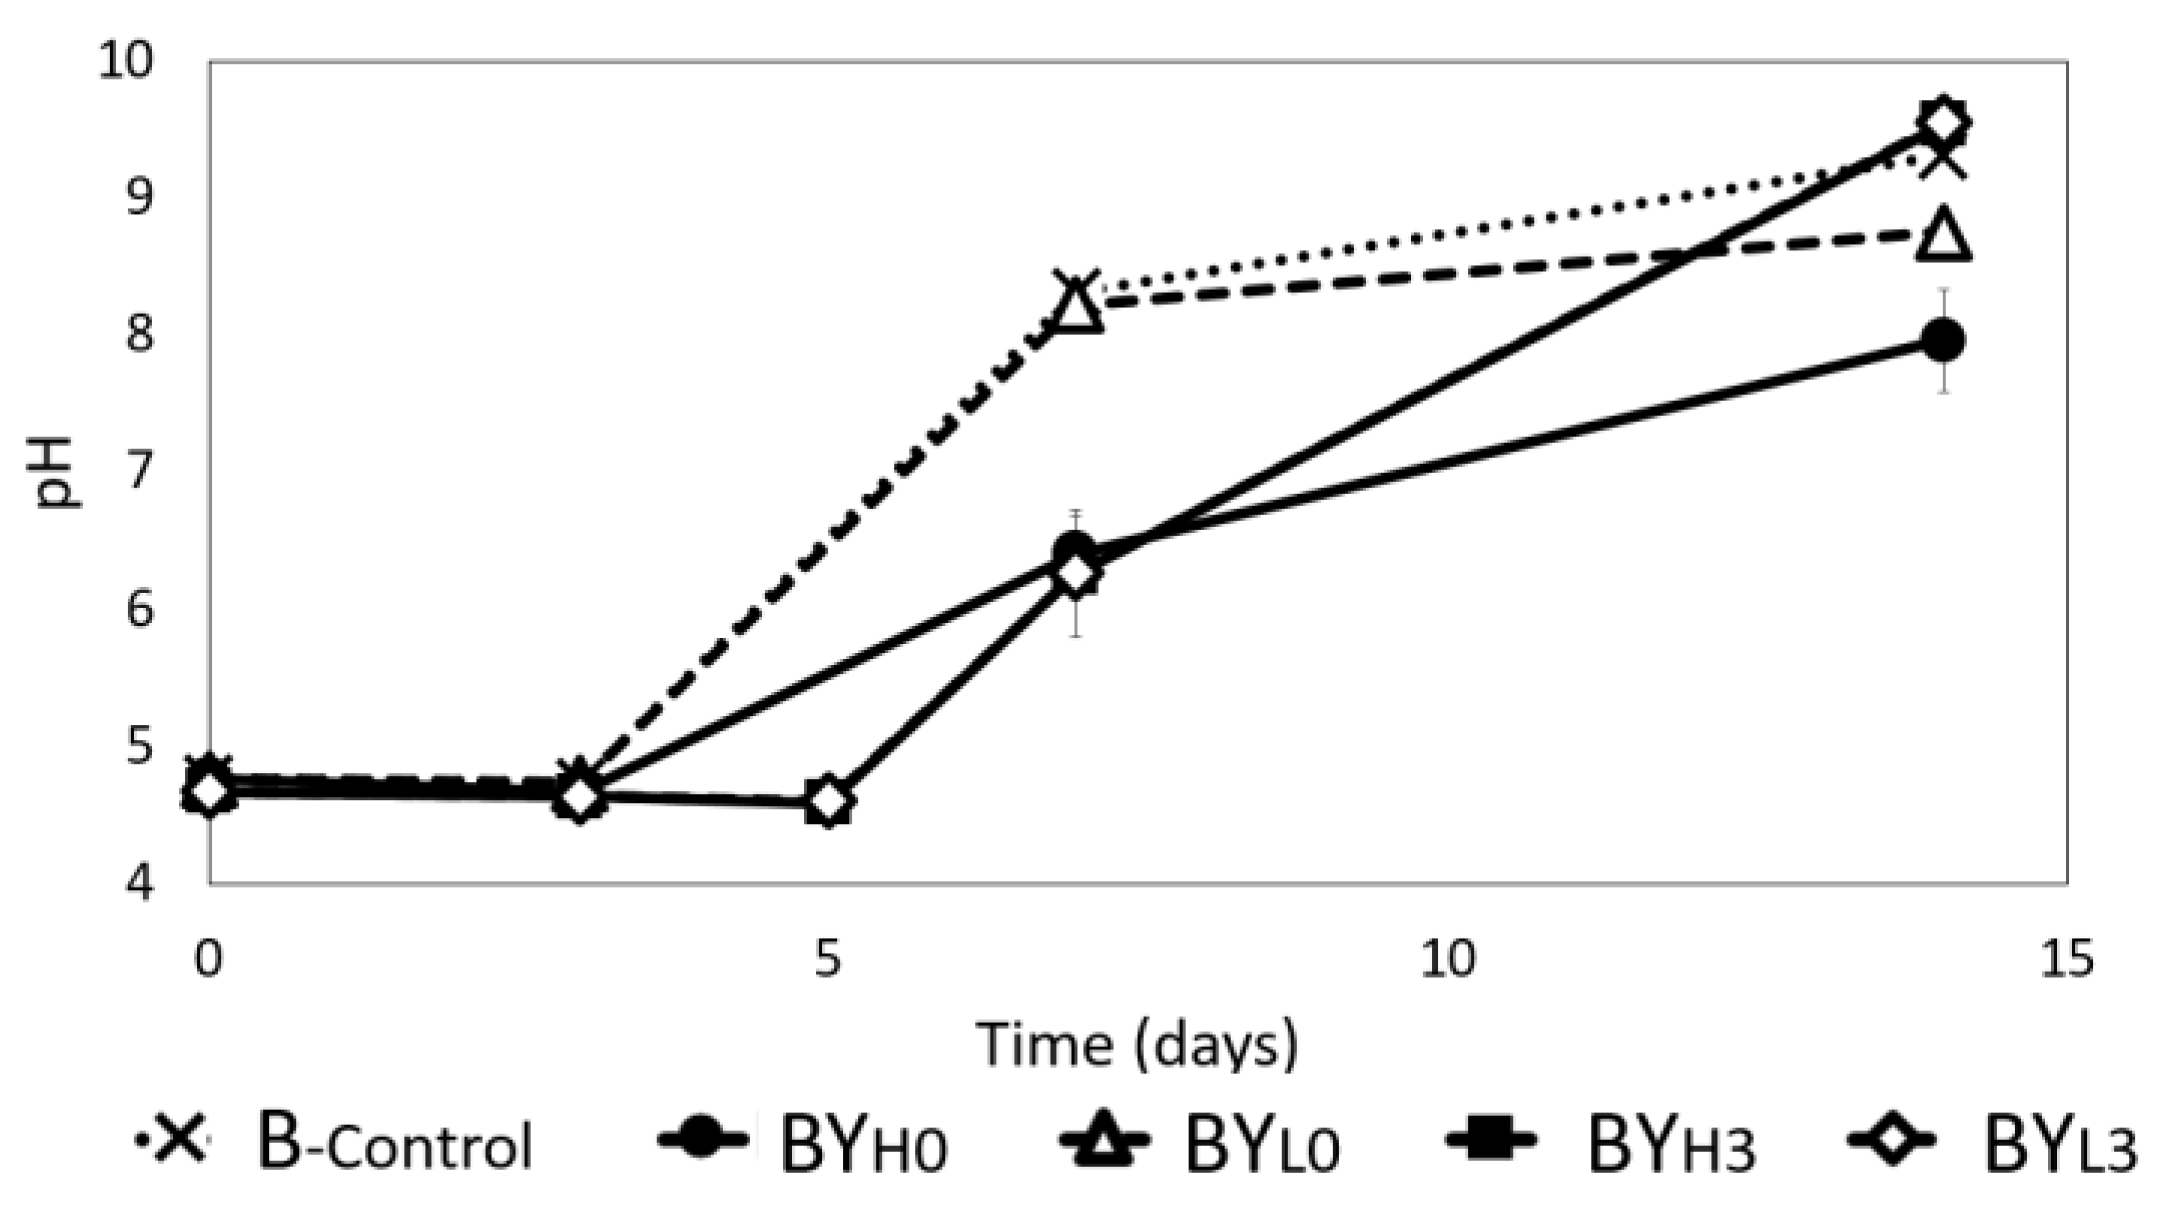
3.2. Effect of D. bruxellensis Concentration and Inoculation Time on pH Changes

Komagataeibacter are well known for producing gluconic, glucuronic, and acetic acids [5]. D. bruxellensis is also known to produce acetic acid [29]. The accumulation of acids during cultivation may impact the pH, affecting their growth and eventually the BC production. BC production can be inhibited when the pH is outside of the bacteria’s optimum range [30]. Therefore, the pH of the media was monitored throughout the incubation. It was found that the pH of all samples increased to a final pH of at least 8, which was consistent with the previous work [10]. Such an increasing pH trend was rarely observed in acetic acid bacteria fermentation, which is more likely to cause pH reduction due to organic acid production [5,31]. Previous work reported that the pH increase was associated with the presence of acetate buffer in the medium [10,32]. Furthermore, ammonia production by K. intermedius might have also contributed to the pH increase, which is further discussed in Section 3.6. The ability of K. intermedius to produce BC at a pH of 9 has been previously reported [10,11]. Although the optimal pH for BC production is typically slightly acidic, different strains have also been found to prefer more alkaline conditions [30,33].
Even though the pH in all samples increased, the rate of the increase seemed to be dependent on the concentration and inoculation time of D. bruxellensis (Figure 3). In B-control, the pH started to increase from day 3 to a final pH of 9.31 ± 0.02. The pH in samples with simultaneous addition of D. bruxellensis also experienced an increase from day 3, but at a slower rate. BYH0 obtained the lowest final pH among all samples (7.96 ± 0.31), followed by BYL0 (8.75 ± 0.1). In samples with the sequential addition of D. bruxellensis, the pH only increased after day 5 but resulted in a similar final pH as B-control.

3.3. Effect of D. bruxellensis Concentration and Inoculation Time on Sugar Concentration during Co-Culture with K. intermedius

Bacteria typically produce BC and other acids from glucose; hence, the production of both relies on the amount of available sugars. Yeasts may provide more glucose by breaking down available sucrose, but they can also potentially outcompete bacteria and consume the reducing sugars instead [7]. Therefore, the amount of reducing sugars was measured throughout the incubation to detect any competition for sugar when D. bruxellensis was added at a lower concentration or added sequentially.
Figure 4 shows that K. intermedius in B-control prefers glucose, with 90% consumed by day 7 of the incubation, while fructose concentration remains constant until day 14 (Figure 4A,B). Similarly, BYH0 experienced the same trend for glucose consumption with approximately 90% of the sugar consumed by day 7. Meanwhile, the glucose consumption rate in BYL0 was slower, with the same amount of sugar consumed by day 14. It was also found that BYH0 and BYL0 utilized fructose as well. When D. bruxellensis was added sequentially (BYH3 and BYL3), an increase in glucose concentration was observed by day 5. By the end of the incubation, BYH3 used up roughly 82% of the glucose, while BYL3 consumed the least amount (~70%). The fructose in both samples showed a slight increase by the end of incubation, which indicates that the D. bruxellensis may also only utilize fructose when glucose is unavailable.
Other studies have reported that K. intermedius could utilize fructose, although they still primarily prefer glucose [14,34]. It is also noted that different strains of Komagataeibacter may prefer different kinds of sugars [35]. In another study it was demonstrated that the co-culture consume the total sugars at a higher rate than bacterial monoculture [10]. Therefore, total sugars may be used more quickly especially when the yeast is added simultaneously [36].

3.4. Effect of D. bruxellensis Concentration and Inoculation Time on Gluconic and Glucuronic Acid Production by K. intermedius

Gluconic and glucuronic acid are commonly found during kombucha fermentation and result from the oxidation of glucose’s 1st and 6th carbon [5,37]. In kombucha, the yeast has been observed to stimulate acid production by acetic acid bacteria, either by providing more readily available carbon sources or by producing other beneficial nutrients [5,6]. However, increased acid production may impact BC production by using more glucose or acidifying the environment [30]. Hence, gluconic and glucuronic acid production were detected in K. intermedius monoculture and co-cultures.
As shown in Figure 5, the gluconic acid concentration in all samples peaked by day 5 and then declined toward the end of the incubation period. The production followed by consumption of gluconic acid has been noted in other studies in Acetobacter xylinum NUST4.2 and Komagataeibacter hansenii [31,38]. While B-control peaked by day 5 at 8.45 ± 0.45 g/L, both co-cultures with simultaneous addition of yeast peaked earlier at day 3. However, BYH0 peaked with 16% less gluconic acid, while BYL0 produced 20% more gluconic acid than B-control. Similar results were also found in another study where a lower yeast ratio in Starmerella davenportii (yeast)-Gluconacetobacter intermedius (bacteria) co-culture produced thrice the amount of gluconic acid compared to bacteria monoculture due to more glucose produced from sucrose breakdown [6,16]. However, samples with D. bruxellensis added sequentially had a lower gluconic acid production rate and yield than B-control but more sugars remaining (Figure 4). The higher production rate in BYH0 and BYL0 could be due to D. bruxellensis being more competitive forcing K. intermedius to produce acids or perhaps the metabolites produced by D. bruxellensis could stimulate acid production, as its presence has been found to correlate with higher acid production in kombucha [6,39].
K. intermedius in monoculture (B-control) produced 22.9 ± 1.39 mg/L of glucuronic acid by the end of incubation. Most co-cultures, however, obtained a higher concentration (Figure 6). Regardless of inoculation time, samples with a high concentration of D. bruxellensis produced approximately 30 mg/L. On the other hand, adding a low concentration of D. bruxellensis on day 0 (BYL0) gave the highest concentration (35.5 ± 0.29 mg/L), while adding the yeast on day 3 (BYL3) showed the lowest concentration (14.5 ± 2.05 mg/L). Previous studies on co-culture have shown that the presence of D. bruxellensis in general is able to promote glucuronic acid production by Gluconacetobacter intermedius [15]. The higher yield could either be due to D. bruxellensis providing more glucose from sucrose breakdown or by producing acetic acid, which can inhibit glycolysis in G. intermedius and therefore stimulate glucuronate synthesis [15]. Furthermore, the optimal ratio of D. bruxellensis to G. intermedius was 4:6, similar to the inoculum condition of BYL0 [15].

3.5. Effect of D. bruxellensis Concentration and Inoculation Time on Ethanol Production

Ethanol is known to improve BC synthesis as an additional energy source allowing glucose to be used mainly for BC production only [9]. Ethanol is also an alternative carbon source used by acetic acid bacteria [24]. In previous studies, D. bruxellensis isolated from kombucha has been shown to produce a high amount of ethanol [8]. Therefore, the ethanol production by D. bruxellensis during co-culture with K. intermedius was observed. The results confirm the previous studies as the ethanol production increased over time and peaked by day 14 (Figure 7). By day 14, Y-Control showed the highest final concentration with 6952 ± 923 mg/L (data not shown) followed by BYH0 with 1235 ± 256 mg/L, while BYL0 showed considerably lower concentration and produced only 105 ± 9 mg/L by the end of the incubation. Samples with D. bruxellensis added sequentially resulted in a lower final ethanol concentration, producing 19 ± 1.4 mg/L in BYH3 and a negligible amount in BYL3, which corresponds to the yeast’s undetectable growth (Figure 2). This finding indicates that inoculating D. bruxellensis simultaneously at 106 CFU/mL enables yeast to reach a high population more rapidly, which is crucial for increased ethanol production.

3.6. Effect of D. bruxellensis Concentration and Inoculation Time on Free Amino Nitrogen (FAN) Concentration

The absence of a nitrogen source is known to result in 30% less BC yield, while an overabundance of nitrogen may instead only promote Komagataeibacter growth [40]. A nitrogen source is also crucial for D. bruxellensis growth, and the yeast has also been known to produce FAN, which is theorized to stimulate bacterial activity [6]. Therefore, the FAN concentration was measured in all samples during cultivation to investigate how the microbes interact (Figure 8). It was found that FAN in K. intermedius monoculture (B-control) only fluctuated slightly, with less than 5% being used, resulting in a final concentration of 96.78 ± 6.1 mg/L. This indicates that K. intermedius only needs a certain amount of nitrogen. Several studies have also reported that nitrogen consumption may vary depending on the Komagataeibacter strain and available sources [40,41]. A consistent decline was observed when a low concentration of D. bruxellensis was added on day 0 (BYL0), with only 16% of the FAN remaining by the end of the incubation (15.93 ± 2.6 mg/L). This could be because the FAN has been used for the yeast in BYL0 to grow rapidly (Figure 2). When a low concentration of D. bruxellensis was added on day 3 (BYL3), the FAN concentration followed a similar trend as B-control, with a slightly higher final concentration (115.6 ± 4.3 mg/L). The higher final concentration in BYL3 may be due to autolysis of D. bruxellensis as it could not compete with K. intermedius [6,42].
In both BYH0 and BYH3, an initial increase in FAN can be observed, with both samples peaking above 140 mg/L on day 3 and day 5, respectively. However, the FAN concentration then declined to approximately 75.24 ± 1.84 mg/L in BYH3 by day 14, while in BYH0, the FAN concentration decreased rapidly up to day 7 and then increased again toward the end of incubation from 36.61 ± 1.42 mg/L to 107.41 ± 11.64 mg/L. These results are similar to the findings of Tran et al. [6], where an equal amount of Komagataeibacter saccharivorans and D. bruxellensis bacteria-yeast co-culture was found to have a higher final FAN concentration compared to pure bacterial culture. However, it should be noted that the ninhydrin method can be used to detect small proteins and ammonia as well [43]. Yeasts in kombucha are known to produce amino acids from the available nitrogen in tea. D. bruxellensis is also particularly known for its ability to produce γ-Aminobutyric acid (GABA) [44]. Finally, acetic acid bacteria are known to produce ammonia to survive acidic conditions [45]. Therefore, the final FAN concentration in this study may indicate not only amino acid consumption but also ammonia production, which could explain the pH increase toward the end of incubation (Figure 3).

3.7. Effect of D. bruxellensis Concentration and Inoculation Time on BC Production by K. intermedius

Varying yeast concentrations and inoculation time may affect how bacteria and yeast interact, eventually impacting BC production. This study found that adding D. bruxellensis at a high concentration (106 CFU/mL), regardless of inoculation time, could enhance BC yield by 74–102% (Figure 9). B-control could only produce 0.63 ± 0.11 g/L BC after 14 days, while the yield increased to 1.09 ± 0.02 g/L and 1.27 ± 0.33 g/L when a high concentration of D. bruxellensis was simultaneously (BYH0) and sequentially (BYH3)added, respectively. On the other hand, adding D. bruxellensis at a low concentration (103 CFU/mL), regardless of the inoculation time, decreased the BC yield less than that of the bacteria alone. The lowest BC yield was observed in the co-culture with a low concentration of D. bruxellensis added simultaneously (BYL0), which produced 0.44 ± 0.012 g/L, a 30% lower yield than B-control, while sequential addition D. bruxellensis (BYL3) had 18% lower BC yield compared to B-control (0.52 ± 0.017 g/L). The BC yield is noticeably lower in this study compared to our previous study [10], potentially due to NaOH treatment for BC purification. Other studies have found that NaOH treatment of BC at high temperatures resulted in a lower BC mass due to interactions with the BC structure [46,47]. Additionally, the BC mass could further decrease due to NaOH treatment being more intensive to completely remove the dark colored sugarcane molasses-based media.
In this study, it was observed that a lower concentration of D. bruxellensis (BYL0) gave a lower BC yield and more gluconic acid (10.08 ± 0.12 g/L), while BYH3 produced less gluconic acid (4.64 ± 0.19 g/L) and gave a higher BC yield. According to a study by Gilbert et al. [48], adding a lower concentration of S. cerevisiae to Komagataeibacter rhaeticus could increase the BC yield due to less competition for glucose. Perhaps the sequential addition of D. bruxellensis (BYH3) was more similar to this condition since more glucose was available for the bacteria (Figure 4A). In addition to being competitive for glucose, BYL0 also promoted gluconic acid production, which may have caused less BC to be produced [49]. On the other hand, the high BC yield observed in BYH0 could be due to the D. bruxellensis supporting the K. intermedius growth for a longer period (Figure 1), either by ethanol or FAN production (Figure 7 and Figure 8) [6,48].
The significance of the D. bruxellensis concentration and inoculation time was calculated with the General Linear Model at a 95% confidence interval. The result shows that the D. bruxellensis concentration (p-value 0.01) and the time of inoculation (p-value 0.031) are significant on the final BC yield. However, the interrelation between D. bruxellensis ratio and the inoculation time (p-value 0.21) at a 5% confidence level was not significant on the final BC yield.

4. Conclusions

This study aimed to investigate the effect of D. bruxellensis concentrations (103 and 106 CFU/mL) and inoculation time (days 0 and 3) to promote BC synthesis by K. intermedius. The results show that regardless of inoculation time, a lower concentration of D. bruxellensis (103 CFU/mL) reduces the BC yield by 18–30% (0.44–0.52 g/L) compared to that of K. intermedius in monoculture (0.63 ± 0.11 g/L). On the other hand, adding a higher concentration of D. bruxellensis (106 CFU/mL), either simultaneously or sequentially, could increase the BC yields by 74–102% (1.09–1.27 g/L). Adding a higher D. bruxellensis concentration at the start of incubation could improve the survival of both species and stimulate metabolic reactions favorable for BC production, such as increased sugar consumption and higher ethanol and FAN production. In contrast, lower D. bruxellensis concentration promotes gluconic and glucuronic acid production, resulting in lower BC yields. These results show that it is feasible to regulate the BC production of K. intermedius in co-culture by controlling the inoculum proportion and time of addition of D. bruxellensis. Prior to scaling up the co-culture, more studies can be done on the metabolomics of the co-cultures in response to the varying ratios and inoculation time of D. bruxellensis. After identifying the role of each metabolite produced by D. bruxellensis, the metabolites responsible for stimulating BC production can be further optimized, while metabolites that stimulate acid production can be limited.

Author Contributions

Conceptualization, P.V.P.D., K.K. and S.A.; methodology, P.V.P.D., K.K. and S.A.; validation, P.V.P.D., K.K. and S.A.; formal analysis, F.P.; investigation, F.P.; resources, S.A.; data curation, P.V.P.D., K.K. and S.A.; writing—original draft preparation, P.V.P.D.; writing—review and editing, K.K., S.A. and M.J.T.; visualization, P.V.P.D. and S.A.; supervision, P.V.P.D., K.K. and S.A.; project administration, P.V.P.D., K.K. and S.A.; funding acquisition, P.V.P.D., K.K. and S.A. All authors have read and agreed to the published version of the manuscript.

Funding

This research was funded by the Indonesian Ministry of Research and Technology/National Research and Innovation Agency, grant number 447/LL3/AK.04/2022.

Institutional Review Board Statement

Not applicable.

Informed Consent Statement

Not applicable.

Data Availability Statement

Not applicable.

Acknowledgments

The authors would like to thank Davin Saviro Wijaya and Karen Saphira Gotama for technical assistance with this work.

Conflicts of Interest

The authors declare no conflict of interest. The funders had no role in the design of the study; in the collection, analyses, or interpretation of data; in the writing of the manuscript; or in the decision to publish the results.

References

  1. Zhong, C. Industrial-Scale Production and Applications of Bacterial Cellulose. Front. Bioeng. Biotechnol. 2020, 8, 605374. [Google Scholar] [CrossRef]
  2. de Amorim, J.D.P.; de Souza, K.C.; Duarte, C.R.; da Silva Duarte, I.; de Assis Sales Ribeiro, F.; Silva, G.S.; de Farias, P.M.A.; Stingl, A.; Costa, A.F.S.; Vinhas, G.M.; et al. Plant and Bacterial Nanocellulose: Production, Properties and Applications in Medicine, Food, Cosmetics, Electronics and Engineering. A Review. Environ. Chem. Lett. 2020, 18, 851–869. [Google Scholar] [CrossRef]
  3. Naomi, R.; Idrus, R.B.H.; Fauzi, M.B. Plant- vs. Bacterial-Derived Cellulose for Wound Healing: A Review. Int. J. Environ. Res. Public Health 2020, 17, 6803. [Google Scholar] [CrossRef] [PubMed]
  4. La China, S.; De Vero, L.; Anguluri, K.; Brugnoli, M.; Mamlouk, D.; Gullo, M. Kombucha Tea as a Reservoir of Cellulose Producing Bacteria: Assessing Diversity among Komagataeibacter Isolates. Appl. Sci. 2021, 11, 1595. [Google Scholar] [CrossRef]
  5. Villarreal-Soto, S.A.; Beaufort, S.; Bouajila, J.; Souchard, J.-P.; Taillandier, P. Understanding Kombucha Tea Fermentation: A Review. J. Food Sci. 2018, 83, 580–588. [Google Scholar] [CrossRef]
  6. Tran, T.; Grandvalet, C.; Verdier, F.; Martin, A.; Alexandre, H.; Tourdot-Maréchal, R. Microbial Dynamics between Yeasts and Acetic Acid Bacteria in Kombucha: Impacts on the Chemical Composition of the Beverage. Foods 2020, 9, 963. [Google Scholar] [CrossRef]
  7. May, A.; Narayanan, S.; Alcock, J.; Varsani, A.; Maley, C.; Aktipis, A. Kombucha: A Novel Model System for Cooperation and Conflict in a Complex Multi-Species Microbial Ecosystem. PeerJ 2019, 7, e7565. [Google Scholar] [CrossRef]
  8. Landis, E.A.; Fogarty, E.; Edwards, J.C.; Popa, O.; Eren, A.M.; Wolfe, B.E. Microbial Diversity and Interaction Specificity in Kombucha Tea Fermentations. mSystems 2022, 7, e00157-22. [Google Scholar] [CrossRef]
  9. Molina-Ramírez, C.; Enciso, C.; Torres-Taborda, M.; Zuluaga, R.; Gañán, P.; Rojas, O.J.; Castro, C. Effects of Alternative Energy Sources on Bacterial Cellulose Characteristics Produced by Komagataeibacter medellinensis. Int. J. Biol. Macromol. 2018, 117, 735–741. [Google Scholar] [CrossRef]
  10. Devanthi, P.V.P.; Kho, K.; Nurdiansyah, R.; Briot, A.; Taherzadeh, M.J.; Aslanzadeh, S. Do Kombucha Symbiotic Cultures of Bacteria and Yeast Affect Bacterial Cellulose Yield in Molasses? J. Fungi 2021, 7, 705. [Google Scholar] [CrossRef]
  11. Lin, S.-P.; Huang, Y.-H.; Hsu, K.-D.; Lai, Y.-J.; Chen, Y.-K.; Cheng, K.-C. Isolation and Identification of Cellulose-Producing Strain Komagataeibacter intermedius from Fermented Fruit Juice. Carbohydr. Polym. 2016, 151, 827–833. [Google Scholar] [CrossRef] [PubMed]
  12. Fernández, J.; Morena, A.G.; Valenzuela, S.V.; Pastor, F.I.J.; Díaz, P.; Martínez, J. Microbial Cellulose from a Komagataeibacter intermedius Strain Isolated from Commercial Wine Vinegar. J. Polym. Environ. 2019, 27, 956–967. [Google Scholar] [CrossRef] [Green Version]
  13. Angela, C.; Young, J.; Kordayanti, S.; Virgina Partha Devanthi, P.; Kho, K. Isolation and Screening of Microbial Isolates from Kombucha Culture for Bacterial Cellulose Production in Sugarcane Molasses Medium. KnE Life Sci. 2020, 5, 111–127. [Google Scholar] [CrossRef]
  14. Tyagi, N.; Suresh, S. Production of Cellulose from Sugarcane Molasses Using Gluconacetobacter Intermedius SNT-1: Optimization & Characterization. J. Clean. Prod. 2016, 112, 71–80. [Google Scholar] [CrossRef]
  15. Nguyen, N.K.; Nguyen, P.B.; Nguyen, H.T.; Le, P.H. Screening the Optimal Ratio of Symbiosis between Isolated Yeast and Acetic Acid Bacteria Strain from Traditional Kombucha for High-Level Production of Glucuronic Acid. LWT-Food Sci. Technol. 2015, 64, 1149–1155. [Google Scholar] [CrossRef]
  16. Li, R.; Xu, Y.; Chen, J.; Wang, F.; Zou, C.; Yin, J. Enhancing the Proportion of Gluconic Acid with a Microbial Community Reconstruction Method to Improve the Taste Quality of Kombucha. LWT 2022, 155, 112937. [Google Scholar] [CrossRef]
  17. Ciosek, A.; Rusiecka, I.; Poreda, A. Sour Beer Production: Impact of Pitching Sequence of Yeast and Lactic Acid Bacteria. J. Inst. Brew. 2020, 126, 53–58. [Google Scholar] [CrossRef]
  18. Devanthi, P.V.P.; Linforth, R.; Onyeaka, H.; Gkatzionis, K. Effects of Co-Inoculation and Sequential Inoculation of Tetragenococcus halophilus and Zygosaccharomyces rouxii on Soy Sauce Fermentation. Food Chem. 2018, 240, 1–8. [Google Scholar] [CrossRef]
  19. Pratama, F.; Devanthi, P.V.P.; Kho, K. Development of Selective Media for Komagataeibacter intermedius and Dekkera Bruxellensis from a Mixed Culture. Nusant. Sci. Technol. Proc. 2021, 32–38. [Google Scholar] [CrossRef]
  20. Doran, P.M. Bioprocess Engineering Principles, 2nd ed.; Elsevier: Amsterdam, The Netherlands; Academic Press: Boston, MA, USA, 2013; ISBN 978-0-12-220851-5. [Google Scholar]
  21. Serna Saldívar, S.R.O. Cereal Grains: Laboratory Reference and Procedures Manual; Food preservation technology series; CRC Press: Boca Raton, FL, USA, 2012; ISBN 978-1-4398-5565-2. [Google Scholar]
  22. R Core Team. R: A Language and Environment for Statistical Computing; R Foundation for Statistical Computing: Vienna, Austria, 2022. [Google Scholar]
  23. Stadie, J.; Gulitz, A.; Ehrmann, M.A.; Vogel, R.F. Metabolic Activity and Symbiotic Interactions of Lactic Acid Bacteria and Yeasts Isolated from Water Kefir. Food Microbiol. 2013, 35, 92–98. [Google Scholar] [CrossRef]
  24. Li, H.; Fu, J.; Hu, S.; Li, Z.; Qu, J.; Wu, Z.; Chen, S. Comparison of the Effects of Acetic Acid Bacteria and Lactic Acid Bacteria on the Microbial Diversity of and the Functional Pathways in Dough as Revealed by High-Throughput Metagenomics Sequencing. Int. J. Food Microbiol. 2021, 346, 109168. [Google Scholar] [CrossRef] [PubMed]
  25. Gao, C.-H.; Cao, H.; Cai, P.; Sørensen, S.J. The Initial Inoculation Ratio Regulates Bacterial Coculture Interactions and Metabolic Capacity. ISME J. 2021, 15, 29–40. [Google Scholar] [CrossRef] [PubMed]
  26. Diender, M.; Parera Olm, I.; Sousa, D.Z. Synthetic Co-Cultures: Novel Avenues for Bio-Based Processes. Curr. Opin. Biotechnol. 2021, 67, 72–79. [Google Scholar] [CrossRef] [PubMed]
  27. Mellefont, L.A.; McMeekin, T.A.; Ross, T. Effect of Relative Inoculum Concentration on Listeria Monocytogenes Growth in Co-Culture. Int. J. Food Microbiol. 2008, 121, 157–168. [Google Scholar] [CrossRef] [PubMed]
  28. Tanamool, V.; Chantarangsee, M.; Soemphol, W. Simultaneous Vinegar Fermentation from a Pineapple By-Product Using the Co-Inoculation of Yeast and Thermotolerant Acetic Acid Bacteria and Their Physiochemical Properties. 3 Biotech 2020, 10, 115. [Google Scholar] [CrossRef]
  29. Steensels, J.; Daenen, L.; Malcorps, P.; Derdelinckx, G.; Verachtert, H.; Verstrepen, K.J. Brettanomyces Yeasts—From Spoilage Organisms to Valuable Contributors to Industrial Fermentations. Int. J. Food Microbiol. 2015, 206, 24–38. [Google Scholar] [CrossRef] [Green Version]
  30. El-Gendi, H.; Taha, T.H.; Ray, J.B.; Saleh, A.K. Recent Advances in Bacterial Cellulose: A Low-Cost Effective Production Media, Optimization Strategies and Applications. Cellulose 2022, 29, 7495–7533. [Google Scholar] [CrossRef]
  31. Li, Z.; Chen, S.-Q.; Cao, X.; Li, L.; Zhu, J.; Yu, H. Effect of PH Buffer and Carbon Metabolism on the Yield and Mechanical Properties of Bacterial Cellulose Produced by Komagataeibacter hansenii ATCC 53582. J. Microbiol. Biotechnol. 2021, 31, 429–438. [Google Scholar] [CrossRef]
  32. Kuo, C.-H.; Chen, J.-H.; Liou, B.-K.; Lee, C.-K. Utilization of Acetate Buffer to Improve Bacterial Cellulose Production by Gluconacetobacter xylinus. Food Hydrocoll. 2016, 53, 98–103. [Google Scholar] [CrossRef]
  33. Thongwai, N.; Futui, W.; Ladpala, N.; Sirichai, B.; Weechan, A.; Kanklai, J.; Rungsirivanich, P. Characterization of Bacterial Cellulose Produced by Komagataeibacter maltaceti P285 Isolated from Contaminated Honey Wine. Microorganisms 2022, 10, 528. [Google Scholar] [CrossRef]
  34. Martínez-Leal, J.; Ponce-García, N.; Escalante-Aburto, A. Recent Evidence of the Beneficial Effects Associated with Glucuronic Acid Contained in Kombucha Beverages. Curr. Nutr. Rep. 2020, 9, 163–170. [Google Scholar] [CrossRef] [PubMed]
  35. Son, H.-J.; Kim, H.-G.; Kim, K.-K.; Kim, H.-S.; Kim, Y.-G.; Lee, S.-J. Increased Production of Bacterial Cellulose by Acetobacter Sp. V6 in Synthetic Media under Shaking Culture Conditions. Bioresour. Technol. 2003, 86, 215–219. [Google Scholar] [CrossRef]
  36. Villarreal-Soto, S.A.; Bouajila, J.; Pace, M.; Leech, J.; Cotter, P.D.; Souchard, J.-P.; Taillandier, P.; Beaufort, S. Metabolome-Microbiome Signatures in the Fermented Beverage, Kombucha. Int. J. Food Microbiol. 2020, 333, 108778. [Google Scholar] [CrossRef] [PubMed]
  37. Gomes, R.J.; de Faria-Tischer, P.C.S.; Tischer, C.A.; Constantino, L.V.; de Rosa, M.F.; Chideroli, R.T.; de Pereira, U.P.; Spinosa, W.A. Komagataeibacter intermedius V-05: An Acetic Acid Bacterium Isolated from Vinegar Industry, with High Capacity for Bacterial Cellulose Production in Soybean Molasses Medium. Food Technol. Biotechnol. 2021, 59, 432–442. [Google Scholar] [CrossRef]
  38. Wang, S.-S.; Han, Y.-H.; Chen, J.-L.; Zhang, D.-C.; Shi, X.-X.; Ye, Y.-X.; Chen, D.-L.; Li, M. Insights into Bacterial Cellulose Biosynthesis from Different Carbon Sources and the Associated Biochemical Transformation Pathways in Komagataeibacter Sp. W1. Polymers 2018, 10, 963. [Google Scholar] [CrossRef] [Green Version]
  39. Tantipaibulvut, S.; Pinisakul, A.; Rattanachaisit, P.; Klatin, K.; Onsriprai, B.; Boonyaratsiri, K. Ethanol Production from Desizing Wastewater Using Co-Culture of Bacillus Subtilis and Saccharomyces Cerevisiae. Energy Procedia 2015, 79, 1001–1007. [Google Scholar] [CrossRef] [Green Version]
  40. Avcioglu, N.H.; Birben, M.; Seyis Bilkay, I. Optimization and Physicochemical Characterization of Enhanced Microbial Cellulose Production with a New Kombucha Consortium. Process Biochem. 2021, 108, 60–68. [Google Scholar] [CrossRef]
  41. Premjet, S.; Premjet, D.; Ohtani, Y. The Effect of Ingredients of Sugar Cane Molasses on Bacterial Cellulose Production by Acetobacter xylinum ATCC 10245. Seni Gakkaishi 2007, 63, 193–199. [Google Scholar] [CrossRef] [Green Version]
  42. Lo, S.-C.; Yang, C.-Y.; Mathew, D.C.; Huang, C.-C. Growth and Autolysis of the Kefir Yeast Kluyveromyces marxianus in Lactate Culture. Sci. Rep. 2021, 11, 14552. [Google Scholar] [CrossRef]
  43. Friedman, M. Applications of the Ninhydrin Reaction for Analysis of Amino Acids, Peptides, and Proteins to Agricultural and Biomedical Sciences. J. Agric. Food Chem. 2004, 52, 385–406. [Google Scholar] [CrossRef]
  44. Koller, H.; Perkins, L.B. Brewing and the Chemical Composition of Amine-Containing Compounds in Beer: A Review. Foods 2022, 11, 257. [Google Scholar] [CrossRef] [PubMed]
  45. Román-Camacho, J.J.; Mauricio, J.C.; Santos-Dueñas, I.M.; García-Martínez, T.; García-García, I. Functional Metaproteomic Analysis of Alcohol Vinegar Microbiota during an Acetification Process: A Quantitative Proteomic Approach. Food Microbiol. 2021, 98, 103799. [Google Scholar] [CrossRef]
  46. Rani, M.U.; Appaiah, K.A.A. Production of Bacterial Cellulose by Gluconacetobacter hansenii UAC09 Using Coffee Cherry Husk. J. Food Sci. Technol. 2013, 50, 755–762. [Google Scholar] [CrossRef] [PubMed]
  47. Hashim, N.A.R.N.A.; Zakaria, J.; Mohamad, S.; Fathiyah Sy Mohamad, S.; Rahim, M.H.A. Effect of Different Treatment Methods on the Purification of Bacterial Cellulose Produced from OPF Juice by Acetobacter xylinum. IOP Conf. Ser. Mater. Sci. Eng. 2021, 1092, 012058. [Google Scholar] [CrossRef]
  48. Gilbert, C.; Tang, T.-C.; Ott, W.; Dorr, B.A.; Shaw, W.M.; Sun, G.L.; Lu, T.K.; Ellis, T. Living Materials with Programmable Functionalities Grown from Engineered Microbial Co-Cultures. Nat. Mater. 2021, 20, 691–700. [Google Scholar] [CrossRef]
  49. Pinto, L.; Malfeito-Ferreira, M.; Quintieri, L.; Silva, A.C.; Baruzzi, F. Growth and Metabolite Production of a Grape Sour Rot Yeast-Bacterium Consortium on Different Carbon Sources. Int. J. Food Microbiol. 2019, 296, 65–74. [Google Scholar] [CrossRef]
Figure 1. K. intermedius growth during 14 days of cultivation in mono (B-control) and co-cultures with D. bruxellensis at 30 °C. D. bruxellensis was added simultaneously at concentrations of 106 CFU/mL (BYH0) and 103 CFU/mL (BYL0) and sequentially at 106 CFU/mL (BYH3) and 103 CFU/mL (BYL3).
Jof 08 01206 g001
Figure 2. D. bruxellensis growth during 14 days cultivation in mono (Y-control) and co-cultures with K. intermedius at 30 °C. D. bruxellensis was added simultaneously at concentrations of 106 CFU/mL (BYH0) and 103 CFU/mL (BYL0) and sequentially at 106 CFU/mL (BYH3) and 103 CFU/mL (BYL3).
Jof 08 01206 g002
Figure 3. Changes in pH during 14 days of cultivation using K. intermedius mono-(B-control) and co-cultures with D. bruxellensis at 30 °C. D. bruxellensis was added simultaneously at concentrations of 106 CFU/mL (BYH0) and 103 CFU/mL (BYL0) and sequentially at 106 CFU/mL (BYH3) and 103 CFU/mL (BYL3).
Jof 08 01206 g003
Figure 4. Changes in (A) glucose and (B) fructose concentration during 14 days of cultivation using K. intermedius mono-(B-control) and co-cultures with D. bruxellensis at 30 °C. D. bruxellensis was added simultaneously at concentrations of 106 CFU/mL (BYH0) and 103 CFU/mL (BYL0) and sequentially at 106 CFU/mL (BYH3) and 103 CFU/mL (BYL3).
Jof 08 01206 g004
Figure 5. Changes in gluconic acid during 14 days of cultivation using K. intermedius mono-(B-control) and co-cultures with D. bruxellensis at 30 °C. D. bruxellensis was added simultaneously at concentrations of 106 CFU/mL (BYH0) and 103 CFU/mL (BYL0) and sequentially at 106 CFU/mL (BYH3) and 103 CFU/mL (BYL3).
Jof 08 01206 g005
Figure 6. Glucuronic acid concentration after 14 days of cultivation using K. intermedius mono-(B-control) and co-cultures with D. bruxellensis at 30 °C. D. bruxellensis was added simultaneously at concentrations of 106 CFU/mL (BYH0) and 103 CFU/mL (BYL0) and sequentially at 106 CFU/mL (BYH3) and 103 CFU/mL (BYL3). Means with different letters are significantly different (p < 0.05).
Jof 08 01206 g006
Figure 7. Ethanol production by D. bruxellensis during 14 days of co-culture with K. intermedius at 30 °C. D. bruxellensis was added simultaneously at concentrations of 106 CFU/mL (BYH0) and 103 CFU/mL (BYL0) and sequentially at 106 CFU/mL (BYH3) and 103 CFU/mL (BYL3).
Jof 08 01206 g007
Figure 8. Changes in free amino nitrogen (FAN) concentration during 14 days of cultivation using K. intermedius mono-(B-control) and co-cultures with D. bruxellensis at 30 °C. D. bruxellensis was added simultaneously at concentrations of 106 CFU/mL (BYH0) and 103 CFU/mL (BYL0) and sequentially at 106 CFU/mL (BYH3) and 103 CFU/mL (BYL3).
Jof 08 01206 g008
Figure 9. Effect of D. bruxellensis concentration and inoculation time on BC final yield by produced by K. intermedius. D. bruxellensis was added simultaneously at concentrations of 106 CFU/mL (BYH0) and 103 CFU/mL (BYL0) and sequentially at 106 CFU/mL (BYH3) and 103 CFU/mL (BYL3). Means with different letters are significantly different (p < 0.05).
Jof 08 01206 g009
Table 1. BC production experimental set up with K. intermedius mono-(B-control) and co-cultures with D. bruxellensis at 30 °C. D. bruxellensis was added simultaneously at concentrations of 106 CFU/mL (BYH0) and 103 CFU/mL (BYL0) and sequentially at 106 CFU/mL (BYH3) and 103 CFU/mL (BYL3).
KERRYPNXCell Concentration (log CFU/mL)
SampleK. intermediusD. bruxellensisDay of Yeast
Addition
B-control6n.a.n.a.
Y-controln.a.6n.a.
BYH0660
BYL0630
BYH3663
BYL3633
Publisher’s Note: MDPI stays neutral with regard to jurisdictional claims in published maps and institutional affiliations.

