Article

Season, Vegetation Proximity and Building Age Shape the Indoor Fungal Communities’ Composition at City-Scale

by
Hélène Niculita-Hirzel
1,*,
Pascal Wild
1 and
Alexandre H. Hirzel
2
1
Department Work, Health & Environment, Center for Primary Care and Public Health (Unisanté), University of Lausanne, Route de la Corniche 2, CH-1066 Epalinges-Lausanne, Switzerland
2
Computer Science Center, Amphimax Building, Quartier Sorge, University of Lausanne, CH-1015 Lausanne, Switzerland
*
Author to whom correspondence should be addressed.
J. Fungi 2022, 8(10), 1045; https://doi.org/10.3390/jof8101045
Submission received: 30 August 2022 / Revised: 28 September 2022 / Accepted: 30 September 2022 / Published: 3 October 2022
(This article belongs to the Special Issue Fungal Diversity in Europe)

Abstract

:
Exposure to particular microbiome compositions in the built environment can affect human health and well-being. Identifying the drivers of these indoor microbial assemblages is key to controlling the microbiota of the built environment. In the present study, we used culture and metabarcoding of the fungal Internal Transcribed Spacer ribosomal RNA region to assess whether small-scale variation in the built environment influences the diversity, composition and structure of indoor air fungal communities between a heating and an unheated season. Passive dust collectors were used to collect airborne fungi from 259 dwellings representative of three major building periods and five building environments in one city—Lausanne (Vaud, Switzerland)—over a heating and an unheated period. A homogenous population (one or two people with an average age of 75 years) inhabited the households. Geographic information systems were used to assess detailed site characteristics (altitude, proximity to forest, fields and parks, proximity to the lake, and density of buildings and roads) for each building. Our analysis indicated that season was the factor that explained most of the variation in colonies forming unit (CFU) concentration and indoor mycobiome composition, followed by the period of building construction. Fungal assemblages were more diverse during the heating season than during the unheated season. Buildings with effective insulation had distinct mycobiome compositions from those built before 1975 — regardless of whether they were constructed with pre-1945 technology and materials or 1945 — 1974 ones. The urban landscape—as a whole—was a significant predictor of cultivable Penicillium load—the closer the building was to the lake, the higher the Penicillium load—but not of fungal community composition. Nevertheless, the relative abundance of eleven fungal taxa detected by metabarcoding decreased significantly with the urbanization gradient. When urban landscape descriptors were analyzed separately, the explanatory power of proximity to vegetation in shaping fungal assemblages become significant, indicating that land cover type had an influence on fungal community structure that was obscured by the effects of building age and sampling season. In conclusion, indoor mycobiomes are strongly modulated by season, and their assemblages are shaped by the effectiveness of building insulation, but are weakly influenced by the urban landscape.

1. Introduction

In urban societies, buildings are the main places where people live, work and entertain [1]. Therefore, the quality of indoor air conditions the respiratory health of the inhabitants. One regular indoor pollutant incriminated in the induction of respiratory health problems in young children [2,3] (as in adults) [4] when present at an abnormally high concentration, are the bioaerosols, in particular those emitted by fungal species growing on built humid surfaces (following water leaks in the envelope, plumbing failures, or condensation). Nevertheless, while low-diversity mycobiomes in dwellings were strongly and significantly associated with an increased risk of later asthma development [5,6], exposure to high-diversity mycobiomes in the first years of life has been associated with a protective effect against allergy [7,8,9]. Thus, it has been proposed that the loss of diversity results in a so-called “dysbiosis” of the mycobiome associated with the built environment—a state that describes the altered composition of this microbial community, which has a cascading impact on the immune system and offers an advantage for the emergence and outbreak of pathogens [10].
The association between exposure to a particular mycobiome profile and adverse health outcomes [11] has prompted research into the key factors that determine the composition and diversity of the indoor mycobiome. Such research has been facilitated in the last years by the increased knowledge of the diversity and composition of mycobiomes through the use of next generation DNA sequencing (NGS) technology on the microbial barcode markers, such as nuclear ribosomal internal transcribed spacer (ITS) for fungi [12]. The NGS has proven to be a useful tool for characterizing microbial diversity in a variety of indoor environments at sufficient depth to highlight the importance of various sources of microorganisms in driving airborne mycobiome diversity.
The most studied source of fungi in the built environment is that of building materials contaminated by molds. A wide range of fungi have been identified to proliferate on building materials containing cellulose—such as wood or wallpaper—when moisture levels are high enough to allow their growth [13,14,15,16,17,18]. Fungal spores and hyphal fragments are released from these surfaces based on the life cycle of the fungus and the air velocity at the surface of the material [19,20]. In addition, in bathrooms, fungal particles can be aerosolized from contaminated surfaces when water droplets splashes onto them in showers [21]. The concentration of fungi released in aerosols from moldy surfaces was reported to be high enough to distinguish mycobiomes of moldy or water damaged buildings from those of “healthy” dwellings [20,22]. Interestingly, one good predictor of indoor mold growth prevalence is the period of building construction [23,24,25]. Indeed, certain construction periods have an increasing risk for dampness problems due to the building materials used, the lack of ventilation and the level of insulation that favors moisture accumulation [26,27]. Thus, the residential buildings constructed in the thirties often present unfavorable thermal profiles in the walls or floor, while those constructed after the eighties are too airtight [28,29]. In addition, occupancy density and occupant behavior also play a role in shaping indoor mycobiomes by modulating air temperature and humidity levels, and by contributing with their own microbiome (e.g., pets, plants [30], fungi associated with human skin [31]). Airborne fungi can be released into the built environment not only from contaminated water-damaged materials [22], but also from other building characteristics, such as air-conditioning (HVAC) systems [32].
The composition of the indoor mycobiome relies not only on indoor sources but also on the composition of the outdoor mycobiome, which might contribute significantly to the indoor mycobiome [33]. The variation in fungal composition of outdoor air varies dynamically across time and space at continental [34], global [35] and even at city [31] scales. This variation in composition is related to the season [36], and to the nature of the surrounding landscapes (ocean, agricultural soil, forest etc.) from which local meteorological conditions (especially wind direction and speed) control the release and dispersal of fungal spores [37,38,39,40,41]. In particular, the type and density of vegetation in urban and rural areas condition airborne microorganisms [25,42], with each plant species hosting distinct microbial communities [40,43]. Nevertheless, the infiltration rate of outdoor fungi indoors depends on the airtightness of the building envelope and the frequency of window opening by the occupants [20,44], with both indoor and outdoor temperatures having a significant impact on the window opening behavior of occupants [45,46]. While the spatiotemporal variation of the microbiome has been explored in urban outdoor air, the influence of urban landscape diversity on the indoor mycobiome during heating and unheated periods has been little documented [31]. Understanding how the urban landscape relates to diversity and function of the indoor mycobiome is necessary to understand the mycobiome ecology, and to be able to guide urban development in ways that utilize ecological functions to enhance human health and well-being.
The aim of the study was to reveal the influence of the urban landscape on indoor mycobiomes across time and space in a city with a wide variation in altitude, surrounding landscape (e.g., lake, forest), urbanization level, and with a long-term construction history, Lausanne. Three construction periods have been identified according to the materials used, and the ventilation and isolation requirements of the building envelope [29]. Therefore, dwellings built at the same period are expected to share more taxa than those constructed in other periods. Given that Lausanne is in a temperate region and that outdoor temperature influences the occupants’ behavior to open windows, we hypothesize that indoor mycobiomes fluctuate between the heating and unheated periods. In the unheated period with optimal outdoor fungal growth conditions, we expect the indoor air mycobiome to be influenced by the local outdoor environment (altitude, proximity to forest, fields and parks, proximity to the lake and road density). To test these hypotheses, Electrostatic Dust Collectors (EDC) were installed in 259 dwellings inhabited by a homogenous population (one or two people with an average age of 75 years) during the heating and unheated periods. The location of the dwellings represents the heterogeneity of the built environment of Lausanne. Fungi present in the samples were surveyed through culturing and DNA metabarcoding analyses of the rDNA ITS2 region.

2. Materials and Methods

2.1. Experimental Design

To include dwellings in Lausanne with a homogenous population, the study was proposed at the follow-up consultation of the Lc65+ cohort [47]. The Lc65+ cohort was composed of people aged 71–80 years in the year of the study, living alone or in couples. Of the 417 participants who come to the consultation, 391 were eligible (they lived in Lausanne and did not moved or intend to move from the same address), and 287 agreed to participate in the study (87 from early June to late August and 197 from early September to late December). They all lived in Lausanne in buildings with natural ventilation. Each participant filled in a short self-reported questionnaire with dwelling characteristics (number of persons living in the apartment, presence of visible mold, orientation of the sampled room, floor number), and left the consultation with one electrostatic dust collector (EDC) [48] as well as instructions on how to install it in their main living room between 1.20 and 1.60 m above the floor, and an envelope to return the EDC to the lab. The EDCs consist of commercially available electrostatic wipes (Apta Captizz, Apta, France), set in a plastic case, which the participant opens to collect dust passively. Wipes were first sterilized in an autoclave (124 °C for 30 min) and stuck on a disinfected polypropylene case (DVD single-slim case, BECO GmbH & Co. KG, Arnsberg, Germany) with white glue (UHU®, Bühl, Germany). The system has been previously validated for its effectiveness in trapping the overall fungal diversity present in aerosols [49,50], this includes the sampling time, as well as the methods for fungal DNA extraction and amplification of the indoor fungal species [40,51]. After 10 weeks, participants returned the EDC by mail. The EDCs returned between September and late October were considered representative of the unheated period, while those returned between early November and late February were representative of the heating period. The location of the dwellings was confirmed as representative of the different urban environments of Lausanne (Figure 1).

2.2. Mycobiomes Characterization

A total of 259 EDC were returned by mail. Once in the lab, each EDC wipe was placed in a plastic bag with 20 mL of a solution of Tween 80 to 0.1% (Merck®, Darmstadt, Germany) and washed for 5 min in a Stomacher ™ (AES®, Combourg, France). An aliquot of the harvested liquid was kept for culture, while the rest was centrifuged for 30 min at 8500 g and the liquid discarded. The recovered pellet was mechanically disrupted for 2 min at 30 Hz with a TissueLyser (Qiagen, Hombrechtikon, Switzerland) in the first buffer of a FastDNA Spin Kit for Soil (MP Biomedicals, Illkirch, France). The total DNA was extracted according to the manufacturer’s instructions. A two-step PCR approach combined with Illumina’s dual indexing strategy was chosen in order to process all of the samples in parallel. To describe the fungal communities, the internal transcribed spacer 1 (ITS1), the genomic region the most commonly used in metabarcoding studies of fungi, has been chosen. To amplify this barcode, the primer pair selected was the one the most commonly used for this marker: ITS1F and ITS2, to which the following universal tail was added, respectively 5′TCGTCGGCAGCGTCAGATGTGTATAAGAGACAG and 5′GTCTCGTGGGCTCGGAGATGTGTATAAGAGACAG. Each DNA sample was amplified in triplicate in 20 μL reaction volumes containing 10 μL DNA, 4 μL of 5× Phusion HF Buffer, 0.4 μL of dNTP Mixture (10 mM each), 1 μL of each NGS primer (10 μM each), 0.6 μL of DMSO, and 0.6 U of Phusion High-Fidelity DNA Polymerase (NEB, Ipswich, MA, USA). DNA amplification conditions in the Biometra PCR thermal cycler were 98 °C for 2 min, then 35 cycles of each, 98 °C for 30 s, 55 °C for 30 s, and 72 °C for 1 min, and a final elongation step of 10 min at 72 °C. By that stage, 131 samples were successfully amplified and passed the DNA quality control by electrophoresis on a 3% agarose gel. A correlation between the number of CFUs in culture and DNA extraction efficiency was observed (unsuccessfully amplified Mean ± SD = 20 ± 18 CFU·day−1, N = 128; successfully amplified Mean ± SD = 25 ± 20 CFU·day−1, N = 131; p = 0.01). The amplicons—of a size of ~450 bp—were purified with Agencourt AMPure XP (Beckman Coulter, Brea, CA, USA), resuspended in 40 μL of 10 mM TrisCl pH 8 and quantified using the Quant-ITTM PicoGreenTM dsDNA reagent and kit (Life Technologies corporation, Oregon, OR, USA). Libraries were prepared from the resulting amplicons using the Illumina MiSeq Reagent Kit v2 and sequenced on a Illumina MiSeq platform (by Microsynth, Balgach, Switzerland) to generate 250 bp paired-end reads.
To determine the cultivable fraction, 250 μL of the harvested suspension were spread in replicates on plates with dichloran-glycerol culture medium (DG18) (Oxoid PO5088A, Thermo Fisher Diagnostics AG, Pratteln, Switzerland) and placed in an incubator at 25 °C for five days. All plates were checked daily for fungal colony growth and total and phenotype specific fungal colony forming units (CFUs) were counted. The different phenotypes were identified at the genus level by macroscopic observation of the growth characteristics of the colonies and the microscopic observation of conidiophores, branching patterns of conidiophores and conidiogenous cells morphology [52,53]. Each CFU concentration was normalized per day of sampling by multiplying the number of CFUs by the volume of the EDC wash solution and dividing by the number of days sampled.

2.3. Bioinformatics

Forward and reverse reads were merged, trimmed, and quality filtered using the following criteria: no differences to primer and identifier, overlap 20, average quality > 28, minimum sequence length 100 bp, homopolymer length < 9. Tags and primer sequences were removed. The resulting 11,493,895 amplicon sequence variants were further clustered into operational taxonomic units (OTUs) using the UCLUST algorithm in QIIME v.1.7.0 [54] at a 97% similarity cut-off. The taxonomic assignment of sequences were done with a QIIME preformatted database of UNITE [55] and the international nucleotide sequence databases NCBI, EMBL and DDBJ, by using BLASTN algorithm for the taxonomic assignment over UCLUST. Chimeras, singletons, and contaminants were discarded. The final dataset contained 493,005 OTUs accounting for 9,396,225 reads. The number of reads per sample varied from 4571 to 357,813 with a mean value of 69,090 and a median value of 44,513 reads. The number of OTUs per sample varied from 191 to 11,099. The dataset was rarefied to an even depth of 9000 reads per sample. This led to one sample being discarded prior to downstream statistical analyses. A table with the distribution of identified OTUs through samples has been generated. As the taxonomical accuracy for the ITS1 sequence amplified with ITS1F/ITS2 primers can be resolved at genus but not species level [56], a second table was generated with the OTUs pooled at the genus level.

2.4. Environmental Variables

Complete data on the year of construction of the building and on the built environment were extracted based on the addresses of the participants of the Lc65+ cohort that still live in Lausanne (1881). The buildings’ construction year, the heating system, the heating agent and the living surface were retrieved from the ‘Registre Cantonal des Bâtiments’. Building environmental variables—altitude (Alti3D), proximity to forest, fields and parks (cadastral data), proximity to the lake (SwissTLM3D, density of buildings and roads (SwissTLM3D)—were retrieved from Swisstopo, the Swiss Federal Office of Topography, databases with the models indicated in brackets. Geographic information systems were used to associate the site characteristics (altitude, proximity to forest, fields and parks, and proximity to the lake, and density of buildings and roads) for each building. Lausanne’s climate is classified as warm-summer (“Dfb”) by the Köppen Climate Classification system. The heating period covers the months of November to March, while the unheated period is from April to October.

2.5. Statistical Analysis

The building environment variables retained were confirmed to be independent with a principal component analysis. Therefore, a typology of built environments was generated using an agglomerative hierarchical clustering method based on the Euclidean distance. This algorithm uses the farthest pair of observations between two groups to determine the proximity between two groups. The mycobiome was analyzed in respect to the location of buildings. The buildings represented the five typological environments (named peri-urban, suburban, historic downtown, lakefront downtown and lakefront) and the three construction periods defined by building characteristics and insulation efficiency (before 1944: cement slab with metal beams, hollow body in clay or wooden floor, solid wall, window with single glass; between 1945 and 1974: concrete slab, simple or compound wall without insulation, window with two single glass panes without insulation; between 1975 and 2014: slab/floor with insulation, composite wall with insulation, window with double insulating glass; [29]) for both the heating and unheated periods. In order to identify the principal factors that influence the fungal communities’ composition, we used Analysis of Similarity (AnoSim) with 1000 permutations, unless otherwise stated, and principal coordinates analysis (PCoA = classical multidimensional scaling) on all pair wise Bray-Curtis to display the dissimilarities between samples graphically. The alpha diversity of fungal assemblages was estimated by the Shannon (H′) index and the beta diversity by Bray-Curtis dissimilarity distance. Genera-specific analyses were carried out using logistic regression for their frequencies (presence absence in samples) and the adapted non-parametric test— either the Kruskal-Wallis rank test or the Wilcoxon rank-sum test—for the taxa relative abundance in samples. Statistics were performed in R version 3.6.2. [57] through RStudio (version 1.3.959) or with Stata software version 17.0 (StataCorp LLC, College Station, TX, USA).

3. Results

3.1. Building Environments

The clustering algorithm of the 1881 addresses of the entire Lc65+ cohort identified five distinct clusters of urban landscapes across Lausanne, based on elevation, density of roads and buildings, proximity to green spaces and to the lake. These clusters have been named the peri-urban, suburban, historic downtown, lakefront downtown, and lakefront clusters respectively for ease of tracking on the Figure 1. A total of 259 sampled dwellings, evenly distributed across these five urban landscapes and representative of the different construction periods, are shown in Table 1. Cultivable fungi were detected in all samples collected (259 dwellings), and mycobiomes were characterized in 131 of them (Figure 1). All dwellings had district heating.

3.2. Cultivable Fraction of Fungi & Environment

The concentration in cultivable fungi was significantly higher during the heating than during the unheated period (p = 0.000, Table 2). Penicillium and Aspergillus were the most frequently detected genera in cultures, accounting for the majority of colonies forming units (CFUs) in 21% and 7% of the dwellings, respectively—48 dwellings sampled during the heating period and nine during the unheated period for Penicillium; nine during the heating period and 11 during the unheated period for Aspergillus. While the concentration of Aspergillus CFUs in dwelling dust did not vary significantly between heated and unheated seasons or between urban landscape clusters, the concentration of Penicillium CFUs was higher during the heating than during the unheated season (p = 0.020, Table 2) In particular, the concentration of Penicillium CFUs was higher in dwellings constructed after 1975 (p = 0.034, Table 2), and correlated with the urban landscape gradient (Coef. = 2.92 p = 0.009)—with the lowest concentration in the peri-urban cluster, and the highest in the lakefront cluster. Fungal contamination was reported in 14 dwellings (5%), mostly during the heating period (N = 13). No correlation was observed between homeowner reporting of visible mold and concentration of cultivable fungi (p = 0.839). Moreover, while the concentration of cultivable fungi was higher during the heating season in dwellings built after 1975 (p =0.008, Table 2), no significant association between visible mold and construction period was observed.

3.3. Factors Driving the Diversity of Indoor Fungal Community

Taxonomical identification of the retained OTUs revealed 248 distinct fungal genera across the indoor environments. Statistical analysis confirmed that fungal richness varied widely between the unheated and heating period. Fungal diversity was significantly higher in dwellings sampled during the heating period than during the unheated period (Shannon index: p = 0.0006; fungal richness: p = 0.0000; Table 2). No association of fungal diversity or richness with urban landscape or construction period was detected. Fungal richness was inversely correlated with the relative abundance of the most abundant genera independently of the sampling season. Note that the relative abundance of the most abundant taxa in the samples was significantly higher in dwellings with visible mold (50.4 ± 29.3 versus 29.4 ± 13.9, p = 0.0004). Interestingly, only Aspergillus showed a higher relative abundance in mold contaminated dwellings compared to those with no visible molds declared (p = 0.0003).

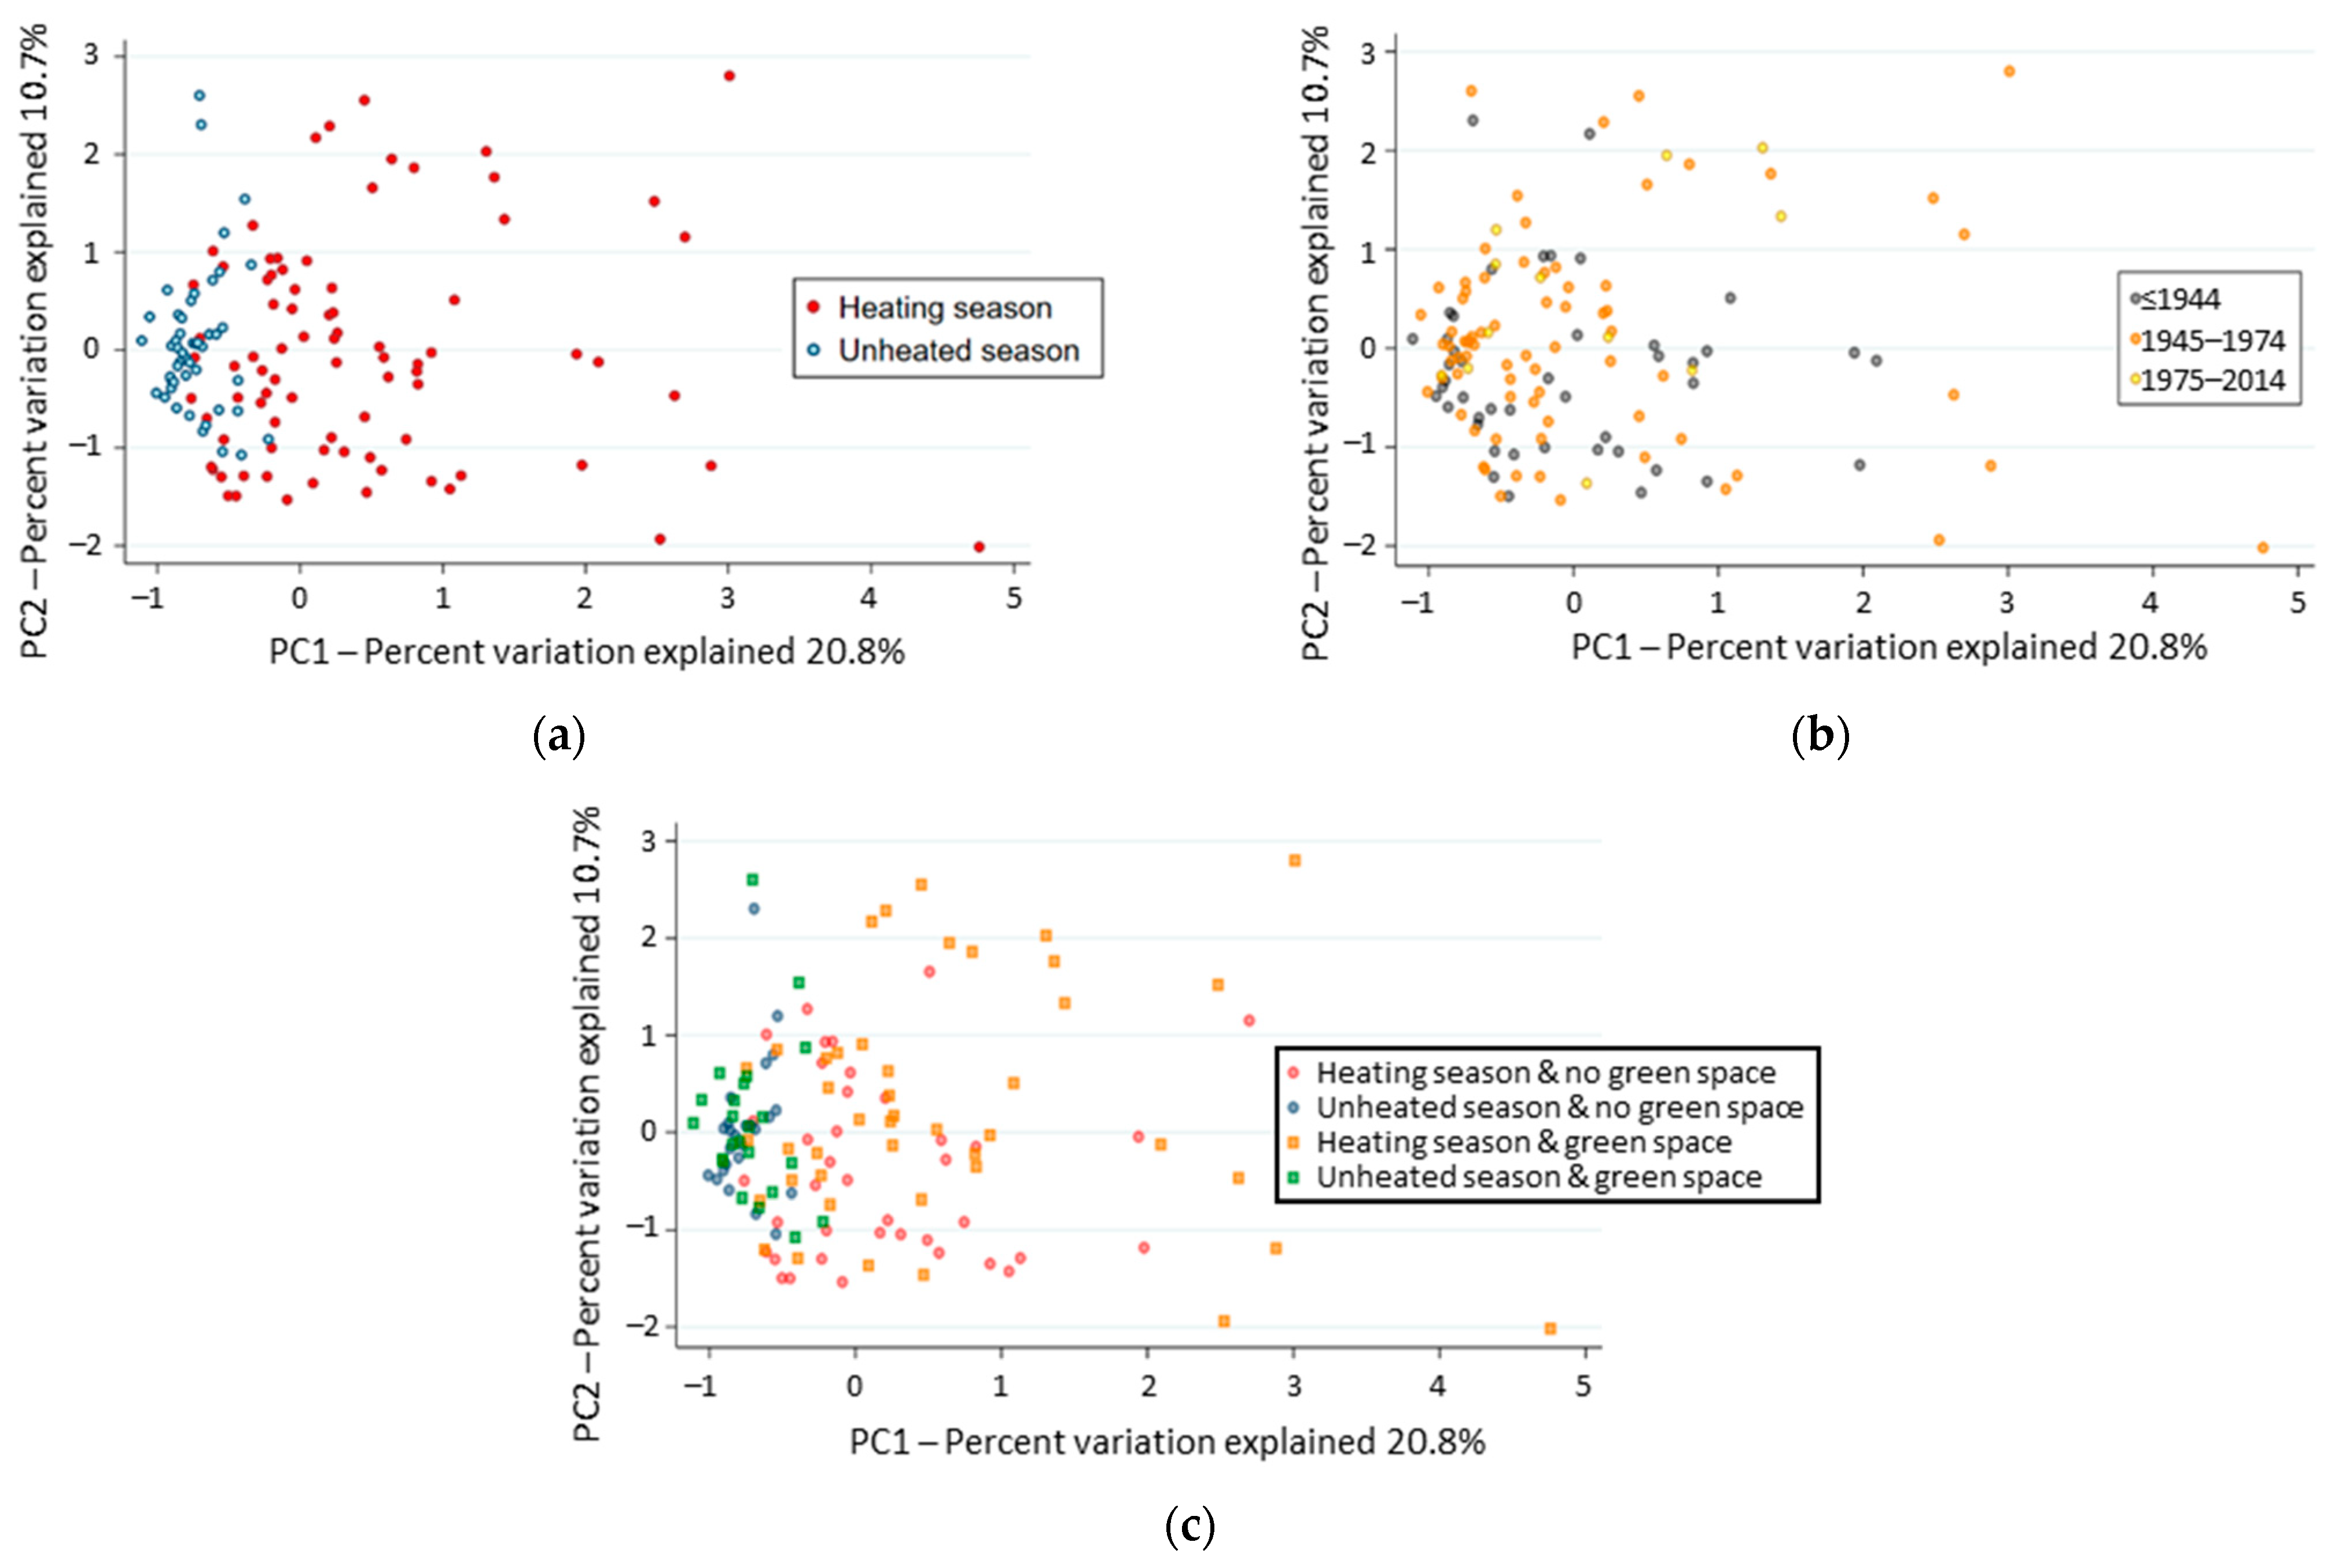
3.4. Factors Structuring the Composition of Indoor Fungal Community

Two principal factors, with Eigenvalues of 20.8 and 10.7, structured the composition of fungal communities when OTUs were regrouped at the genus level. The first factor clustered the fungal communities according to sampling period (p = 0.000; Figure 2a), although the second factor score regrouped the fungal communities according to the building construction period (p = 0.037; Figure 2b). Significant post-hoc differences were observed between the composition of the fungal communities sampled in the most recent buildings (1975–2014) and those built before 1944 (p = 0.016). No correlation was observed between the two principal factor scores and urban landscape clusters. However, the second factor score differed according to the proximity of green space (p = 0.013; Figure 2c), in particular during the unheated period (p = 0.020). The presence of a dominant phenotype in culture explained little of the beta diversity of the fungal communities (3.3% of the variation; p = 0.047), while the report of visible molds was associated with a disperse distribution of the beta diversity across samples in the PCoA plot. The mycobiomes collected from dwellings located at different floors or with different cardinal orientation were similar (p = 0.342).

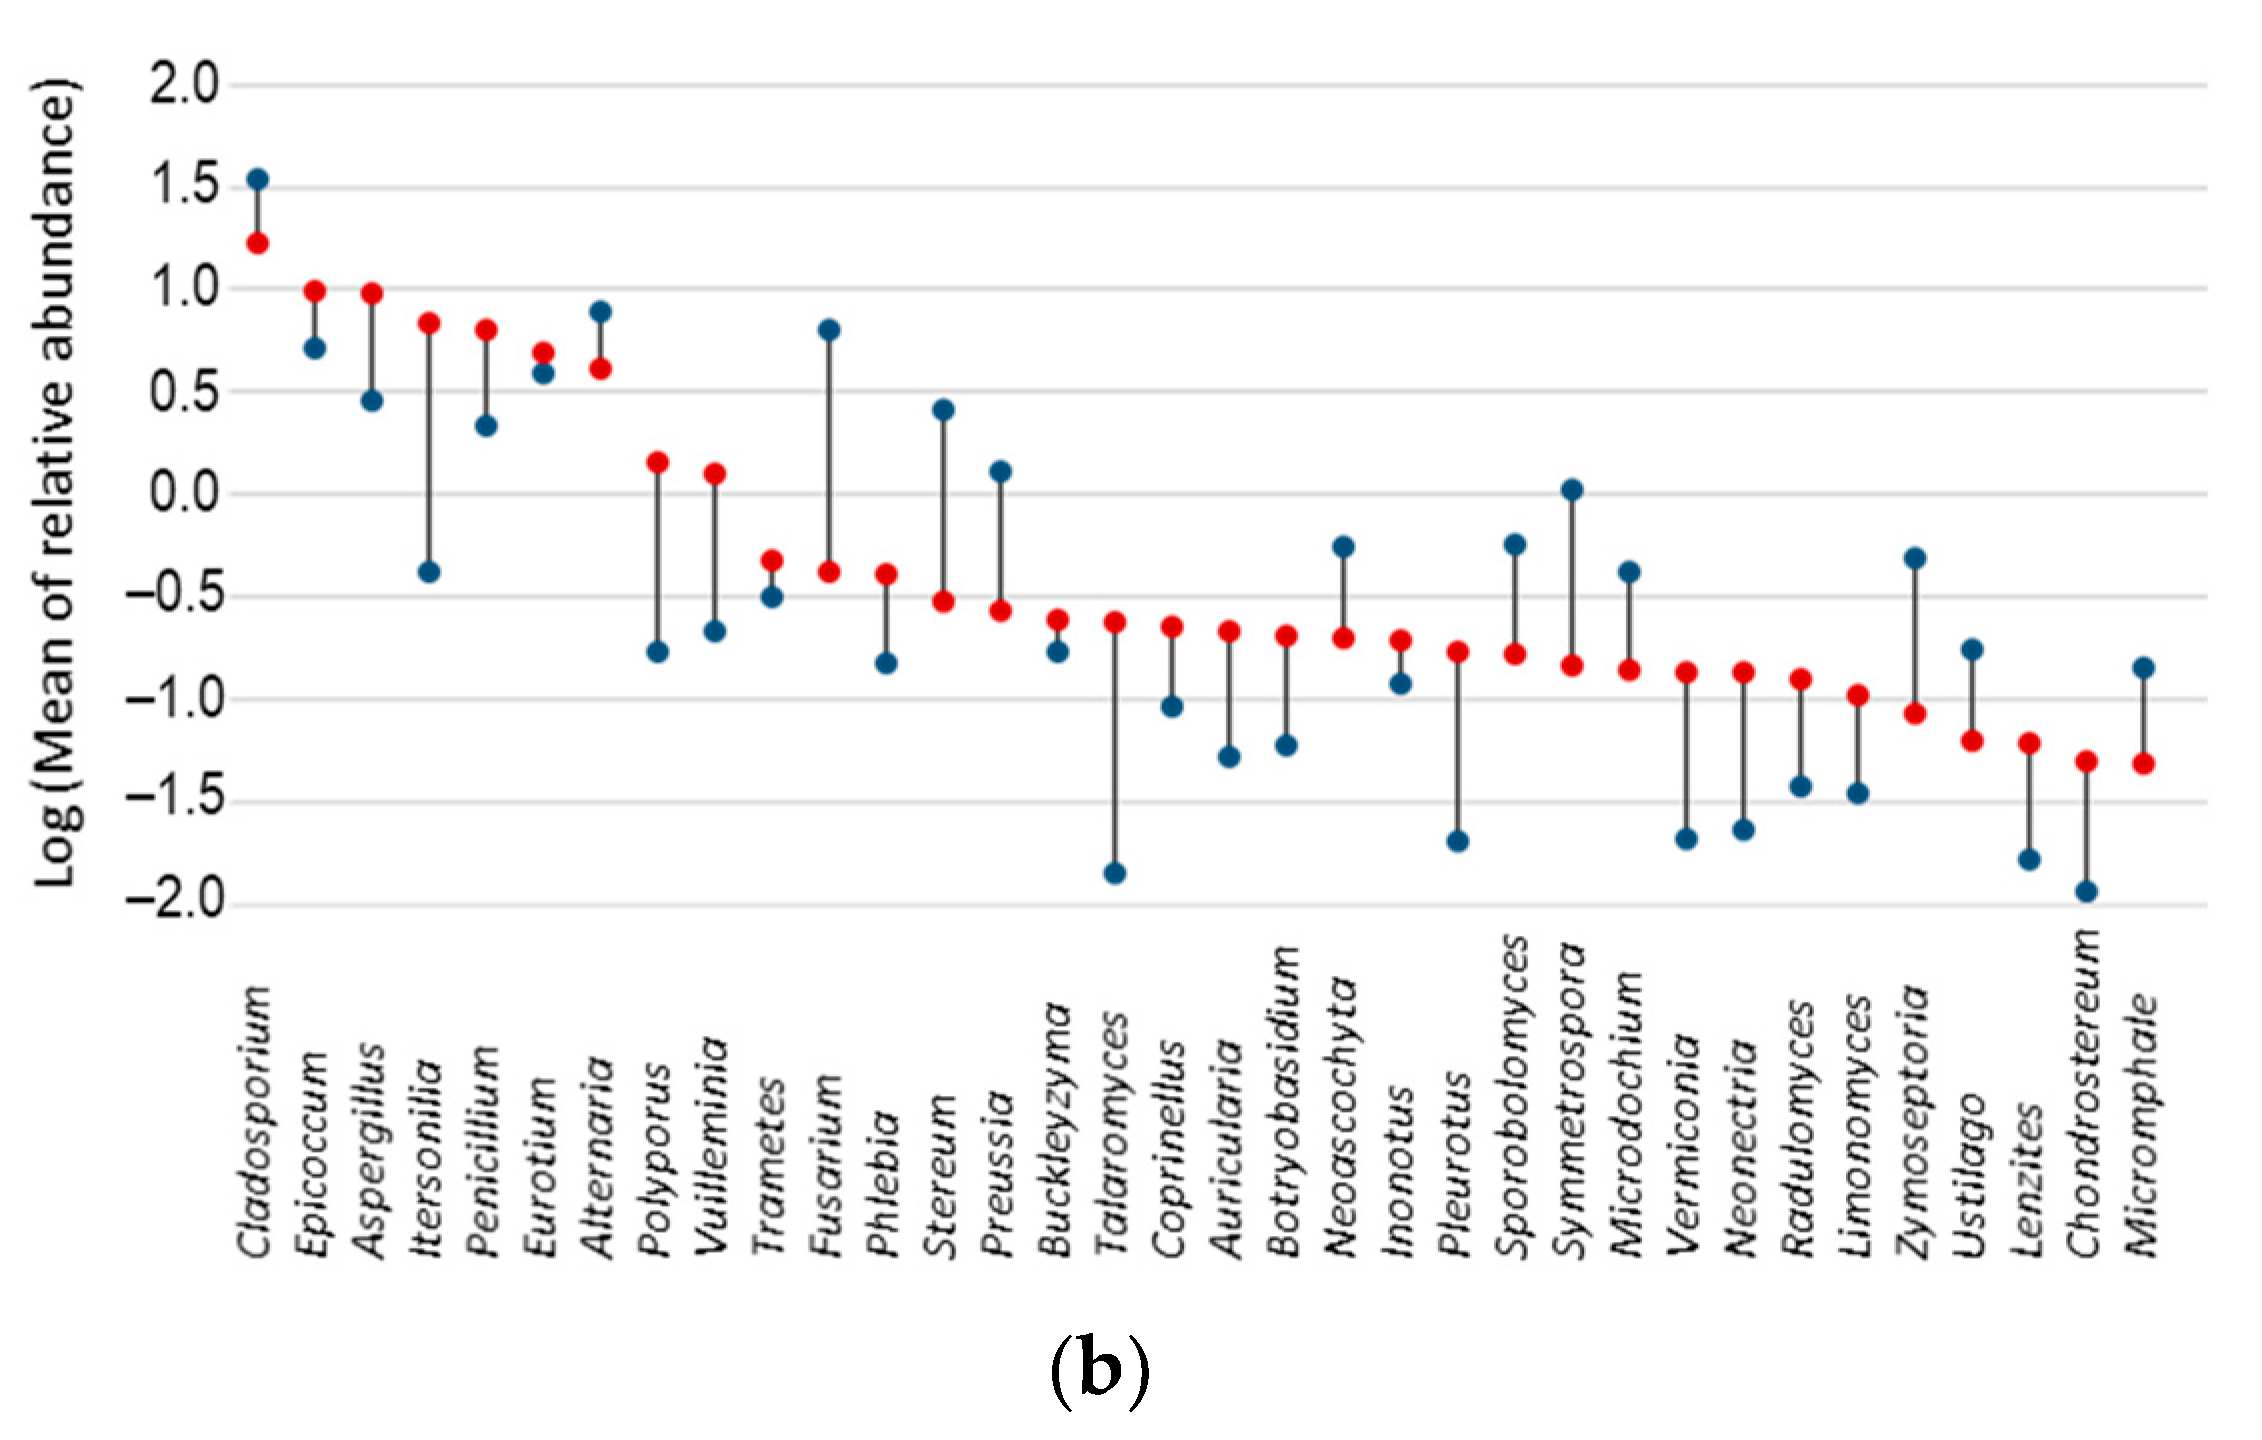
3.5. Fungal Indicator Taxa associated with Seasons

The most abundant taxa detected in samples by next generation sequencing—Cladosporium, Penicillium, Alternaria, Epicoccum, Eurotium, Itersonilia, Aspergillus and Fusarium—were also the most frequently detected in samples (in 100%, 99%, 99%, 98%, 98%, 95%, 94%, and 92% of samples, respectively). However, the range of their relative abundance in samples was significantly different between the unheated and heating periods: Aspergillus, Epicoccum, Itersonilia, Penicillium and Eurotium were among those with the highest relative abundance in samples during the heating period, while Cladosporium, Alternaria and Fusarium accounted for those with a greater number of reads in samples collected during the unheated season (Figure 3). A total of 109 of the 248 taxa identified showed significant differences in their frequency or/and relative abundance in the samples between the unheated and heating periods. Of these, 89 taxa showed a significant difference in frequency between the unheated and heating periods, of which only three were more frequent during the unheated than during the heating period (Figure 4a). Thirty-four taxa showed a significant difference in their relative abundance between the unheated and heating periods, of which 22 taxa were more abundant during the heating period and 12 were more abundant during the unheated period (Figure 4b). Fourteen taxa showed a significant difference between the unheated and heating periods in both frequency (presence/absence) and relative abundance.

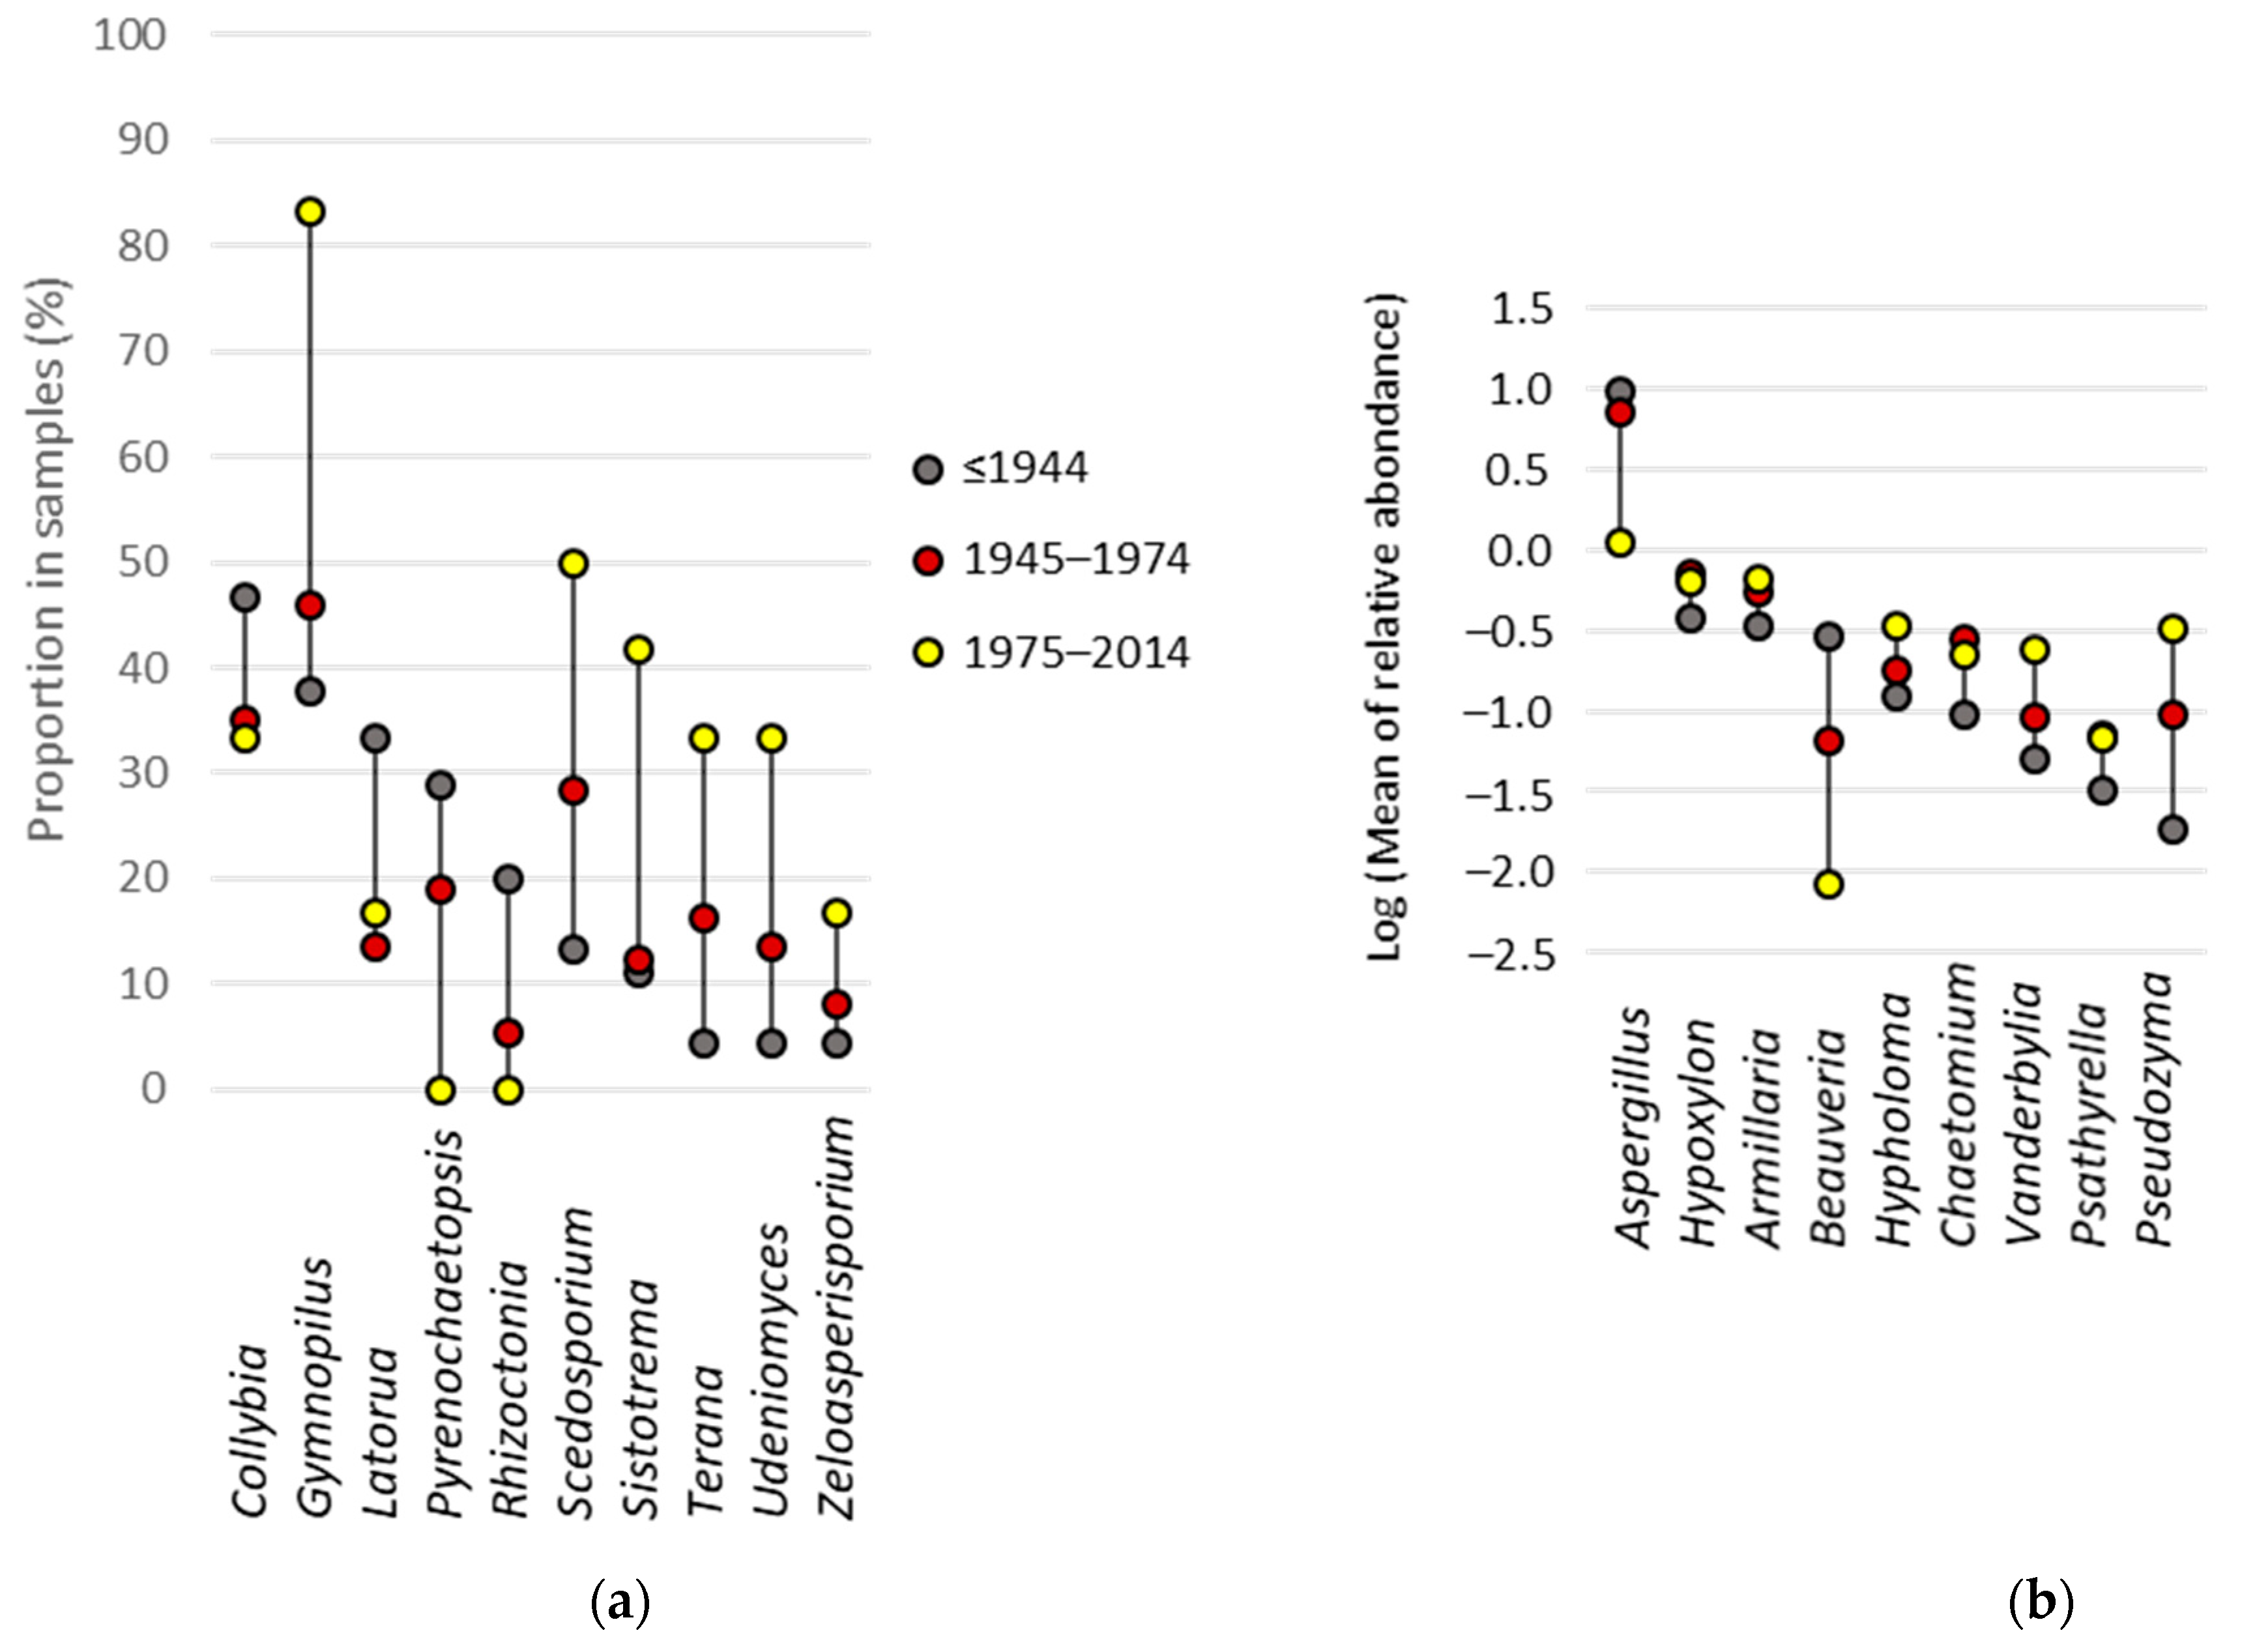
3.6. Fungal Indicator Taxa associated with the Construction Period of the Building

Among the 19 taxa identified as indicators of building age categories, 10 varied in the frequency with which they have been detected in buildings of different ages and nine in their relative abundance. The frequency of these taxa in samples increased with building age for three taxa and decreased with building age for six taxa (Figure 5a); only one taxon, Latorua, did not show such association. In addition, the relative abundance increased with building age for Aspergillus and Beauveria (Figure 5b), and decreased with building age for Armillaria, Hypholoma, Vanderbylia and Pseudozyma. Two of those, Armillaria and Hypholoma, were also among the genera with the highest prevalence in the samples (83% and 63%, respectively).

3.7. Fungal Indicator Taxa associated with the Building Environment

The urban landscape gradient—from peri-urban to lakefront—was correlated with a decrease in relative abundance of 11 taxa: Coriolopsis (Coef. = −0.509 p = 0.026), Daldinia (Coef. = −0.188 p = 0.030), Datronia (Coef. = −0.032 p = 0.038), Hypoxylon (Coef. = −0.132 p = 0.015), Microdochium (Coef. = −0.070 p = 0.024), Panus (Coef. = −0.029 p = 0.047), Phlebia (Coef. = −0.085 p = 0.022), Polyporus (Coef. = −0.375 p = 0.035), Shizophyllom (Coef. = −0.062 p = 0.050), Trametes (Coef. = −0.028 p = 0.028), and Vuilleminia (Coef. = −10.324 p = 0.019). Nevertheless, the component of the building environment that most affected the composition of the fungal community was the proximity to vegetation (presence of vegetation patches at 100 m). Proximity to vegetation was significantly correlated with the frequency in samples of 24 taxa (Figure 6a), the relative abundance of 26 taxa during the unheated period (Figure 6c), and 17 taxa during the heating period (Figure 6d). Interestingly, while the presence of green space in the dwellings’ surroundings was associated with higher frequency for 45% of taxa, it was associated with higher relative abundance of fungi for 92% of taxa during the unheated period and 82% during the heating period (Figure 6). The distribution of relative abundance among samples is illustrated for the most abundant taxa in Figure 6b.

4. Discussion

In this study, we monitored building-associated fungi by culture and metabarcoding in dwellings along an urban to rural gradient to determine the extent to which season and urban landscape influence fungal assemblages by accounting for the period of building construction. Our results support that within a diverse urban landscape, indoor fungal communities are shaped differently by building characteristics and outdoor factors. Season was associated with distinct values of species richness and load of cultivable fungi. The period of building construction and proximity to green space shaped the fungal community composition as well as the heating period. Moreover, the distance of the building from the lake correlated with the load of Penicillium in culture.
The culturing of environmental samples is the most commonly used method to quantify indoor fungal loads. The present study confirmed that the most common cultivable indoor fungi in a Swiss city are those already reported in cities in neighboring countries—Penicillium, Aspergillus, and Cladosporium [58]. Penicillium and Aspergillus species are of particular interest because these genera have often been identified as dominant indoor fungi in damp homes, and their concentrations exceed those in outdoor environments [27]. Our results confirmed the seasonal effect on the cultivable fungal load previously described, with higher abundance of Penicillium during the heating than during the unheated period [59]. The significantly higher concentration of Penicillium in dwellings built after 1975—dwellings that differ from those built before by slab, wall and window insulation—suggests that this seasonal effect could be due to insufficient ventilation; the buildings are too airtight and air renewal is conditioned by the users’ habit of opening the window. In parallel, the higher concentration of Penicillium in buildings near the lake suggests a contribution of the relative humidity of outdoor air, which is of 66% during the unheated period and can reach 78% during the heated period [60], to indoor air humidity. Unfortunately, we were unable to assess the contribution of each of these factors by adding season, building construction period and urban landscape clusters in the same model, because the number of sampled buildings was insufficient. Nevertheless, it is known that both the insulation of naturally ventilated buildings and the relative humidity of the air contribute directly and indirectly to availability of water for fungi [61]. Therefore, water availability is generally the limiting factor for fungal growth indoors, as because sufficient nutrients are provided to support fungal growth on dust particles. The increase in the concentration of cultivable Penicillium in indoor dust points in this direction, as such an increase has been associated with water damage [58]. However, the lack of correlation between the concentration of fungi detected by culture and visible molds did not allowed us to confirm this link. Such a discrepancy has been so consistently reported that Reboux et al. have concluded that observing the extent of moldy surfaces in a given dwelling is less reliable and less accurate than measuring fungal concentrations in the air for detecting hidden mould [58].
Metabarcoding offers the opportunity to more accurately assess potential exposures resulting from the built environment, as it reveals not only spores, but also the hyphae fragments present in indoor air. Therefore, we characterized the diversity and richness of indoor fungal in a well-represented urban landscape. Fungal diversity and richness were both found to be significantly higher in dwellings during the heating period than during the unheated period. This is in agreement with the results of the previous study of Adams et al. [33], who showed that during the unheated period, outdoor fungi make indoor fungal assemblages more similar to each other, whereas housing specificities are revealed during the heating period. Nevertheless, our data support that season is a greater contributer to mycobiome richness and diversity than the density of green area within a 100 m buffer zone, in contrast to previous reports [25]. Furthermore, while the decrease in diversity during the unheated period has previously been suggested to be related to an influx of high amounts of a few taxa, such as Cladosporium and Alternaria [25], no such association was observed in our data. Thus, while Cladosporium, Alternaria, Fusarium and Pithomyces do account for a large number of reads in samples collected during the unheated season, Aspergillus, Epicoccum, Itersonilia, Penicillium and Eurotium also account for a large number during the heating season. Regarding the source of these dominant taxa, previous studies have suggested an outdoor origin for some fungi, in particular in the presence of plants, such as for Cladosporium, Alternaria, Fusarium and Pithomyces, and an indoor origin for others where moisture damage has been observed in dwellings, such as for Aspergillus and Penicillium [62,63]. Nevertheless, it cannot be excluded that different sources contribute to the relative abundance of certain taxa. An example is Cladosporium. While outdoor air is the source of the majority of Cladosporium species found in indoor air (e.g., C. cladosporioides, C. herbarum) [64,65], moisture damage favors the development on indoor surfaces of other Cladosporium, such as C. sphaerospermum [64]. Note that our sampling design intentionally removed some sources of variation in the buildings, including the occupancy density and occupants’ behavior, type of heating, type of ventilation, type of houses, etc. Therefore, these factors cannot contribute to the variation in mycobiome composition observed in the study during the heating period.
Building materials and construction methods (e.g., isolation material, ventilation system) have changed over time [29,66]. These differences have been associated with a different composition of fungal community [66,67]. Thus, older properties have been shown to need more maintenance to prevent the ingress of water [68], while dwellings constructed after 1975 are too airtight, which favors the accumulation of humidity in indoor air [69]. Nevertheless, the period of building construction is an indicator that has rarely been considered in recent metabarcoding studies [25]. Our findings support the importance of building age in structuring the indoor mycobiome and the small effect of the built environment, findings that are in agreement with the study by Weikl et al. [25]. Thus, while the age of the building is significantly associated with the composition of fungal communities, the density of buildings and roads in building surroundings has no effect on them. By identifying the indicators’ fungal species, we were able to go a step further, allowing us to see the association between the period of building construction and the relative abundance of Aspergillus—a taxon frequently associated with respiratory outcomes. The consistency of this finding is supported by the report of a significant difference in the concentration of Aspergillus/Penicillium spores, which was found to be higher in buildings over 90 years old than in properties 31 to 60 years old [27]. The growth of Aspergillus on indoor materials is well documented. Depending on the species and the water activity of the substrate, Aspergillus can also be a primary, secondary or tertiary colonizer of indoor surfaces. It grows preferentially on concrete or plaster [67].
It has been suggested previously that the geographic location of buildings shapes the composition of fungal communities [31]. We did not find such a strong effect of urban landscape on indoor fungal communities in Lausanne. Only one component of the urban landscape significantly seemed to be associated with a distinct composition of the indoor fungal community, namely the proximity of vegetation. Our findings confirm the importance of the vegetation in a 100 m buffer zone around urban buildings in shaping the composition of the indoor microbiome, as previously proposed by Weikl et al. for an urban area in Munich [25].
Human skin is widely colonized with mycobionts [70], which can be transferred from skin to indoor air. Nevertheless, these taxa have been rarely reported (less than 6% of all sequences or clones) in metabarcoding studies [33,71]. The cause could be that indoor air seems to be the vector rather than the recipient [31]. Therefore, we focus specifically on human associated fungi to detect the impact of the environment on their prevalence and abundance in EBC. Interestingly, we detected five of the genera usually associated with human skin in a majority of indoor environments—Candida (78% of samples), Cryptococcus (97% of samples), Debaromyces (70% of samples), Malassezia (92% of samples) and Rhodotorula (63% of samples). Two taxa showed a seasonal pattern, with a higher frequency during the heating than during the unheated period: Candida (p = 0.019, 84% vs. 67%),) and Rhodotorula (p = 0.016, 71% vs. 50%), suggesting the contribution of the inhabitants’ skin microbiota to the indoor air mycobiome. However, three of them—Candida (p = 0.03, 0.80 ± 1.5 vs. 0.32 ± 0.44), Cryptococcus (p = 0.010%; 1.3 ± 1.2 vs. 2.6 ± 4.0) and Rhodotorula (p = 0.045%; 0.50 ± 0.86 vs. 0.21 ± 0.28)—were more abundant in dwellings without nearby vegetation, suggesting that skin-associated taxa in the indoor air mycobiome may also originate from the outdoor environment, as suggested by Tong et al. [31].

5. Conclusions

In summary, our study provides evidence that culture and metabarcoding have provided additional and novel information about how buildings and the urban landscape shape indoor fungal communities. For the most studied taxa in indoor air—Aspergillus and Penicillium—cultivation showed an increase in Penicillium spore concentration when the building was constructed after 1975 or when it was closer to the lake, while metabarcoding showed that the relative abundance of Aspergillus increased with building age. However, metabarcoding provides more detail on the factors that shape the indoor fungal community composition. For example, we showed that proximity to vegetation has a significant influence on indoor fungal community structure that is masked by the effects of building age and sampling season. Nevertheless, the level of urbanization had limited influence.

Author Contributions

Conceptualization, H.N.-H. and P.W.; methodology, H.N.-H. and P.W.; data extraction and SIG analysis, A.H.H.; formal analysis, H.N.-H. and P.W.; investigation, H.N.-H. resources, H.N.-H.; writing—original draft preparation, H.N.-H. and P.W.; writing—review and editing, H.N.-H. All authors have read and agreed to the published version of the manuscript.

Funding

This research received no external funding.

Institutional Review Board Statement

The study was conducted in accordance with the Declaration of Helsinki, and approved by the Ethics Committee of the canton of Vaud (initial protocol code 19/04; 2014, amendment approved 23 June 2014).

Informed Consent Statement

Informed consent was obtained from all subjects involved in the study.

Data Availability Statement

The data presented in this study are available on request from the corresponding author. The data are not publicly available due their partial use in the present publication.

Acknowledgments

We thank Brigitte Santos-Eggimann for submitting the amendment concerning this study to the Vaud Ethics Committee and for anonymizing the data, all members of her group involved in collecting data and in the distributing the electrostatic dust collectors, and Dessislava Savova Bianchi for her assistance with the laboratory work.

Conflicts of Interest

The authors declare that they have no conflicts of interest. The funders had no role in the design of the study; in the collection, analyses, or interpretation of data; in the writing of the manuscript, or in the decision to publish the results.

References

  1. Klepeis, N.E.; Nelson, W.C.; Ott, W.R.; Robinson, J.P.; Tsang, A.M.; Switzer, P.; Behar, J.V.; Hern, S.C.; Engelmann, W.H. The National Human Activity Pattern Survey (NHAPS): A resource for assessing exposure to environmental pollutants. J. Expo. Anal. Environ. Epidemiol. 2001, 11, 231–252. [Google Scholar] [CrossRef] [Green Version]
  2. Reponen, T.; Lockey, J.; Bernstein, D.I.; Vesper, S.J.; Levin, L.; Hershey, G.K.K.; Zheng, S.; Ryan, P.; Grinshpun, S.A.; Villareal, M.; et al. Infant origins of childhood asthma associated with specific molds. J. Allergy Clin. Immunol. 2012, 130, 639–644. [Google Scholar] [CrossRef] [Green Version]
  3. Sharpe, R.A.; Bearman, N.; Thornton, C.R.; Husk, K.; Osborne, N.J. Indoor fungal diversity and asthma: A meta-analysis and systematic review of risk factors. J. Allergy Clin. Immunol. 2015, 135, 110–122. [Google Scholar] [CrossRef] [PubMed]
  4. Karvala, K.; Toskala, E.; Luukkonen, R.; Lappalainen, S.; Uitti, J.; Nordman, H. New-onset adult asthma in relation to damp and moldy workplaces. Int. Arch. Occ. Environ. Health 2010, 83, 855–865. [Google Scholar] [CrossRef] [PubMed]
  5. Ege, M.J.; Mayer, M.; Normand, A.C.; Genuneit, J.; Cookson, W.O.C.M.; Braun-Fahrlander, C.; Heederik, D.; Piarroux, R.; von Mutius, E.; Grp, G.T.S. Exposure to environmental microorganisms and childhood asthma. N. Engl. J. Med. 2011, 364, 701–709. [Google Scholar] [CrossRef] [PubMed]
  6. Dannemiller, K.C.; Mendell, M.J.; Macher, J.M.; Kumagai, K.; Bradman, A.; Holland, N.; Harley, K.; Eskenazi, B.; Peccia, J. Next-generation DNA sequencing reveals that low fungal diversity in house dust is associated with childhood asthma development. Indoor Air 2014, 24, 236–247. [Google Scholar] [CrossRef] [Green Version]
  7. Fujimura, K.E.; Demoor, T.; Rauch, M.; Faruqi, A.A.; Jang, S.; Johnson, C.C.; Boushey, H.A.; Zoratti, E.; Ownby, D.; Lukacs, N.W.; et al. House dust exposure mediates gut microbiome Lactobacillus enrichment and airway immune defense against allergens and virus infection. Proc. Natl. Acad. Sci. USA 2014, 111, 805–810. [Google Scholar] [CrossRef] [Green Version]
  8. Lynch, S.V.; Wood, R.A.; Boushey, H.; Bacharier, L.B.; Bloomberg, G.R.; Kattan, M.; O’Connor, G.T.; Sandel, M.T.; Calatroni, A.; Matsui, E.; et al. Effects of early-life exposure to allergens and bacteria on recurrent wheeze and atopy in urban children. J. Allergy Clin. Immunol. 2014, 134, 593–601. [Google Scholar] [CrossRef] [Green Version]
  9. Schaub, B.; Vercelli, D. Environmental protection from allergic diseases: From humans to mice and back. Curr. Opin. Immunol. 2015, 36, 88–93. [Google Scholar] [CrossRef]
  10. Hooks, K.B.; O’Malley, M.A. Dysbiosis and Its Discontents. mBio 2017, 8, e01492-17. [Google Scholar] [CrossRef]
  11. Vesper, S.; Barnes, C.; Ciaccio, C.E.; Johanns, A.; Kennedy, K.; Murphy, J.S.; Nunez-Alvarez, A.; Sandel, M.T.; Cox, D.; Dewalt, G.; et al. Higher Environmental Relative Moldiness Index (ERMI) values measured in homes of asthmatic children in Boston, Kansas City, and San Diego. J. Asthma 2013, 50, 155–161. [Google Scholar] [CrossRef] [PubMed] [Green Version]
  12. Schoch, C.L.; Seifert, K.A.; Huhndorf, S.; Robert, V.; Spouge, J.L.; Levesque, C.A.; Chen, W.; Bolchacova, E.; Voigt, K.; Crous, P.W.; et al. Nuclear ribosomal internal transcribed spacer (ITS) region as a universal DNA barcode marker for Fungi. Proc. Natl. Acad. Sci. USA 2012, 109, 6241–6246. [Google Scholar] [CrossRef] [PubMed] [Green Version]
  13. Coombs, K.; Vesper, S.; Green, B.J.; Yermakov, M.; Reponen, T. Fungal microbiomes associated with green and non-green building materials. Int. Biodeterior. Biodegrad. 2017, 125, 251–257. [Google Scholar] [CrossRef] [PubMed] [Green Version]
  14. Gravesen, S.; Nielsen, P.A.; Iversen, R.; Nielsen, K.F. Microfungal contamination of damp buildings-Examples of risk constructions and risk materials. Environ. Health Perspect. 1999, 107, 505–508. [Google Scholar] [CrossRef]
  15. Hoang, C.P.; Kinney, K.A.; Corsi, R.L.; Szaniszlo, P.J. Resistance of green building materials to fungal growth. Int. Biodeterior. Biodegrad. 2010, 64, 104–113. [Google Scholar] [CrossRef]
  16. Hyvarinen, A.; Meklin, T.; Vepsalainen, A.; Nevalainen, A. Fungi and actinobacteria in moisture-damaged building materials-concentrations and diversity. Int. Biodeterior. Biodegrad. 2002, 49, 27–37. [Google Scholar] [CrossRef]
  17. Lax, S.; Cardona, C.; Zhao, D.; Winton, V.J.; Goodney, G.; Gao, P.; Gottel, N.; Hartmann, E.M.; Henry, C.; Thomas, P.M.; et al. Microbial and metabolic succession on common building materials under high humidity conditions. Nat. Commun. 2019, 10, 1767. [Google Scholar] [CrossRef] [Green Version]
  18. Pasanen, A.L.; Juutinen, T.; Jantunen, M.J.; Kalliokoski, P. Occurrence and moisture requirements of microbial-growth in building-materials. Int. Biodeterior. Biodegrad. 1992, 30, 273–283. [Google Scholar] [CrossRef]
  19. Gopalakrishnan, S.; Arigela, R.; Gupta, S.K.; Raghunathan, R. Dynamic response of passive release of fungal spores from exposure to air. J. Aerosol Sci. 2019, 133, 37–48. [Google Scholar] [CrossRef]
  20. Niculita-Hirzel, H.; Yang, S.; Hager Jörin, C.; Perret, V.; Licina, D.; Goyette Pernot, J. Moulds contamination in energy efficient dwellings. Role of ventilation type and of rural /urban location. Int. J. Environ. Res. Public Health 2020, 17, 4936. [Google Scholar] [CrossRef]
  21. Lee, L.D.; Hachem, R.Y.; Berkheiser, M.; Hackett, B.; Jiang, Y.; Raad, I.I. Hospital environment and invasive aspergillosis in patients with hematologic malignancy. Am. J. Infect. Control 2012, 40, 247–249. [Google Scholar] [CrossRef] [PubMed]
  22. Dales, R.E.; Miller, D.; McMullen, E. Indoor air quality and health: Validity and determinants of reported home dampness and moulds. Int. J. Epidemiol. 1997, 26, 120–125. [Google Scholar] [CrossRef] [PubMed] [Green Version]
  23. Kettleson, E.M.; Adhikari, A.; Vesper, S.; Coombs, K.; Indugula, R.; Reponen, T. Key determinants of the fungal and bacterial microbiomes in homes. Environ. Res. 2015, 138, 130–135. [Google Scholar] [CrossRef] [Green Version]
  24. Norback, D.; Zock, J.P.; Plana, E.; Heinrich, J.; Tischer, C.; Bertelsen, R.J.; Sunyer, J.; Kunzli, N.; Villani, S.; Olivieri, M.; et al. Building dampness and mold in European homes in relation to climate, building characteristics and socio-economic status: The European Community Respiratory Health Survey ECRHS II. Indoor Air 2017, 27, 921–932. [Google Scholar] [CrossRef] [PubMed]
  25. Weikl, F.; Tischer, C.; Probst, A.J.; Heinrich, J.; Markevych, I.; Jochner, S.; Pritsch, K. Fungal and bacterial communities in indoor dust follow different environmental determinants. PLoS ONE 2016, 11, e0154131. [Google Scholar] [CrossRef]
  26. Dharmage, S.; Bailey, M.; Raven, J.; Mitakakis, T.; Thien, F.; Forbes, A.; Guest, D.; Abramson, M.; Walters, E.H. Prevalence and residential determinants of fungi within homes in Melbourne, Australia. Clin. Exp. Allergy 1999, 29, 1481–1489. [Google Scholar] [CrossRef] [Green Version]
  27. Fairs, A.; Wardlaw, A.J.; Thompson, J.R.; Pashley, C.H. Guidelines on Ambient Intramural Airborne Fungal Spores. J. Investig. Allergy Clin. 2010, 20, 490–498. [Google Scholar]
  28. Du, C.Q.; Li, B.Z.; Yu, W.; Cai, J.; Wang, L.X.; Li, X.Y.; Yao, Y.H.; Li, B.C. Evaluating the effect of building construction periods on household dampness/mold and childhood diseases corresponding to different energy efficiency design requirements. Indoor Air 2021, 31, 541–556. [Google Scholar] [CrossRef]
  29. Schwab, S.; Rinquet, J.-L. Approche Globale Pour L’enveloppe du Bâtiment. Renovation Énergétique; Haute école d’ingénierie et d’architecture de Fribourg: Fribourg, Switzerland, 2016. [Google Scholar]
  30. Mahnert, A.; Ortega, R.A.; Berg, C.; Grebe, M.; Berg, G. Leaves of indoor ornamentals are biodiversity and functional hotspots for fungi. Front. Microbiol. 2018, 9, 2343. [Google Scholar] [CrossRef]
  31. Tong, X.; Leung, M.H.Y.; Wilkins, D.; Lee, P.K.H. City-scale distribution and dispersal routes of mycobiome in residences. Microbiome 2017, 5, 131. [Google Scholar] [CrossRef] [Green Version]
  32. Bernstein, R.S.; Sorenson, W.G.; Garabrant, D.; Reaux, C.; Treitman, R.D. Exposures to respirable, airborne Penicillium from a contaminated ventilation system-clinical, environmental and epidemiological aspects. Am. Ind. Hyg. Assoc. J. 1983, 44, 161–169. [Google Scholar] [CrossRef] [PubMed]
  33. Adams, R.I.; Miletto, M.; Taylor, J.W.; Bruns, T.D. Dispersal in microbes: Fungi in indoor air are dominated by outdoor air and show dispersal limitation at short distances. ISME J. 2013, 7, 1262–1273. [Google Scholar] [CrossRef] [PubMed] [Green Version]
  34. Barberan, A.; Ladau, J.; Leff, J.W.; Pollard, K.S.; Menninger, H.L.; Dunn, R.R.; Fierer, N. Continental-scale distributions of dust-associated bacteria and fungi. Proc. Natl. Acad. Sci. USA 2015, 112, 5756–5761. [Google Scholar] [CrossRef] [PubMed] [Green Version]
  35. Amend, A.S.; Seifert, K.A.; Samson, R.; Bruns, T.D. Indoor fungal composition is geographically patterned and more diverse in temperate zones than in the tropics. Proc. Natl. Acad. Sci. USA 2010, 107, 13748–13753. [Google Scholar] [CrossRef] [Green Version]
  36. Yamamoto, N.; Bibby, K.; Qian, J.; Hospodsky, D.; Rismani-Yazdi, H.; Nazaroff, W.W.; Peccia, J. Particle-size distributions and seasonal diversity of allergenic and pathogenic fungi in outdoor air. ISME J. 2012, 6, 1801–1811. [Google Scholar] [CrossRef] [Green Version]
  37. Grinn-Gofron, A.; Bosiacka, B. Effects of meteorological factors on the composition of selected fungal spores in the air. Aerobiologia 2015, 31, 63–72. [Google Scholar] [CrossRef] [Green Version]
  38. Oliveira, M.; Ribeiro, H.; Delgado, J.; Abreu, I. The effects of meteorological factors on airborne fungal spore concentration in two areas differing in urbanisation level. Int. J. Biometeorol. 2009, 53, 61–73. [Google Scholar] [CrossRef]
  39. Oliveira, M.; Ribeiro, H.; Delgado, J.L.; Abreu, I. Seasonal and intradiurnal variation of allergenic fungal spores in urban and rural areas of the North of Portugal. Aerobiologia 2009, 25, 85–98. [Google Scholar] [CrossRef]
  40. Pellissier, L.; Oppliger, A.; Hirzel, A.H.; Savova-Bianchi, D.; Mbayo, G.; Mascher, F.; Kellenberger, S.; Niculita-Hirzel, H. Airborne and grain dust fungal community compositions are shaped regionally by plant genotypes and farming practices. Appl. Environ. Microbiol. 2016, 82, 2121–2131. [Google Scholar] [CrossRef] [Green Version]
  41. Lymperopoulou, D.S.; Adams, R.I.; Lindow, S.E. Contribution of vegetation to the microbial composition of nearby outdoor air. Appl. Environ. Microbiol. 2016, 82, 3822–3833. [Google Scholar] [CrossRef] [Green Version]
  42. Kozdroj, J.; Fraczek, K.; Ropek, D. Assessment of bioaerosols in indoor air of glasshouses located in a botanical garden. Build. Environ. 2019, 166, 106436. [Google Scholar] [CrossRef]
  43. Hameed, A.A.A.; Khodr, M.I. Suspended particulates and bioaerosols emitted from an agricultural non-point source. J. Environ. Monit. 2001, 3, 206–209. [Google Scholar] [CrossRef] [PubMed]
  44. Yang, S.; Goyette Pernot, J.; Hager Jörin, C.; Niculita-Hirzel, H.; Perret, V.; Licina, D. Energy, indoor air quality, occupant behavior, self-reported symptoms and satisfaction in energy-efficient dwellings in Switzerland. Build. Environ. 2020, 171, 106618. [Google Scholar] [CrossRef]
  45. Schweiker, M.; Haldi, F.; Shukuya, M.; Robinson, D. Verification of stochastic models of window opening behaviour for residential buildings. J. Build. Perform. Simu. 2012, 5, 55–74. [Google Scholar] [CrossRef]
  46. Fabi, V.; Andersen, R.V.; Corgnati, S.; Olesen, B.W. Occupants’ window opening behaviour: A literature review of factors influencing occupant behaviour and models. Build. Environ. 2012, 58, 188–198. [Google Scholar] [CrossRef]
  47. Santos-Eggimann, B.; Karmaniola, A.; Seematter-Bagnoud, L.; Spagnoli, J.; Bula, C.; Cornuz, J.; Rodondi, N.; Vollenweider, P.; Waeber, G.; Pecoud, A. The Lausanne cohort Lc65+: A population-based prospective study of the manifestations, determinants and outcomes of frailty. BMC Geriatr. 2008, 8, 20. [Google Scholar] [CrossRef] [Green Version]
  48. Noss, I.; Wouters, I.M.; Visser, M.; Heederik, D.J.; Thorne, P.S.; Brunekreef, B.; Doekes, G. Evaluation of a low-cost electrostatic dust fall collector for indoor air endotoxin exposure assessment. Appl. Environ. Microbiol. 2008, 74, 5621–5627. [Google Scholar] [CrossRef] [Green Version]
  49. Frankel, M.; Timm, M.; Hansen, E.W.; Madsen, A.M. Comparison of sampling methods for the assessment of indoor microbial exposure. Indoor Air 2012, 22, 405–414. [Google Scholar] [CrossRef]
  50. Normand, A.C.; Ranque, S.; Cassagne, C.; Gaudart, J.; Sallah, K.; Charpin, D.A.; Piarroux, R. Comparison of Air Impaction and Electrostatic Dust Collector sampling methods to assess airborne fungal contamination in public buildings. Ann. Occup. Hyg. 2016, 60, 161–175. [Google Scholar] [CrossRef]
  51. Barrera, C.; Rocchi, S.; Degano, B.; Soumagne, T.; Laurent, L.; Bellanger, A.P.; Laplante, J.J.; Millon, L.; Dalphin, J.C.; Reboux, G. Microbial exposure to dairy farmers’ dwellings and COPD occurrence. Int. J. Environ. Health Res. 2018, 29, 387–399. [Google Scholar] [CrossRef]
  52. Pitt, J.I. The Genus Penicillium and Its Teleomorphic States Eupenicillium and Talaromyces; Academic Press Inc. Ltd.: London, UK, 1979; p. 634. [Google Scholar]
  53. Samson, R.; Pitt, J. Advances in Penicillium and Aspergillus Systematics; Plenum Press: New York, NY, USA, 1986; p. 483. [Google Scholar]
  54. Caporaso, J.G.; Kuczynski, J.; Stombaugh, J.; Bittinger, K.; Bushman, F.D.; Costello, E.K.; Fierer, N.; Pena, A.G.; Goodrich, J.K.; Gordon, J.I.; et al. QIIME allows analysis of high-throughput community sequencing data. Nat. Methods 2010, 7, 335–336. [Google Scholar] [CrossRef] [PubMed]
  55. Koljalg, U.; Larsson, K.H.; Abarenkov, K.; Nilsson, R.H.; Alexander, I.J.; Eberhardt, U.; Erland, S.; Hoiland, K.; Kjoller, R.; Larsson, E.; et al. UNITE: A database providing web-based methods for the molecular identification of ectomycorrhizal fungi. New Phytol. 2005, 166, 1063–1068. [Google Scholar] [CrossRef] [PubMed]
  56. Porras-Alfaro, A.; Liu, K.L.; Kuske, C.R.; Xie, G. From Genus to Phylum: Large-Subunit and Internal Transcribed Spacer rRNA operon regions show similar classification accuracies influenced by database composition. Appl. Environ. Microbiol. 2014, 80, 829–840. [Google Scholar] [CrossRef] [PubMed] [Green Version]
  57. R Core Team. R: A Language and Environment for Statistical Computing. Available online: https://www.R-project.org/ (accessed on 30 August 2022).
  58. Reboux, G.; Rocchi, S.; Laboissiere, A.; Ammari, H.; Bochaton, M.; Gardin, G.; Rame, J.M.; Millon, L. Survey of 1012 moldy dwellings by culture fungal analysis: Threshold proposal for asthmatic patient management. Indoor Air 2019, 29, 5–16. [Google Scholar] [CrossRef] [PubMed] [Green Version]
  59. Basilico, M.D.L.Z.; Chiericatti, C.; Aringoli, E.E.; Althaus, R.L.; Basilico, J.C. Influence of environmental factors on airborne fungi in houses of Santa Fe city, Argentina. Sci. Total Environ. 2007, 376, 143–150. [Google Scholar] [CrossRef]
  60. MeteoSwiss. Climate Normals Pully. Available online: https://www.meteoswiss.admin.ch/product/output/climate-data/climate-diagrams-normal-values-station-processing/PUY/climsheet_PUY_np9120_e.pdf (accessed on 28 August 2022).
  61. Dannemiller, K.C.; Weschler, C.J.; Peccia, J. Fungal and bacterial growth in floor dust at elevated relative humidity levels. Indoor Air 2017, 27, 354–363. [Google Scholar] [CrossRef]
  62. Rocchi, S.; Valot, B.; Reboux, G.; Millon, L. DNA metabarcoding to assess indoor fungal communities: Electrostatic dust collectors and Illumina sequencing. J. Microbiol. Methods 2017, 139, 107–112. [Google Scholar] [CrossRef]
  63. Shin, S.K.; Kim, J.; Ha, S.M.; Oh, H.S.; Chun, J.; Sohn, J.; Yi, H. Metagenomic insights into the bioaerosols in the indoor and outdoor environments of childcare facilities. PLoS ONE 2015, 10, e0126960. [Google Scholar] [CrossRef]
  64. Taubel, M.; Karvonen, A.M.; Reponen, T.; Hyvarinen, A.; Vesper, S.; Pekkanen, J. Application of the environmental relative moldiness index in Finland. Appl. Environ. Microbiol. 2016, 82, 578–584. [Google Scholar] [CrossRef] [Green Version]
  65. Adam, R.I.; Bhangar, S.; Pasut, W.; Arens, E.A.; Taylor, J.W.; Lindow, S.E.; Nazaroff, W.W.; Bruns, T.D. Chamber bioaerosol study: Outdoor air and human occupants as sources of indoor airborne microbes. PLoS ONE 2015, 10, e0133221. [Google Scholar] [CrossRef] [Green Version]
  66. Sharpe, R.; Thornton, C.R.; Osborne, N.J. Modifiable factors governing indoor fungal diversity and risk of asthma. Clin. Exp. Allergy 2014, 44, 631–641. [Google Scholar] [CrossRef] [PubMed]
  67. Andersen, B.; Frisvad, J.C.; Sondergaard, I.; Rasmussen, I.S.; Larsen, L.S. Associations between fungal species and water-damaged building materials. Appl. Environ. Microbiol. 2011, 77, 4180–4188. [Google Scholar] [CrossRef] [PubMed] [Green Version]
  68. Howden-Chapman, P.; Saville-Smith, K.; Crane, J.; Wilson, N. Risk factors for mold in housing: A national survey. Indoor Air 2005, 15, 469–476. [Google Scholar] [CrossRef] [PubMed]
  69. Niculita-Hirzel, H. Latest trends in pollutant accumulations at threatening levels in energy-efficient residential buildings with and without mechanical ventilation: A Review. Int. J. Environ. Res. Public Health 2022, 19, 3538. [Google Scholar] [CrossRef]
  70. Findley, K.; Oh, J.; Yang, J.; Conlan, S.; Deming, C.; Meyer, J.A.; Schoenfeld, D.; Nomicos, E.; Park, M.; Kong, H.H.; et al. Topographic diversity of fungal and bacterial communities in human skin. Nature 2013, 498, 367–370. [Google Scholar] [CrossRef] [Green Version]
  71. Hanson, B.; Zhou, Y.J.; Bautista, E.J.; Urch, B.; Speck, M.; Silverman, F.; Muilenberg, M.; Phipatanakul, W.; Weinstock, G.; Sodergren, E.; et al. Characterization of the bacterial and fungal microbiome in indoor dust and outdoor air samples: A pilot study. Environ. Sci.-Process Impacts 2016, 18, 713–724. [Google Scholar] [CrossRef]
Figure 1. Geographical location of the buildings for which the mycobiome was characterized, in black for those for which molecular and cultivable data were obtained, and in red for those for which only the culture provided results. Their belonging to an environmental typology is indicated by a triangle for peri-urban cluster, by a circle for the suburban cluster, by a plus for the historic downtown cluster, by a diamond for the lakefront downtown, and by a square for the lakefront. Elevation lines every 100 m and 20 m are indicated with thick and thin brown lines, respectively.
Jof 08 01045 g001
Figure 2. Visualization of the similarity in genus composition of fungal communities across the studied buildings. Each point represents the fungal community in a building, such that those that are closer together share more identified genera in common than those farther apart. Fungal community composition and relative abundance of genera tend to cluster according to season (a), period of building construction (b), or proximity to green space in the surroundings (c).
Jof 08 01045 g002
Figure 3. Boxplots showing distribution in relative abundance of the nine most abundant and frequent genera across samples. The values observed during the heating period are shown in red, and those during the unheated period are shown in blue. The whiskers in a box-and-whisker plot are the adjacent values that correspond to the highest value not greater than p75 + 3/2 IQR and the lowest value not less than p25 − 3/2 IQR, where IQR is the inter-quartile range, the box covers the values between the first and third quartile, and the line in the box marks the median value.
Jof 08 01045 g003
Figure 4. Visualization of the proportion (a) and log transformed mean relative abundance (b) of indoor fungal genera that differed significantly between the unheated and heating periods (p < 0.05). Values observed during the heating period are shown in red, and those observed during the unheated period are in blue.
Jof 08 01045 g004aJof 08 01045 g004b
Figure 5. Visualization of the proportion (a) and log transformed mean relative abundance (b) of indoor fungal genera that differed significantly between buildings constructed at different periods (p < 0.05). Shown in grey are taxa observed in buildings constructed before 1944, in red are those observed in buildings constructed between 1945 and 1974, and in yellow are taxa observed in buildings constructed between 1975 and 2014.
Jof 08 01045 g005
Figure 6. Visualization of the proportion (a) and mean log transformed relative abundance (c,d) of indoor fungal genera that differed significantly between buildings with and without green space in the surroundings (p < 0.05)—(c) during the unheated period (d) during the heating period. The distribution of relative abundance among samples is illustrated for few taxa in (b). In green, values for buildings with green space in the surroundings, and in black, values for buildings without green space in the surroundings.
Jof 08 01045 g006aJof 08 01045 g006b
Table 1. Characteristics of dwellings retained in the present study by comparison to those occupied by seniors of the overall cohort Lc65+.
Construction PeriodBuilding Environment ClusterTotal N (% in Column)
Periurban SuburbsHistorical Town CentreTown Centre near the LakeLake Shore
Seniors buildings in the cohort (N = 1881), N (% in line)
until 194461 (10.0)169 (28.8)276 (47.1)54 (9.2)26 (4.4)586 (31.2)
1945–1974313 (29.1)519 (48.2)149 (13.8)66 (6.1)30 (2.8)1077 (57.3)
1975–201453(24.3)130 (59.6) 27 (12.4)5 (2.3)3 (1.4)218 (11.6)
Seniors buildings analyzed by culture (N = 259), N (% in line)
until 194411 (11.6)29 (30.5)42 (44.2)9 (9.5)4 (4.2)95 (35.5)
1945–197434 (23.3)69 (47.3)31 (21.2)7 (4.8)5 (3.4)146 (54.5)
1975–201410 (37.0)13 (48.2)2 (7.4)2 (7.4)0 (0.0)27 (10.1)
Seniors buildings analyzed by sequencing (N = 131), N (% in line)
until 19444 (8.9)12 (26.7)22 (48.9)6 (13.3)1 (2.2)45 (34.3)
1945–197415 (20.3)33 (44.6)16 (21.6)4 (5.4)6 (8.1)74 (56.5)
1975–20142 (16.7)9 (75.0)1 (8.3)0 (0.0)0 (0.0)12 (9.6)
Table 2. Concentration of cultivable fungi, fungal diversity and richness in samples depending on sampling period and building construction period.
Total<19451945–19741975–2014p Value
Heating period
     Number of samples analyzed by culture1836510018
          Total CFUs per day, Mean ± SD26 ± 2024 ± 1725 ± 1740 ± 350.008
          Aspergillus CFUs per day, Mean ± SD3 ± 123 ± 113 ± 107 ± 230.497
          Penicillium CFUs per day, Mean ± SD10 ± 219 ± 199 ± 1722 ± 370.034
     Number of samples analyzed by metabarcoding8327488
          Shannon index, Mean ± SD3.5 ± 0.83.5 ± 0.93.5 ± 0.73.6 ± 0.60.947
          Fungal richness, Mean ± SD 94 ± 3499 ± 3191 ± 37102 ± 290.495
Unheated period
     Number of samples analyzed by culture7625438
          Total CFUs per day, Mean ± SD14 ± 1519 ± 2212 ± 119 ± 50.141
          Aspergillus CFUs per day, Mean ± SD4 ± 116 ± 153 ± 71 ± 20.453
          Penicillium CFUs per day, Mean ± SD4 ± 117 ± 174 ± 61 ± 20.267
     Number of samples analyzed by metabarcoding4818264
          Shannon index, Mean ± SD3.1 ± 0.63.1 ± 0.63.0 ± 0.73.2 ± 0.40.910
          Fungal richness, Mean ± SD 62 ± 3260 ± 2863 ± 3373 ± 490.790
Publisher’s Note: MDPI stays neutral with regard to jurisdictional claims in published maps and institutional affiliations.

