Article

ITS2 Sequencing and Targeted Meta-Proteomics of Infant Gut Mycobiome Reveal the Functional Role of Rhodotorula sp. during Atopic Dermatitis Manifestation

by
Kevin Mok
1,2,
Narissara Suratanon
3,
Sittiruk Roytrakul
4,
Sawanya Charoenlappanit
4,
Preecha Patumcharoenpol
5,6,
Pantipa Chatchatee
3,
Wanwipa Vongsangnak
5,6,* and
Massalin Nakphaichit
1,2,*
1
Department of Biotechnology, Faculty of Agro-Industry, Kasetsart University, Bangkok 10900, Thailand
2
Specialized Research Unit: Probiotics and Prebiotics for Health, Faculty of Agro-Industry, Kasetsart University, Bangkok 10900, Thailand
3
Pediatric Allergy & Clinical Immunology Research Unit, Division of Allergy and Immunology, Department of Pediatrics, Faculty of Medicine, Chulalongkorn University, King Chulalongkorn Memorial Hospital, The Thai Red Cross Society, Bangkok 10330, Thailand
4
Functional Ingredients and Food Innovation Research Group, National Center for Genetic Engineering and Biotechnology, National Science and Technology Development Agency, Pathum Thani 12120, Thailand
5
Department of Zoology, Faculty of Science, Kasetsart University, Bangkok 10900, Thailand
6
Omics Center for Agriculture, Bioresources, Food, and Health, Kasetsart University (OmiKU), Bangkok 10900, Thailand
*
Authors to whom correspondence should be addressed.
J. Fungi 2021, 7(9), 748; https://doi.org/10.3390/jof7090748
Submission received: 3 August 2021 / Revised: 4 September 2021 / Accepted: 8 September 2021 / Published: 13 September 2021

Abstract

:
Association between the gut mycobiome and atopic dermatitis was investigated in 9–12-month-old infants using metagenomics. Two groups of atopic dermatitis infants were classified according to their symptom development as outgrown (recovered) and persisted (still undergoing). The evenness and diversity of the mycobiome in the persisted group were higher than in the healthy and outgrown groups. Dysbiosis of the microbiome in the persisted group was observed by a reduction in the Ascomycota/Basidiomycota ratio. Five fungi were selected as markers from each sample group. In the persisted group, Rhodotorula sp. abundance increased significantly, while Wickerhamomyces sp. and Kodamaea sp. abundance increased in the healthy group, and Acremonium sp. and Rhizopus sp. abundance increased considerably in the outgrown group. Metaproteomic analysis revealed that the persisted group had a high abundance of fungal proteins, particularly those from Rhodotorula sp. Unique proteins such as RAN-binding protein 1 and glycerol kinase from Rhodotorula sp. were hypothesized to be related to atopic dermatitis manifestation in infants.

1. Introduction

Atopic dermatitis is a recurrent, chronic skin inflammation that has a high prevalence in infants. It is thought to be a gateway of the atopic march, a sequence of allergic symptoms (i.e., food allergy, allergic rhinitis, and asthma) that often develops during infancy. Symptoms of atopic dermatitis typically occur in the first six months of life. Previous research [1,2,3] suggested a correlation between atopic dermatitis exposure and a higher chance of developing other symptoms later in life. Early atopic dermatitis diagnosis and treatment are critical to reducing the likelihood of atopic march progression. It is difficult to distinguish between atopic dermatitis and common skin allergies due to the contribution of its dynamic and multi-factor pathophysiology (e.g., skin barrier defects, immune response, and environmental factors) [4,5].
Several biomarker candidates along with gut microbiome have been implemented for early diagnosis of atopic dermatitis [6,7,8], with changes indicating an increased risk of certain diseases and vice versa [8,9,10]. The abundance of particular taxa is often used as an indicator for host health. A high Firmicutes/Bacteroidetes ratio was related to an increased risk of obesity [11], while Fusobacteria has been connected to an increased risk of colorectal cancer [12].
Association between the gut microbiome and atopic dermatitis was previously reported, with the growth of butyrate-producing bacteria positively correlated to milder symptoms [13] and reduction of Faecalibacterium prausnitzii linked with manifestation [14]. These findings improved the understanding of how gut microorganisms affect atopic dermatitis. However, because of the complex nature of the gut microbiota environment, further research on the relationship with other gut microorganisms such as fungi is required before definite conclusions can be drawn.
Fungi develop shortly after birth and become a fundamental component of the human gut [15,16]. Fungi share the same particular intestinal environment as bacteria [17], making their association vital in defining host health [18,19,20]. The study of gut fungi, also known as the gut mycobiome, has recently sparked much interest, especially regarding their roles in the development of inflammatory disorders [21]. Inflammatory bowel disease has been linked to a high prevalence of Candida albicans [22], while Chron’s disease has been linked to a high abundance of Malassezia [23]. Arrieta et al. [24] reported a more pronounced association between atopic wheeze and fungi compared to bacteria, mainly linked with Pichia kudriavezii. Previous research suggested that gut fungi play a significant role in disease progression. Fungi are known to play an essential role in the health of their hosts, but there is currently no agreement on what defines a normal gut mycobiome [20]. Further research into the gut mycobiome is needed to determine how fungi impact host health.
Metagenomic analysis has long been considered the gold standard in assessing gut microbiome profiles [25]. In Thai gut microbiome studies, Raethong et al. [26] sequenced the genes and annotated the metabolic functions of the gut microbiome in Thai adults using the whole metagenome shotgun (WMGS) approach. Identifying the core microbiome is an initial step to examine the relationship between gut constituents and their activities in sustaining the host’s health [27]. Moreover, metaproteomics-based analysis was further studied for the activity of microbial communities. Kingkaw et al. [28] recently investigated the microbial community composition of the human gut to identify different key proteins playing metabolic functional roles in the microbiome of healthy infants and infants with atopic dermatitis. However, the existence of microorganisms does not always reflect similarly in vivo metabolic characteristics [29]. Thus, a combined multi meta-omics approach is required to determine the gut microbiome function for a better understanding of complex interactions in the human gut, in particular disease regulation [30].
Here, the gut mycobiome (fungal microbiome) of infants with atopic dermatitis was investigated using both metagenomic and metaproteomic approaches to capture mycobiome status links to the disease. An explanation of the involvement of perceived mechanisms during atopic dermatitis manifestation was enhanced by functional metabolic analysis of proteins from each significantly different taxon. Furthermore, a quantitative real-time PCR (q-PCR) platform was used as an alternative detection method for the causes of atopic dermatitis.

2. Materials and Methods

2.1. Study Design

This study was part of a population-based birth cohort study conducted at King Chulalongkorn Memorial Hospital, Bangkok, Thailand. It focused on healthy infants and infants with atopic dermatitis who developed symptoms within the first twelve months of life. The infants were prospectively followed up until the age of 30 months. Early life environmental exposures, socioeconomic factors, parental health, and infant diet data were collected by questionnaires (supplementary materials Table S1). Allergy diagnosis was confirmed by pediatric allergists. All infants included in this study met the American Academy of Dermatology criteria for atopic dermatitis [31], with the severity determined using the SCORAD score. A total of 34 infants were included in this study, comprising healthy (n = 17) and infants with atopic dermatitis manifestation (n = 17), sub-grouped into atopic dermatitis recovered (outgrown; n = 7) and still undergone atopic dermatitis symptoms (persisted; n = 10) at the time of sample collection. Stool samples were collected when the infants were 9–12 months old. Stool samples were immediately stored at −80 °C to prevent nucleic acid degradation. Informed consent from the infant guardians was obtained before their inclusion in this study, which was conducted according to the Helsinki Declaration, with the protocol approved by the Ethics Committee of King Chulalongkorn Memorial Hospital under approval reference number IRB-358/58.

2.2. Microbial DNA Extraction of Stool Samples

The microbial DNA extraction process was performed using the Qiagen QIAamp DNA stool kit (Qiagen, Hilden, Germany) according to the international human microbiome standard (IHMS) protocol [32]. In brief, the stool sample was resuspended (1:9 w/v) in phosphate-buffered saline (PBS) pH 8 and pelleted by centrifugation at 12,000× g for 10 min. The pellet was then homogenized with lysis buffer and transferred to a 2 mL tube containing 0.3 g of each sterile zirconia bead with 0.1 mm and 1 mm diameter (BioSpec, Bartlesville, OK, USA). Mechanical lysis was conducted using a FastPrep-24 benchtop instrument (MP Biomedicals, Santa Ana, CA, USA) at 6.5 m/s for 8 min with a series of one-minute beating and five-minute resting on ice. The extracted DNA quality and concentration were measured by a Nanodrop 2000c (Thermo Scientific, Waltham, MA, USA). After extraction, DNA samples were stored at −20 °C until required for further analysis.

2.3. Amplification and Sequencing of the Internal Transcribed Spacer 2 (ITS2) Region

The fungal ITS2 region was amplified from 150 ng/µL of microbial DNA by PCR using ITS3 (GCATCGATGAAGAACGCAGC) and ITS4-NGS (TCCTSCGCTTATTGATATGC) primer sets [33]. Each primer was integrated with the Illumina adapter and linker sequence at the 5′ end. PCR was performed using HotStarTaq DNA polymerase (Qiagen, Hilden, Germany) under the following conditions: pre-denaturation at 95 °C for 10 min; 30 amplification cycles of 95 °C for 20 s, 56 °C for 45 s, 72 °C for 1 min, and a final extension at 72 °C for 10 min. The positive control (10 ng/µL of Saccharomyces cerevisiae DNA) and negative control (nuclease-free water) were also included in each PCR run. The PCR product was visualized using 2% agarose, 90 V, 30 min and stained by ethidium bromide (EtBr). The PCR products were then purified using NucleoSpin Gel and PCR Clean-up (Macherey-Nagel, Düren, Germany). Samples were pooled and sequenced using the Illumina MiSeq Reagent V2 500 cycle (2 × 250 bp) kit on the Illumina MiSeq platform (Illumina, San Diego, CA, USA) according to the manufacturer’s instructions.

2.4. Mycobiome Determination from ITS2 Region Sequencing

All sequencing data were quality controlled and processed with BBDUK v38.86 [34] and USEARCH v10.0.240 [35]. Primer sequences were detected and trimmed with BBDUK. Then, each paired-end read was merged into a single sequence with USEARCH. Merged reads shorter than 150 bps, having more than 20 mismatches in the alignment, or having an expected error at more than 1.0 were rejected, and only the forward read was used. Operational taxonomic units (OTUs) were clustered with 97% threshold, and identification of representative sequences was performed by UPARSE pipeline with a cut-off value of 0.8 [36]. OTUs table was produced with USEARCH, and abundances were recovered by mapping OTUs table with the representative sequence. Taxonomy assignment was performed using the SINTAX-algorithm in USEARCH [37] with UNITE fungal ITS database v8.2 [38]. Alpha diversity was then calculated from the OTUs table with USEARCH. Primer 7 v7.0.20 was used to construct the Principal Component Analysis (PCA) of the beta diversity and a heat map displaying the abundance of fungus at the genus level. The beta diversity metric was calculated based on the relative abundance data at class level taxa using the Bray-Curtis distance. The raw Illumina sequences of ITS2 metagenome used in this study have been deposited at the NCBI shorts read archive (SRA) with the BioProject accession number PRJNA751473.

2.5. Quantitative Real-Time PCR (qPCR) Analysis of Five Distinct Genera

2.5.1. Primer Design

Specific primer sets were designed according to their sequence of 18s rRNA gene for Acremonium sp. and 26s rRNA gene for Rhodotorula sp., Wickerhamomyces sp., Rhizopus sp. and Kodamaea sp.
Sequences of several species within their respective genera were retrieved from the NCBI database and aligned using the MUSCLE multiple sequence alignment algorithm [39] in MEGA 7. Multiple aligned sequences that represented the conserved region of each genus were chosen to run in PrimerQuest™ Tool (IDT, Coralville, IA, USA). The specificities of these primers were aligned with the NCBI Blast database (http://www.ncbi.nlm.nih.gov/BLAST, accessed on 7 October 2020). All primers used are listed in Table 1. Real-time techniques were applied to validate the primers with five target fungi, including Acremonium sp. TBRC-9800, Rhodotorula mucilaginosa TBRC-4420, Wickerhamomyces anomalus TBRC-651, Rhizopus oligosorus TBRC-BCC 17810, and Kodamaea ohmeri TBRC-3060. PCR product size and melting temperature were observed.

2.5.2. Plasmid Construction and Standard Curve Creation

Genomic DNA of five fungi was extracted using the same methods described in stool DNA extraction (see Section 2.2) and then amplified by PCR using the primer set listed in Table 1 with i-StarTaq DNA polymerase (iNtRON Biotechnology, Gyeonggi, South Korea). The amplification conditions were as follows: pre-denaturation at 95 °C for 5 min; 30 amplification cycle of 95 °C for 15 s, annealing temperature according to Table 1 for 30 s, 72 °C for 1 min; and a final extension at 72 °C for 5 min. The PCR products were purified using NucleoSpin Gel and PCR Clean-up (Macherey-Nagel, Düren, Germany), then cloned using pGEM-T easy vector (Promega, Madison, WI, USA) following the manufacturer’s direction. The plasmid was then transformed to competent cells of Escherichia coli strain DH5α using the heat shock method [40] and grown in Luria broth (Difco Laboratories, Detroit, Michigan, USA) supplemented with ampicillin (100 µg/mL) at 37 °C, 120 rpm for 18 h. The plasmid was recovered from E. coli DH5α using NucleoSpin Plasmid, Mini kit for plasmid DNA (Macherey-Nagel, Düren, Germany), and then quantified using Nanodrop 2000c (Thermo Scientific, Waltham, MA, USA).
Standard curves for qPCR were generated using SsoAdvanced Universal Inhibitor-Tolerant SYBR Green Supermix (BioRad, Hercules, CA, USA) and SsoAdvanced Universal Probes Supermix (BioRad, Hercules, CA, USA) in LightCycler480 platform (Roche, Basel, Switzerland), according to the kit protocols, with annealing condition following Table 1. The amplifications were performed using duplicate serial dilutions of plasmid DNA. All standard curves used in this study were set to have an efficiency range of 1.8–2 and less than 1% error. The efficiency was calculated using the formula 10(−1/slope), and negative control was included on each run.

2.5.3. Quantification of Targeted Genera in Each Sample by qPCR

Concentration of the DNA template was adjusted to 80–100 ng per reaction. The amplification condition was as follows: pre-denaturation 5 min; 45 amplification cycle of 95 °C for 30 s, annealing temperature according to Table 1 for 20 s and 60 °C for 3 s. For verification purposes, all samples were subjected to melting curve analysis and visualized using agarose electrophoresis. Reactions with specific target band size (according to electrophoresis) and a threshold crossing point within the standard curve range were used for further analysis. Copy numbers of targeted fungi genera for each sample were then determined and converted to copy numbers per gram stool.

2.6. Meta-Proteomics Analysis of Five Distinct Genera

2.6.1. Sample Preparation

Stool samples were homogenized with 50 mM phosphate buffer (pH 7), and the protein extraction was carried out following the techniques previously described [41]. The total soluble protein concentration of each extraction was determined using the folin–phenol reagent [42]. Bovine serum albumin (BSA) was used as the standard for the measurement. Five micrograms of protein were reduced using 5 mM dithiothreitol in 10 mM ammonium bicarbonate. The sample was incubated at 60 °C for 1 h, with the alkylation process performed using 15 mM of iodoacetamide in 10 mM ammonium bicarbonate at room temperature for 45 min without light. Samples were then mixed with sequencing grade trypsin (1:20) (Promega, Madison, WI, USA) and incubated at 37 °C overnight. The digested samples were dried and kept at −20 °C.

2.6.2. Liquid Chromatography–Tandem Mass Spectrophotometry (LC–MS/MS)

Tryptic digested peptide samples were resuspended in 0.1% formic acid. Each sample was injected three times into the UltimateTM 3000 Nano/Capillary LC System (Thermo Scientific, Waltham, MA, USA) coupled to a Hybrid Quadrupole Q-TOF impact IITM (Bruker Daltonics, Billerica, MA, USA) equipped with a nano-captive spray ionization source. Briefly, 100 ng of peptide digests were enriched on a µ-Precolumn 300 µm i.d. × 5 mm C18 Pepmap 100, 5 µm, 100 A (Thermo Scientific, Leicestershire, UK), separated on a 75 μm i.d. × 15 cm and packed with Acclaim PepMap RSLC C18, 2 μm, 100Å, nanoViper (Thermo Scientific, Leicestershire, UK). The reverse phase C18 column was enclosed in a thermostatted column oven set to 60 °C. Solvents A and B containing 0.1% formic acid in water and 0.1% formic acid in 80% acetonitrile, respectively, were used. The peptides were eluted by a gradient of 5–55% solvent B at a constant flow rate of 0.30 μL/min for 30 min. Electrospray ionization was carried out at 1.6 kV, with nitrogen used as the drying gas at a flow rate of 50 L/h. Collision-induced-dissociation (CID) product ion mass spectra were obtained using nitrogen as the collision gas. Mass spectra (MS) and MS/MS spectra were obtained in the positive-ion mode at 2 Hz over the range (m/z) 150–2200. The collision energy was adjusted to 10 eV as a function of the m/z value. The LC–MS analysis of each sample was conducted in triplicate. The protein spectral data used in this study have been deposited at ProteomeXchange: PXD027687 and JPST001281.

2.6.3. Quantification of Detected Protein Using Bioinformatics Tools

Proteins in individual samples were bioinformatically quantified by MaxQuant 1.6.6.0 using the Andromeda search engine to correlate MS/MS spectra to the Acremonium sp., Kodamaea sp., Rhizopus sp., Rhodotorula sp., and Wickerhamomyces sp. protein sequences from the Uniprot database [43]. Label-free quantitation with MaxQuant’s standard settings was performed using a maximum of two miss cleavages, mass tolerance of 0.6 Dalton for the main search, trypsin as the digesting enzyme, carbamidomethylation of cysteine as fixed modification, and oxidation of methionine and acetylation of the protein N-terminus as variable modifications. Peptides with a minimum of seven amino acids and at least one unique peptide were considered for protein identification and used for further data analysis. The protein FDR was set at 1%. The maximum number of modifications per peptide was set to 5. Peptides with maximum intensity from three injections were detected as spectral data of the total proteins expressed from each genus. Only proteins found in at least 50% of the total samples in each group were log2 transformed and used for further analysis.

2.6.4. Determination of Meta-Proteomics Activity of Five Distinct Genera

The log2 transformed proteins were grouped according to the genera to observe the protein abundance profile in each infant. Total protein intensity from each group was then subjected to statistical analysis to determine the differentially expressed proteins (DEP).
Determination of the unique proteins from each group was performed using jvenn viewer [44]. Proteins that only belonged to one group were considered unique and used for the functional category study by running the unique protein sequences against the KEGG database using GhostKOALA [45].

2.7. Statistical Analysis

Data for statistical analysis were checked for distribution using the normality test of Shapiro–Wilk in Graph Pad Prism 8.4.3. The method of statistical analysis was decided based on the normality test result. All groups considered as parametric were analyzed by t-test (for 2 groups) and ANOVA (for 3 groups or more). For non-parametric data, the Mann–Whitney test (for 2 groups) and the Kruskal–Wallis test (for 3 groups or more) were used. All parameters with at least three group comparisons were subjected to post hoc analysis. Correction for multiple comparison analysis was performed by controlling the FDR using the two-stage step-up method of the Benjamini, Krieger, and Yekutieli algorithm [46].

3. Results

3.1. Relation of Infant Characteristics

Thirty-four infants (healthy n = 17, outgrown n = 7, and persisted n = 10) were included in the study. Statistical analyses of clinical data showed no significant differences (p > 0.05) between each parameter that might interfere with data observation (Table 2).

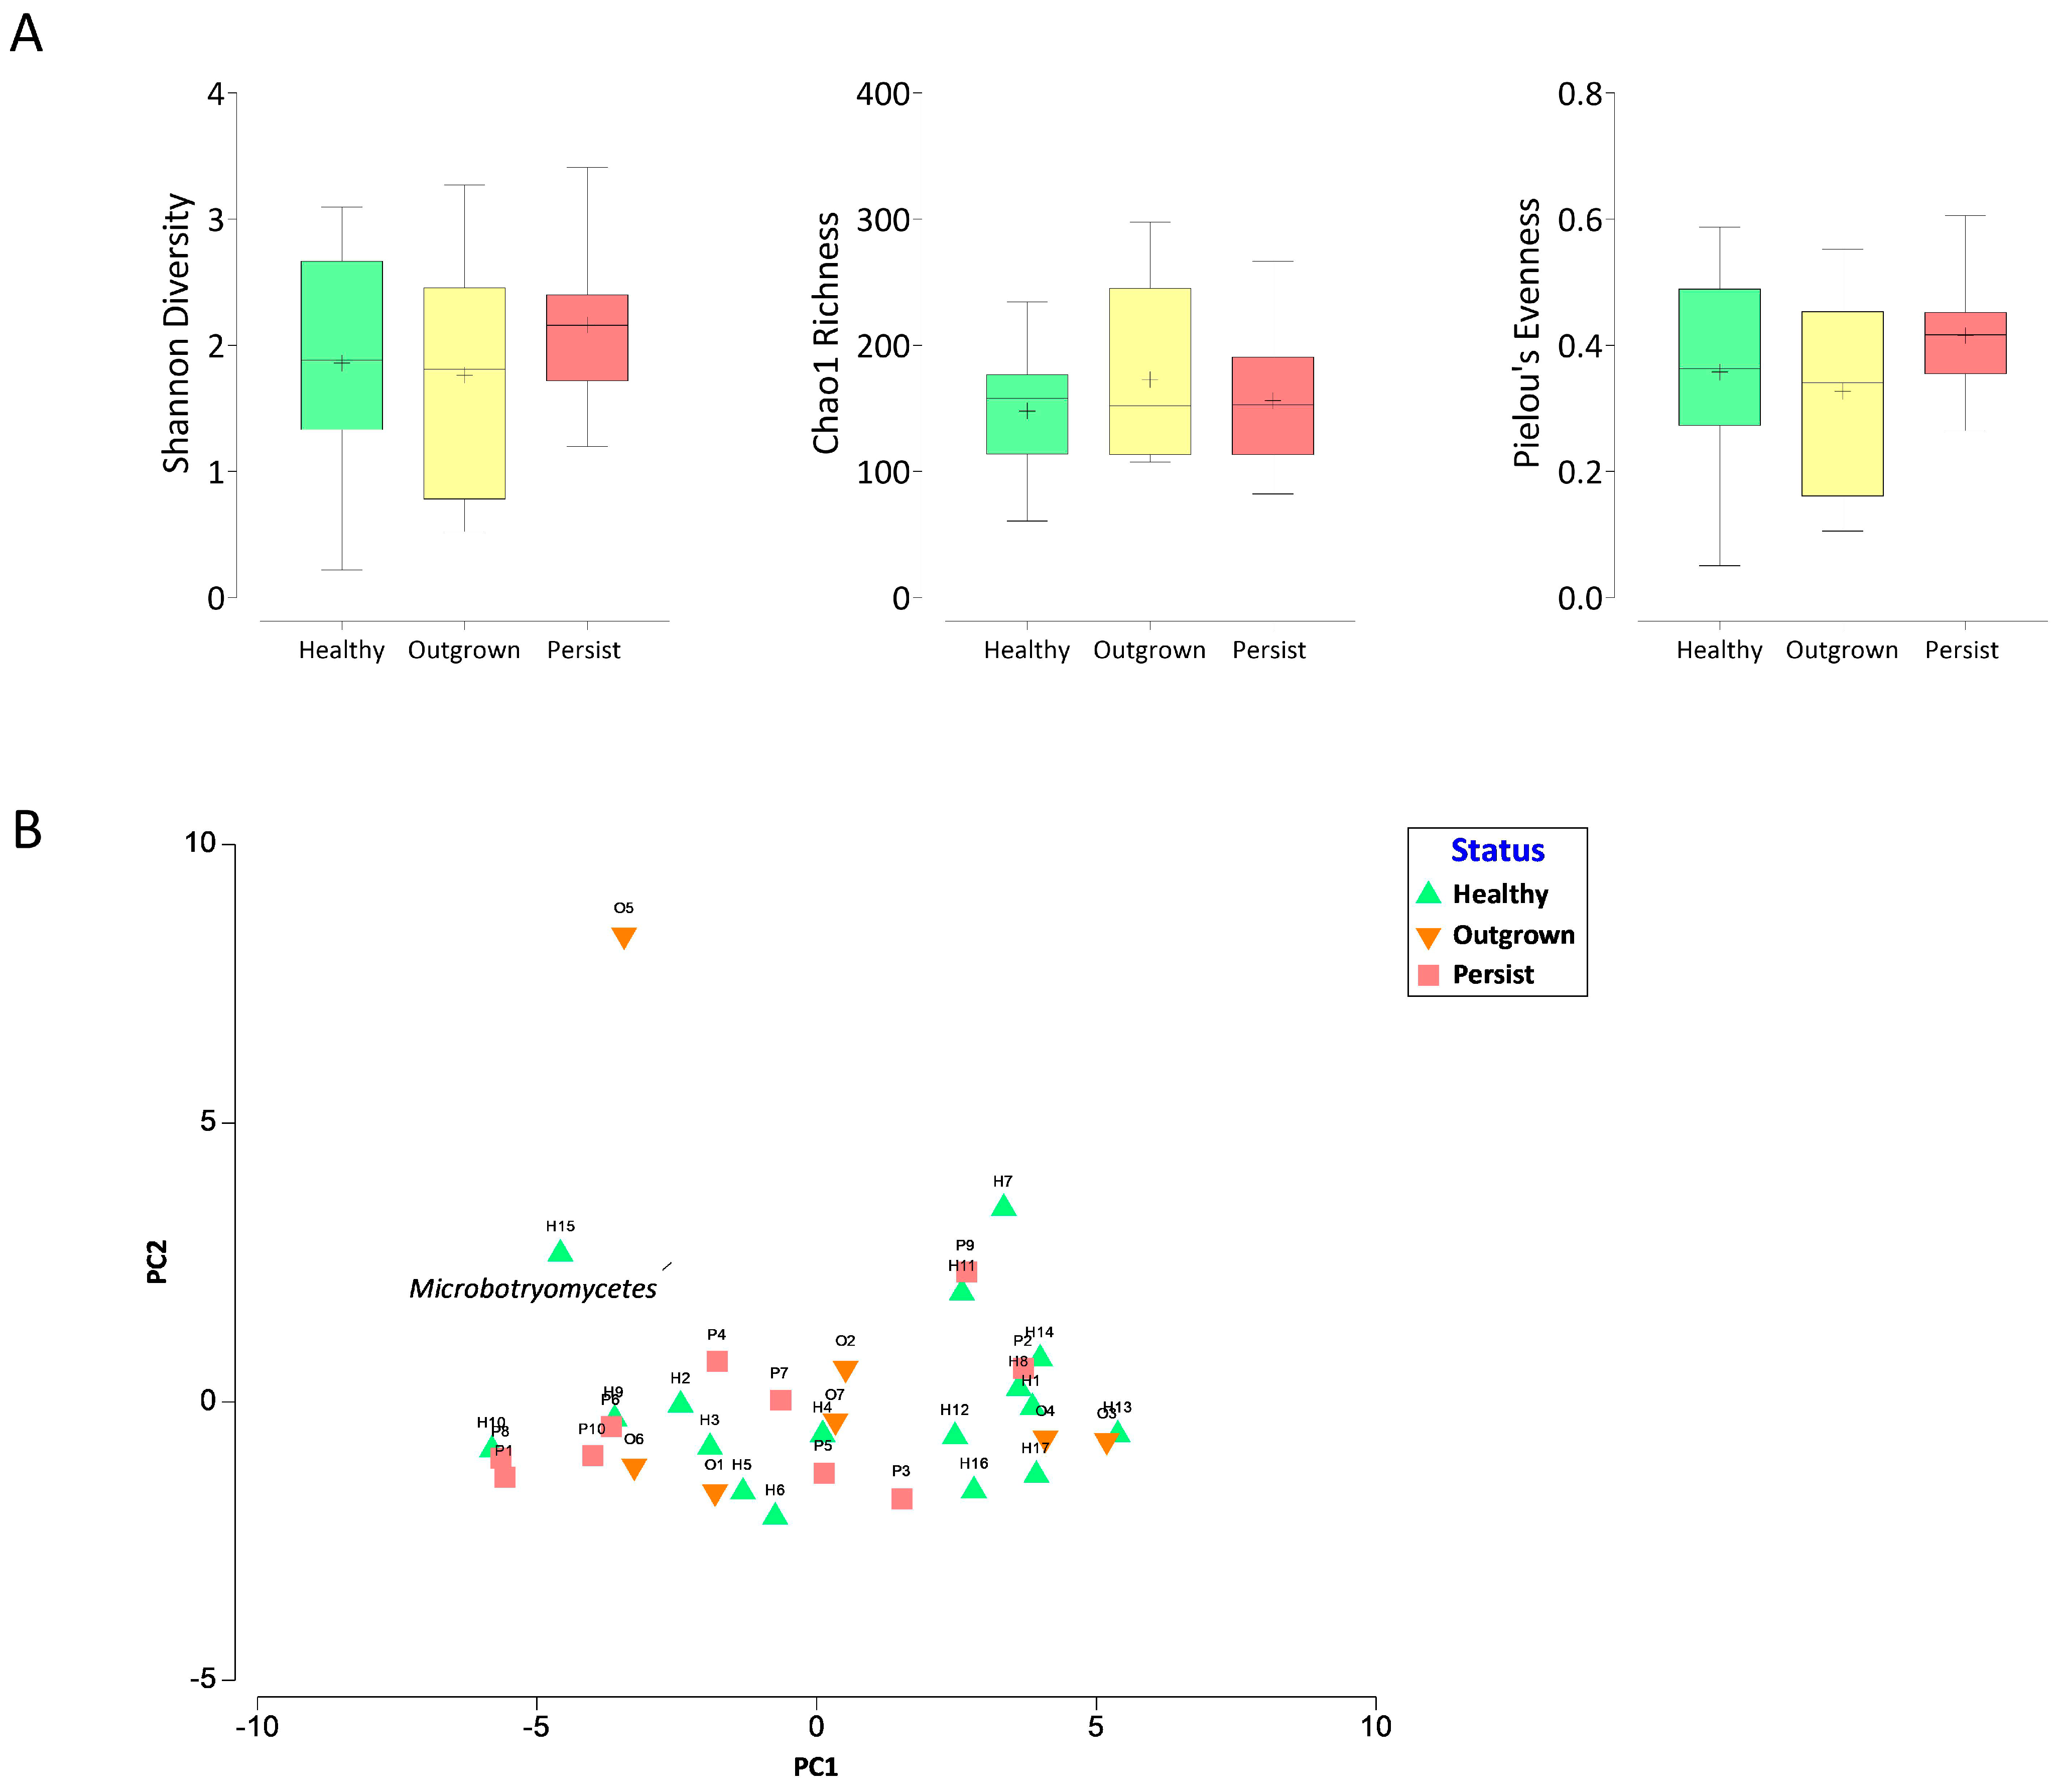
3.2. Diversity of Infant Gut Mycobiome

The sequencing yielded a total of 1,881,148 sequence reads, ranging from 25,872 to 96,180 reads with 55,327 average reads per sample. The fungal alpha diversity was assessed in each group (Figure 1A). Shannon index values indicating the richness and evenness of taxa in a community altered during atopic dermatitis manifestation. In the healthy and outgrown groups, the Shannon index had median values of 1.88 and 1.81, respectively. The median value for the persisted group was 2.16, indicating higher fungal alpha diversity compared to the other groups. To clarify which aspects had higher impacts on the Shannon index value, the richness (Chao1) and Pielou’s evenness index were also investigated. The fungi richness was not related to atopic dermatitis, indicated by the median value of the Chao1 index ranging from 152 to 157.8 in all groups, whereas the evenness of the persisted group was slightly higher (Pielou’s index = 0.42) compared to outgrown (0.34) and healthy (0.36).
The beta diversity was analyzed using the Bray–Curtis dissimilarity resemblance analysis to the relative abundance data of each taxon at class level. Principal component analysis of the beta diversity revealed no clear separation between the three groups (Figure 1B). The clustering analysis indicated that the mycobiome in the outgrown group had a closer resemblance with both healthy and persisted groups.

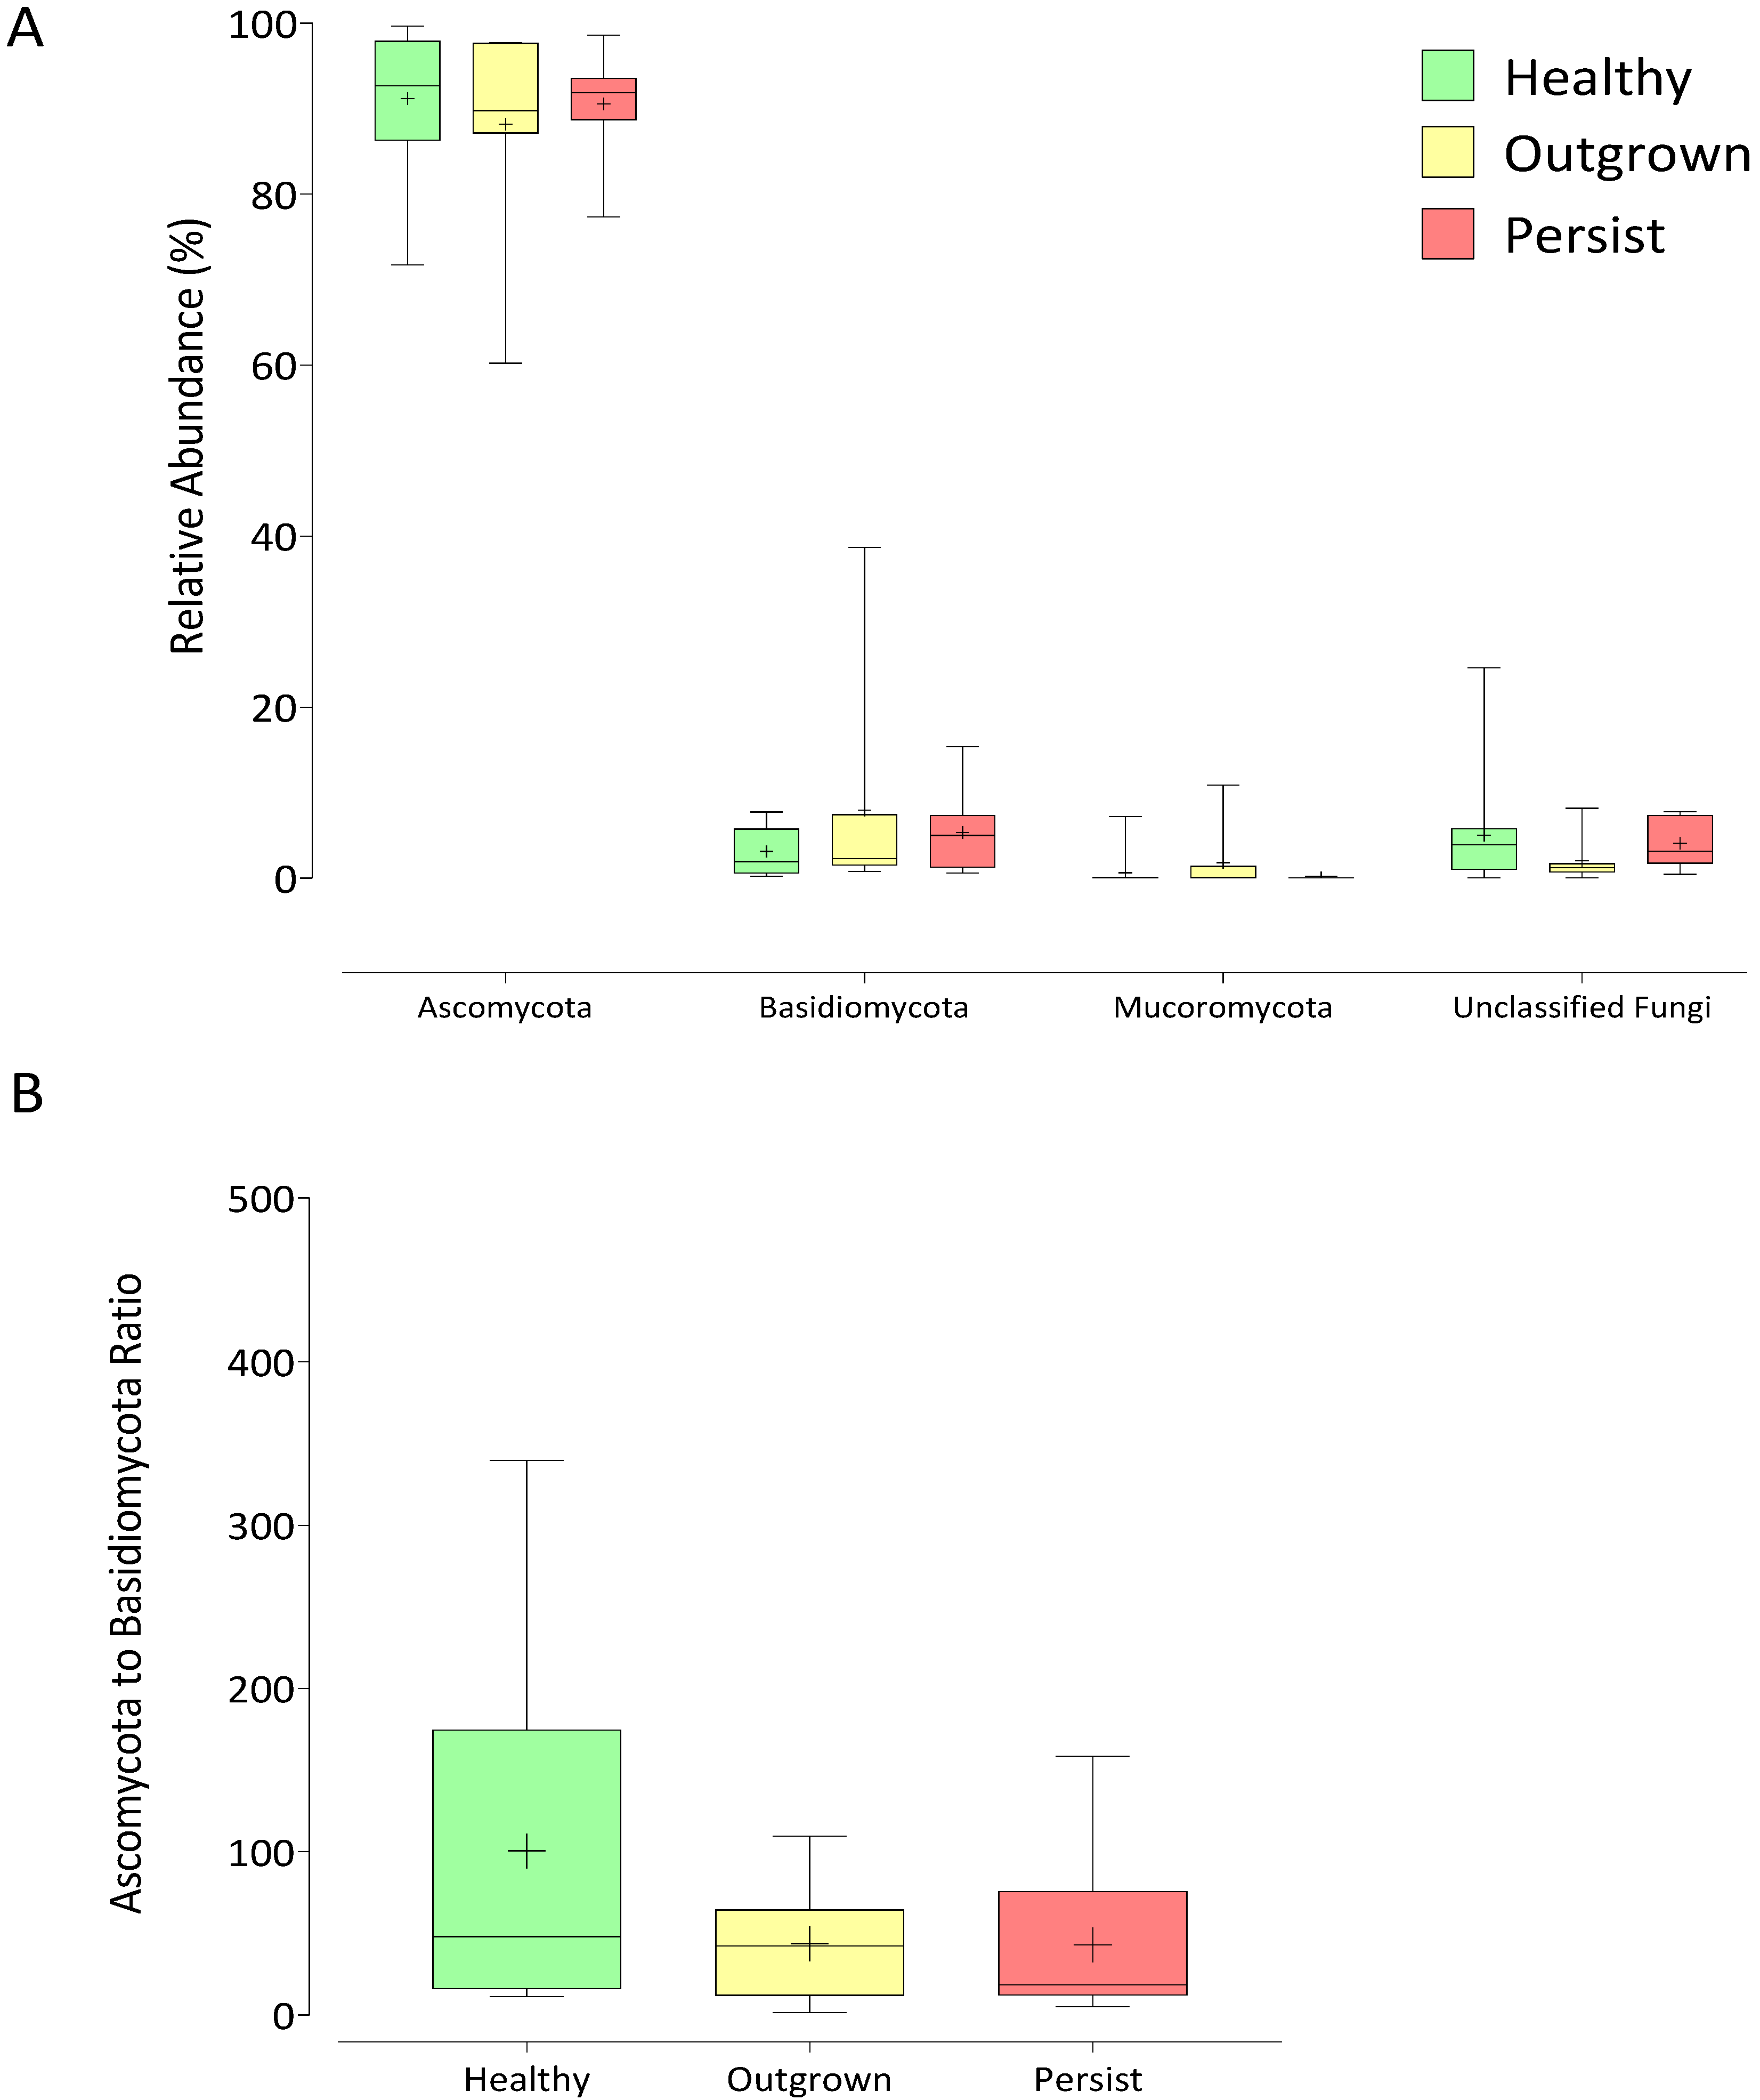
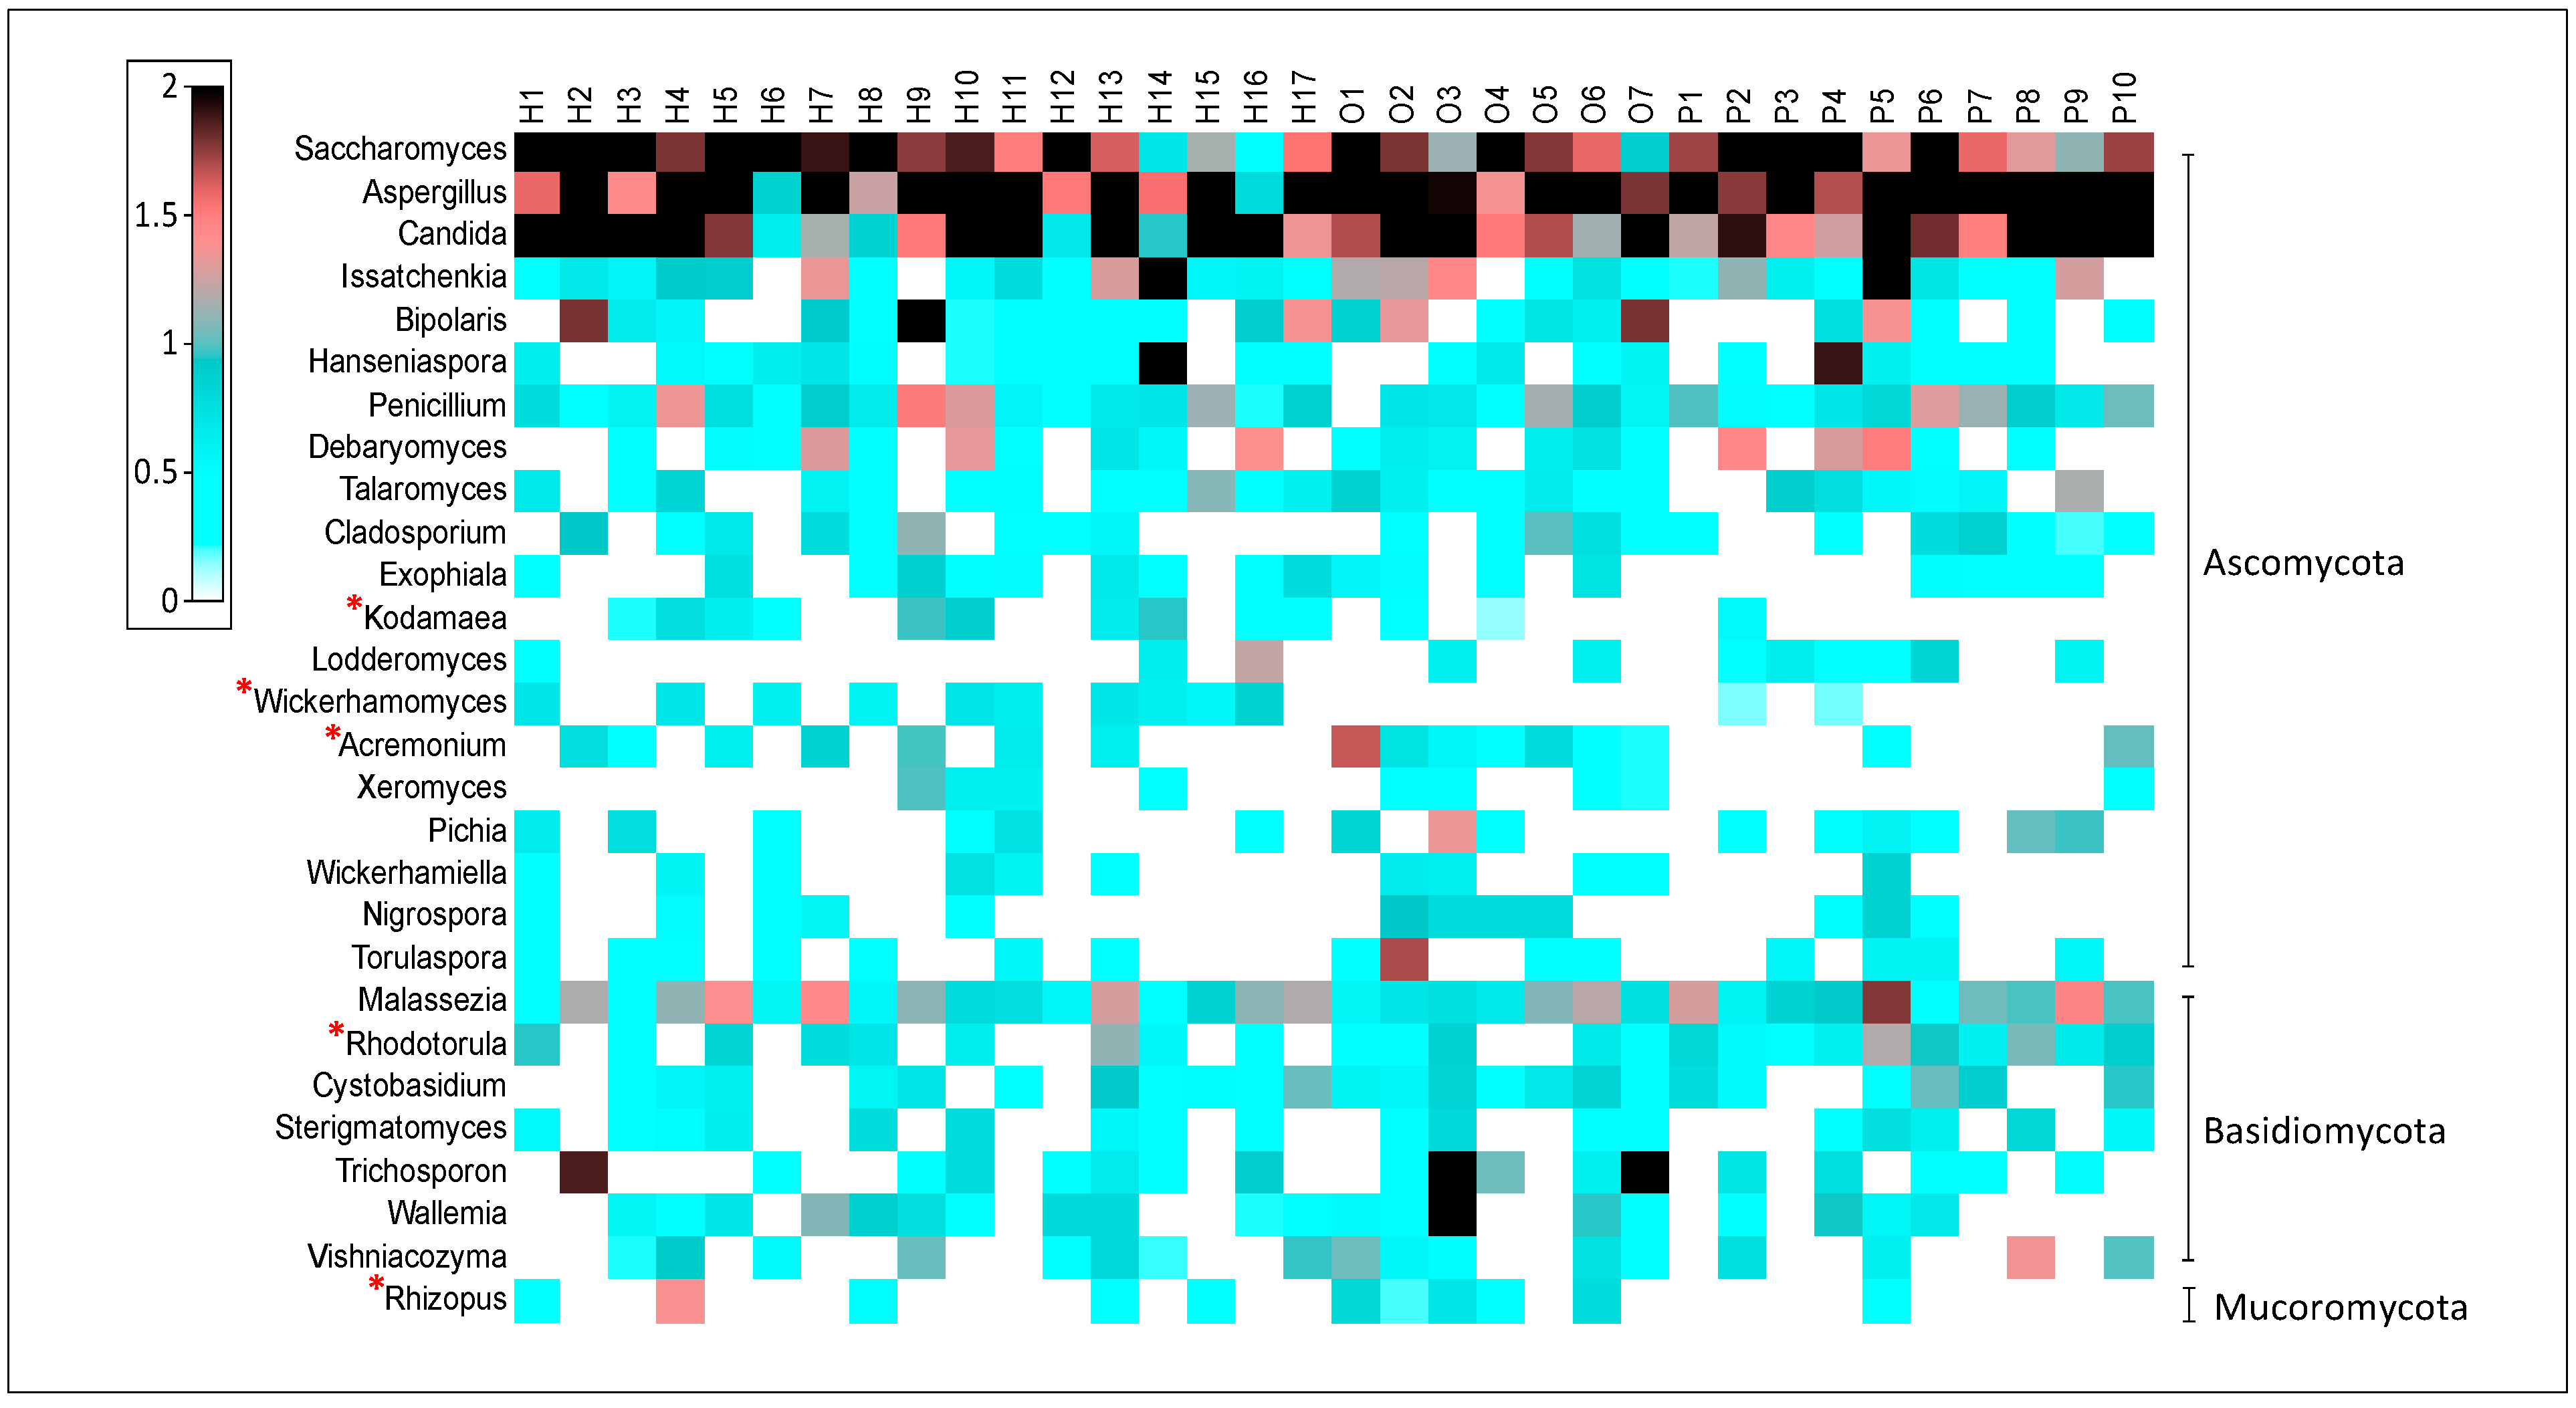
3.3. Distinctive Gut Mycobiome Profile between Healthy, Outgrown, and Persisted Infant Groups

The majority of the sequences (>90%) were successfully classified to the phylum level. The two major phyla Ascomycota and Basidiomycota were detected across all samples, while phylum Mucoromycota was present only in 67% of the samples along with some unidentified fungi (Figure 2A). The amounts of these phyla were similar in all groups. Intriguingly, a slightly lower ratio of Ascomycota to Basidiomycota was observed in the persisted group, ranging from 2.1 to 2.6 times lower than the healthy and outgrown groups (Figure 2B).
At the genus level, Saccharomyces, Aspergillus, Candida, and Malassezia were the most common taxa observed in all samples (Figure 3). Malassezia was the only predominant fungus from the Basidiomycota phyla, whereas the others were from the Ascomycota phyla. Statistical analysis was performed to determine the differences between each group at the genus level. Only 72 genera with higher than 0.05% relative abundance were included in the statistical analysis. Results showed that five genera, including Kodamaea, Wickerhamomyces, Acremonium, Rhodotorula, and Rhizopus were significantly different between groups. In the healthy group, Kodamaea and Wickerhamomyces were found more frequently (recorded in 59% of samples) with average abundances of 0.1% and 0.13%, respectively. In the outgrown group, Acremonium was detected in 100% of the population, with an average abundance of 0.93%, and Rhizopus was discovered in 71.4% of the infants, with an average abundance of 0.09%. The genera Rhodotorula associated with the persisted group was present in all samples, with an average abundance of 0.4%.

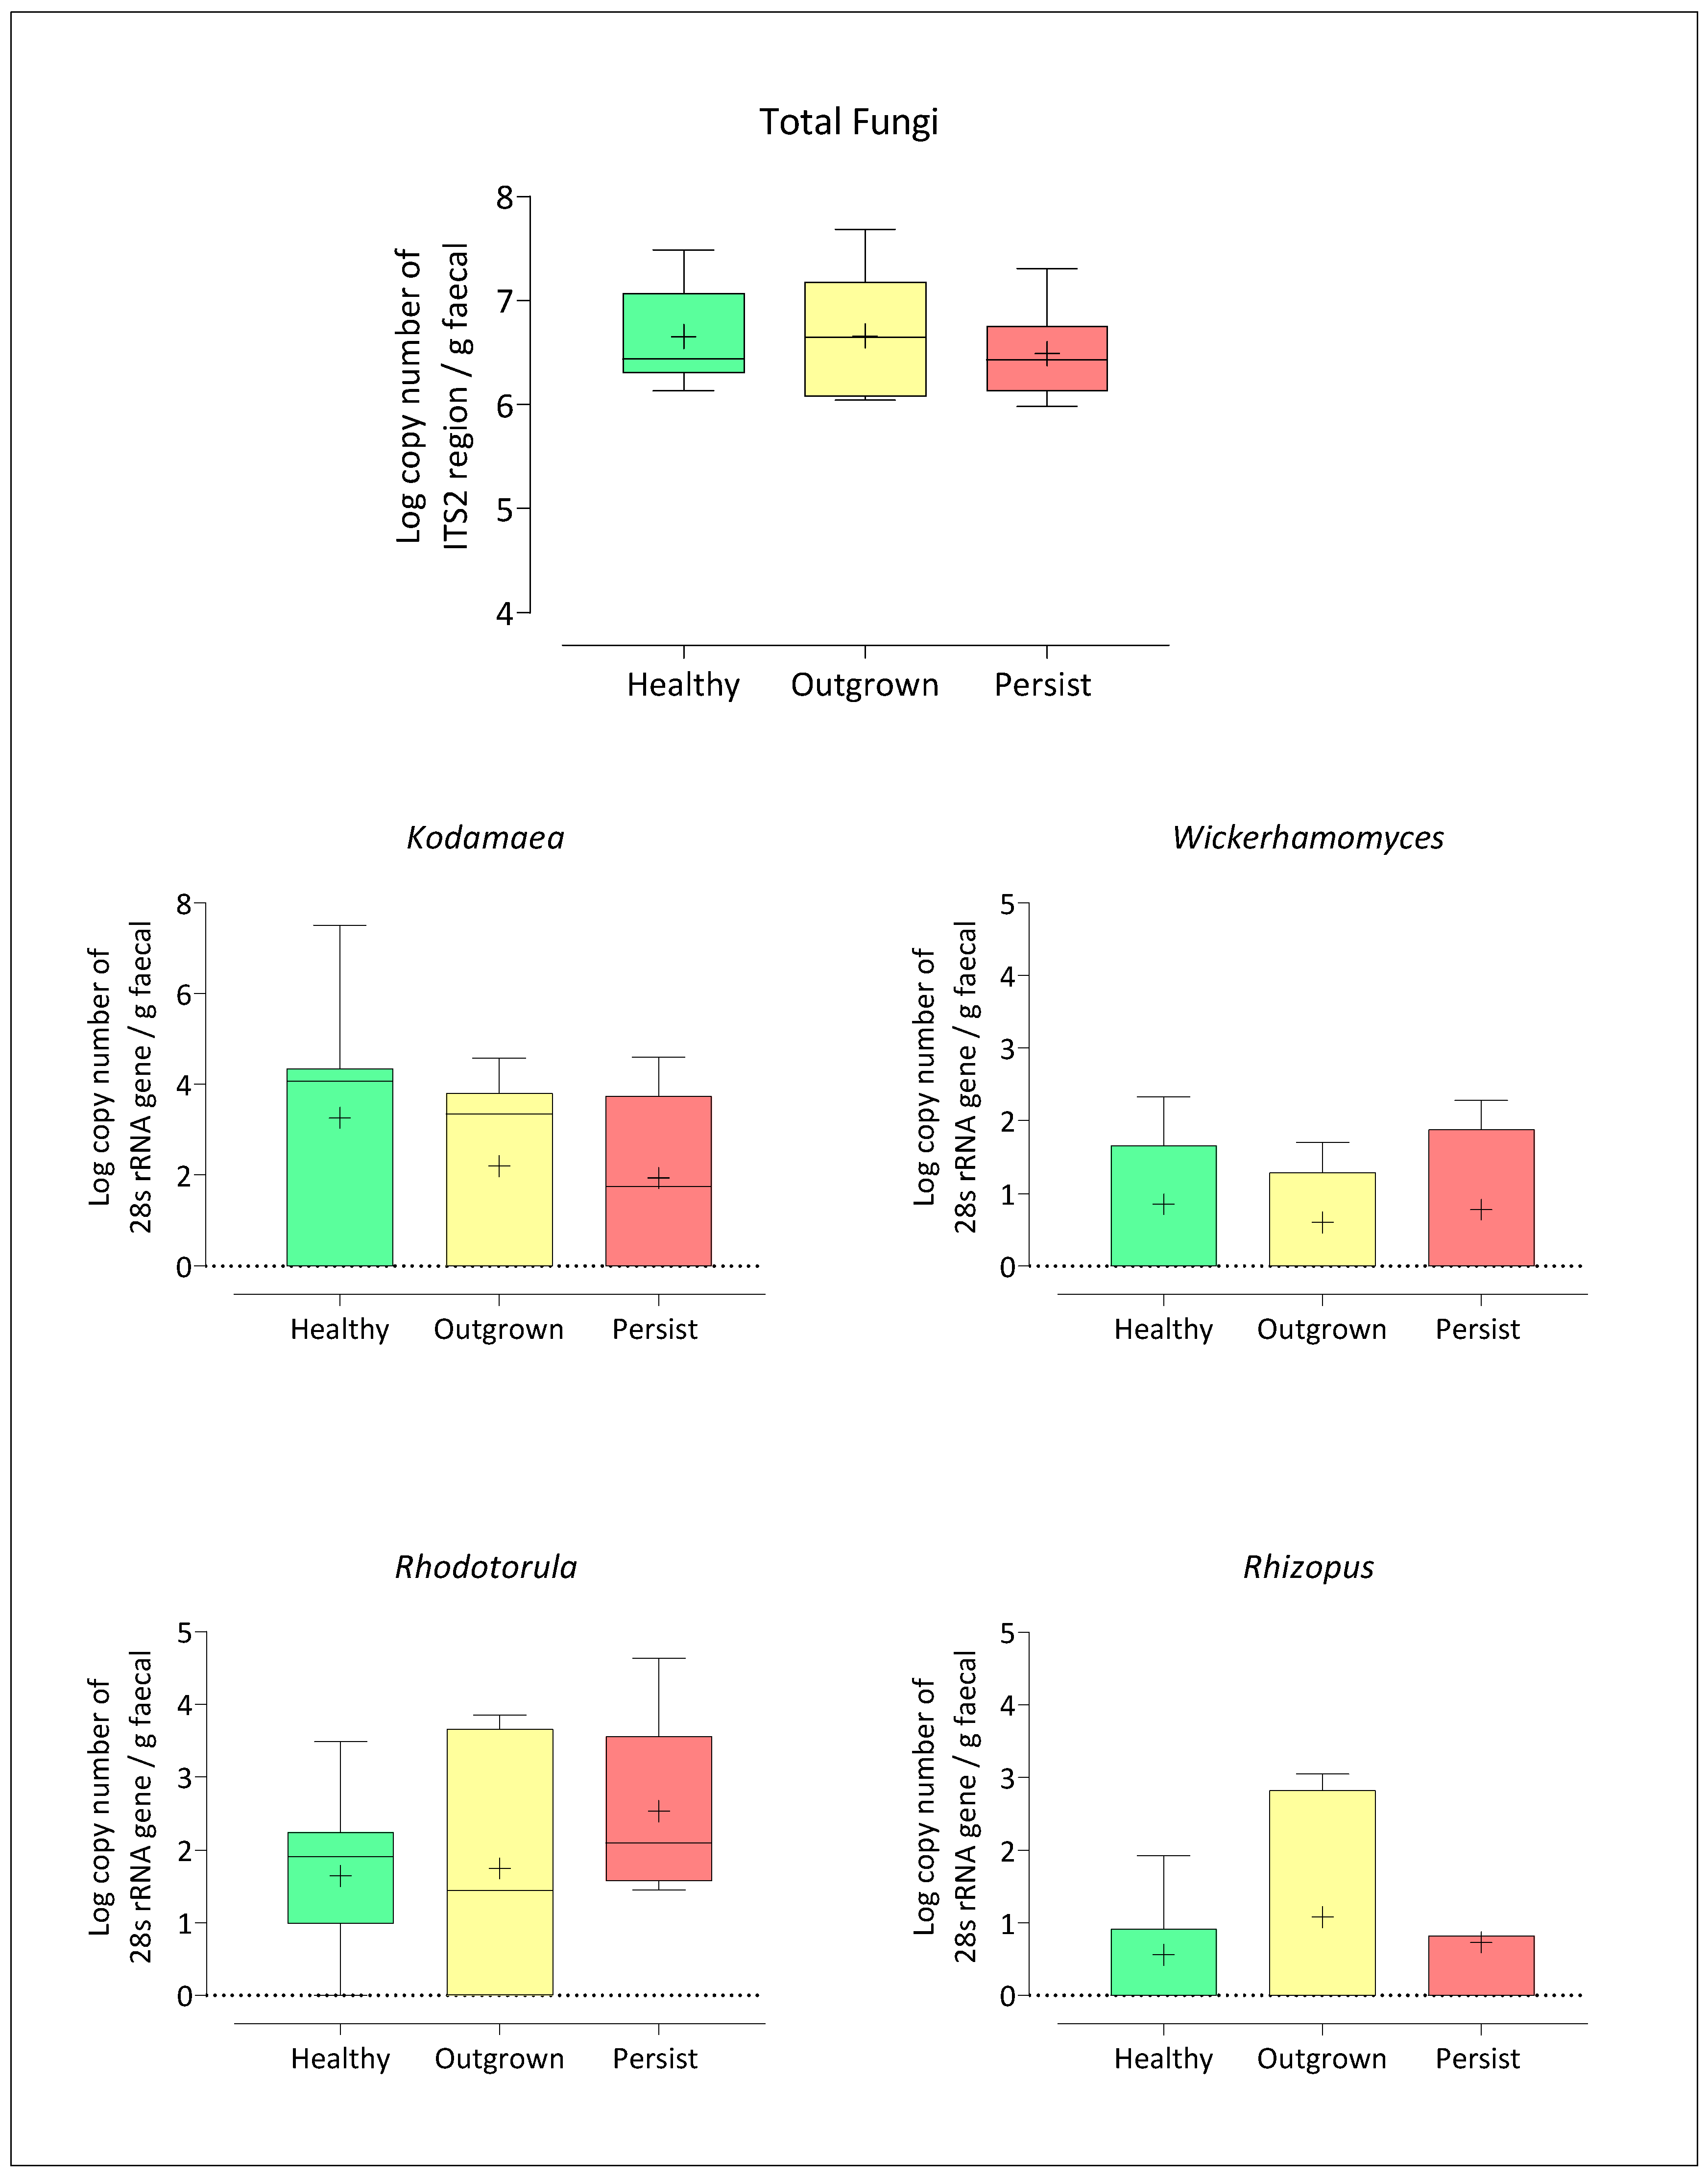
3.4. Quantification of Five Target Fungi from Healthy, Outgrown, and Persisted Infant Groups

To obtain absolute quantification of the five significant genera and total fungi, genera-specific primer sets were designed for quantification purposes using the q-PCR technique. The primer set for Acremonium failed to amplify due to the diversity of each species and rapid evolution within this genus. Previous research indicated that effective detection of Acremonium was possible using a whole sequence of a small subunit combined with a large subunit of rRNA, though the use of q-PCR has made similar approaches impractical [47].
Quantification of each genus was also in agreement with NGS results (Figure 4). The numbers of fungi in all samples were similar. Concentrations of Kodamaea and Wickerhamomyces were highest in the healthy group (4.38 ± 1.11 and 0.86 ± 1.22 log copy number of 28s rRNA gene, respectively), while Rhizopus was highest in the outgrown group (1 ± 1.31 log copy number of 28s rRNA gene), and Rhodotorula was highest in the persisted group (2.5 ± 1.15 log copy number of 28s rRNA gene). Overall, a detection limit as low as 0.9–3.2 log copy number of 26s rRNA gene per gram stool was achieved.

3.5. Targeted Meta-Proteomics of Significantly Different Genera

A total of 29,447 proteins from five significantly different genera, including Acremonium sp., Wickerhamomyces sp., Kodamaea sp., Rhodotorula sp., and Rhizopus sp., were acquired based on protein ID from the UniProt database (i.e., 20,846 protein counts from 11 healthy infants, 9670 protein counts from 7 outgrown infants, and 14,768 protein counts from 5 persisted infants). Protein with at least 50% prevalent level in each group was used for further analysis (Table 3). The number of proteins in the persisted group was the highest, followed by healthy and outgrown groups. The average protein per sample in the persisted group was also the highest. Acremonium sp., Wickerhamomyces sp., Rhodotorula sp., and Rhizopus sp. in the persisted group were significantly higher than in the healthy and outgrown groups (p < 0.05), while numbers of these proteins in the healthy and outgrown groups were similar. Results demonstrated the possibility of alteration in protein production of significantly different genera during atopic dermatitis manifestation.
Analysis of DEP using jvenn viewer (Figure 5) showed 97 unique proteins in the persisted group, with 16 functionally annotated by the KEGG database (Table 4). Most of the proteins were categorized to metabolism (six proteins) and genetic information processing (eight proteins). Notably, proteins related to human disease were found in Rhodotorula sp. The RAN binding protein 1 (Rbp1) from Rhodotorula sp. was only expressed in the persisted group.

4. Discussion

The association between gut mycobiome and atopic dermatitis development was investigated in infants using metagenomics and metaproteomic technology. No significant differences in characteristic demographics were shown between healthy, outgrown, and persisted groups. The persisted group exhibited higher fungal diversity and richness than the healthy and outgrown groups, concurring with Nash et al. [20]. The gut mycobiome in healthy humans has low diversity and is dominated by a few taxa. By contrast, the high diversity of the gut mycobiome was also linked to illnesses including Crohn’s disease and ulcerative colitis by a previous study [48]. Atopic dermatitis in the persisted group was related to a high abundance of mycobiome that reduced after atopic dermatitis development in the outgrown group.
The most prevalent phyla identified in all groups were Ascomycota and Basidiomycota. Notably, the ratio of Ascomycota to Basidiomycota in the persisted group was lower than in the healthy and outgrown groups. Previous research reported that patients with fever retinitis, colon cancer, or inflammatory bowel had a ratio of Ascomycota to Basidiomycota lower than healthy humans [49,50,51]. However, no clear mechanism defining the cause of this occurrence has been discovered.
Results of metagenomic suggest that the healthy, outgrown, and persisted groups contained significant differences in the five fungi genera. Wickerhamomyces and Kodamaea were found in abundance in the healthy group. In the outgrown group, Acremonium and Rhizopus were abundant, while Rhodotorula was dominant in the persisted group. Members of the Wickerhamomyes and Kodamaea genera have been identified as promising probiotic and biocontrol agent candidates [52]. Hjortmo et al. (2008) identified yeast from the Wickerhamomyces genus as folate producers [53]. Humans are rarely harmed by Acremonium and Rhizopus species, with frequent Acremonium infection found after trauma [54]. Acremonium may be able to synthesize the antibiotic cephalosporin, which is effective against Gram-positive bacteria. Rhizopus is a type of foodborne mold that is commonly utilized in the production of fermented foods in Southeast Asia. Some species of this genus may act as pathogens in immunocompromised individuals [55]. Rhodotorula is commonly associated with skin barrier disruption [56], and its presence in immunocompromised individuals is often severe [57]. In a recent study, risks caused by the blooming of the Rhodotorula genus were addressed, highlighting the increased risk posed in immune-challenged individuals and infants [58].
The fungal numbers in the three sample groups were comparable; however, protein levels in Acremonium, Wickerhamomyces, Rhodotorula, and Rhizopus were substantially higher in the persisted group than in the outgrown and healthy groups (p < 0.05). This result suggested that fungi were not only present but also metabolically active in the guts of infants, emphasizing the link between gut mycobiome and host health [59,60].
A high abundance of fungal proteins in the persisted group was observed in Rhodotorula sp., and three functions were categorized as metabolism, the genetic information process, and human disease. RAN-binding protein 1 (Rbp1) is a human disease-linked protein. In a recent humoral study in mice by Buldain et al. [61], Rbp1 from Lomentospora was shown for the first time to act as a fungal allergen. The allergic reaction occurred due to the recognition of immunoglobulin G (Ig-G) toward Rbp1 [62]. Despite the lack of evidence, Rhodotorula sp. Rbp1 may act as an allergen with recognition by Ig-G. Although Ig-G is less commonly linked to atopy allergy than Ig-E, Ig-G levels in the blood were higher in atopic dermatitis patients on many occasions [63,64]. This finding suggested an unconventional way of atopic dermatitis development through an Ig-G mediated pathway.
Glycerol kinase from Rhodotorula sp. was the unique protein in the persisted group. The glycerol kinase is involved and crucial during triacylglycerol biosynthesis. Overexpression of glycerol kinase leads to higher levels of triacylglycerol and the intermediate products in the related pathway. Bublin et al. [65] reported that lipids from fungi and bacteria could activate immunological responses. The ability of lipids to modify allergen intakes through the intestinal barrier is an intriguing aspect of their role in the induction of allergic responses. Rhodotorula has also demonstrated the capability of paracellular translocation from the gut cell wall to the bloodstream, causing sepsis and activating immunological responses [66].
A recent functional metabolic analysis based on a proteomics investigation supported Rhodotorula’s involvement in atopic dermatitis. Rhodotorula has disseminating properties with unique cell walls, and Rbp1 protein expression, in combination with an underdeveloped gastrointestinal barrier, may play a major role in atopic dermatitis manifestation.

5. Conclusions

Our findings showed dysbiosis of the gut mycobiota both during and after the development of atopic dermatitis. Rhodotorula overgrowth was a distinguishing characteristic associated with the persisted group. Future investigations are required to examine the related functional roles of Rhodotorula in infants with atopic dermatitis.

Supplementary Materials

The following can be found at https://www.mdpi.com/article/10.3390/jof7090748/s1, Table S1: Clinical data of infants.

Author Contributions

Conceptualization, M.N. and W.V.; methodology, K.M., N.S., W.V. and M.N.; software, K.M and P.P.; validation, K.M., N.S., W.V. and M.N.; formal analysis, K.M., S.C. and P.P.; investigation, N.S., W.V. and M.N.; resources, N.S., S.R., S.C., P.C., W.V. and M.N.; data curation, N.S., P.C. and M.N.; writing—original draft preparation, K.M., P.P., P.C. and M.N.; writing—review and editing, K.M., N.S., S.R., W.V. and M.N.; visualization, K.M. and M.N.; supervision, N.S., S.R., P.C., W.V. and M.N.; project administration, K.M., N.S. and P.P.; funding acquisition, N.S., W.V. and M.N. All authors have read and agreed to the published version of the manuscript.

Funding

This research was funded by: Agro-Industrial Scholarship for International Students, Kasetsart University; Department of Biotechnology, the Faculty of Agroindustry, and Kasetsart University; National Science and Technology Development Agency (NSTDA) (Grant No. P-17-50648) Ratchadapisek Research Funds (Grant No. CU-GR(S)_61_38_30_03), Chulalongkorn University Bangkok, Thailand; Internal fund of Functional Ingredients and Food Innovation Research Group, National Center for Genetic Engineering and Biotechnology; Kasetsart University Research and Development Institute (KURDI; grant no. P-3.1(D)7.28.62); Department of Zoology, Faculty of Science, Kasetsart University.

Institutional Review Board Statement

The study was conducted according to the guidelines of the Declaration of Helsinki and approved by the Institutional Review Board (or Ethics Committee) of King Chulalongkorn Memorial Hospital (IRB-358/58).

Informed Consent Statement

Informed consent was obtained from all subjects involved in the study.

Data Availability Statement

The raw Illumina sequences of ITS2 metagenome used in this study have been deposited at the NCBI shorts read archive (SRA) with the BioProject accession number PRJNA751473. The protein spectral data used in this study have been deposited at ProteomeXchange: PXD027687 and JPST001281.

Acknowledgments

The authors would like to thank the Center of Excellence Clinical Virology, Faculty of Medicine, Chulalongkorn University, Bangkok, Thailand, Paediatric allergists and research team from Pediatric Allergy & Clinical Immunology Research Unit, Division of Allergy and Immunology, Department of Pediatrics, Faculty of Medicine, Chulalongkorn University, Bangkok, Thailand for enrollment, follow-up of the subjects, and collecting the stool samples in this cohort. We would also like to thank the Department of Zoology, International SciKU Branding (ISB), Faculty of Science, Kasetsart University, Omics Center for Agriculture, Bioresources, Food, and Health, Kasetsart University (OmiKU) and SciKU Biodata Server for resources and computing facilities. We also would like to thank Sunee Nnitisinprasert from Kasetsart University and Gianni Panagiotou from Hans Knoll Institute for valuable comments and suggestions.

Conflicts of Interest

The authors declare no conflict of interest.

References

  1. Pearce, N.; Aït-Khaled, N.; Beasley, R.; Mallol, J.; Keil, U.; Mitchell, E.; Robertson, C. Worldwide trends in the prevalence of asthma symptoms: Phase III of the International Study of Asthma and Allergies in Childhood (ISAAC). Thorax 2007, 62, 758–766. [Google Scholar] [CrossRef] [Green Version]
  2. Gustafsson, D.; Sjöberg, O.; Foucard, T. Development of allergies and asthma in infants and young children with atopic dermatitis—A prospective follow-up to 7 years of age. Allergy 2000, 55, 240–245. [Google Scholar] [CrossRef] [PubMed]
  3. Tsakok, T.; Marrs, T.; Mohsin, M.; Baron, S.; du Toit, G.; Till, S.; Flohr, C. Does atopic dermatitis cause food allergy? A systematic review. J. Allergy Clin. Immunol. 2016, 137, 1071–1078. [Google Scholar] [CrossRef] [PubMed] [Green Version]
  4. Maliyar, K.; Sibbald, C.; Pope, E.; Gary Sibbald, R. Diagnosis and Management of Atopic Dermatitis: A Review. Adv. Ski. Wound Care 2018, 31, 538–550. [Google Scholar] [CrossRef]
  5. Sugita, K.; Akdis, C.A. Recent developments and advances in atopic dermatitis and food allergy. Allergol. Int. 2020, 69, 204–214. [Google Scholar] [CrossRef] [PubMed]
  6. Guttman-Yassky, E.; Diaz, A.; Pavel, A.B.; Fernandes, M.; Lefferdink, R.; Erickson, T.; Canter, T.; Rangel, S.; Peng, X.; Li, R.; et al. Use of Tape Strips to Detect Immune and Barrier Abnormalities in the Skin of Children With Early-Onset Atopic Dermatitis. JAMA Dermatol. 2019, 155, 1358–1370. [Google Scholar] [CrossRef]
  7. Brunner, P.M. Early immunologic changes during the onset of atopic dermatitis. Ann. Allergy Asthma Immunol. 2019, 123, 152–157. [Google Scholar] [CrossRef] [Green Version]
  8. Kim, J.E.; Kim, H.S. Microbiome of the Skin and Gut in Atopic Dermatitis (AD): Understanding the Pathophysiology and Finding Novel Management Strategies. J. Clin. Med. 2019, 8, 444. [Google Scholar] [CrossRef] [Green Version]
  9. Lozupone, C.A.; Stombaugh, J.I.; Gordon, J.I.; Jansson, J.K.; Knight, R. Diversity, stability and resilience of the human gut microbiota. Nature 2012, 489, 220–230. [Google Scholar] [CrossRef] [Green Version]
  10. Mancabelli, L.; Milani, C.; Lugli, G.A.; Turroni, F.; Cocconi, D.; van Sinderen, D.; Ventura, M. Identification of universal gut microbial biomarkers of common human intestinal diseases by meta-analysis. FEMS Microbiol. Ecol. 2017, 93, fix153. [Google Scholar] [CrossRef] [Green Version]
  11. Ley, R.E.; Bäckhed, F.; Turnbaugh, P.; Lozupone, C.A.; Knight, R.D.; Gordon, J.I. Obesity alters gut microbial ecology. Proc. Natl. Acad. Sci. USA 2005, 102, 11070–11075. [Google Scholar] [CrossRef] [Green Version]
  12. Kostic, A.D.; Gevers, D.; Pedamallu, C.S.; Michaud, M.; Duke, F.; Earl, A.M.; Ojesina, A.I.; Jung, J.; Bass, A.J.; Tabernero, J.; et al. Genomic analysis identifies association of Fusobacterium with colorectal carcinoma. Genome Res. 2012, 22, 292–298. [Google Scholar] [CrossRef] [Green Version]
  13. Nylund, L.; Nermes, M.; Isolauri, E.; Salminen, S.; de Vos, W.M.; Satokari, R. Severity of atopic disease inversely correlates with intestinal microbiota diversity and butyrate-producing bacteria. Allergy 2015, 70, 241–244. [Google Scholar] [CrossRef]
  14. Song, H.; Yoo, Y.; Hwang, J.; Na, Y.C.; Kim, H.S. Faecalibacterium prausnitzii subspecies—Level dysbiosis in the human gut microbiome underlying atopic dermatitis. J. Allergy Clin. Immunol. 2016, 137, 852–860. [Google Scholar] [CrossRef] [Green Version]
  15. Ward, T.L.; Dominguez-Bello, M.G.; Heisel, T.; Al-Ghalith, G.; Knights, D.; Gale, C.A. Development of the Human Mycobiome over the First Month of Life and across Body Sites. mSystems 2018, 3, e00140-17. [Google Scholar] [CrossRef] [PubMed] [Green Version]
  16. Stewart, C.J.; Nelson, A.; Scribbins, D.; Marrs, E.C.L.; Lanyon, C.; Perry, J.D.; Embleton, N.D.; Cummings, S.P.; Berrington, J.E. Bacterial and fungal viability in the preterm gut: NEC and sepsis. Arch. Dis. Child. Fetal Neonatal Ed. 2013, 98, F298–F303. [Google Scholar] [CrossRef] [PubMed] [Green Version]
  17. Iliev, I.D.; Funari, V.A.; Taylor, K.D.; Nguyen, Q.; Reyes, C.N.; Strom, S.P.; Brown, J.; Becker, C.A.; Fleshner, P.R.; Dubinsky, M.; et al. Interactions Between Commensal Fungi and the C-Type Lectin Receptor Dectin-1 Influence Colitis. Science 2012, 336, 1314–1317. [Google Scholar] [CrossRef] [PubMed] [Green Version]
  18. Laforest-Lapointe, I.; Arrieta, M.C. Patterns of Early-Life Gut Microbial Colonization during Human Immune Development: An Ecological Perspective. Front. Immunol. 2017, 8, 788. [Google Scholar] [CrossRef] [PubMed] [Green Version]
  19. Lynch, S.V.; Pedersen, O. The Human Intestinal Microbiome in Health and Disease. N. Engl. J. Med. 2016, 375, 2369–2379. [Google Scholar] [CrossRef] [Green Version]
  20. Nash, A.K.; Auchtung, T.A.; Wong, M.C.; Smith, D.P.; Gesell, J.R.; Ross, M.C.; Stewart, C.J.; Metcalf, G.A.; Muzny, D.M.; Gibbs, R.A.; et al. The gut mycobiome of the Human Microbiome Project healthy cohort. Microbiome 2017, 5, 153. [Google Scholar] [CrossRef]
  21. Lee, S.-Y.; Lee, E.; Park, Y.M.; Hong, S.-J. Microbiome in the Gut-Skin Axis in Atopic Dermatitis. Allergy Asthma Immunol. Res. 2018, 10, 354–362. [Google Scholar] [CrossRef] [PubMed]
  22. Lemoinne, S.; Kemgang, A.; Belkacem, K.B.; Straube, M.; Jegou, S.; Corpechot, C.; Network, S.A.I.; Chazouillères, O.; Housset, C.; Sokol, H. Fungi participate in the dysbiosis of gut microbiota in patients with primary sclerosing cholangitis. Gut 2020, 69, 92–102. [Google Scholar] [CrossRef] [PubMed] [Green Version]
  23. Limon, J.J.; Tang, J.; Li, D.; Wolf, A.J.; Michelsen, K.S.; Funari, V.; Gargus, M.; Nguyen, C.; Sharma, P.; Maymi, V.I.; et al. Malassezia Is Associated with Crohn’s Disease and Exacerbates Colitis in Mouse Models. Cell Host Microbe 2019, 25, 377–388.e6. [Google Scholar] [CrossRef] [PubMed] [Green Version]
  24. Arrieta, M.C.; Arévalo, A.; Stiemsma, L.; Dimitriu, P.; Chico, M.E.; Loor, S.; Vaca, M.; Boutin, R.C.; Morien, E.; Jin, M.; et al. Associations between infant fungal and bacterial dysbiosis and childhood atopic wheeze in a nonindustrialized setting. J. Allergy Clin. Immunol. 2018, 142, 424–434.e10. [Google Scholar] [CrossRef] [Green Version]
  25. Petriz, B.A.; Franco, O.L. Metaproteomics as a Complementary Approach to Gut Microbiota in Health and Disease. Front. Chem. 2017, 5, 4. [Google Scholar] [CrossRef] [Green Version]
  26. Raethong, N.; Nakphaichit, M.; Suratannon, N.; Sathitkowitchai, W.; Weerapakorn, W.; Keawsompong, S.; Vongsangnak, W. Analysis of Human Gut Microbiome: Taxonomy and Metabolic Functions in Thai Adults. Genes 2021, 12, 331. [Google Scholar] [CrossRef]
  27. Human Microbiome Project Consortium. Structure, function and diversity of the healthy human microbiome. Nature 2012, 486, 207–214. [Google Scholar] [CrossRef] [Green Version]
  28. Kingkaw, A.; Nakphaichit, M.; Suratannon, N.; Nitisinprasert, S.; Wongoutong, C.; Chatchatee, P.; Krobthong, S.; Charoenlappanit, S.; Roytrakul, S.; Vongsangnak, W. Analysis of the infant gut microbiome reveals metabolic functional roles associated with healthy infants and infants with atopic dermatitis using metaproteomics. PeerJ 2020, 8, e9988. [Google Scholar] [CrossRef] [PubMed]
  29. Kolmeder, C.A.; Salojärvi, J.; Ritari, J.; De Been, M.; Raes, J.; Falony, G.; Vieira-Silva, S.; Kekkonen, R.A.; Corthals, G.L.; Palva, A.; et al. Faecal Metaproteomic Analysis Reveals a Personalized and Stable Functional Microbiome and Limited Effects of a Probiotic Intervention in Adults. PLoS ONE 2016, 11, e0153294. [Google Scholar] [CrossRef] [Green Version]
  30. Zhong, H.; Ren, H.; Lu, Y.; Fang, C.; Hou, G.; Yang, Z.; Chen, B.; Yang, F.; Zhao, Y.; Shi, Z.; et al. Distinct gut metagenomics and metaproteomics signatures in prediabetics and treatment-naïve type 2 diabetics. EBioMedicine 2019, 47, 373–383. [Google Scholar] [CrossRef]
  31. Eichenfield, L.F.; Ahluwalia, J.; Waldman, A.; Borok, J.; Udkoff, J.; Boguniewicz, M. Current guidelines for the evaluation and management of atopic dermatitis: A comparison of the Joint Task Force Practice Parameter and American Academy of Dermatology guidelines. J. Allergy Clin. Immunol. 2017, 139, S49–S57. [Google Scholar] [CrossRef] [Green Version]
  32. Costea, P.I.; Zeller, G.; Sunagawa, S.; Pelletier, E.; Alberti, A.; Levenez, F.; Tramontano, M.; Driessen, M.; Hercog, R.; Jung, F.E.; et al. Towards standards for human fecal sample processing in metagenomic studies. Nat. Biotechnol. 2017, 35, 1069–1076. [Google Scholar] [CrossRef]
  33. White, T.J.; Bruns, T.; Lee, S.J.W.T.; Taylor, J. Amplification And Direct Sequencing of Fungal Ribosomal Rna Genes for Phylogenetics. In PCR Protocols; Innis, M.A., Gelfand, D.H., Sninsky, J.J., White, T.J., Eds.; Academic Press: San Diego, CA, USA, 1990; pp. 315–322. [Google Scholar]
  34. BBMap. Available online: http://sourceforge.net/projects/bbmap/ (accessed on 10 May 2020).
  35. Edgar, R.C. Search and clustering orders of magnitude faster than BLAST. Bioinformatics 2010, 26, 2460–2461. [Google Scholar] [CrossRef] [Green Version]
  36. Edgar, R.C. UPARSE: Highly accurate OTU sequences from microbial amplicon reads. Nat. Methods 2013, 10, 996–998. [Google Scholar] [CrossRef]
  37. Edgar, R.C. SINTAX: A simple non-Bayesian taxonomy classifier for 16S and ITS sequences. bioRxiv 2016, 074161. [Google Scholar] [CrossRef] [Green Version]
  38. Abarenkov, K.; Allan, Z.; Piirmann, T.; Pöhönen, R.; Ivanov, F.; Nilsson, R.H.; Kõljalg, U. UNITE USEARCH/UTAX release for Fungi. Version 04.02.2020. UNITE Community 2020. [Google Scholar] [CrossRef]
  39. Edgar, R.C. MUSCLE: A multiple sequence alignment method with reduced time and space complexity. BMC Bioinform. 2004, 5, 113. [Google Scholar] [CrossRef] [Green Version]
  40. Froger, A.; Hall, J.E. Transformation of plasmid DNA into E. coli using the heat shock method. J. Vis. Exp. 2007, 6, 253. [Google Scholar] [CrossRef] [PubMed]
  41. Losuwannarak, N.; Maiuthed, A.; Kitkumthorn, N.; Leelahavanichkul, A.; Roytrakul, S.; Chanvorachote, P. Gigantol Targets Cancer Stem Cells and Destabilizes Tumors via the Suppression of the PI3K/AKT and JAK/STAT Pathways in Ectopic Lung Cancer Xenografts. Cancers 2019, 11, 2032. [Google Scholar] [CrossRef] [PubMed] [Green Version]
  42. Lowry, O.H.; Rosebrough, N.J.; Farr, A.L.; Randall, R.J. Protein measurement with the Folin phenol reagent. J. Biol. Chem. 1951, 193, 265–275. [Google Scholar] [CrossRef]
  43. Tyanova, S.; Temu, T.; Cox, J. The MaxQuant computational platform for mass spectrometry-based shotgun proteomics. Nat. Protoc. 2016, 11, 2301–2319. [Google Scholar] [CrossRef]
  44. Bardou, P.; Mariette, J.; Escudié, F.; Djemiel, C.; Klopp, C. Jvenn: An interactive Venn diagram viewer. BMC Bioinform. 2014, 15, 293. [Google Scholar] [CrossRef] [PubMed] [Green Version]
  45. Kanehisa, M.; Sato, Y.; Morishima, K. BlastKOALA and GhostKOALA: KEGG Tools for Functional Characterization of Genome and Metagenome Sequences. J. Mol. Biol. 2016, 428, 726–731. [Google Scholar] [CrossRef] [PubMed] [Green Version]
  46. Benjamini, Y.; Krieger, A.; Yekutieli, D. Adaptive linear step-up false discovery rate controlling procedures. Biometrika 2006, 93, 491–507. [Google Scholar] [CrossRef]
  47. Novicki, T.J.; LaFe, K.; Bui, L.; Bui, U.; Geise, R.; Marr, K.; Cookson, B.T. Genetic Diversity among Clinical Isolates of Acremonium Strictum Determined during an Investigation of a Fatal Mycosis. J. Clin. Microbiol. 2003, 41, 2623–2628. [Google Scholar] [CrossRef] [Green Version]
  48. Ott, S.J.; Kühbacher, T.; Musfeldt, M.; Rosenstiel, P.; Hellmig, S.; Rehman, A.; Drews, O.; Weichert, W.; Timmis, K.N.; Schreiber, S. Fungi and inflammatory bowel diseases: Alterations of composition and diversity. Scand. J. Gastroenterol. 2008, 43, 831–841. [Google Scholar] [CrossRef] [PubMed]
  49. Arunasri, K.; Mahesh, M.; Sai Prashanthi, G.; Jayasudha, R.; Kalyana Chakravarthy, S.; Tyagi, M.; Pappuru, R.R.; Shivaji, S. Mycobiome changes in the vitreous of post fever retinitis patients. PLoS ONE 2020, 15, e0242138. [Google Scholar] [CrossRef] [PubMed]
  50. Anandakumar, A.; Pellino, G.; Tekkis, P.; Kontovounisios, C. Fungal microbiome in colorectal cancer: A systematic review. Updates Surg. 2019, 71, 625–630. [Google Scholar] [CrossRef]
  51. Sokol, H.; Leducq, V.; Aschard, H.; Pham, H.P.; Jegou, S.; Landman, C.; Cohen, D.; Liguori, G.; Bourrier, A.; Nion-Larmurier, I.; et al. Fungal microbiota dysbiosis in IBD. Gut 2017, 66, 1039. [Google Scholar] [CrossRef] [Green Version]
  52. García-Hernández, Y.; Rodríguez, Z.; Brandão, L.R.; Rosa, C.A.; Nicoli, J.R.; Iglesias, A.E.; Peréz-Sanchez, T.; Salabarría, R.B.; Halaihel, N. Identification and in vitro screening of avian yeasts for use as probiotic. Res. Vet. Sci. 2012, 93, 798–802. [Google Scholar] [CrossRef] [PubMed]
  53. Hjortmo, S.B.; Hellström, A.M.; Andlid, T.A. Production of folates by yeasts in Tanzanian fermented togwa. FEMS Yeast Res. 2008, 8, 781–787. [Google Scholar] [CrossRef] [Green Version]
  54. Fincher, R.M.; Fisher, J.F.; Lovell, R.D.; Newman, C.L.; Espinel-Ingroff, A.; Shadomy, H.J. Infection due to the fungus Acremonium (cephalosporium). Medicine 1991, 70, 398–409. [Google Scholar] [CrossRef]
  55. Nucci, M.; Anaissie, E.J. Chapter 13—Hyalohyphomycosis. In Clinical Mycology, 2nd ed.; Anaissie, E.J., McGinnis, M.R., Pfaller, M.A., Eds.; Churchill Livingstone: Edinburgh, UK, 2009; pp. 309–327. [Google Scholar]
  56. Moreno-Sabater, A.; Autaa, G.; Sterlin, D.; Jerbi, A.; Villette, R.; Holm, J.B.; Parizot, C.; Selim, S.; Senghor, Y.; Ghillani-Dalbin, P.; et al. Systemic anti-commensal response to fungi analyzed by flow cytometry is related to gut mycobiome ecology. Microbiome 2020, 8, 159. [Google Scholar] [CrossRef]
  57. Tuon, F.F.; Costa, S.F. Rhodotorula infection. A systematic review of 128 cases from literature. Rev. Iberoam. Micol. 2008, 25, 135–140. [Google Scholar] [CrossRef]
  58. Goravey, W.; Ali, G.A.; Abid, F.; Ibrahim, E.B.; Al Maslamani, M.A.; Abdel Hadi, H. Central line-associated Rhodotorula mucilaginosa fungemia in an immunocompetent host: Case report and review of the literature. Clin. Case Rep. 2021, 9, 2158–2161. [Google Scholar] [CrossRef] [PubMed]
  59. Mims, T.S.; Al Abdallah, Q.; Stewart, J.D.; Watts, S.P.; White, C.T.; Rousselle, T.V.; Gosain, A.; Bajwa, A.; Han, J.C.; Willis, K.A.; et al. The gut mycobiome of healthy mice is shaped by the environment and correlates with metabolic outcomes in response to diet. Commun. Biol. 2021, 4, 281. [Google Scholar] [CrossRef] [PubMed]
  60. Swift, C.L.; Louie, K.B.; Bowen, B.P.; Olson, H.M.; Purvine, S.O.; Salamov, A.; Mondo, S.J.; Solomon, K.V.; Wright, A.T.; Northen, T.R.; et al. Anaerobic gut fungi are an untapped reservoir of natural products. Proc. Natl. Acad. Sci. USA 2021, 118, e2019855118. [Google Scholar] [CrossRef] [PubMed]
  61. Buldain, I.; Pellon, A.; Zaldibar, B.; Antoran, A.; Martin-Souto, L.; Aparicio-Fernandez, L.; Areitio, M.; Mayayo, E.; Rementeria, A.; Hernando, F.L.; et al. Study of Humoral Responses against Lomentospora/Scedosporium spp. and Aspergillus fumigatus to Identify L. prolificans Antigens of Interest for Diagnosis and Treatment. Vaccines 2019, 7, 212. [Google Scholar] [CrossRef] [Green Version]
  62. Buldain, I.; Martin-Souto, L.; Antoran, A.; Areitio, M.; Aparicio-Fernandez, L.; Rementeria, A.; Hernando, F.L.; Ramirez-Garcia, A. The Host Immune Response to Scedosporium/Lomentospora. J. Fungi 2021, 7, 75. [Google Scholar] [CrossRef]
  63. Ferguson, A.C.; Salinas, F.A. Elevated IgG immune complexes in children with atopic eczema. J. Allergy Clin. Immunol. 1984, 74, 678–682. [Google Scholar] [CrossRef]
  64. Totté, J.E.E.; Pardo, L.M.; Fieten, K.B.; de Wit, J.; de Boer, D.V.; van Wamel, W.J.; Pasmans, S.G.M.A. IgG response against Staphylococcus aureus is associated with severe atopic dermatitis in children. Br. J. Dermatol. 2018, 179, 118–126. [Google Scholar] [CrossRef] [PubMed]
  65. Bublin, M.; Eiwegger, T.; Breiteneder, H. Do lipids influence the allergic sensitization process? J. Allergy Clin. Immunol. 2014, 134, 521–529. [Google Scholar] [CrossRef] [PubMed] [Green Version]
  66. Chiaro, T.R.; Soto, R.; Stephens, W.Z.; Kubinak, J.L.; Petersen, C.; Gogokhia, L.; Bell, R.; Delgado, J.C.; Cox, J.; Voth, W.; et al. A member of the gut mycobiota modulates host purine metabolism exacerbating colitis in mice. Sci. Transl. Med. 2017, 9, eaaf9044. [Google Scholar] [CrossRef] [PubMed]
Figure 1. Gut mycobiome alpha diversity (A) and beta diversity (B) in healthy and atopic dermatitis infants. The alpha diversity is depicted as box and whisker plots; the horizontal line represents the median value, while the ‘+’ represents the mean value. Beta diversity is depicted by a Principal Component Analysis (PCA) plot generated based on the relative abundance percentage of fungi at the taxonomic class level. Bi-plot analysis was used to plot significantly different abundant taxa (p-value 0.05). There was no statistically significant difference between the three groups (p > 0.05).
Jof 07 00748 g001
Figure 2. Gut mycobiome of healthy infants and infants with atopic dermatitis. Box and whisker plots depict fungal diversity classification at phylum level (A) and the ratio of Ascomycota to Basidiomycota phyla in each group of infants (B). The horizontal line represents median value, while the ‘+’ represents mean value. There was no statistically significant difference between the three groups (p > 0.05).
Jof 07 00748 g002
Figure 3. The relative abundance of fungal genera and prevalent compromising the gut mycobiome of healthy and atopic dermatitis infants. The heat map portraying the relative abundance (root four value) of each taxon per infant (H—healthy, O—outgrown, P—persisted). The genera marked with a red asterisk differed significantly between the three groups (p-value 0.05).
Jof 07 00748 g003
Figure 4. Quantification of altered total fungi and genera, including Kodamaea sp., Wickerhamomyces sp., Rhodotorula sp., and Rhizopus sp. The horizontal line represents the median value, while ‘+’ represents the mean value. There was no statistically significant difference between the three groups (p > 0.05).
Jof 07 00748 g004
Figure 5. Venn diagram depicting the number of proteins from Rhodotorula sp. in each group of infants.
Jof 07 00748 g005
Table 1. List of primers and probe sequences for quantitative real-time polymerase chain reaction.
AssayPrimer Sequence (5′ to 3′)Annealing Temp (°C)Size (bp)Reference
Total fungiITS3: GCATCGATGAAGAACGCAGC
ITS4-NGS: TCCTCCGCTTATTGATATGC
56Variable[2]
Rhodotorula sp.Rho-F: TCCGGGATGGATAATGGTAGAGAG
Rho-R: CCTAAGTGTGAAGAGGTCGAAAC
54129This study
Wickerhamomyces sp.Wic-F: TGGGTTTGGCTCTTGTCTATG
Wic-R: CGACTCTTCGATAGCACCTTAC
54104This study
Rhizopus sp.Rz-F: CTGTAGAAGTGTTTTCCAGGCAAGCCG
Rz-R: CCCAAACAACCTGACTCTT
56133This study
Kodamaea sp.Kod-F: CGACCGTGTCTATGTTCCTTGGAAC
Kod-R: ACTCGTCGAGAGCGCCTTAT
5695This study
Acremonium sp.Acre-F: GAGACCTTAACCTACTAACTAGCCCGTAT
Acre-R: GTTATTGCCTCAAACTTCCCTCGGCTTG
Probe: GCTTTGGCAGTACGCTGGCTTCTTAG
5498This study
Table 2. Clinical characteristics of infants.
ParameterHealthyOutgrownPersistedp-Value
Sampling point (month)10.59 ± 1.5410.29 ± 1.610.2 ± 1.550.79
Sex (female/male)6/113/43/70.7581
Gestational age (month)38.45 ± 2.0239.14 ± 1.8638.7 ± 20.5167
Birth delivery mode (v/cs)12/57/05/50.0957
Birth weight (g)3207 ± 215.23057 ± 239.52967 ± 411.10.2113
Breastfeed duration (month)8.96 ± 4.276.71 ± 5.027.85 ± 4.440.4723
Age of solid food introduction (month)5.64 ± 0.925.43 ± 0.985.4 ± 0.840.7512
Severity of atopic dermatitis (mild/moderate)2/72/100.4593
v—vaginal, cs—caesarian section. Values are based on average ± standard deviation.
Table 3. Number of proteins from five fungi with more than 50% prevalence level per group.
FungiHealthy (n = 11)Outgrown (n = 7)Persisted (n = 5)p-Value
Total protein13418581485
Average protein per sample122143297
Acremonium sp.339.6 ± 281 b160.9 ± 261.5 b889.5 ± 133.2 a0.0023
Kodamaea sp.20.21 ± 13.28 a10.64 ± 12.26 a30.42 ± 3.43 a0.0784
Wickerhamomyces sp.355.5 ± 294.5 b168 ± 270.9 b956.4 ± 151.4 a0.0021
Rhodotorula sp.368.9 ± 299.7 b178.5 ± 292.5 b971.5 ± 143.6 a0.0026
Rhizopus sp.351.4 ± 287 b162.4 ± 268.4 b940.8 ± 138.8 a0.0022
a,b Significance between sample groups is indicated by different lowercase superscripts (p < 0.05). Values are based on average ± standard deviation.
Table 4. Functional categories of the unique proteins in the persisted group.
Accession NumberOrganismFunctional CategorySub-Functional CategoryProtein Name
A0A086TGW8Acremonium sp.MetabolismAmino acid metabolism4-hydroxyphenylpyruvate dioxygenase
A0A086T8N3Acremonium sp.MetabolismCarbohydrate metabolism1,3-beta-glucan synthase
A0A086SWD1Acremonium sp.Organismal systemsEndocrine systemexocyst complex component 7
A0A086TCH4Acremonium sp.Genetic information processingFolding, sorting, and degradationubiquitin-conjugating enzyme E2
A0A086TBI1Acremonium sp.MetabolismLipid metabolismglycerophosphodiester phosphodiesterase
A0A086T3W0Acremonium sp.MetabolismMetabolism of cofactors and vitamins5-formyltetrahydrofolate cyclo-ligase
A0A086TD10Acremonium sp.Genetic information processingReplication and repairbloom syndrome protein
A0A367JPM9Rhizopus sp.MetabolismAmino acid metabolismgamma-glutamyl hercynylcysteine S-oxide synthase
A0A2G4SN35Rhizopus sp.Genetic information processingFolding, sorting, and degradation20S proteasome subunit alpha 4
I1CUB3Rhizopus sp.Genetic information processingTranslationsmall subunit ribosomal protein
A0A0K3CQU6Rhodotorula sp.MetabolismLipid metabolismglycerol kinase
A0A511KMS2Rhodotorula sp.Genetic information processingTranslationH/ACA ribonucleoprotein complex subunit 4
A0A511K989Rhodotorula sp.Human diseaseCancerRAN-binding protein 1
K0KHA2Wickerhamomyces sp.Genetic information processingFolding, sorting, and degradationYidC/Oxa1 family membrane protein insertase
A0A1E3NZ77Wickerhamomyces sp.Genetic information processingReplication and repairDNA excision repair protein ERCC-6
K0KHS6Wickerhamomyces sp.Genetic information processingTranscriptionDNA-directed RNA polymerase I subunit RPA2
Publisher’s Note: MDPI stays neutral with regard to jurisdictional claims in published maps and institutional affiliations.

