Article

Effects of Flurochloridone Application on Rhizosphere Soil Fungal Community and Composition in Potato Growing Areas of the Qinghai-Tibet Plateau

1
State Key Laboratory of Soil Erosion and Dryland Farming on the Loess Plateau, Northwest A&F University, Xiangyang 712100, China
2
Academy of Agriculture and Forestry Sciences, Qinghai University, Xining 810016, China
3
Key Laboratory of Agricultural Integrated Pest Management of Qinghai Province, Qinghai University, Xining 810016, China
4
College of Forestry, Northwest A&F University, Xiangyang 712100, China
*
Author to whom correspondence should be addressed.
J. Fungi 2021, 7(6), 420; https://doi.org/10.3390/jof7060420
Submission received: 19 March 2021 / Revised: 19 May 2021 / Accepted: 22 May 2021 / Published: 27 May 2021
(This article belongs to the Section Environmental and Ecological Interactions of Fungi)

Abstract

:
The application of herbicides to arable land is still the most effective and accepted method to protect plants from weeds. Extensive use of chemicals in conventional agricultural practices has resulted in continuous and serious environmental pollution. Flurochloridone (FLC) is a monophenyl pyrrolidinone selective herbicide that is commonly used to inhibit weeds that occur during the growth of potatoes. In recent years, research on the toxicity of FLC has gradually increased. However, it is relatively rare to analyze the role of FLC by studying the composition of soil microorganisms. Therefore, we used NGS methods to identify the fungal community structure of the low content soil (LS) and high content soil (HS) samples in this study. Subsequently, we identified the fungal community and composition differences of these two group samples using the statistical analysis. Despite the variances of fungal community and composition across the different samples within the group, the fungal composition of the LS samples and the HS samples. LS samples were predominated by Ascomycota, while the HS samples were predominated by Mortierellomycota and Basidiomycota. The major species in the LS samples were Plectosphaerella cucumerina and Trichocladium asperum, whereas the dominant species in the HS samples were Epicoccum nigrum and Cladosporium chasmanthicola. These results suggested that the LS samples and the HS samples had different rhizosphere soil fungal community and composition changes resulting from implementation of FLC in potato growing areas.

1. Introduction

Environmental stresses pose a serious threat to agricultural production globally, and herbicides are among the most widely applied agrochemicals, significantly increasing agricultural productivity and crop yields [1,2,3,4]. Flurochloridone (FLC) is a monophenyl pyrrolidinone selective herbicide that is commonly used to inhibit weeds that occur during the growth of crop plants, such as grains, sunflowers, and potatoes [5,6,7,8,9,10]. FLC can cause bleaching of plant leaves through interference with carotenoid biosynthesis [11]. The target site of FLC in weeds is phytoene desaturase (PDS) [12].
The application of herbicides to arable land is still the most effective and accepted method to protect plants from weeds [2]. Extensive use of chemicals in conventional agricultural practices has resulted in continuous and serious environmental pollution. Because of this, public concerns over the residues of herbicides in the environment and in crops have increased over the last decades [13]. In recent years, research on the toxicity of FLC has gradually increased [5,6,7,8,9,10]. However, it is relatively rare to analyze the role of FLC by studying the composition of soil microorganisms.
The rhizosphere zone, a microclimate of soil that surrounds and is influenced by plant roots, harbors a vast number of soil biota involved in complex biological and ecological processes, and it is considered one of the most dynamic interfaces among ecosystems [14,15]. The importance of the soil microbiome has been recognized for more than a century, and there is a long history of research that describes the microorganisms that inhabit soil, their metabolic capabilities, and their influence on soil fertility [16,17,18]. Most current studies focus on the impact of environmental factors on the composition of bacterial communities [19,20,21]. Here, we will investigate the effects of FLC application on rhizosphere soil fungal community and composition in potato growing areas.
Recent methodological advances have enabled researchers to chart the full extent of soil microbial diversity and to build a more comprehensive understanding of specific microbial controls on soil processes. In particular, the next-generation sequencing (NGS) technique has been successfully applied the rhizosphere soil microbial community and composition, because it can provide more detailed information and in-depth microbial community insights when compared to other molecular biology methods [22,23,24,25,26].
In this study, the NGS technique was used to analyze the role of FLC by studying the composition of rhizosphere soil fungal microorganisms in potato growing areas of Qinghai-Tibet Plateau in China. We systematically compared the differences of the fungal communities in FLC application soil. The fungal microbial compositions were determined by the NGS technique of the internal transcribed spacer (ITS) region. This work is to determine rhizosphere soil fungal community and composition changes resulting from implementation of FLC in potato growing areas. It aims to clarify the issues of its dosage, period of use, method of use and safety, and provide a data basis for the large-scale application of the agent in the Qinghai-Tibet Plateau and even the other potato fields.

2. Materials and Methods

2.1. Field Trials, Soil Sampling, and Preparation

The soil sampling was conducted in a potato growing areas in Qinghai-Tibet Plateau, Qinghai province. The location was at a longitude of 89°35′–103°04′ E and latitude of 31°39′–39°19′ N. The FLC and other chemicals used in the present study were of analytical grade from Sinopharm Chemical Reagent Co., Ltd. (Beijing, China). The experimental soil used in the study was castanozems. The soil was mixed thoroughly with 750 (low content soil, LS) and 1125 (high content soil, HS) g/hm2 FLC. After 1, 3, 6, 9, 12, 15, 18, 21, 24, 27, 30, 33, 36, 39, 42, 45, and 48 days, each sample comprised three biological replicates, and the rhizosphere soil samples were collected, respectively. The roots of each plant were gently shaken to remove the redundant soil, and the remaining soil adhered to the root hairs was collected with a brush and sieved with a 2-mm aperture sieve. The specific method details refer to previous research [27,28]. In total, 108 rhizosphere soil samples were collected to analyze the fungal community and composition by NGS technique sequencing.

2.2. Soil Properties Analysis

In order to investigate the changes of physicochemical properties, seven soil physicochemical were analyzed. The soil pH was determined using a calibrated pH meter (PHS-3C, LeiCi) by the microelectrode method [29]. The soil organic matter (OM) content was determined using thermal dichromate oxidation colorimetry [30]. Available potassium was determined in ammonium acetate extracts by flame photometry. Available phosphorus was extracted with 0.025 mol × L−1 HCl and 0.03 mol × L−1 NH4F and measured by a spectrophotometer. Soil TP was determined colorimetrically using the molybdate method. Total nitrogen (TN) content determined by Kjeldahl digestion method.

2.3. Next-Generation Sequencing

Total genome DNA from rhizosphere soil samples was extracted using the soil DNA extraction kit following the protocol provided by the manufacturer (MoBio Power Soil DNA extraction kit 12888-50, Guangzhou, China). DNA concentration and purity was monitored on 1% agarose gels. According to the concentration, DNA was diluted to 1 ng/µL using sterile water.
The internal transcribed spacer regions of the ribosomal RNA gene were amplified by PCR using the primers ITS1-1F-F CTTGGTCATTTAGAGGAAGTAA, ITS1-1F-R GCTGCGTTCTTCATCGATGC [31,32]. All PCR reactions were carried out with 15 µL of Phusion® High-Fidelity PCR Master Mix (New England Biolabs, Ipswich, MA, USA); 2 µM of forward and reverse primers, and about 10 ng template DNA. Thermal cycling consisted of initial denaturation at 98 °C for 1 min, followed by 30 cycles of denaturation at 98 °C for 10 s, annealing at 50 °C for 30 s, and elongation at 72 °C for 30 s. Finally, 72 °C for 5 min. The “barcode” is an eight-base sequence unique to each sample. Mix same volume of 1x loading buffer (contained SYB green) with PCR products and operate electrophoresis on 2% agarose gel for detection. PCR products was mixed in equidensity ratios. Then, mixture PCR products was purified with Qiagen Gel Extraction Kit (Qiagen, Dusseldorf, Germany).
The sequencing libraries were generated using TruSeq® DNA PCR-Free Sample Preparation Kit (Illumina, San Diego, CA, USA) following the manufacturer’s recommendations, and index codes were added. The library quality was assessed on the Qubit@ 2.0 Fluorometer (Thermo Scientific, Waltham, MA, USA) and Agilent Bioanalyzer 2100 system. Finally, the library was sequenced on an Illumina NovaSeq platform and 250 bp paired-end reads were generated.

2.4. Sequence Analysis Processing

The paired-end reads were assigned to samples based on their unique barcodes and truncated by cutting off the barcode and primer sequence. Paired-end reads were merged using FLASH (V1.2.7, http://ccb.jhu.edu/software/FLASH/, accessed on 22 May 2021) [32], a very fast and accurate analysis tool, which was designed to merge paired-end reads when at least some of the reads overlapped the read generated from the opposite end of the same DNA fragment, and the splicing sequences were called raw tags; quality filtering on the raw tags were performed under specific filtering conditions to obtain the high-quality clean tags according to the QIIME (V1.9.1, http://qiime.org/scripts/split_libraries_fastq.html, accessed on 22 May 2021) quality control process [33,34]. In brief, raw tags were truncated from the first low-quality base site, in a row, with low quality value (default quality threshold ≤19), and the set length (default length value is 3). Next, further filtering out the continuous high quality base length was less than the length of the tags (75% of tags), after obtaining the tags data set. The tags were compared with the reference database (Silva database) using the UCHIME algorithm (http://www.drive5.com/usearch/manual/uchime_algo.html, accessed on 22 May 2021) to detect chimera sequences, and then the chimera sequences were removed. Then the effective tags were finally obtained.
The sequence analyses were performed by Uparse software (Uparse v7.0.1001, http://drive5.com/uparse/, accessed on 22 May 2021) [35]. Sequences with ≥97% similarity were assigned to the same OTUs. A representative sequence for each OTU was screened for further annotation [36]. Alpha diversity was applied in analyzing complexity of species diversity for a sample through six indices: observed-species, Chao1, Shannon, Simpson, ACE, good-coverage. All of the indices in our samples were calculated with QIIME (Version 1.7.0) and displayed with R software (Version 2.15.3). Beta diversity analysis was used to evaluate differences of samples in species complexity, Beta diversity on both weighted and unweighted UniFrac were calculated by QIIME software (Version 1.9.1).

3. Results and Discussion

3.1. Physicochemical Properties

As shown in Table S1, the TN contents of the LS samples and the HS samples ranged from 1.51 to 1.58 g/kg and 1.40 to 1.47 g/kg, respectively. The AN contents of the LS samples varied from 149.33 to 157.21 g/kg, whereas the HS samples had a lower AN (129.45–140.29 g/kg). The OM contents (26.89–28.48 g/kg) in the LS samples were higher than those in the HS samples (24.09–25.24 g/kg). The results TP, TK, AP, AK content showed no significant differences in the LS samples and the HS samples. The pH values between the LS samples and the HS samples also showed no significant differences. Suggesting that the FLC may affect rhizosphere soil microorganisms by changing the contents of nitrogen and OM. Nitrogen fertilizer input provided soil microorganisms simultaneously with N, and the N requiring components for microbial biomass [37,38,39,40,41].

3.2. Phylogenetic Composition and Alpha-Diversity

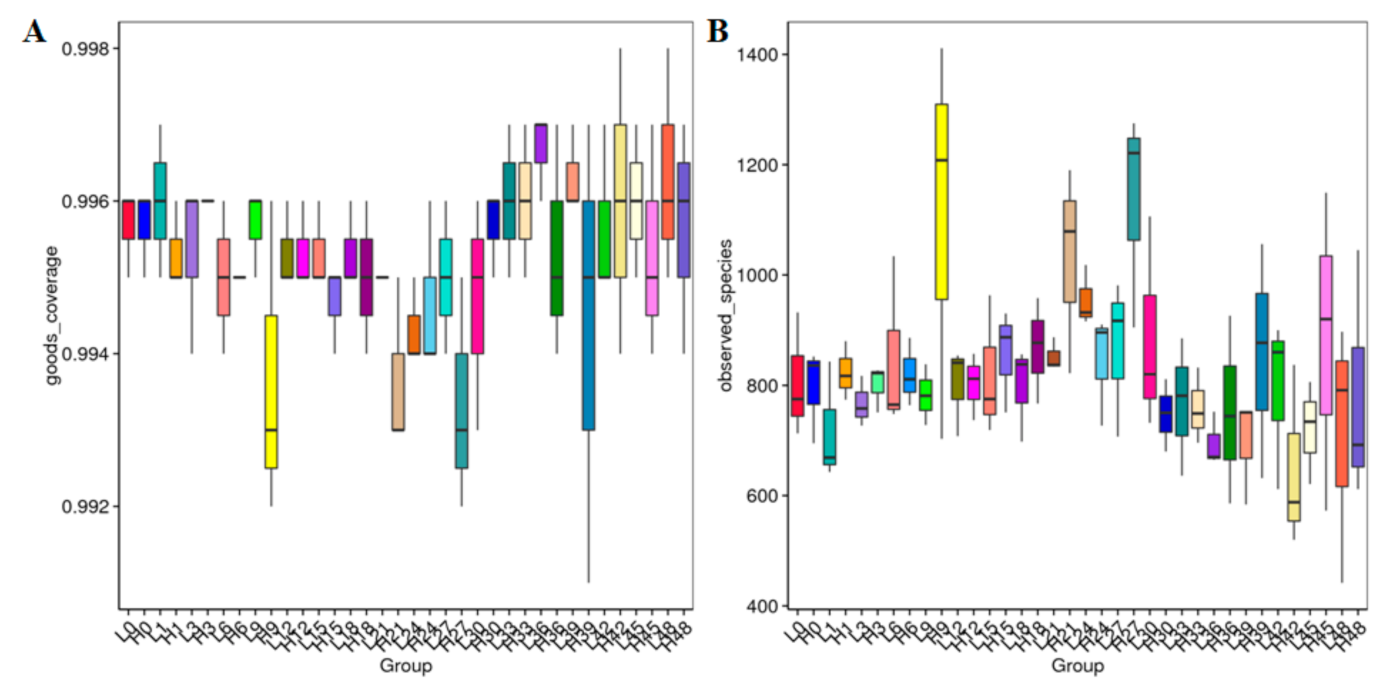
An average of 89,010 per samples were obtained from the 108 samples (the 9,641,840 clean reads in total) (Table S2).These samples are based on the rarefaction curve, and the rank abundance analysis by 97% similarity of OTU (Figure 1A,B) shows that our sequencing depth meets the requirements of rhizosphere soil fungal microorganism sequencing and analysis. In addition, the fungal microorganism species accumulation curve shows that our samples are sufficient for OTU testing and can predict the species richness of the samples (Figure 1C). The good coverage value of each sample was >0.99, indicating that the rhizosphere soil fungal community and composition information is sufficient to reveal most fungal communities. The alpha-diversity of the results suggesting that the LS sample fungal diversity was higher than that of the HS samples (Figure 2 and Table S3).

3.3. Rhizosphere Soil Fungal Community and Composition

Sequencing the ITS gene of all the soil samples showed that the soil fungal communities in all samples covered 14 phyla, 42 classes, 99 families, 204 families, 394 genera, and 405 species.
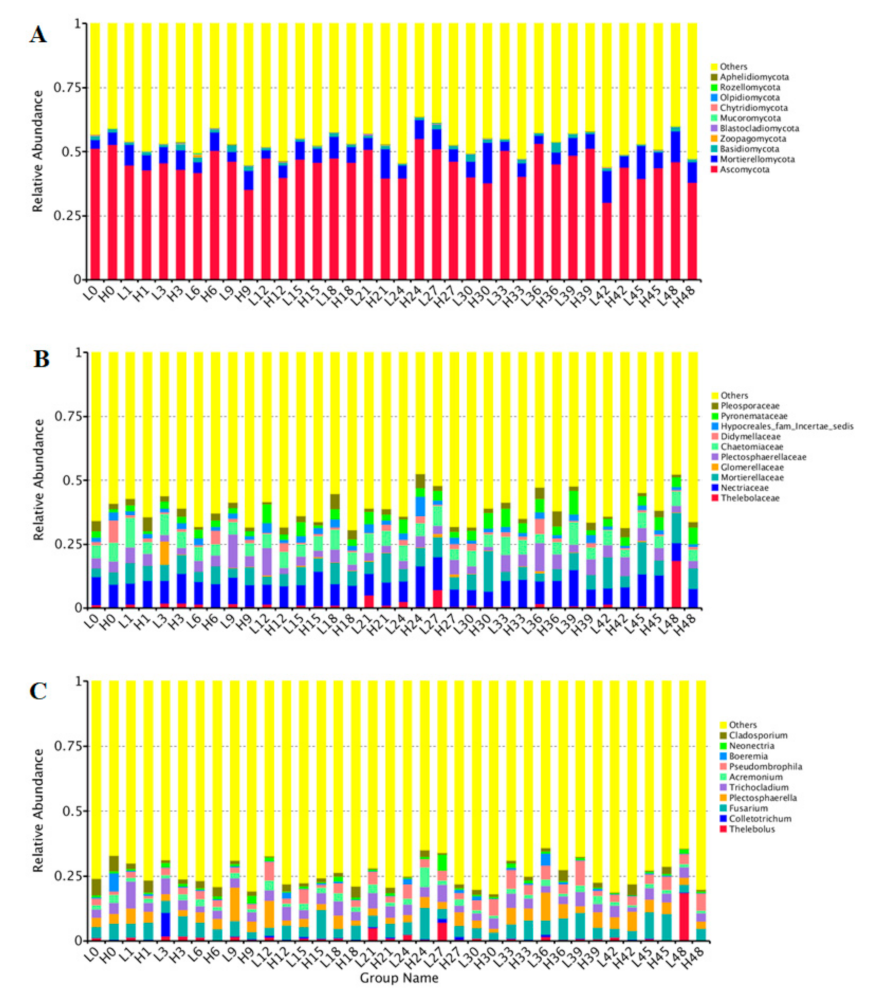
At the phylum level (Figure 3A), Ascomycota was the most important phylum in LS and HS samples. The relative abundance of Ascomycota in the LS samples was higher than that in the HS samples. In contrast, the relative abundance of Mortierellomycota and Basidiomycota in the LS samples was lower than that in the HS samples.
Ascomycota plays an important role in the degradation of rhizosphere soil organic matter. It is speculated that the decrease in relative abundance of Ascomycota may be related to the decline of soil organic matter and soil fertility [42,43].
At the family level (Figure 3B), the more importantrhizosphere soil fungal communities in the LS samples and the HS samples belonged to the top 10 families (Thelebolaceae, Nectriaceae, Mortierellaceae, Glomerellaceae, Plectosphaerellaceae, Chaetomiaceae, Didymellaceae, Hypocreales_fam_Incertae_sedis, Pyronemataceae, and Pleosporaceae). Overall, Thelebolaceae was the most abundant family in both LS and HS samples. The proportions of Thelebolaceae in the LS samples were higher than that in the HS samples.
At the genera level (Figure 3C), Thelebolus was the most abundant in all the LS samples and the HS samples. The other genus with high abundance, included Colletotrichum, Fusarium, Plectosphaerella, Trichocladium, Acremonium, Pseudombrophila, Boeremia, Neonectria, and Cladosporium, respectively. In general, Thelebolus was more abundant in the LS samples than that in the HS samples, whereas Colletotrichum and Fusarium in the LS samples was less than in HS samples. At the genus level, Cadophora and Tetracladium were the dominant microorganisms among the plant mycobiota. Although their OTU abundances were different, both Cadophora and Tetracladium belong to Ascomycota, which is considered the most likely endophytic taxon to colonize plants [44]. Ascomycota is widespread in soil and plants, such as forage, flowers, and crops [45,46,47].
The top 10 species in both LS and HS samples included Thelebolus microsporus, Plectosphaerella cucumerina, Trichocladium asperum, Pseudombrophila hepatica, Boeremia exigua, Epicoccum_nigrum, Cladosporium chasmanthicola, Alternaria alternata, Metarhizium robertsii and Gibberella pulicaris (Table S4). The relative abundance of Thelebolus microsporus in the soil LS samples was much higher than that in the HS samples. The relative abundance of Plectosphaerella cucumerina and Trichocladium asperum in the soil LS samples were also higher than that in the HS samples, while the relative abundance of Epicoccum_nigrum and Cladosporium chasmanthicola in the soil LS samples were also lower than that in the HS samples.

3.4. Comparison between LS and HS Samples

Based on weighted and unweighted UniFrac distances, the PcoA showed the separation of the soil fungi communities between the LS samples and the HS samples (Figure 4A,B). By the weighted UniFrac distances, the values of cumulative percentage variance of species in the first (PC1) and the second (PC2) axes were 39.83% and 7.90%, respectively. In addition, according to the unweighted UniFrac distance, the first (PC1) and the second (PC2) axes accounted for 18.37% and 4.04% of the variance in the soil fungi communities of samples, respectively.
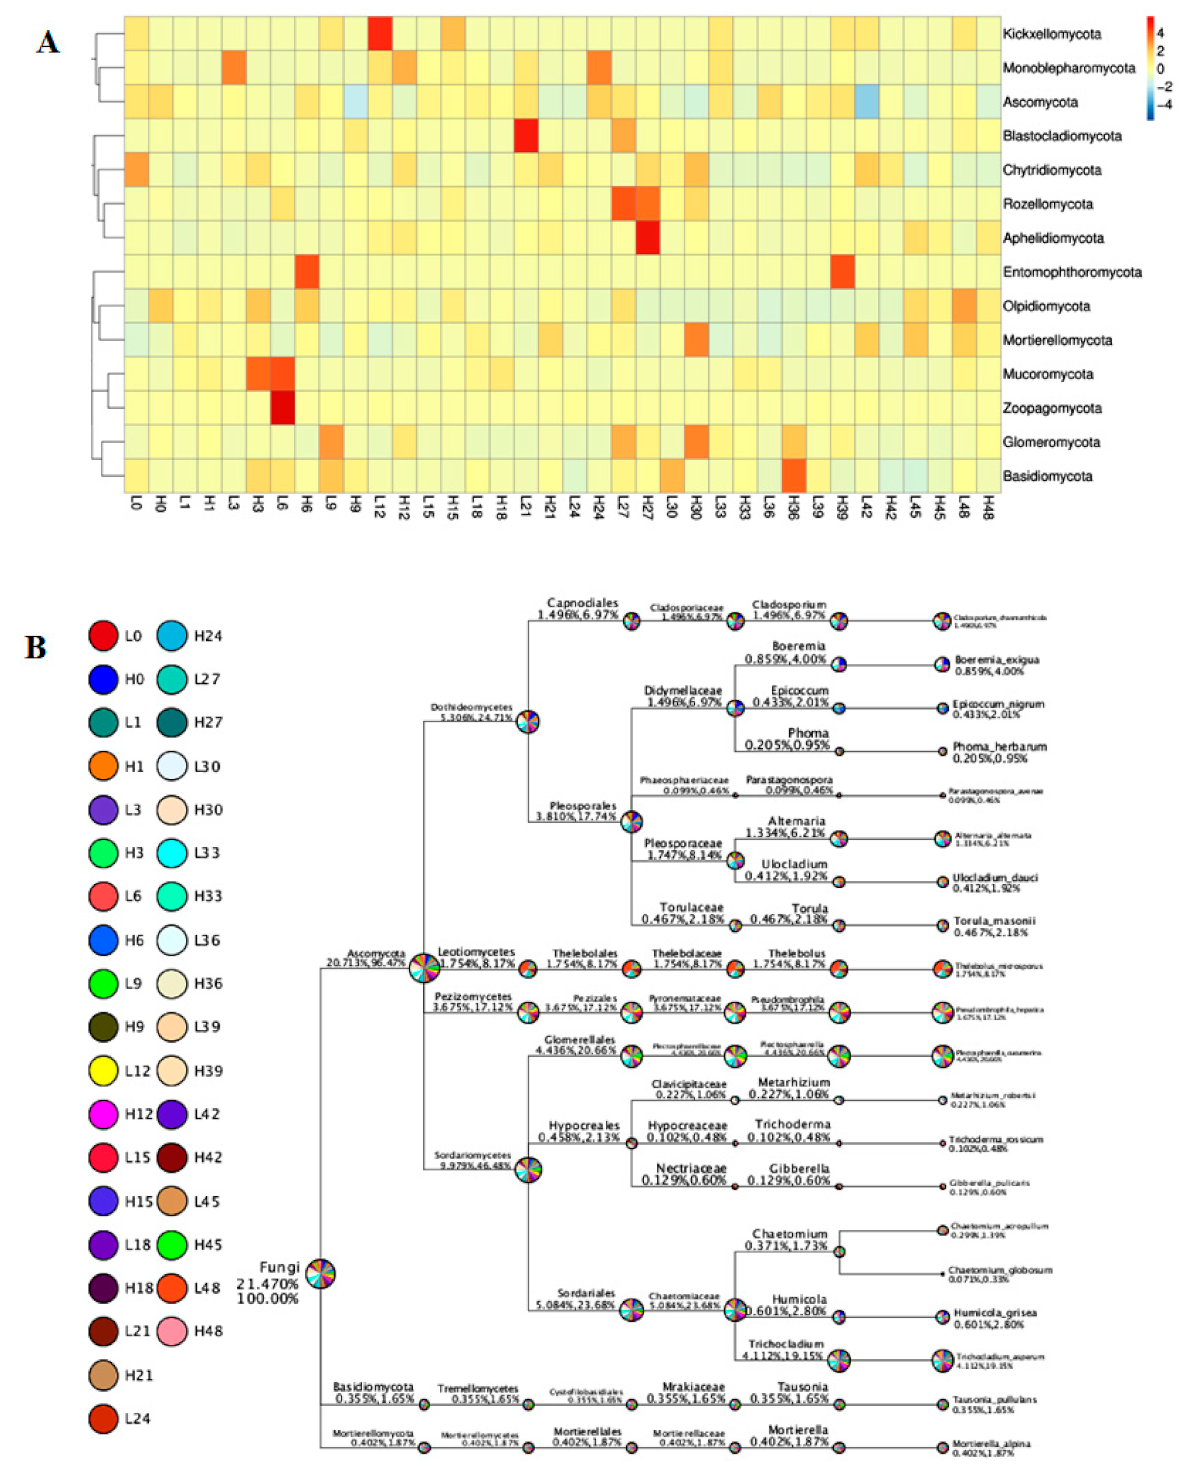
The differences and similarities of soil fungal community structures among samples were analyzed and compared using heat map analysis (Figure 5). As shown in Figure 5, the proportion of Thelebolaceae were more abundant in the soil LS samples, whereas the soil fungal communities, such as Chytridiomycota, Aphelidiomycota, Entomophthoromycota, and Basidiomycota, were more abundant in the soil HS samples.
The Linear Discriminant Analysis Effect Size (LEfSe) analysis was used to determine the significant difference of the fungal communities between the LS (L27) samples and the HS (H27) samples (Figure 6A,B). The relative abundances of the Thelebolales Thelebolaceae was significantly higher in the LS (L27) samples, while the Rozellomycotina_cls_Incertae_sedis was higher in the HS (H27) samples.
The rhizosphere soil fungal community and composition take on the role of soil decomposers. Different types and numbers of fungal communities play an important role in the process of material and energy cycles. They can convert complex and refractory organic matter, which is transformed into nutrient elements that plants can use [48,49,50].

4. Conclusions

We used the NGS technique to identify the rhizosphere soil fungal community and composition in the LS samples and the HS samples, and compared their fungal microbial and physicochemical properties. The 14 phyla, 42 classes, 99 orders, 204 families, 394 genera, and 405 species were identified in all of the rhizosphere soil samples. Despite the variances of soil fungal communities and compositions across the different samples, the fungal community, and composition of the LS samples and the HS samples, the LS samples were predominated by Ascomycota, while the HS samples were predominated by Mortierellomycota and Basidiomycota. The major species in the LS samples were Plectosphaerella cucumerina and Trichocladium asperum, whereas the dominant species in the HS samples were Epicoccum nigrum and Cladosporium chasmanthicola. These results provided a basic understanding of the fungal community and composition and the significant difference of fungal profiles in the LS samples and the HS samplesafter FLC application. However, the roles of these fungal communities in the rhizosphere soil in potato growing areasof the Qinghai-Tibet Plateau are still unknown, further research is needed to investigate the roles of these species in the rhizosphere soil.

Supplementary Materials

The following are available online at https://www.mdpi.com/article/10.3390/jof7060420/s1. Table S1. The pysicochemical properties of the LS samples and the HS samples; Table S2. Total number of reads, read length and quality control (QC) of the LS samples and the HS samples; Table S3. The alpha-diversity index and good’s coverage for the soil fungal community and composition information per sample; Table S4. The abundance of the top 10 species in the LS samples and the HS samples.

Author Contributions

W.L. conceived and designed the study with the help of Z.S.; W.L., S.S., H.C., Y.Z., L.D. and Y.L. performed the experiments, analyzed the data; W.L. drafted the manuscript; Z.S. reviewed the manuscript. All authors have read and agreed to the published version of the manuscript.

Funding

This work were supported by National Natural Science Fund (31860512), High-end Innovative Talents Thousands of Talents Project of Qinghai Province (2019), Qinghai Academy of Agriculture and Forestry Innovation Fund (2017-NKY-08) and Applied Basic Research Project of Qinghai Province (2018-ZJ-716).

Institutional Review Board Statement

Not applicable.

Informed Consent Statement

Not applicable.

Data Availability Statement

Data is contained within the article or supplementary material. It is also available from the author Wei Li ([email protected]).

Acknowledgments

We thank the editor and the two reviewers for the helpful comments that improved our work. We thank Bioeditas Technology Corporation (Shanxi, China) for technical assistance during the data analysis.

Conflicts of Interest

No potential conflict of interest was reported by the authors. The funders had no role in the design of the study; in the collection, analyses, or interpretation of data; in the writing of the manuscript, or in the decision to publish the results.

References

  1. Bolognesi, C. Genotoxicity of pesticides: A review of human biomonitoring studies. Mutat. Res. 2003, 543, 251–272. [Google Scholar] [CrossRef]
  2. Yüzbaşioğlu, D.; Ünal, F.; Sancak, C.; Kasap, R. Cytological effects of herbicide racer “fluorochloridone” on Allium cepa. Caryologia 2003, 56, 97–105. [Google Scholar] [CrossRef] [Green Version]
  3. Pareek, A.; Sopory, S.K.; Bohnert, H.J. Varietal Improvement for Abiotic Stress Tolerance in Crop Plants: Special Reference to Salinity in Rice. In Abiotic Stress Adaptation in Plants; Springer: Berlin, Germany, 2010; Volume 1, pp. 103–122. [Google Scholar] [CrossRef]
  4. Sondhia, S.; Choudhury, P.P.; Sharma, A.R. Environmental Fate of Herbicide Use in Central India. In Environmental Chemistry for a Sustainable World Herbicide Residue Research in India; Springer: Berlin, Germany, 2019; Volume 12, pp. 29–104, Chapter 2. [Google Scholar] [CrossRef]
  5. Rouchaud, J.; Neus, O.; Callens, D.; Bulcke, R. Herbicide flurochloridone soil biodegradation in potato crops. Toxicol. Environ. Chem. 1997, 61, 251–257. [Google Scholar] [CrossRef]
  6. Kaya, A.; Yigit, E. The physiological and biochemical effects of salicylic acid on sunflowers (Helianthus annuus) exposed to flurochloridone. Ecotoxicol. Environ. Saf. 2014, 106, 232–238. [Google Scholar] [CrossRef] [PubMed]
  7. Jursik, M.; Soukup, J.; Holec, J.; Andr, J.; Hamouzova, K. Efficacy and selectivity of pre-emergent sunflower herbicides under different soil moisture conditions. Plant Prot. Sci. 2015, 51, 214–222. [Google Scholar] [CrossRef] [Green Version]
  8. Liu, S.; Shi, J.; Zhang, S.; Tang, L.; Zhou, Z. Research Status of Biotoxicity Caused by Flurochloridone. J. Environ. Occup. Med. 2015, 32, 987–989. [Google Scholar]
  9. Hengzhi, W.; Wenlei, G.; Zhaozhen, W.; Jinni, T.; Jinxin, W. Weed Control Efficacy and Crop Safety of Fluorochloridone and Its Mixtures in Cotton Fields. Chin. Agric. Sci. Bull. 2016, 32, 66–70. [Google Scholar]
  10. Shi, J.; Xie, C.; Liu, H.; Krausz, K.W.; Bewley, C.A.; Zhang, S.; Tang, L.; Zhou, Z.; Gonzalez, F.J. Metabolism and Bioactivation of Fluorochloridone, a Novel Selective Herbicide, in Vivo and in Vitro. Environ. Technol. 2016, 50, 9652–9660. [Google Scholar] [CrossRef]
  11. Ogawa, H.; Yamada, I.; Arai, K.; Hirase, K.; Wakabayashi, K. Mode of bleaching phytotoxicity of herbicidal diphenylpyrrolidinones. Pest Manag. Sci. 2015, 57, 33–40. [Google Scholar] [CrossRef]
  12. Celar, F.A.; Kos, K. Effects of selected herbicides and fungicides on growth, sporulation and conidial germination of entomopathogenic fungus Beauveria bassiana. Pest Manag. Sci. 2016, 72, 2110–2117. [Google Scholar] [CrossRef]
  13. Marschner, P.; Crowley, D.; Yang, C.H. Development of specific rhizosphere bacterial communities in relation to plant species, nutrition and soil type. Plant Soil 2004, 261, 199–208. [Google Scholar] [CrossRef]
  14. Saha, S.; Gopinath, K.A.; Mina, B.L.; Gupta, H.S. Influence of continuous application of inorganic nutrients to a Maize-Wheat rotation on soil enzyme activity and grain quality in a rainfed Indian soil. Eur. J. Soil Biol. 2008, 44, 521–531. [Google Scholar] [CrossRef]
  15. Jiang, L.; Yang, H. Prometryne-induced oxidative stress and impact on antioxidant enzymes in wheat. Ecotoxicol. Environ. Saf. 2009, 72, 1687–1693. [Google Scholar] [CrossRef]
  16. Waksman, S.A. Principles of Soil Microbiology; Williams and Wilkins Company: Baltimore, MD, USA, 1927. [Google Scholar]
  17. Fierer, N.; Strickland, M.S.; Liptzin, D.; Bradford, M.A.; Cleveland, C.C. Global patterns in belowground communities. Ecol. Lett. 2010, 12, 1238–1249. [Google Scholar] [CrossRef] [PubMed]
  18. Serna-Chavez, H.M.; Fierer, N.; Van Bodegom, P.M. Global drivers and patterns of microbial abundance in soil. Glob. Ecol. Biogeogr. 2013, 22, 1162–1172. [Google Scholar] [CrossRef]
  19. Liu, L.; Yang, J.; Yu, Z.; Wilkinson, D.M. The biogeography of abundant and rare bacterioplankton in the lakes and reservoirs of China. ISME J. 2015, 9, 2068–2077. [Google Scholar] [CrossRef] [PubMed]
  20. Jiao, S.; Chen, W.; Wei, G. Biogeography and ecological diversity patterns of rare and abundant bacteria in oil-contaminated soils. Mol. Ecol. 2017, 26, 5305–5317. [Google Scholar] [CrossRef]
  21. Yuanyuan, M.; Wenjing, Z.; Jun, Y.; Yuanshao, L.; Zheng, Y.; Senjie, L. Biogeographic patterns of abundant and rare bacterioplankton in three subtropical bays resulting from selective and neutral processes. ISME J. 2018, 12, 2198–2210. [Google Scholar]
  22. Torsvik, V.; Ovreas, L. Microbial diversity and function in soil: From genes to ecosystems. Curr. Opin. Microbiol. 2002, 5, 240–245. [Google Scholar] [CrossRef]
  23. Ramirez, K.S.; Leff, J.W.; Barberan, A.; Bates, S.T.; Betley, J.; Crowther, T.W.; Kelly, E.F.; Oldfield, E.E.; Shaw, E.A.; Steenbock, C. Biogeographic patterns in below-ground diversity in New York City’s Central Park are similar to those observed globally. Proc. Biol. Sci. 2014, 281, 22–26. [Google Scholar] [CrossRef] [PubMed]
  24. Tedersoo, L. Global diversity and geography of soil fungi. Science 2014, 346, 1256688. [Google Scholar] [CrossRef] [PubMed] [Green Version]
  25. Dupont, A.Ö.C.; Griffiths, R.I.; Bell, T.; Bass, D. Differences in soil micro-eukaryotic communities over soil pH gradients are strongly driven by parasites and saprotrophs. Environ. Microbiol. 2016, 18, 2010–2024. [Google Scholar] [CrossRef] [Green Version]
  26. Wang, K.B.; Zhang, Y.W.; Tang, Z.S.; Shangguan, Z.P.; Chang, F.; Jia, F.A.; Chen, Y.P.; He, X.H.; Shi, W.Y.; Deng, L. Effects of grassland afforestation on structure andfunction of soil bacterial and fungal communities. Sci. Total Environ. 2019, 676, 396–406. [Google Scholar] [CrossRef]
  27. Huaidong, H.E.; Waichin, L.I.; Riqing, Y.U.; Zhihong, Y.E. Illumina-Based Analysis of Bulk and Rhizosphere Soil Bacterial Communities in Paddy Fields Under Mixed Heavy Metal Contamination. Pedosphere 2017, 27, 569–578. [Google Scholar]
  28. Wang, R.; Xiao, Y.; Lv, F.; Hu, L.; Wei, L.; Yuan, Z.; Lin, H. Bacterial community structure and functional potential of rhizosphere soils as influenced by nitrogen addition and bacterial wilt disease under continuous sesame cropping. Appl. Soil Ecol. 2017, 125, 117–127. [Google Scholar] [CrossRef]
  29. Zhang, T.C.; Pang, H. Applications of Microelectrode Techniques to Measure pH and OxidationReduction Potential in Rhizosphere Soil. Environ. Sci. Technol. 1999, 33, 1293–1299. [Google Scholar] [CrossRef]
  30. Bowman, R.A. A reevaluation of the chromic acid colorimetric procedure for soil organic carbon. Commun. Soil Sci. Plant Anal. 1998, 29, 501–508. [Google Scholar] [CrossRef]
  31. Gardes, M.; Bruns, T.D. ITS primers with enhanced specificity for basidiomycetes--application to the identification of mycorrhizae and rusts. Mol. Ecol. 2010, 2, 113–118. [Google Scholar] [CrossRef]
  32. Wang, Y.; Wang, H.; Cheng, H.Y.; Chang, F.; She, X. Niche differentiation in the rhizosphere and endosphere fungal microbiome of wild Paris polyphylla Sm. PeerJ 2020, 8, e8510–e8530. [Google Scholar] [CrossRef] [Green Version]
  33. Magoč, T.; Salzberg, S.L. FLASH: Fast length adjustment of short reads to improve genome assemblies. Bioinformatics 2011, 27, 2957–2963. [Google Scholar] [CrossRef] [PubMed]
  34. Bokulich, N.A.; Subramanian, S.; Faith, J.J.; Gevers, D.; Gordon, J.I.; Knight, R.; Mills, D.A.; Caporaso, J.G. Quality-filtering vastly improves diversity estimates from Illumina amplicon sequencing. Nat. Methods 2013, 10, 57–59. [Google Scholar] [CrossRef]
  35. Caporaso, J.G.; Kuczynski, J.; Stombaugh, J.; Bittinger, K.; Bushman, F.D.; Costello, E.K.; Fierer, N.; Pena, A.G.; Goodrich, J.K.; Gordon, J.I.; et al. QIIME allows analysis of high-throughput community sequencing data. Nat. Methods 2010, 7, 335–336. [Google Scholar] [CrossRef] [PubMed] [Green Version]
  36. Edgar, R.C.; Haas, B.J.; Clemente, J.C.; Quince, C.; Knight, R. UCHIME improves sensitivity and speed of chimera detection. Bioinformatics 2011, 16, 2194–2200. [Google Scholar] [CrossRef] [PubMed] [Green Version]
  37. Liang, B.C.; Mackenzie, A.F.; Schnitzer, M.; Monreal, C.M.; Voroney, P.R.; Beyaert, R.P. Management-induced change in labile soil organic matter under continuous corn in eastern Canadian soils. Biol. Fertil. Soils 1997, 26, 88–94. [Google Scholar] [CrossRef]
  38. Whalley, W.R.; Riseley, B.; Leeds-Harrison, P.B.; Bird, N.R.A.; Adderley, W.P. Structural differences between bulk and rhizosphere soil. Eur. J. Soil Sci. 2010, 56, 353–360. [Google Scholar] [CrossRef]
  39. Wang, B.; Liu, G.B.; Xue, S.; Zhu, B. Changes in soil physico-chemical and microbiological properties during natural succession on abandoned farmland in the Loess Plateau. Environ. Earth Sci. 2011, 62, 915–925. [Google Scholar] [CrossRef]
  40. Edgar, R.C. UPARSE: Highly accurate OTU sequences from microbial amplicon reads. Nat. Methods 2013, 10, 996–998. [Google Scholar] [CrossRef] [PubMed]
  41. Win, P.P.; De Waele, D.; Kyi, P.P.; Maung, Z.T.Z.; Myint, Y.Y. Effect of different water regimes on nematode reproduction, root galling, plant growth and yield of lowland and upland Asian rice varieties grown in two soil types infested by the rice root–knot nematode Meloidogyne graminicola. Field Crops Res. 2015, 165, 138–149. [Google Scholar]
  42. Mazzola, M.; Manici, L.M. Apple Replant Disease: Role of Microbial Ecology in Cause and Control. Annu. Rev. Phytopathol. 2012, 50, 45–65. [Google Scholar] [CrossRef]
  43. Zhou, S.M.; Zhang, M.; Zhang, K.K.; Yang, X.W.; Wang, C.Y. Effects of reduced nitrogen and suitable soil moisture on wheat (Triticum aestivum L.) rhizosphere soil microbiological, biochemical properties and yield in the Huanghuai Plain, China. J. Integr. Agric. 2020, 19, 234–250. [Google Scholar] [CrossRef]
  44. Schoch, C.L.; Spatafora, J.W. The Ascomycota Tree of Life: A Phylum. Syst. Biol. 2009, 58, 224–239. [Google Scholar] [CrossRef] [PubMed]
  45. Edwards, J.; Johnson, C.; Santos-Medellín, C.; Lurie, E.; Sundaresan, V. Structure, variation, and assembly of the root-associated microbiomes of rice. Proc. Natl. Acad. Sci. USA 2015, 112, E911–E920. [Google Scholar] [CrossRef] [PubMed] [Green Version]
  46. Hacquard, S.; Garrido-Oter, R.; González, A.; Spaepen, S.; Ackermann, G.; Lebeis, S.; Mchardy, A.C.; Dangl, J.L.; Knight, R.; Ley, R. Microbiota and Host Nutrition across Plant and Animal Kingdoms. Cell Host Microbe 2015, 17, 603–616. [Google Scholar] [CrossRef] [Green Version]
  47. Kottke, I.; Haug, I.; Setaro, S.; Suárez, J.P.; Wei, M.; PreuIng, M.; Nebel, M.; Oberwinkler, F. Guilds of mycorrhizal fungi and their relation to trees, ericads, orchids and liverworts in a neotropical mountain rain forest. Basic Appl. Ecol. 2008, 9, 13–23. [Google Scholar] [CrossRef]
  48. Burke, D.J.; Lopez-Gutierrez, J.C.; Smemo, K.A.; Chan, C.R. Vegetation and soil environment influence the spatial distribution of root-associated fungi in a mature beech-maple forest. Appl. Environ. Microbiol. 2009, 75, 7639–7648. [Google Scholar] [CrossRef] [Green Version]
  49. Yu, L.; Nicolaisen, M.; Larsen, J.; Ravnskov, S. Molecular characterization of root-associated fungal communities in relation to health status of Pisum sativum using barcoded pyrosequencing. Plant Soil 2012, 357, 395–405. [Google Scholar] [CrossRef]
  50. Ladha, J.K.; Tirol-Padre, A.; Reddy, C.K.; Cassman, K.G.; Verma, S.; Powlson, D.S.; Van Kessel, C.; Daniel, D.B.R.; Chakraborty, D.; Pathak, H. Global nitrogen budgets in cereals: A 50-year assessment for maize, rice, and wheat production systems. Sci. Rep. 2016, 6, 19355–19364. [Google Scholar] [CrossRef] [PubMed] [Green Version]
Figure 1. The rarefaction curves (A), rank abundance (B), and species accumulation curves (C) analysis.
Jof 07 00420 g001
Figure 2. The alpha-diversity index (Observed_species index (A) and Shannon index (B)) of the LS and HS samples fungal diversity.
Jof 07 00420 g002
Figure 3. Relative abundance of bacterial community compositions at phylum (A), family (B), or genus (C) levels.
Jof 07 00420 g003
Figure 4. The UniFrac unweighted (A) and the weighted (B) principal coordinate analysis (PCoA) scores plot based on principal components PC1 and PC2.
Jof 07 00420 g004
Figure 5. The LS samples and the HS samples fungal community heatmap analysis (A) and similarity tree (B).
Jof 07 00420 g005
Figure 6. The LEfSe analyses between the LS (L27) sample and the HS (H27) sample. (A) Histogram of the results of the LS (L27) sample and the HS (H27) sample. (B) Cladogram representing the abundance of the LS (L27) sample and the HS (H27) sample. Green: L27; Red: H27.
Jof 07 00420 g006
Publisher’s Note: MDPI stays neutral with regard to jurisdictional claims in published maps and institutional affiliations.