Article

Differential Regulation of Echinocandin Targets Fks1 and Fks2 in Candida glabrata by the Post-Transcriptional Regulator Ssd1

1
Department of Biology, William Paterson University, 300 Pompton Road, Wayne, NJ 07470, USA
2
Center for Discovery and Innovation, Hackensack Meridian Health, 111 Ideation Way, Nutley, NJ 07110, USA
3
Department of Clinical Laboratory, Beijing Key Laboratory for Mechanisms Research and Precision Diagnosis of Invasive Fungal Diseases (BZ0447), Peking Union Medical College Hospital, Chinese Academy of Medical Sciences, Beijing 100730, China
4
Department of Medical Sciences, Hackensack Meridian School of Medicine, 340 Kingsland Street, Nutley, NJ 07110, USA
*
Author to whom correspondence should be addressed.
J. Fungi 2020, 6(3), 143; https://doi.org/10.3390/jof6030143
Submission received: 22 July 2020 / Revised: 10 August 2020 / Accepted: 18 August 2020 / Published: 21 August 2020

Abstract

:
Invasive infections caused by the opportunistic pathogen Candida glabrata are treated with echinocandin antifungals that target β-1,3-glucan synthase, an enzyme critical for fungal cell wall biosynthesis. Echinocandin resistance develops upon mutation of genes (FKS1 or FKS2) that encode the glucan synthase catalytic subunits. We have analyzed cellular factors that influence echinocandin susceptibility and here describe effects of the post-transcriptional regulator Ssd1, which in S. cerevisiae, can bind cell wall related gene transcripts. The SSD1 homolog in C. glabrata was disrupted in isogenic wild type and equivalent FKS1 and FKS2 mutant strains that demonstrate echinocandin resistance (MICs > 0.5 µg/mL). A reversal of resistance (8- to 128-fold decrease in MICs) was observed in FKS1 mutants, but not in FKS2 mutants, following SSD1 deletion. Additionally, this phenotype was complemented upon expression of SSD1 from plasmid (pSSD1). All SSD1 disruptants displayed susceptibility to the calcineurin inhibitor FK506, similar to fks1∆. Decreases in relative gene expression ratios of FKS1 to FKS2 (2.6- to 4.5-fold) and in protein ratios of Fks1 to Fks2 (2.7- and 8.4-fold) were observed in FKS mutants upon SSD1 disruption. Additionally, a complementary increase in protein ratio was observed in the pSSD1 expressing strain. Overall, we describe a cellular factor that influences Fks1-specific mediated resistance and demonstrates further differential regulation of FKS1 and FKS2 in C. glabrata.

Graphical Abstract

1. Introduction

Infections caused by Candida glabrata, especially among immunocompromised hosts, have increased in prevalence and demonstrate elevated rates of antifungal resistance [1,2,3]. The echinocandins (caspofungin, micafungin, and anidulafungin) are recommended first-line agents for the treatment of invasive C. glabrata infections [4]. Echinocandin antifungals target the plasma membrane-embedded enzyme β-1,3-glucan synthase, leading to loss of β-glucans and cell wall stability. Resistance to the echinocandins is well-established (3–12%) among patients with C. glabrata infections and develops upon mutation of genes (FKS1 or FKS2) that encode for the catalytic subunits (Fks1/Fks2) of β-glucan synthase [1,2,5].
Although fungi contain multiple FKS paralogs (i.e., FKS1, FKS2, and FKS3), FKS1 is an essential gene in most, including Candida and Aspergillus species. Notable exceptions are Saccharomyces cerevisiae and C. glabrata, where FKS1 and FKS2 are considered functionally redundant. In these organisms, any one FKS gene can be disrupted and cell growth can continue; however, FKS1 and FKS2 cannot be simultaneously disrupted [6,7].
In S. cerevisiae, FKS1 expression is regulated in the cell cycle and predominates during growth on glucose, while FKS2 (also referred to as GSC2) has been shown to be important during sporulation, growth in the absence of glucose, cell wall stress, and osmotic shock [6,8]. Expression of FKS2 in S. cerevisiae is induced by the cell wall integrity pathway [9], which is activated under various stressors, and by the calcium/calmodulin-dependent protein phosphatase calcineurin [6]. Interestingly, sporulation and mating have not been observed in C. glabrata, despite the presence of mating genes in its genome [10,11,12]. Additionally, while FKS1 in S. cerevisiae is predominantly expressed unless one of the above stressful conditions arises, FKS2 in C. glabrata is expressed more broadly at levels comparable to FKS1 [13,14,15]. The apparent increased role of FKS2 in C. glabrata is the likely reason that mutations within this gene can lead to echinocandin resistance. In fact, mutations in either FKS1 or FKS2 are routinely identified within resistant clinical isolates of C. glabrata, while other medically-relevant fungi exclusively develop FKS1 mutations [5].
Because mutations in either FKS1 or FKS2 in C. glabrata can lead to echinocandin resistance and treatment failure, it is important to understand how this yeast regulates these drug targets and whether this regulation is common or unique to each target. Compared to S. cerevisiae, the genetic regulation of FKS1 and FKS2 expression in C. glabrata has been less studied. Large scale transcriptomic studies have reported changes in C. glabrata FKS1 or FKS2 expression under specific conditions. FKS1 was upregulated during growth in a low pH medium following disruption of the pH response regulator ASG1 [16], and FKS2 was upregulated following acetic acid treatment of wild type or HAA1-deleted cells [17]. In each study, the opposing FKS gene was not reported as exhibiting a change in expression. While it has been shown that resistance mutations in FKS genes can alter downstream expression [14], only one mechanism of differential regulation linked to antifungal susceptibility, to our knowledge, has been characterized in C. glabrata: transcriptional regulation of FKS2 by calcineurin. As in S. cerevisiae [6], chemical or genetic inhibition of calcineurin decreases expression of FKS2, but not FKS1, in C. glabrata [7]. As such, a partial reversal in echinocandin resistance was observed in C. glabrata FKS2 mutants, but not FKS1 mutants, following treatment with the calcineurin inhibitor FK506 (tacrolimus) [7].
Ssd1 is an RNA-binding protein that promotes or represses translation. In S. cerevisiae, Ssd1 shuttles into and out of the nucleus and binds cell wall mRNA transcripts, including that of chitinases and glucanases [18,19]. A Cbk1-phosphorylated Ssd1 will deliver its bound mRNA to the proper site for translation, while a dephosphorylated Ssd1 will sequester the bound mRNA and prevent its proper localization and translation [20,21]. Overall, Ssd1 is proposed to directly modulate the delivery, retention, and translation of mRNAs [21], thereby regulating cell wall growth and remodeling.
Here, we show that Ssd1 is differentially regulating the catalytic subunits (Fks1 and Fks2) of β-1,3-glucan synthase in C. glabrata. Upon SSD1 deletion within FKS mutant backgrounds, we observed a reversal of Fks1-mediated resistance, FK506 sensitivity, decreased FKS1 gene and protein expression, and a complementary increase in FKS2 gene and protein expression, suggesting regulation, either directly or indirectly, of FKS1 by Ssd1.

2. Materials and Methods

2.1. Strain Construction and Media

Candida glabrata 2001 (CBS138) and 200989 (2001 his-, trp-, ura-) strains were obtained from American Type Culture Collection (ATCC, Manassas, VA, USA). The FKS1 and FKS2 gene knockouts in ATCC 200989 were gifts from S. Katiyar (Drexel University College of Medicine) [7]. Fks1 (625delF and S629P) and Fks2 (659delF and S663P) mutants were generated in strain ATCC 200989 through transformation of a purified PCR product. Specific mutations were PCR-amplified along with regions flanking the FKS1 or FKS2 hotspot 1 region (approximately 400 bp) from mutant isolates (see Table S1 for primers). Transformants were selected on low levels (0.2 µg/mL) of caspofungin-containing YPD (1% yeast extract, 2% peptone, 2% dextrose) agar medium. All FKS1 and FKS2 hotspots were sequenced in the transformants to confirm the expected mutation was present and all other amino acids remained unchanged.
To disrupt SSD1, S. cerevisiae TRP1 was amplified from pRS414 with primers that contained overhangs homologous to the up- and down-stream regions of C. glabrata SSD1 (Table S1). This deletion cassette was purified and transformed into competent wild type cells. Transformants were selected on complete defined agar medium without tryptophan (SD-trp) (Sunrise Science Products, San Diego, CA, USA) and PCR screened for correct integration of TRP1 at the SSD1 locus and loss of SSD1 (primers in Table S1). The ∆ssd1::ScTRP1 cassette was subsequently amplified and purified from this parental knockout providing longer regions of homology in order to transform each FKS mutant strain. All transformants were screened as noted above.
Plasmid pCN-PDC1 [22], which contains a strong promoter (PDC1), was used to constitutively express SSD1. A gap-repair approach [23] was used to clone SSD1 into this plasmid. Briefly, the coding region of SSD1 was PCR amplified from ATCC 2001 genomic DNA with primers that contained overhangs homologous to each side of the EcoRV restriction site (Table S1) ensuring proper directionality. The purified PCR product was co-transformed with EcoRV-linearized and alkaline phosphatase-treated pCN-PDC1 into competent yeast cells. Following the transformation, cells were subjected to a 3 h outgrowth in YPD broth followed by selection on YPD agar medium supplemented with 100 µg/mL nourseothricin (Jena Bioscience, Jena, Germany). Transformants were PCR screened for correct construct presence (Table S1). Plasmid DNA was rescued from yeast cells, purified, sequenced, and propagated in E. coli as in [24] and used to transform additional strains.

2.2. Drug Susceptibility Assays

Echinocandin minimum inhibitory concentrations (MICs) were determined by broth microdilution following CLSI standards [25]. Susceptibility assays were performed with YPD broth due to multiple, nutritional auxotrophies within the strains. Caspofungin (Merck, Rahway, NJ, USA) and micafungin (Astellas, Deerfield, IL, USA) were dissolved and diluted according to CLSI recommendations. The calcineurin inhibitor FK506/tacrolimus (Cayman Chemical, Ann Arbor, MI, USA) was dissolved in DMSO according to supplier recommendations.
The in vitro killing assays were performed as in [26]. Briefly, cultures of C. glabrata (1 × 10⁷ cells) in fresh 1 mL RPMI medium (plus necessary amino acids) were incubated at 37 °C while shaking for 24 h in 2-fold increasing concentrations (0.016 to 32 µg/mL) of echinocandin. After 24 h, 100 µL of the appropriate dilutions for each culture were plated onto YPD agar. Colony forming units (CFUs) were counted 24 h after plating. Two plates per concentration were analyzed and a minimum of two independent experiments were performed. Data are presented as CFU/mL that survived each drug concentration.

2.3. RNA Isolation and Quantitative RT-PCR

Cells were grown in YPD or YPD supplemented with 100 µg/mL nourseothricin (plasmid carrying strains) to mid-logarithmic phase. Total RNA was extracted using the RNeasy Mini kit (Qiagen Science, Germantown, MD, USA) according to the manufacturer’s instructions and stored at −80 °C. The concentration and purity of the RNA was determined using a UV spectrophotometer (NanoDrop One, Thermo Fisher Scientific, Waltham, MA, USA) by measuring the absorbance at 230 (OD230), 260 (OD260) and 280 nm (OD280). The integrity of the RNA was further checked by electrophoresis through 1% denaturing and non-denaturing agarose gels. FKS1 and FKS2 expression levels were measured by RT-PCR.
All qPCR reactions were performed in a 25-µL reaction mixture consisting of 12.5 µL of 2x One Step RT-PCR buffer (One Step SYBR Ex Taq qRT-PCR kit; TaKaRa Bio Inc., Mountain View, CA, USA), 0.2 µM of each primer, 0.5 µL Takara Ex Taq HS (5 U/µL), 0.5 µL RTase Enzyme Mix and 2 µL of RNA (5 ng/µL) on an Mx3005P real-time instrument (Stratagene, La Jolla, CA, USA). Optimal thermal cycling conditions consisted of 42 °C for 5 min for the reverse transcription, followed by an initial denaturation step at 95 °C for 10 s, 40 cycles of 95 °C for 5 s (denaturation), 60 °C for 20 s (annealing and extension). The experiments were carried out in triplicate for each data point. The relative quantification in gene expression was determined using the 2−ΔΔCt method [27] with expression level of the gene RDN5.8 for normalization [28]. The primers used are listed in Table S1. Statistical analysis was carried out using the Student’s t test (two-tailed) with SPSS software (version 12.0, SPSS Inc., Chicago, IL, USA), and p value of < 0.05 was considered significant.

2.4. Glucan Synthase Preparation and Western Blotting

Glucan synthase was isolated from strains as previously described [29]. Briefly, large volumes (2 L) of cells were harvested at early stationary phase, disrupted, and membranes were separated and isolated by sedimentation (100,000× g). Glucan synthase extraction and enrichment by product entrapment were performed as in [29]. Western blotting was performed as in [30]. Of note, proteins were prepared using Tris-Glycine-SDS buffer and reducing agent, heated, and separated by electrophoresis (8% Tris-Glycine gel). Following transfer of proteins to a PVDF membrane, blots were incubated with either anti-Fks1 or anti-Fks2 primary antibodies (GenScript Biotech, Piscataway, NJ, USA) at a dilution of 1:5000 or 1:3000, respectively, in 2% TBST overnight at 4 °C. Washed membranes were then incubated with horseradish peroxidase-conjugated secondary antibodies (anti-rabbit; Cell Signaling Technology, Boston, MA, USA) at 1:3000 dilution for 1 h. Bands were visualized with Novex ECL Chemiluminescent substrates (Thermo Fischer Scientific), and band intensities were determined with ImageJ software (https://imagej.nih.gov/ij/). Statistical analysis was carried out as stated above.

3. Results

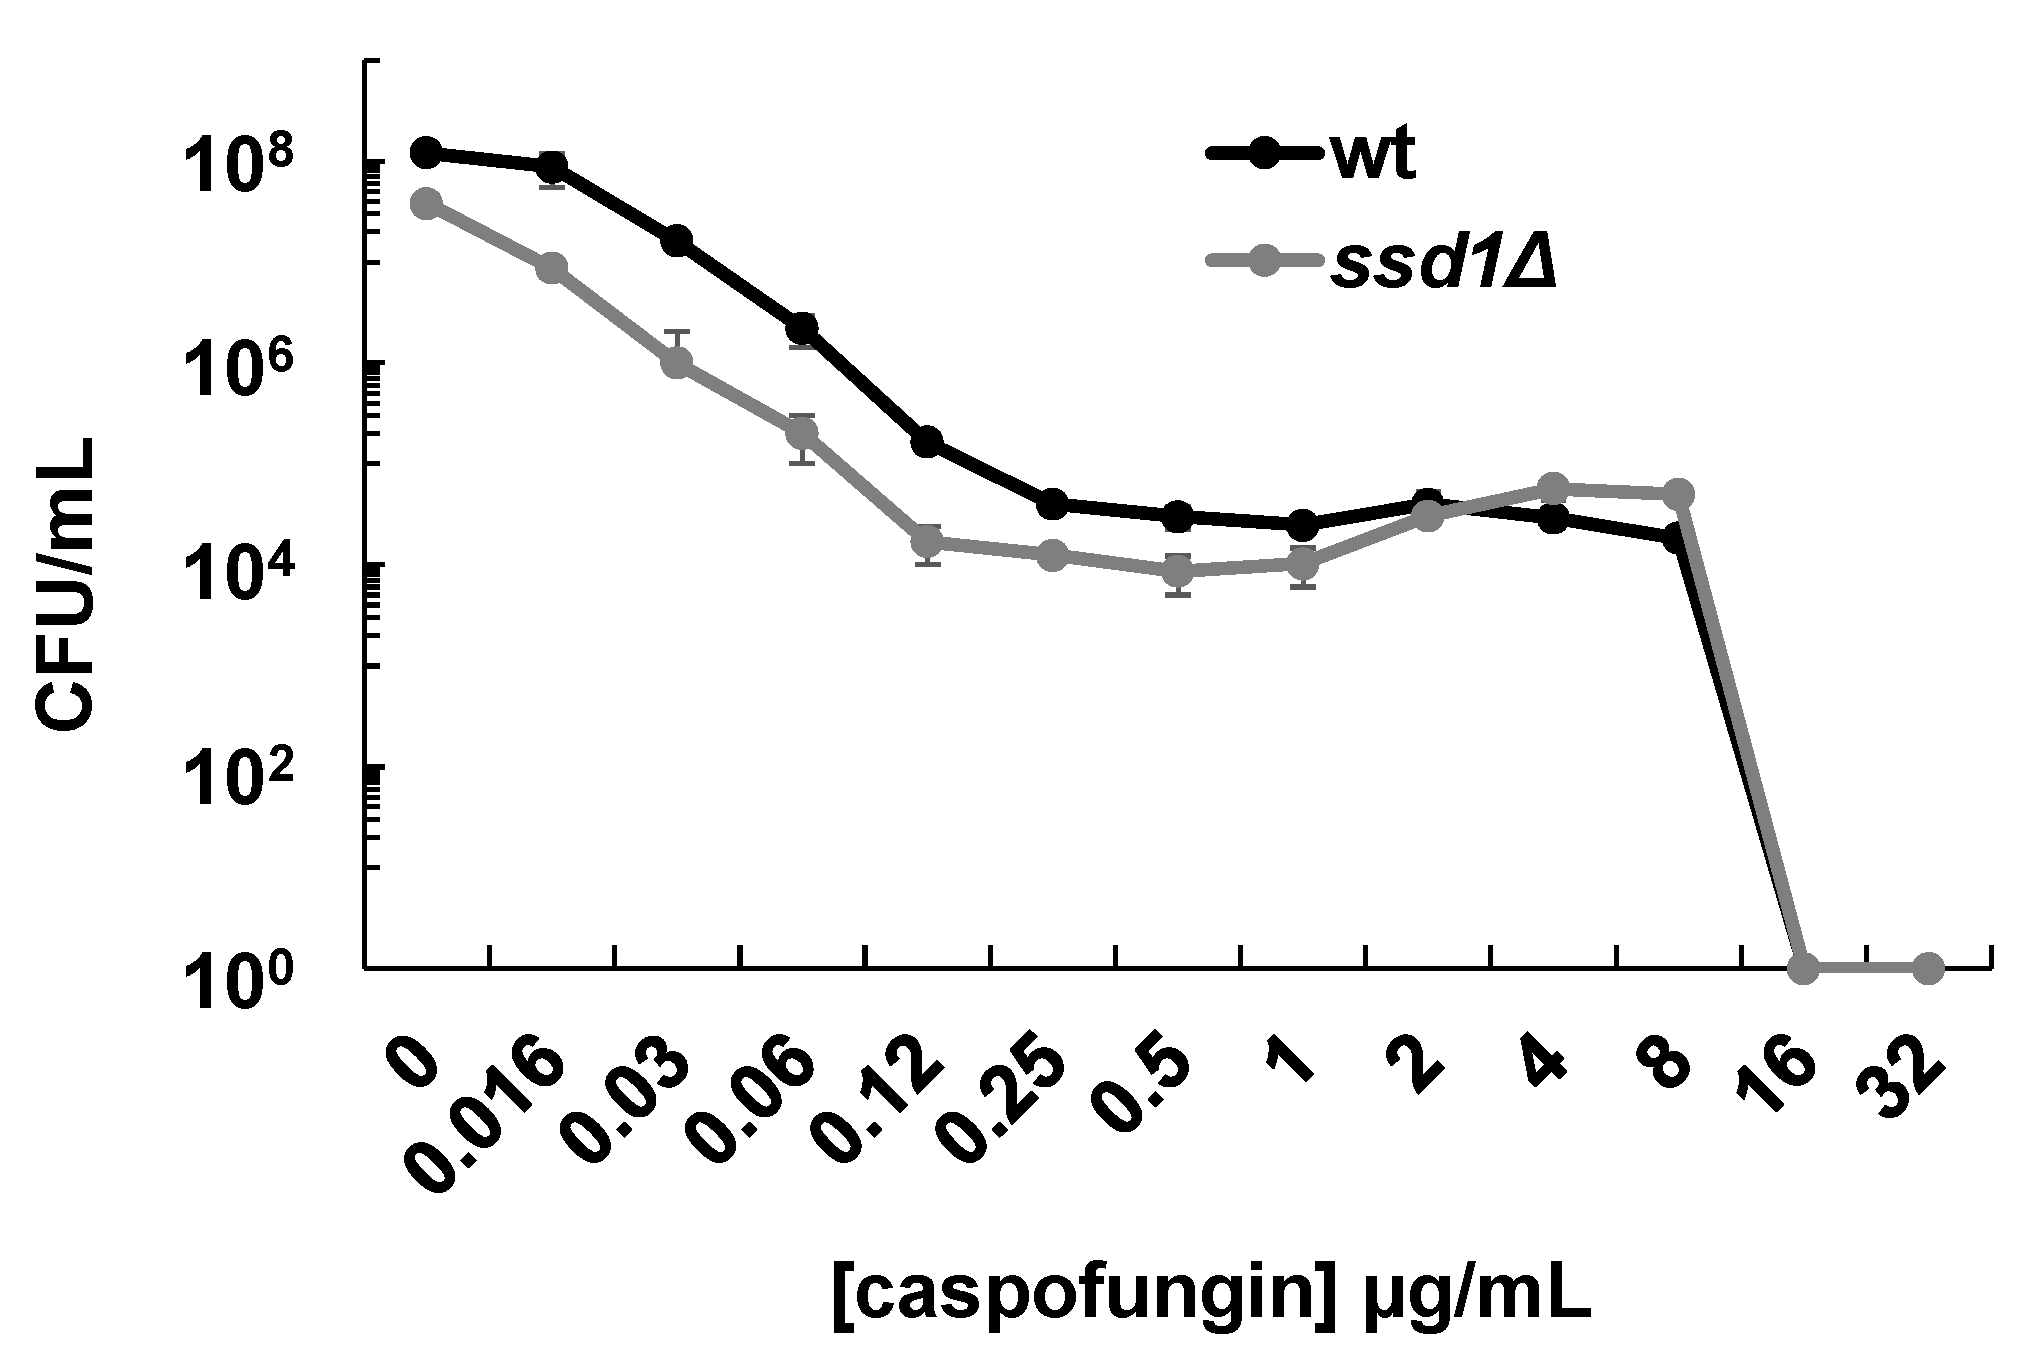
3.1. SSD1 Disruption Reverses FKS1-Mediated Resistance in C. glabrata

Upon screening multiple gene disruptants in C. glabrata, we found that ssd1∆ displayed 2- to 4-fold increases in susceptibility to caspofungin and micafungin as demonstrated by broth microdilution and killing assays (Table 1 and Figure 1). Disruption of SSD1 in C. glabrata (CAGL0H01287g) was previously shown to elicit increased susceptibility to caspofungin [31]. The increases in echinocandin susceptibilities were similar to that of the fks1∆ deletion strain (Table 1). In order to determine if the post-transcriptional regulator Ssd1 influences echinocandin resistance, we built clinically relevant FKS1 and FKS2 mutations into the ATCC 200989 background strain. The resulting equivalent amino acid alterations included Fks1-625delF, Fks2-659delF, Fks1-S629P, and Fks2-S663P. As expected, these FKS1 and FKS2 mutants demonstrated resistance with 32- to 64-fold increases in caspofungin and micafungin minimum inhibitory concentrations (MICs) compared to the non-mutated wild type strain (Table 1). We subsequently deleted SSD1 in each mutant. While no significant changes in susceptibility were demonstrated by the FKS2 mutants, we observed complete, or near complete, reversal of echinocandin resistance upon SSD1 disruption in both FKS1 mutants (Table 1). SSD1 was then cloned onto a plasmid under control of a constitutive promoter and transformed into our mutant strains. Resistance was restored in each FKS1 ∆ssd1 strain following expression of SSD1 from the plasmid (Table 2). This complementation revealed that the presence or absence of SSD1 was producing the observed changes in echinocandin susceptibilities and further raised the likelihood that SSD1 was specifically modulating FKS1 expression.

3.2. SSD1 Disruption Causes Increased Sensitivity to FK506

We used the calcineurin inhibitor, FK506 (tacrolimus), to determine the functionality of Fks1 in the ssd1∆ strains. As FKS2 expression is known to be dependent upon calcineurin signaling, the fks1∆ strain demonstrates hyper-susceptibility (MIC ≤ 0.5 µg/mL) to FK506 (Table 1), as previously described [7]. Strains that can properly express Fks1 (e.g., wild type or fks2∆) are not hyper-susceptible to this inhibitor (MICs ≥ 32 µg/mL) (Table 1). We found that deletion of SSD1 from the wild type strain or any FKS mutant caused increased susceptibility to FK506 (Table 1), consistent with the hypothesis that deletion of SSD1 leads to a subsequent decrease in functional Fks1.

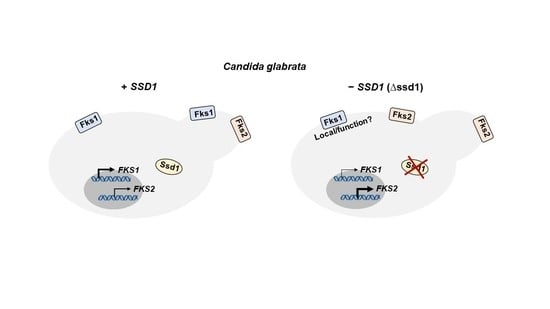
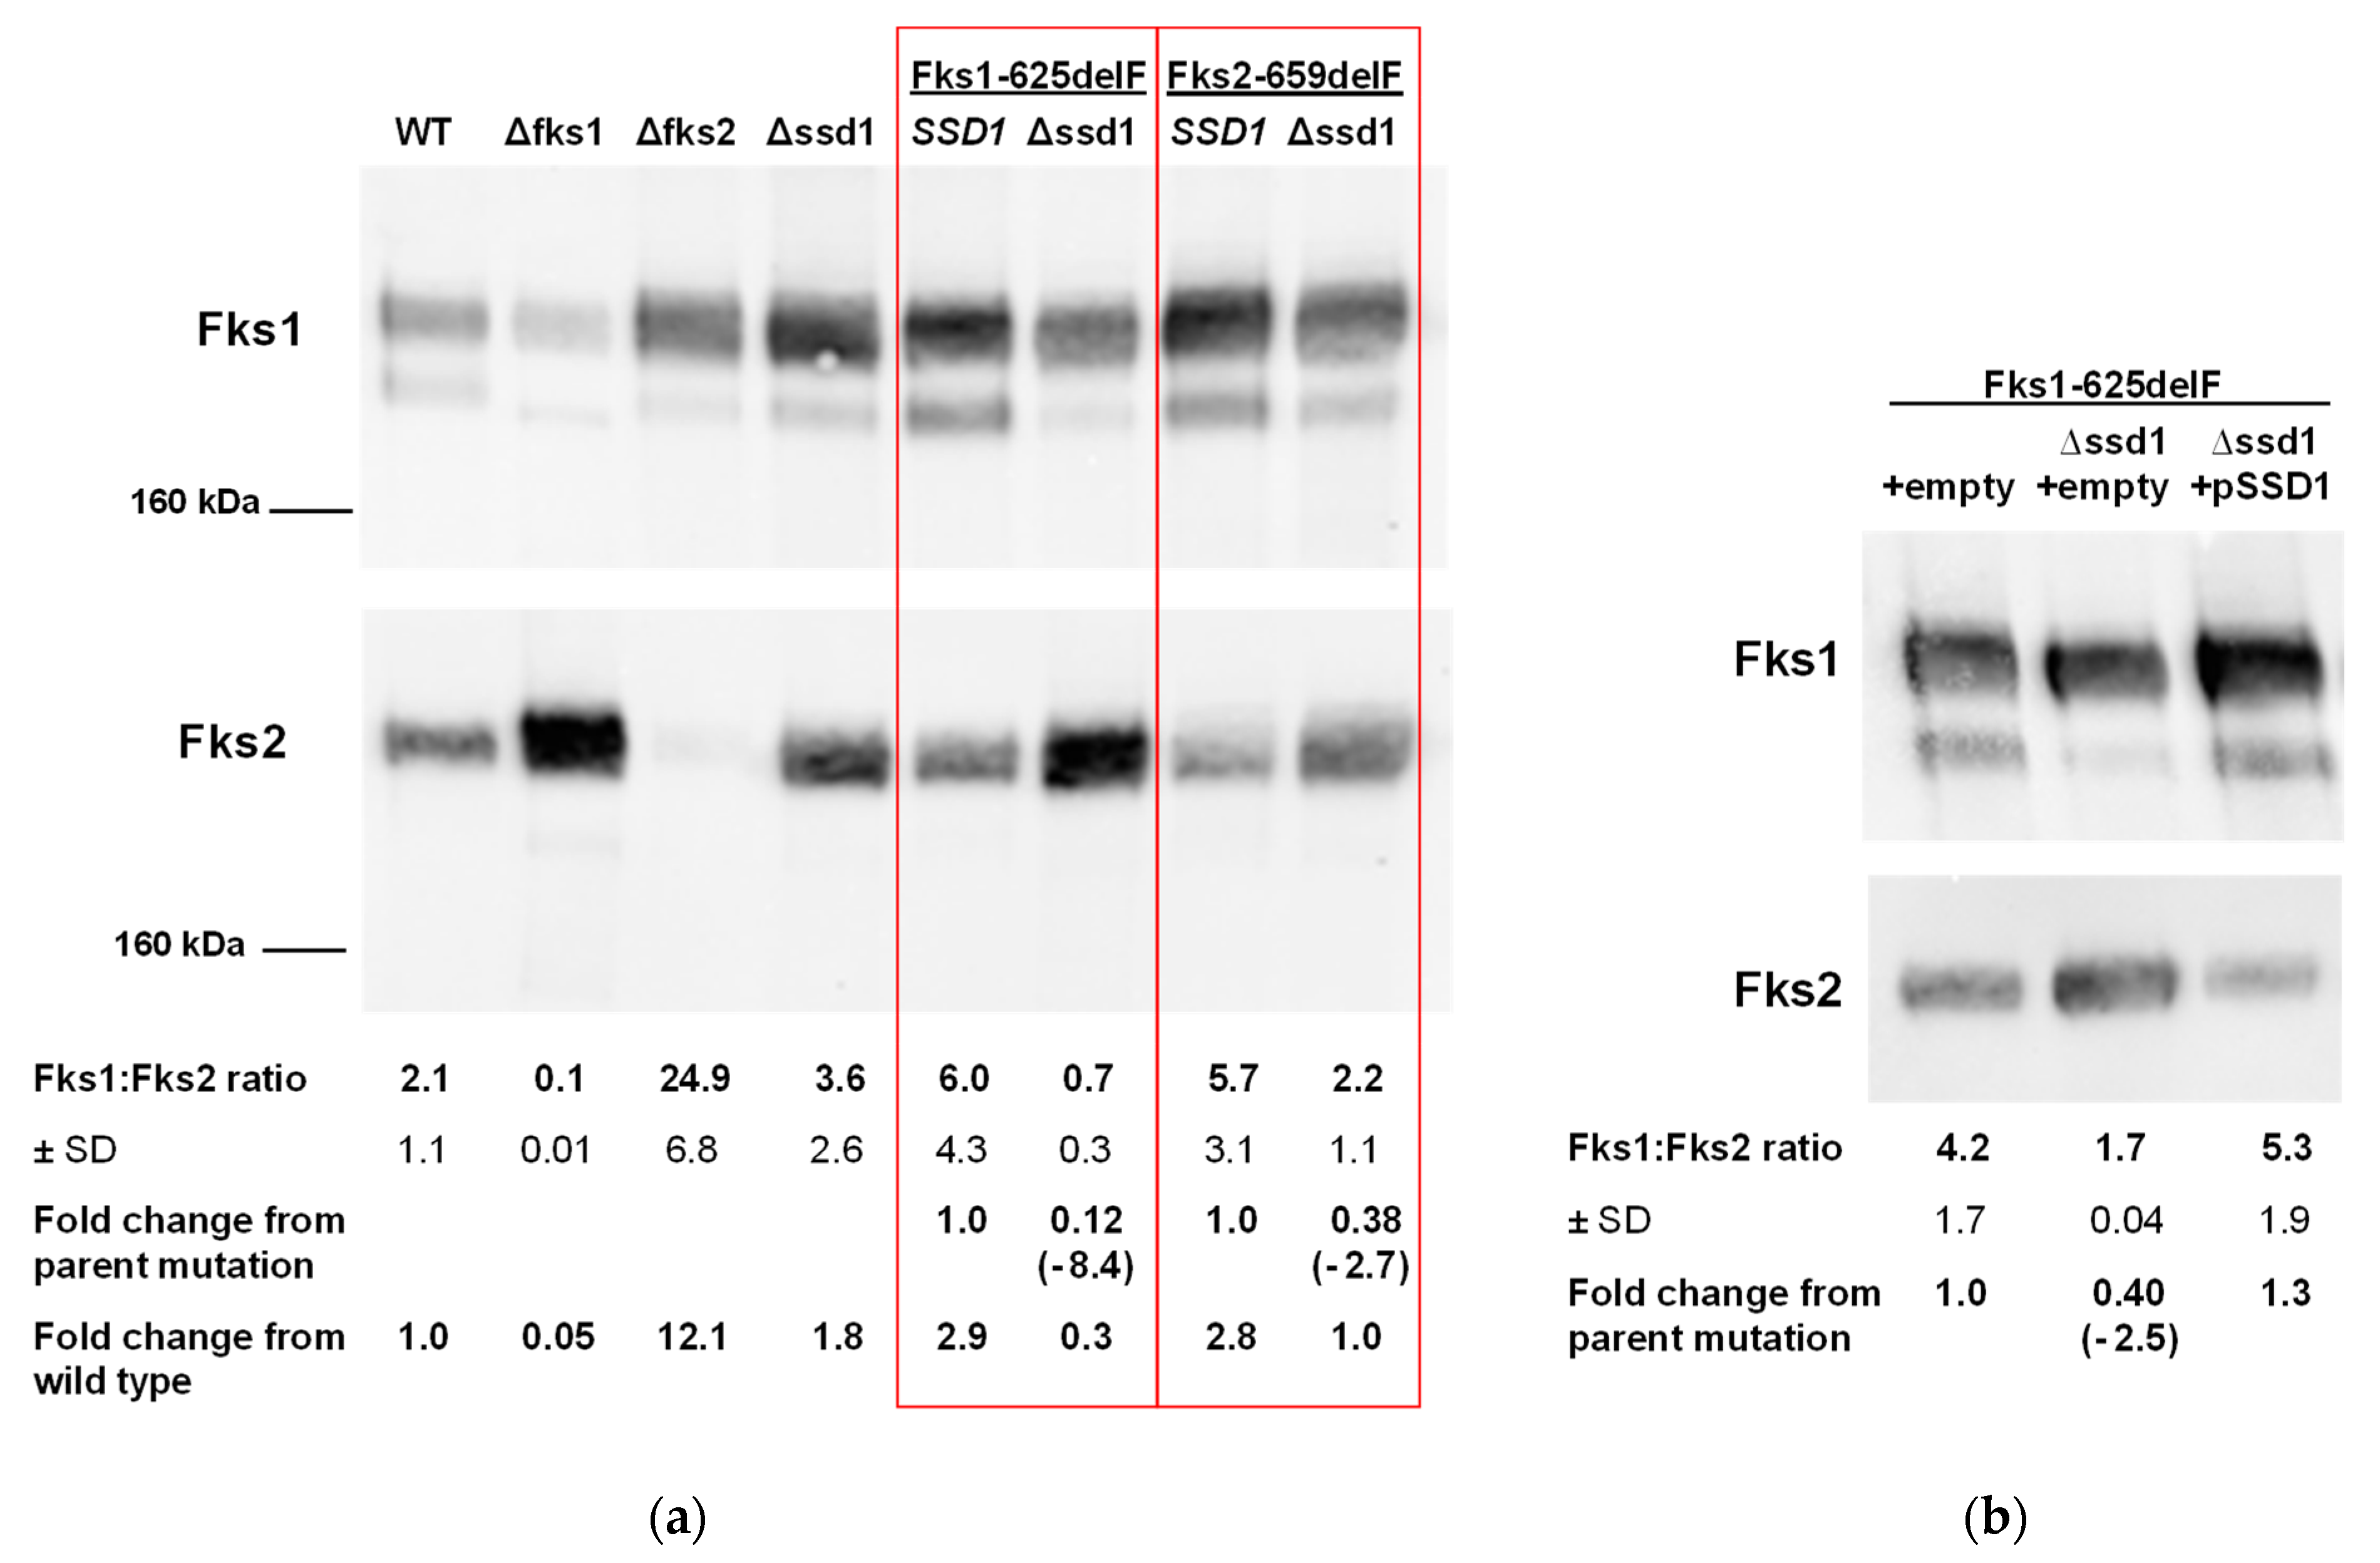
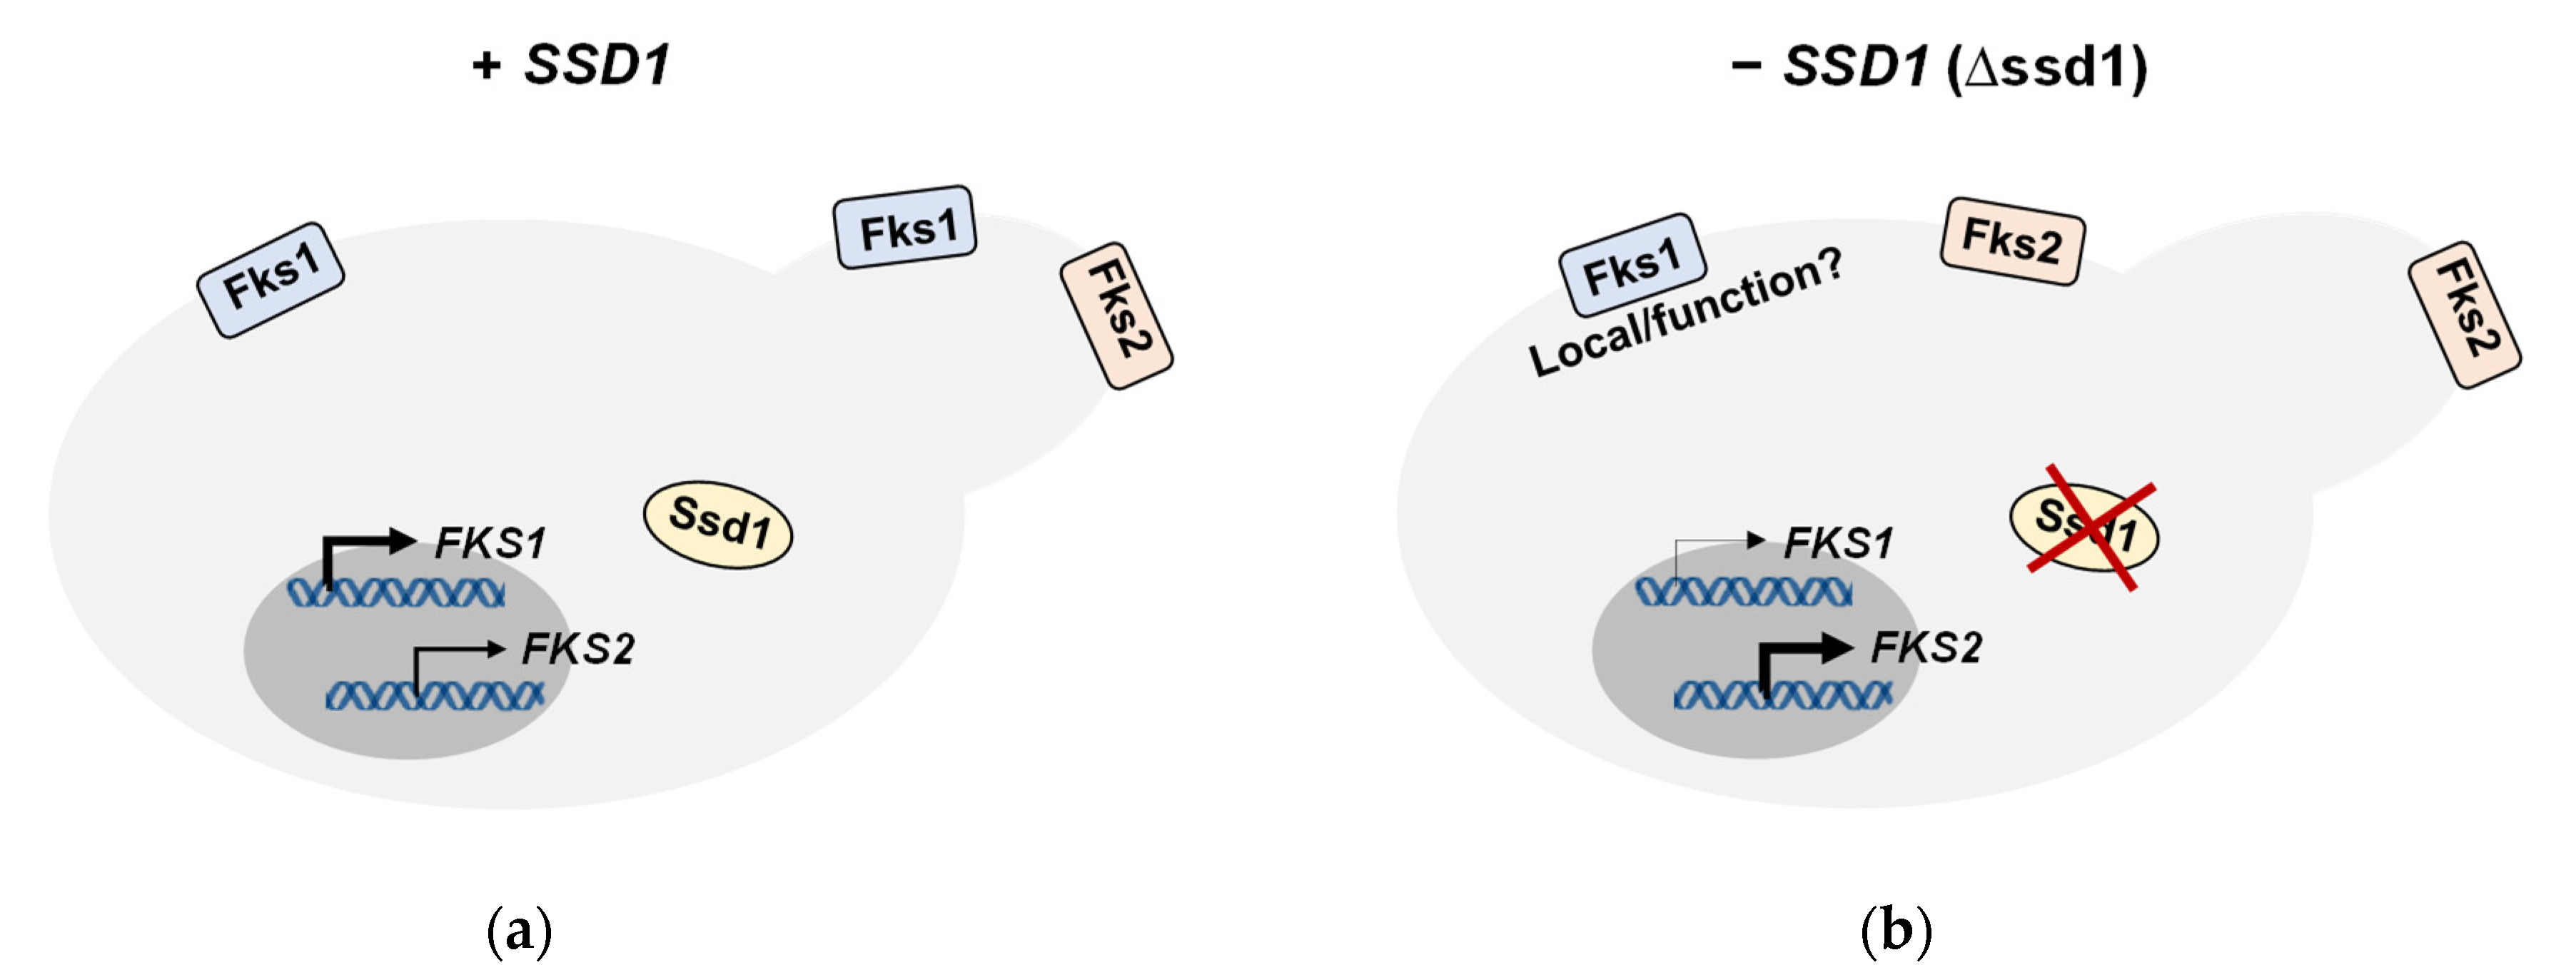
3.3. Loss of SSD1 Leads to Decreases in FKS1:FKS2 Gene and Fks1:Fks2 Protein Expression Ratios

To begin to understand how Ssd1 is regulating FKS1 and/or FKS2, we first measured FKS gene expression in our strains. RNA was isolated from cells harvested in mid-log growth phase and levels of FKS1 and FKS2 mRNA were compared to that of the wild type strain. Relative expression ratios between FKS1 and FKS2 were also determined. As expected, control strains containing deletions of either FKS1 or FKS2 yielded significant increases in expression of the remaining FKS gene (Figure 2). The SSD1 deletion strain demonstrated a significant decrease in FKS1 expression and a non-significant increase in FKS2 yielding a 2.45-fold decrease in FKS1:FKS2 ratio compared to wild type (Figure 2). Nearly all FKS1 and FKS2 mutants demonstrated both decreases in FKS1 expression and increases in FKS2 expression upon SSD1 disruption; some changes reached the level of significance (p < 0.05), while others did not (Figure 2). Consequently, decreases in FKS1:FKS2 ratios were observed in each mutant deleted for SSD1 when compared to either wild type (1.9- to 3.6-fold) or to the related parental strain (2.6- to 4.5-fold) (Figure 2). The increases in FKS2 gene expression may be a direct result of SSD1 deletion or a compensatory reaction of the cell to account for any loss in Fks1 protein, similar to the fks1∆ strain.
Next, we measured Fks1 and Fks2 protein levels within our strains. To do so, we isolated the glucan synthase enzyme from each strain and performed western blotting with anti-CgFks1 or anti-CgFks2 primary antibodies. Band intensities were determined with ImageJ software and data expressed in a ratio of Fks1 to Fks2 to normalize for enzyme quantities across strains. Mean decreases (2.7- and 8.4-fold) in the proportion of Fks1 to Fks2 were found in FKS mutant strains without SSD1 compared to the same strains with the chromosomal copy of SSD1 intact (Figure 3a). While the changes in Fks1:Fks2 protein ratios due to FKS1 or FKS2 disruption (control strains) reached the level of significance (p < 0.05), the decreases in Fks1:Fks2 within the mutant strains did not. However, these data are consistent with the aforementioned gene expression changes. As previously indicated [30], the anti-CgFks1 antibody may exhibit a small amount of cross-reactivity with Fks2, as evidenced by the faint Fks1 band from fks1∆ cells; therefore, fold changes from wild type ratios are also displayed. The same analyses were also performed with several of the plasmid-carrying strains (Figure 3b). As in Figure 3a, a decrease in Fks1:Fks2 ratio was demonstrated upon SSD1 disruption within the Fks1-625delF mutant. Importantly, upon complementation with pSSD1, the protein ratio returned to parental mutant levels (Figure 3b), indicative of a reversal in the protein changes observed with SSD1 deletion.

4. Discussion

Invasive infections caused by Candida glabrata continue to exhibit increased rates of echinocandin resistance with acquired resistance occurring most prominently with either repeated or prolonged drug exposure or among patients with compromised immunity. This organism’s ability to swiftly and adeptly adapt to its environment in order to survive drug exposure is not fully understood. Resistance-conferring mutations, including those of FKS1 and FKS2, are a final escape adaptation during prolonged drug exposure [32], and the presence of FKS mutations within patient samples is correlated with echinocandin treatment failure [33]. Thus, we began an investigation into genes that could play a role in echinocandin adaptation or tolerance. Disruption of the RNA-binding protein, Ssd1, yielded minor increases in echinocandin susceptibility (Table 1), as others have also noted [31]. To determine this factor’s influence on echinocandin resistance, we disrupted the SSD1 gene in both FKS1 and FKS2 resistant mutants. We discovered a reversal in echinocandin resistance following disruption of SSD1. Interestingly, this reversal was exclusive to FKS1 mutants; SSD1 disruption did not alter the echinocandin susceptibilities of FKS2 mutants (Table 1). The reversal of resistance observed in FKS1 mutants was complemented through expression of SSD1 from plasmid (Table 2). Furthermore, disruption of SSD1 from either wild type or FKS mutant strains led to FK506 hyper-susceptibility, similar to the FKS1 knockout strain (Table 1).
From these data, SSD1 appeared to play a role in FKS1 and/or FKS2 regulation leading to the observed differential phenotype. Our subsequent gene and protein expression studies demonstrated a trending decrease in FKS1 gene and protein and increase in FKS2 gene and protein following SSD1 disruption, particularly within the FKS mutant strains (Figure 2 and Figure 3). These data also suggest that SSD1 is partially controlling FKS1 expression, and in turn, leading to decreases in Fks1 protein and compensatory increases in FKS2 gene and protein expression (Figure 4). However, due to the limited decrease in FKS1 gene and protein expression, it is possible to postulate that SSD1 also contributes to the proper transportation of Fks1 protein to the cell membrane and/or its functionality. This would help to explain the near complete reversal in Fks1-mediated echinocandin resistance and near complete sensitivity to FK506. Since Ssd1 is an RNA-binding protein and exerts post-transcriptional control of gene transcripts, we predict that Ssd1 is controlling FKS1 indirectly. In fact, neither FKS1 nor FKS2 were identified in S. cerevisiae screens for Ssd1 bound mRNAs [18,19]; although, these studies were not performed in the presence of an echinocandin. While it is possible that Ssd1 does bind FKS1 and/or FKS2 in C. glabrata, we would expect the FKS1 transcript levels to be either unchanged or even increased after SSD1 disruption if Ssd1 were directly responsible for FKS1 transcript delivery to the proper cellular location.
Because SSD1 is responsible for delivering cell wall related genes to areas of growth or remodeling, it is understandable that loss of SSD1 in S. cerevisiae has been reported to lead to weakened cell walls and activation of the cell wall integrity (CWI) pathway [34,35]. As stated in the introduction, CWI pathway activation leads to increases in FKS2 expression, which is also dependent upon calcineurin. Although these studies have been performed in S. cerevisiae, our data support a similar activation of FKS2 following loss of SSD1 in C. glabrata. The increased expression of FKS2 triggered by the CWI pathway is probably due to decreased levels of Fks1, in addition to decreases in other cell wall-related proteins (Figure 4). How exactly SSD1 is leading to decreased FKS1 expression and/or Fks1 functionality is to be determined. It is likely responsible for proper expression of a regulator (or regulators) that is essential for FKS1 expression, and possibly, localization and/or function.
As previously mentioned, treating C. glabrata FKS2 mutants with a calcineurin inhibitor, such as the immune modulator tacrolimus (FK506), will reverse their acquired echinocandin resistance [7]. Here, we demonstrated reversal of FKS1-meditaed resistance upon deletion of SSD1. Further investigation into this mechanism is warranted to 1) better understand mechanistic regulation of FKS1 and FKS2 and 2) uncover inhibitors of the SSD1 related pathway as possible treatment options of refractory C. glabrata infections.

Supplementary Materials

The following are available online at https://www.mdpi.com/2309-608X/6/3/143/s1, Table S1: Primers used in this study.

Author Contributions

Conceptualization, K.R.H., Y.Z. and D.S.P.; Methodology, K.R.H., P.P., X.H., C.J.O. and Y.Z.; Formal analysis, K.R.H., C.J.O. and Y.Z.; Investigation, K.R.H., P.P., X.H., C.J.O., N.B. and B.P.; Writing—original draft, K.R.H., Y.Z. and D.S.P.; Writing—review and editing, K.R.H., P.P., X.H., C.J.O., N.B., B.P., Y.Z. and D.S.P.; Supervision, K.R.H., Y.Z. and D.S.P.; Funding acquisition, K.R.H. and D.S.P. All authors have read and agreed to the published version of the manuscript.

Funding

This research was supported by William Paterson University (WPU) College of Science and Health and Center for Research to K.R.H. and by the National Institutes of Health (AI109025) to D.S.P. Undergraduate work of B.P. was also supported by WPU College of Science and Health.

Conflicts of Interest

D.S.P. receives funding from the U.S. National Institutes of Health and contracts with The Centers for Disease Control and Prevention, Amplyx, Astellas, Cidara, and Scynexis. He serves on advisory boards for Amplyx, Astellas, Cidara, Matinas, N8 Medical, and Scynexis. In addition, D.S.P. has an issued U.S. patent concerning echinocandin resistance. These sponsors had no role in the design, execution, interpretation, or writing of the study. The remaining authors declare no potential conflicts of interest.

References

  1. Castanheira, M.; Messer, S.A.; Jones, R.N.; Farrell, D.J.; Pfaller, M.A. Activity of echinocandins and triazoles against a contemporary (2012) worldwide collection of yeast and moulds collected from invasive infections. Int. J. Antimicrob. Agents 2014, 44, 320–326. [Google Scholar] [CrossRef] [PubMed]
  2. Alexander, B.D.; Johnson, M.D.; Pfeiffer, C.D.; Jimenez-Ortigosa, C.; Catania, J.; Booker, R.; Castanheira, M.; Messer, S.A.; Perlin, D.S.; Pfaller, M.A. Increasing echinocandin resistance in Candida glabrata: Clinical failure correlates with presence of FKS mutations and elevated minimum inhibitory concentrations. Clin. Infect. Dis. 2013, 56, 1724–1732. [Google Scholar] [CrossRef] [PubMed] [Green Version]
  3. Lamoth, F.; Lockhart, S.R.; Berkow, E.L.; Calandra, T. Changes in the epidemiological landscape of invasive candidiasis. J. Antimicrob. Chemother. 2018, 73, i4–i13. [Google Scholar] [CrossRef] [Green Version]
  4. Pappas, P.G.; Kauffman, C.A.; Andes, D.R.; Clancy, C.J.; Marr, K.A.; Ostrosky-Zeichner, L.; Reboli, A.C.; Schuster, M.G.; Vazquez, J.A.; Walsh, T.J.; et al. Clinical Practice Guideline for the Management of Candidiasis: 2016 Update by the Infectious Diseases Society of America. Clin. Infect. Dis. 2016, 62, e1–e50. [Google Scholar] [CrossRef] [PubMed] [Green Version]
  5. Perlin, D.S. Mechanisms of echinocandin antifungal drug resistance. Ann. N. Y. Acad. Sci. 2015, 1354, 1–11. [Google Scholar] [CrossRef] [PubMed]
  6. Mazur, P.; Morin, N.; Baginsky, W.; el-Sherbeini, M.; Clemas, J.A.; Nielsen, J.B.; Foor, F. Differential expression and function of two homologous subunits of yeast 1,3-beta-D-glucan synthase. Mol. Cell. Biol. 1995, 15, 5671–5681. [Google Scholar] [CrossRef] [Green Version]
  7. Katiyar, S.K.; Alastruey-Izquierdo, A.; Healey, K.R.; Johnson, M.E.; Perlin, D.S.; Edlind, T.D. Fks1 and Fks2 are functionally redundant but differentially regulated in Candida glabrata: Implications for echinocandin resistance. Antimicrob. Agents Chemother. 2012, 56, 6304–6309. [Google Scholar] [CrossRef] [Green Version]
  8. Gomar-Alba, M.; Morcillo-Parra, M.A.; Olmo, M.L. Response of yeast cells to high glucose involves molecular and physiological differences when compared to other osmostress conditions. FEMS Yeast Res. 2015, 15, fov039. [Google Scholar] [CrossRef]
  9. Zhao, C.; Jung, U.S.; Garrett-Engele, P.; Roe, T.; Cyert, M.S.; Levin, D.E. Temperature-induced expression of yeast FKS2 is under the dual control of protein kinase C and calcineurin. Mol. Cell. Biol 1998, 18, 1013–1022. [Google Scholar] [CrossRef] [Green Version]
  10. Brisse, S.; Pannier, C.; Angoulvant, A.; de Meeus, T.; Diancourt, L.; Faure, O.; Muller, H.; Peman, J.; Viviani, M.A.; Grillot, R.; et al. Uneven distribution of mating types among genotypes of Candida glabrata isolates from clinical samples. Eukaryot. Cell 2009, 8, 287–295. [Google Scholar] [CrossRef] [Green Version]
  11. Muller, H.; Hennequin, C.; Gallaud, J.; Dujon, B.; Fairhead, C. The asexual yeast Candida glabrata maintains distinct a and alpha haploid mating types. Eukaryot. Cell 2008, 7, 848–858. [Google Scholar] [CrossRef] [Green Version]
  12. Gabaldon, T.; Fairhead, C. Genomes shed light on the secret life of Candida glabrata: Not so asexual, not so commensal. Curr. Genet. 2019, 65, 93–98. [Google Scholar] [CrossRef] [Green Version]
  13. Garcia-Effron, G.; Katiyar, S.K.; Park, S.; Edlind, T.D.; Perlin, D.S. A naturally occurring proline-to-alanine amino acid change in Fks1p in Candida parapsilosis, Candida orthopsilosis, and Candida metapsilosis accounts for reduced echinocandin susceptibility. Antimicrob. Agents Chemother. 2008, 52, 2305–2312. [Google Scholar] [CrossRef] [Green Version]
  14. Garcia-Effron, G.; Lee, S.; Park, S.; Cleary, J.D.; Perlin, D.S. Effect of Candida glabrata FKS1 and FKS2 mutations on echinocandin sensitivity and kinetics of 1,3-beta-D-glucan synthase: Implication for the existing susceptibility breakpoint. Antimicrob. Agents Chemother. 2009, 53, 3690–3699. [Google Scholar] [CrossRef] [Green Version]
  15. Niimi, K.; Woods, M.A.; Maki, K.; Nakayama, H.; Hatakenaka, K.; Chibana, H.; Ikeda, F.; Ueno, K.; Niimi, M.; Cannon, R.D.; et al. Reconstitution of high-level micafungin resistance detected in a clinical isolate of Candida glabrata identifies functional homozygosity in glucan synthase gene expression. J. Antimicrob. Chemother. 2012, 67, 1666–1676. [Google Scholar] [CrossRef] [Green Version]
  16. Wu, J.; Chen, X.; Cai, L.; Tang, L.; Liu, L. Transcription factors Asg1p and Hal9p regulate pH homeostasis in Candida glabrata. Front. Microbiol. 2015, 6, 843. [Google Scholar] [CrossRef] [Green Version]
  17. Bernardo, R.T.; Cunha, D.V.; Wang, C.; Pereira, L.; Silva, S.; Salazar, S.B.; Schroder, M.S.; Okamoto, M.; Takahashi-Nakaguchi, A.; Chibana, H.; et al. The CgHaa1-Regulon Mediates Response and Tolerance to Acetic Acid Stress in the Human Pathogen Candida glabrata. G3 (Bethesda) 2017, 7, 1–18. [Google Scholar] [CrossRef] [Green Version]
  18. Hogan, D.J.; Riordan, D.P.; Gerber, A.P.; Herschlag, D.; Brown, P.O. Diverse RNA-binding proteins interact with functionally related sets of RNAs, suggesting an extensive regulatory system. PLoS Biol. 2008, 6, e255. [Google Scholar] [CrossRef] [Green Version]
  19. Jansen, J.M.; Wanless, A.G.; Seidel, C.W.; Weiss, E.L. Cbk1 regulation of the RNA-binding protein Ssd1 integrates cell fate with translational control. Curr. Biol. 2009, 19, 2114–2120. [Google Scholar] [CrossRef] [Green Version]
  20. Kurischko, C.; Kuravi, V.K.; Herbert, C.J.; Luca, F.C. Nucleocytoplasmic shuttling of Ssd1 defines the destiny of its bound mRNAs. Mol. Microbiol. 2011, 81, 831–849. [Google Scholar] [CrossRef] [Green Version]
  21. Kurischko, C.; Kim, H.K.; Kuravi, V.K.; Pratzka, J.; Luca, F.C. The yeast Cbk1 kinase regulates mRNA localization via the mRNA-binding protein Ssd1. J. Cell Biol 2011, 192, 583–598. [Google Scholar] [CrossRef] [PubMed] [Green Version]
  22. Zordan, R.E.; Ren, Y.; Pan, S.J.; Rotondo, G.; De Las Penas, A.; Iluore, J.; Cormack, B.P. Expression plasmids for use in Candida glabrata. G3 (Bethesda) 2013, 3, 1675–1686. [Google Scholar] [CrossRef] [Green Version]
  23. Healey, K.R.; Katiyar, S.K.; Raj, S.; Edlind, T.D. CRS-MIS in Candida glabrata: Sphingolipids modulate echinocandin-Fks interaction. Mol. Microbiol. 2012, 86, 303–313. [Google Scholar] [CrossRef] [PubMed] [Green Version]
  24. Johnson, M.E.; Edlind, T.D. Topological and mutational analysis of Saccharomyces cerevisiae Fks1. Eukaryot. Cell 2012, 11, 952–960. [Google Scholar] [CrossRef] [Green Version]
  25. National Committee for Clinical Laboratory Standards. Reference Method for Broth Dilution ANTIFUNGAL Susceptibility Testing of Yeasts. Clinical and Laboratory Standards Institute Document M27, 4th ed.; Clinical and Laboratory Standards Institute: Wayne, PA, USA, 2017. [Google Scholar]
  26. Healey, K.R.; Nagasaki, Y.; Zimmerman, M.; Kordalewska, M.; Park, S.; Zhao, Y.; Perlin, D.S. The Gastrointestinal Tract Is a Major Source of Echinocandin Drug Resistance in a Murine Model of Candida glabrata Colonization and Systemic Dissemination. Antimicrob. Agents Chemother. 2017, 61. [Google Scholar] [CrossRef] [PubMed] [Green Version]
  27. Livak, K.J.; Schmittgen, T.D. Analysis of relative gene expression data using real-time quantitative PCR and the 2(-Delta Delta C(T)) Method. Methods 2001, 25, 402–408. [Google Scholar] [CrossRef]
  28. Li, Q.Q.; Skinner, J.; Bennett, J.E. Evaluation of reference genes for real-time quantitative PCR studies in Candida glabrata following azole treatment. BMC Mol. Biol. 2012, 13, 22. [Google Scholar] [CrossRef] [Green Version]
  29. Park, S.; Kelly, R.; Kahn, J.N.; Robles, J.; Hsu, M.J.; Register, E.; Li, W.; Vyas, V.; Fan, H.; Abruzzo, G.; et al. Specific substitutions in the echinocandin target Fks1p account for reduced susceptibility of rare laboratory and clinical Candida sp. isolates. Antimicrob. Agents Chemother. 2005, 49, 3264–3273. [Google Scholar] [CrossRef] [Green Version]
  30. Hou, X.; Healey, K.R.; Shor, E.; Kordalewska, M.; Ortigosa, C.J.; Paderu, P.; Xiao, M.; Wang, H.; Zhao, Y.; Lin, L.Y.; et al. Novel FKS1 and FKS2 modifications in a high-level echinocandin resistant clinical isolate of Candida glabrata. Emerg. Microbes Infect. 2019, 8, 1619–1625. [Google Scholar] [CrossRef] [Green Version]
  31. Schwarzmuller, T.; Ma, B.; Hiller, E.; Istel, F.; Tscherner, M.; Brunke, S.; Ames, L.; Firon, A.; Green, B.; Cabral, V.; et al. Systematic phenotyping of a large-scale Candida glabrata deletion collection reveals novel antifungal tolerance genes. PLoS Pathog. 2014, 10, e1004211. [Google Scholar] [CrossRef] [Green Version]
  32. Healey, K.R.; Perlin, D.S. Fungal Resistance to Echinocandins and the MDR Phenomenon in Candida glabrata. J. Fungi 2018, 4. [Google Scholar] [CrossRef]
  33. Shields, R.K.; Nguyen, M.H.; Press, E.G.; Kwa, A.L.; Cheng, S.; Du, C.; Clancy, C.J. The presence of an FKS mutation rather than MIC is an independent risk factor for failure of echinocandin therapy among patients with invasive candidiasis due to Candida glabrata. Antimicrob. Agents Chemother. 2012, 56, 4862–4869. [Google Scholar] [CrossRef] [Green Version]
  34. Kaeberlein, M.; Guarente, L. Saccharomyces cerevisiae MPT5 and SSD1 function in parallel pathways to promote cell wall integrity. Genetics 2002, 160, 83–95. [Google Scholar]
  35. Arias, P.; Diez-Muniz, S.; Garcia, R.; Nombela, C.; Rodriguez-Pena, J.M.; Arroyo, J. Genome-wide survey of yeast mutations leading to activation of the yeast cell integrity MAPK pathway: Novel insights into diverse MAPK outcomes. BMC Genom. 2011, 12, 390. [Google Scholar] [CrossRef] [Green Version]
Figure 1. Disruption of predicted post-transcriptional regulator SSD1 produces minor increases in echinocandin killing. In vitro caspofungin killing assay of wild type and SSD1 knockout strains. Mean plus/minus SD of 2 independent experiments (each with 2 replicates) is shown. CFU, colony forming units.
Jof 06 00143 g001
Figure 2. SSD1 deletion leads to general decreases in FKS1 gene expression and increases in FKS2 gene expression. RNA was isolated from cells harvested at mid-log phase and expression compared to that of the wild type cells (2−∆∆Ct). Expression was normalized to RDN5.8. Mean plus SD of 3 independent experiments is shown. * p < 0.05, ** p < 0.01, ns = not significant; Student’s t-test, two-tailed. p values in black compare expression to wild type while brackets and p values in blue compare the same FKS mutant with and without SSD1. Relative expression ratios of FKS1 to FKS2 are displayed below the figure with associated fold changes from wild type or parental mutant.
Jof 06 00143 g002
Figure 3. SSD1 deletion leads to decreases in Fks1:Fks2 protein ratios in FKS1 mutants. (a) SSD1 deletion in the FKS mutant backgrounds (squared in red) leads to a decrease in Fks1:Fks2 protein ratio. (b) Plasmid expression of SSD1 complements the decrease in Fks1:Fks2 protein ratio observed in the fks1 ∆ssd1 mutant. Glucan synthase enzyme was purified from strains and western blotting performed with anti-CgFks1 or anti-CgFks2 antibodies that recognize N-terminal epitopes. ImageJ software was used to determine band intensities (integrated densities) and ratios of Fks1 to Fks2 were calculated. Representative blots from two independent experiments and mean ratios plus/minus SD are shown.
Jof 06 00143 g003
Figure 4. Model displaying the effects on FKS1 and FKS2 gene and protein with (a) and without (b) SSD1. These effects are more pronounced within FKS mutants. The Fks1 protein in cells without SSD1 may or may not reach the plasma membrane and/or be functional. Relative, not actual, amount of Fks1/2 protein displayed; model not drawn to scale.
Jof 06 00143 g004
Table 1. Disruption of SSD1 selectively reverses FKS1-mediated echinocandin resistance and induces FK506 sensitivity. SSD1 was disrupted in wild type and equivalent FKS1 and FKS2 mutants and caspofungin (CSF), micafungin (MCF), and FK506 minimum inhibitory concentrations (MICs) determined. Results are representative of three independent experiments.
24 h MICs (µg/mL)
StrainCSFMCFFK506
wild type0.030.0332
∆ssd10.0160.008≤0.5
∆fks10.0080.016≤0.5
∆fks20.0160.0332
Fks1-
625delF2116
625delF ∆ssd10.030.008≤0.5
S629P2132
S629P ∆ssd10.250.031
Fks2-
659delF2132
659delF ∆ssd120.5≤0.5
S663P2164
S663P ∆ssd1212
Table 2. Restoration of echinocandin resistance in fks1 ∆ssd1 mutants upon heterologous expression of SSD1. The SSD1 coding region was cloned onto pCN-PDC1 via gap-repair (pSSD1). Results are representative of three independent experiments. CSF, caspofungin; MCF, micafungin.
24 h MICs (µg/mL)
StrainCSFMCF
WT + empty0.0160.016
WT + pSSD10.0160.016
∆ssd1 + empty0.0160.008
625delF + empty41
625delF + pSSD141
625delF ∆ssd1 + empty0.120.016
625delF ∆ssd1 + pSSD140.5
S629P + empty42
S629P + pSSD122
S629P ∆ssd1 + empty0.060.016
S629P ∆ssd1 + pSSD122

