Article

The Relevance of Heart Rate Fluctuation When Evaluating Atrial Substrate Electrical Features in Catheter Ablation of Paroxysmal Atrial Fibrillation

1
BioMIT.org, Electronic Engineering Department, Universitat Politecnica de Valencia, 46022 Valencia, Spain
2
Cardiology Department, Saint John’s University Hospital, 03550 Alicante, Spain
3
Cardiovascular Surgery Department, Hospital Clínico Universitario de Valencia, 46010 Valencia, Spain
4
Research Group in Electronic, Biomedical and Telecommunication Engineering, University of Castilla-La Mancha, 16071 Cuenca, Spain
*
Author to whom correspondence should be addressed.
J. Cardiovasc. Dev. Dis. 2022, 9(6), 176; https://doi.org/10.3390/jcdd9060176
Submission received: 1 April 2022 / Revised: 23 May 2022 / Accepted: 30 May 2022 / Published: 1 June 2022
(This article belongs to the Special Issue Catheter Ablation of Cardiac Arrhythmias: Practices and Outcomes)

Abstract

:
Coronary sinus (CS) catheterization is critical during catheter ablation (CA) of atrial fibrillation (AF). However, the association of CS electrical activity with atrial substrate modification has been barely investigated and mostly limited to analyses during AF. In sinus rhythm (SR), atrial substrate modification is principally assessed at a global level through P-wave analysis. Cross-correlating CS electrograms (EGMs) and P-waves’ features could potentiate the understanding of AF mechanisms. Five-minute surface lead II and bipolar CS recordings before, during, and after CA were acquired from 40 paroxysmal AF patients. Features related to duration, amplitude, and heart-rate variability of atrial activations were evaluated. Heart-rate adjustment (HRA) was applied. Correlations between each P-wave and CS local activation wave (LAW) feature were computed with cross-quadratic sample entropy (CQSE), Pearson correlation (PC), and linear regression (LR) with 10-fold cross-validation. The effect of CA between different ablation steps was compared with PC. Linear correlations: poor to mediocre before HRA for analysis at each P-wave/LAW (PC: max. +18.36%, p = 0.0017, LR: max. +5.33%, p = 0.0002) and comparison between two ablation steps (max. +54.07%, p = 0.0205). HRA significantly enhanced these relationships, especially in duration (P-wave/LAW: +43.82% to +69.91%, p < 0.0001 for PC and +18.97% to +47.25%, p < 0.0001 for LR, CA effect: +53.90% to +85.72%, p < 0.0210). CQSE reported negligent correlations (0.6–1.2). Direct analysis of CS features is unreliable to evaluate atrial substrate modification due to CA. HRA substantially solves this problem, potentiating correlation with P-wave features. Hence, its application is highly recommended.

1. Introduction

With a prevalence higher than 37 million people worldwide, significant mortality rates, and economic burden, atrial fibrillation (AF) is not only just the most common cardiac arrhythmia, but also a multifactorial threat [1,2]. AF can be classified as a function of its spontaneous termination into two different types: paroxysmal and non-paroxysmal. The former includes AF episodes spontaneously terminating in less than 7 days, while the latter includes AF episodes unable to terminate within 7 days without intervention [2]. Pulmonary veins (PVs) are the principal AF foci, and their catheter ablation (CA) is the cornerstone of AF treatment, especially successful in paroxysmal AF cases [2,3,4,5]. Despite the high success rates of the CA of PVs, AF recurrence is not an unusual phenomenon, especially in persistent AF patients. While early recurrence is mostly associated with PV reconnection, late recurrence may be an indicator of the existence of non-PV triggers [6].
One of the keys to understanding the AF mechanisms and deciding the therapy and personalized follow-up treatment is the detailed analysis of the atrial substrate, which is defined as any changes in structural, electrical, or functional level that sustain the AF activity, also known as atrial remodeling [2]. Although it is not necessary for all of the aforementioned alterations to be present, there is a substantial association between them [7,8,9]. A successful CA outcome involves a sufficient atrial substrate modification, which implies the interception of the mechanisms favoring the AF perpetuation due to the isolation of the PVs. As in the case of atrial remodeling, substrate modification can happen at three levels: structural, electrical, or functional. Since structural changes are connected with the anatomical alteration of the atria, a blanking period of 3 months is typically used in order to safely assess the structural substrate modification [7,10]. Although electrical and functional—related to freedom from AF—modification have been observed as early as one day after CA, electrical substrate modification can in fact be observed even earlier, immediately after the CA procedure [11,12,13].
During CA, one or more atrial structures are chosen as a reference, and recordings from a stationary catheter are acquired throughout the procedure [14,15]. The coronary sinus (CS) is the most common reference, as it forms an interatrial electrical bridge and can initiate or propagate the AF activity [16,17,18,19,20]. CS catheterization allows the mapping of the entire atria. CS pacing can induce AF, and depending on the CS channels where pacing has been performed, triggers in the left (LA) or right atrium (RA), as well as in the CS musculature can be detected [21,22,23]. Nevertheless, variable CS anatomy and vivid cardiac contraction can complicate the CS cannulation procedure, and the selection of the proper CS channel for analysis should be performed with caution and may differ for recordings in AF or in sinus rhythm (SR). Recently, a study alerted the risk of high noise prevalence in recordings from the distal tip of the CS catheter during SR [13].
The pivotal role of CS not only in AF initiation or perpetuation, but also in AF mapping has led to the further investigation into the clinical information that can be acquired from the CS electrograms (EGMs). During AF, the analysis of the dominant frequency (DF) or complexity of CS EGMs from PV and non-PV CA has been quite fruitful in predicting the AF recurrence [24,25,26]. Additionally, DF in CS EGMs has been recruited in order to define the endpoint for the CA of PVs and complex EGMs [27]. The existence of complex EGMs in CS has also been associated with AF prevalence [28]. Despite the high interest in CS EGMs during AF, little or no attention has been paid to CS function during SR and its modification after CA procedures. Prolonged conduction time measured between EGMs from RA and CS in recordings acquired before CA of PVs and complex EGMs has shown high predictive power for atrial tachyarrhythmia occurrence [29]. Moreover, in CA of atrial flutter, fractionation in the EGMs of CS can predict the incidence of AF [30].
Although they present interesting findings, studies focused on the CS analysis during SR are few and mainly involve additional CA applications. Nevertheless, the CS function during CA of PVs only, as well as the alterations that may be provoked by the CA are yet to be discovered. Given the high significance of CS for the CA procedure and the fact that CS EGMs provide information at a local level, an analysis focusing on the CS during the CA of PVs and how the CA procedure modifies its function could potentiate the perception on the AF mechanisms during SR. Any important findings could be recruited along with already established methods in order to provide a new perspective into the AF analysis. The wide availability of CS recordings from CA sessions makes the investigation of this assumption quite feasible. However, the lack of major analyses that could serve as a reference for the observation of the CS function alteration raise the need for alternative studies that are vastly applied to investigate the atrial substrate modification.
During the CA procedure, electrocardiogram (ECG) recordings from the skin surface are simultaneously acquired along with the recordings from the intracardiac catheters and are vastly used to observe the atrial substrate modification. In CA sessions performed under SR, analysis is mainly focused on either of two parameters: P-waves or heart-rate variability (HRV). The P-wave is the ECG part that represents the atrial depolarization [31]. Hence, P-wave variations after CA reflect changes in the atrial contractility. Many studies have revealed the capability of P-wave parameters such as P-wave duration, amplitude, as well as the frequency domain analysis of assessing the CA outcome [32,33,34,35,36,37,38,39]. P-wave duration is probably the most relevant feature, as it measures the duration of the atrial depolarization [40]. The rationale behind P-wave duration analysis is that the P-wave duration values come as a function of the anatomical abnormalities assisting the AF propagation and that the P-wave shortening, especially occurring in the left atrial P-wave part, is indicative in the freedom from AF after the CA procedure [36,38,41,42,43].
Being a measure of calibration between the sympathetic and parasympathetic nervous systems [44], HRV is the other popular evaluator of CA outcome [45,46]. It can be assessed by the variation between successive R-R intervals, high- and low-frequency analysis or Lyapunov exponents and Kolmogorov entropy, among other methods [44,47]. The reduction of HRV after radiofrequency (RF) CA is a natural, albeit temporary, side effect of the CA procedure that is gradually restored over time [48] and can predict AF recurrence [49]. The main mechanisms causing HRV reduction are the RF energy emitted in the PV tissue, stimulating the sympathetic nerve fibers and causing temporal parasympathetic nervous system withdrawal [48]. Recently, it was demonstrated that high parasympathetic tone after cryoballoon CA is also connected with AF recurrence [50].
Despite the high significance of P-waves and HRV analysis for atrial substrate modification evaluation after the CA of PVs, these parameters provide information on the global atrial substrate modification or the ventricular response, in the case of HRV. However, how critical structures are affected by the CA procedure is yet to be discovered. Constant pacing of CS for AF mapping may alter its functionality. Whether and to what extent this is reflected in the conventional substrate modification assessment techniques remain unknown. The aim of the current study is to investigate this presumption. For this purpose, any possible linear or nonlinear correlations between ECG and CS recordings are explored in order to provide new insights into the pathophysiological AF mechanisms during SR and their interaction with the most popular AF treatment, CA.
The remainder is organized as follows. The database and analysis methods are presented in Section 2, where also the statistical analysis is explained. Results are shown in Section 3, and they are further analyzed in Section 4, where relevant work is also described. The manuscript is completed with the conclusions presented in Section 5.

2. Methods

Recordings of 40 paroxysmal AF patients undergoing the RFCA of PVs for the first time were employed. Isolation was performed by creating lesions surrounding each PV side (left or right), guided by 3D electroanatomical mapping. The procedure started with the RFCA of the left PVs, followed by the RFCA of the right PVs. Whenever tricuspid isthmus (TCI) block was observed, TCI isolation was performed following RFCA. The endpoint of the procedure was bi-directional electrical isolation of all pulmonary veins after adenosine administration. Recordings from a standard 12-lead electrocardiogram (ECG) and a decapolar CS catheter with a sampling frequency of 1 kHz were acquired by a Labsystem™ PRO EP recording system (Boston Scientific, Marlborough, MA, USA) for five minutes before, during, and after the CA procedure. Recordings during the CA procedure were acquired after the isolation of left pulmonary veins (LPVI). P-wave analysis was performed using recordings from lead II, while the channel of bipolar CS recordings with the least fluctuations and the highest amplitude was selected for the CS analysis. This channel varied among patients, but was always the same for one patient at all three time points from which the recordings were obtained. In case all channels showed a high amplitude and clear signals, medial or mid-proximal channels were selected [13].

2.1. Preprocessing

ECG preprocessing contained the removal of power-line interference, high-frequency muscle noise, and baseline wander [51,52]. Ectopic beats were present in some of the recordings, with a maximum prevalence of 4 % of total beats. Ectopic beat removal contained the ectopic detection, cancellation, and replacement by linear interpolation [53,54]. After ectopics removal, P-waves were detected and delineated [55,56].
CS recordings’ preprocessing started with denoising, mean removal, and cancellation of ventricular activity, if present, by an adaptive cancellation method [57,58]. Afterwards, local activation waves (LAWs) were detected and delineated [59,60]. Delineation was then inspected and corrected by two experts for both invasive and surface recordings.

2.2. Data Analysis

After P-wave and LAW detection, the following features were calculated at each activation for both P-waves and LAWs and then averaged over each recording:
  • Duration: Once delineated, the interval between the onset and offset of each activation was considered as its duration.
  • Amplitude: Maximum ( A m p m a x ) and peak-to-peak (PP) amplitudes. For ECGs, P-wave A m p m a x and PP concur, since P-waves in lead II are positive. The root mean square (RMS) is the quadratic mean of the function that defines each activation.
  • Area: Area of the positive parts of the signal (PosAr), calculated by the integration over the time interval of the amplitude of each activation with the trapezoidal method.
  • Slope rate: Increasing or decreasing rhythm at 5 % , 10 % , 20 % of total duration of each P-wave/LAW, as well as at its maximum point, calculated as:
    S i = A m p ( i ) A m p ( o n s e t ) t i t o n s e t ,
    where A m p ( i ) is the amplitude at i = 5 , 10 , 20 % or the peak of the activation, A m p ( o n s e t ) is the amplitude at the onset, and t i and t o n s e t are the sample points at i = 5 , 10 , 20 % or the peak and the onset, respectively. Slope rate is always positive for P-waves, as their peaks always present a positive amplitude. For LAWs, slope rate can be negative as well.
Since the analysis of the present study is focused on atrial activations, HRV analysis was calculated by measuring successive P-wave or LAW intervals. Hence, it will be referred to in the remainder of the manuscript as atrial rate variability (ARV). ARV was calculated across each surface and invasive recording analyzing the standard deviation of the normal-to-normal P-wave or LAW interval (SDNN), the variance of normal-to-normal P-wave or LAW interval (VARNN), and the RMS of successive differences (RMSSD) between two P-waves or LAWs [44].
In order to compensate for the effect of fluctuations in heart rate (HR) on several features [61], an HR adjustment (HRA) was performed by scaling them by the following factor:
s f i = 1000 I B I i ,
where I B I i is the inter-beat interval between the i t h and the ( i 1 ) t h activations. HRA was used to scale Duration ( HRA ( D u r a t i o n ) ) and Area ( HRA ( P o s A r ) ) and scale inversely Slope rate ( HRA ( S i )).

2.3. Statistical Analysis

Any possible linear or nonlinear relationships between P-waves and CS LAWs were investigated. Linear correlations between each P-wave and CS LAW of every recording were assessed with Pearson’s correlation and linear regression with 10-fold cross-validation, and nonlinear relationships were assessed with cross-quadratic sample entropy (CQSE). An example of how linear correlations between each P-wave and CS LAW were calculated can be seen in Figure 1a. As ARV features are calculated across each recording and do not correspond to activation-based analysis, they were excluded from this step.
Correlation of CA-induced variation (CV) between P-wave and CS LAW features including ARV was investigated by Pearson’s correlation, which performs a bidirectional comparison. This step allows the comparison between the effect that CA had on CS function and the effect that CA had on the entire atria. For each patient and each feature, the CA-induced variation was the percentage of alteration, calculated as the median value after CA with respect to the median value before CA:
CV = ( v a l u e _ a f t e r v a l u e _ b e f o r e 1 ) × 100 ( % ) .
Figure 1b shows an example of how CV is calculated. The normality of the results was tested with the Shapiro–Wilk test, and final correlations are expressed as medians, as the values did not follow a normal distribution [62].
Linear regression can only assess the one-way relationship between a dependent variable a and one or more independent variables b 1   , b 2 , ,   b n , where n is the number of independent variables or predictors. Linear regression with only one independent variable b is called simple linear regression, and the equation describing it is the following [63]:
a = β 0 + β 1 × b + ϵ ,
where β 0 is the intercept, β 1 is the gradient or regression coefficient, and ϵ is the random error, normally distributed for simple linear regression models. In that case, the null hypothesis for β 1 comes from the t-test and is therefore the same whether a is the dependent or the independent variable. Regression analysis can provide various coefficients that can be further processed or used directly in order to evaluate the accuracy of the model. As the aim of this analysis is the calculation of the correlation between surface and invasive recordings, the coefficient of determination ( R 2 - a d j u s t e d ) was recruited.
The conventional coefficient of determination ( R 2 ) describes how well the data fit the regression model and is expressed as a percentage, where 0 % indicates that the dependent variable is not related at all to the built model, while 100 % shows an absolute concordance between the dependent variable and the model. R 2 - a d j u s t e d additionally adjusts for the number of terms that are added to the model in a way that only the predictors that really affect the dependent variable are considered, thus resulting in a more unbiased result. R 2 - a d j u s t e d is always equal to or less than R 2 .
In general, cross-entropies allow the comparison between two time-series of different origins [64,65]. They are used to evaluate dynamic changes between two series and observe any similarities they may have. For this analysis, CQSE was chosen as an enhanced version of cross-sample entropy, allowing the tolerance r to vary in order to achieve better conditional probability estimates [66].
Any bias due to discrepancies in the values of the time-series should be removed before performing the CQSE [65]. This is achieved by normalizing each time-series as follows:
x ( i ) = x ( i ) x ¯ s t d ( x ) ,
where x ( i ) is the i-th sample of N-length time-series X = { X ( 1 ) , X ( 2 ) , , X ( N ) } , x ¯ is the mean value, and s t d is the standard deviation.
Details about the computation of CQSE can be found elsewhere [65,66]. In brief, given two time-series X = { X ( 1 ) , X ( 2 ) , , X ( N ) } and Y = { Y ( 1 ) , Y ( 2 ) , , Y ( M ) } of length N and M, respectively, the probability that X i m patterns of length m are similar to Y j m patterns with a tolerance r is
A m ( r ) = 1 N m × i = 1 N m [ 1 M m j = 1 M m × Θ ( r d i j m ) ] ,
where Θ is the Heaviside function and d i j m the distance between X i m and Y j m .
Respectively, for a template of length m + 1 , the probability that two patterns X i m + 1 and Y j m + 1 are similar is the following:
A m + 1 ( r ) = 1 N m 1 × i = 1 N m 1 [ 1 M m 1 j = 1 M m 1 × Θ ( r d i j m + 1 ) ] .
Then, CQSE is calculated as
C Q S E ( m , r , N , M ) = l n A m + 1 ( r ) A m ( r ) + l n ( 2 r ) .
After multiple iterations, this analysis was performed with m = 1 and r = 0.35 , as these parameters provided the best results.

3. Results

The effect of scaling for HRA on Duration can be observed in Figure 2. While Duration values between each P-wave and CS LAW do not seem to correlate, when HRA is applied, they seem to follow a more similar pattern (Figure 2a). For the same recording, linear regression notably improves after HRA, and the values seem more coherent (Figure 2b).

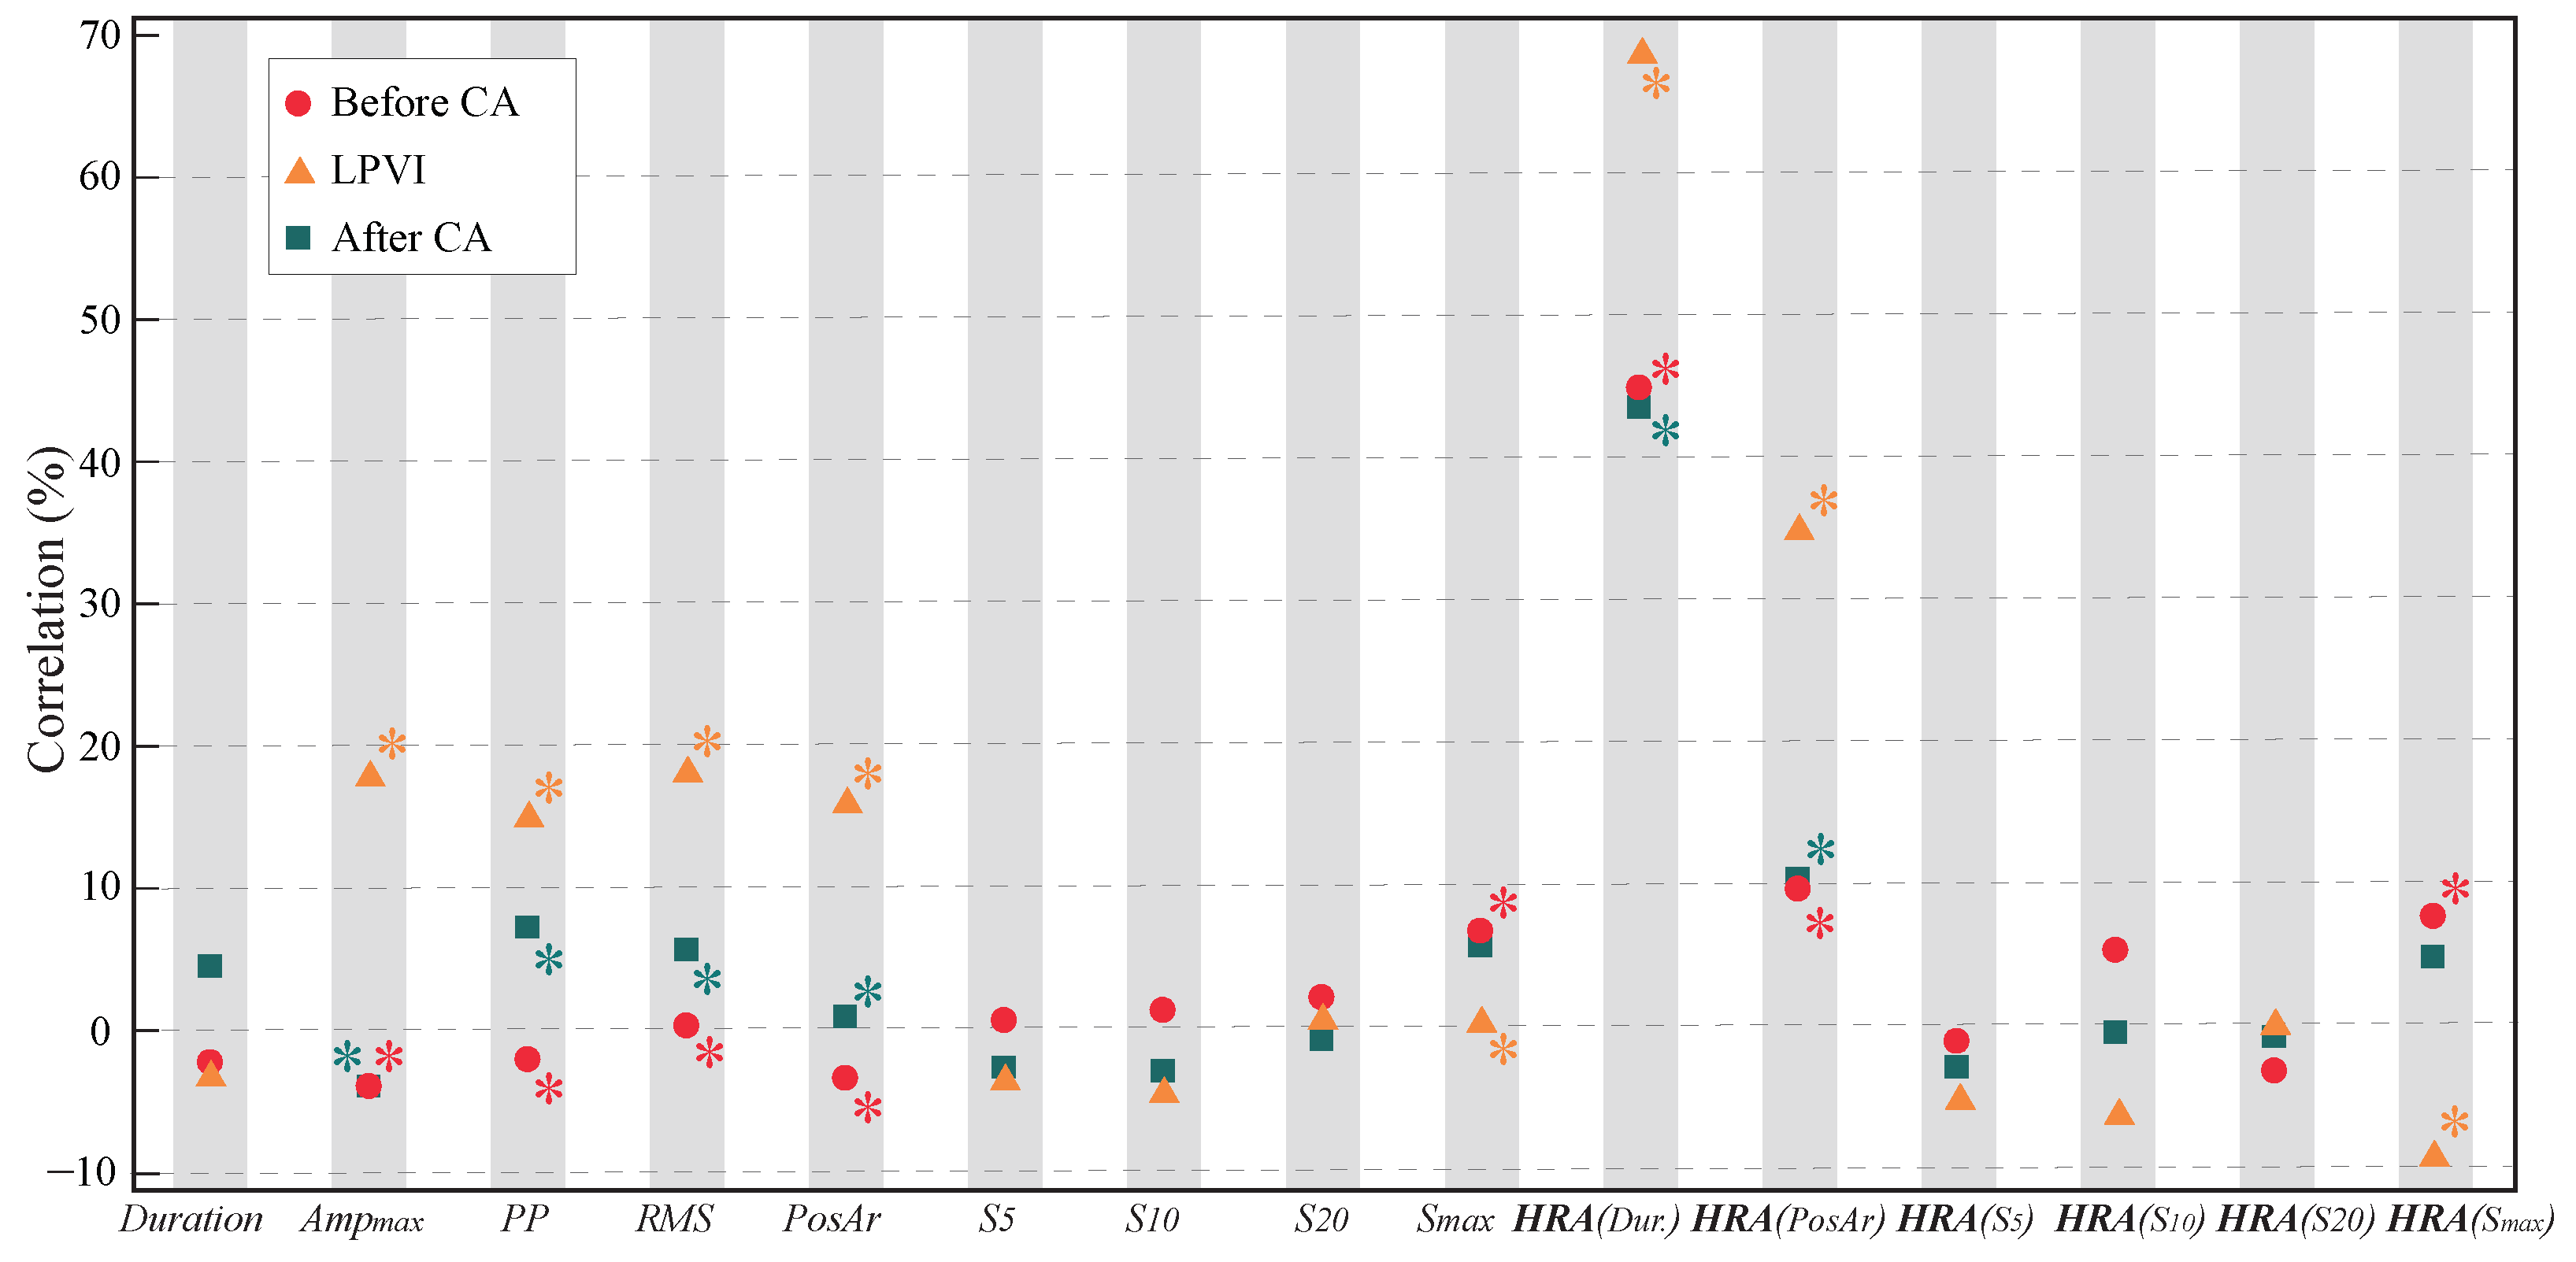
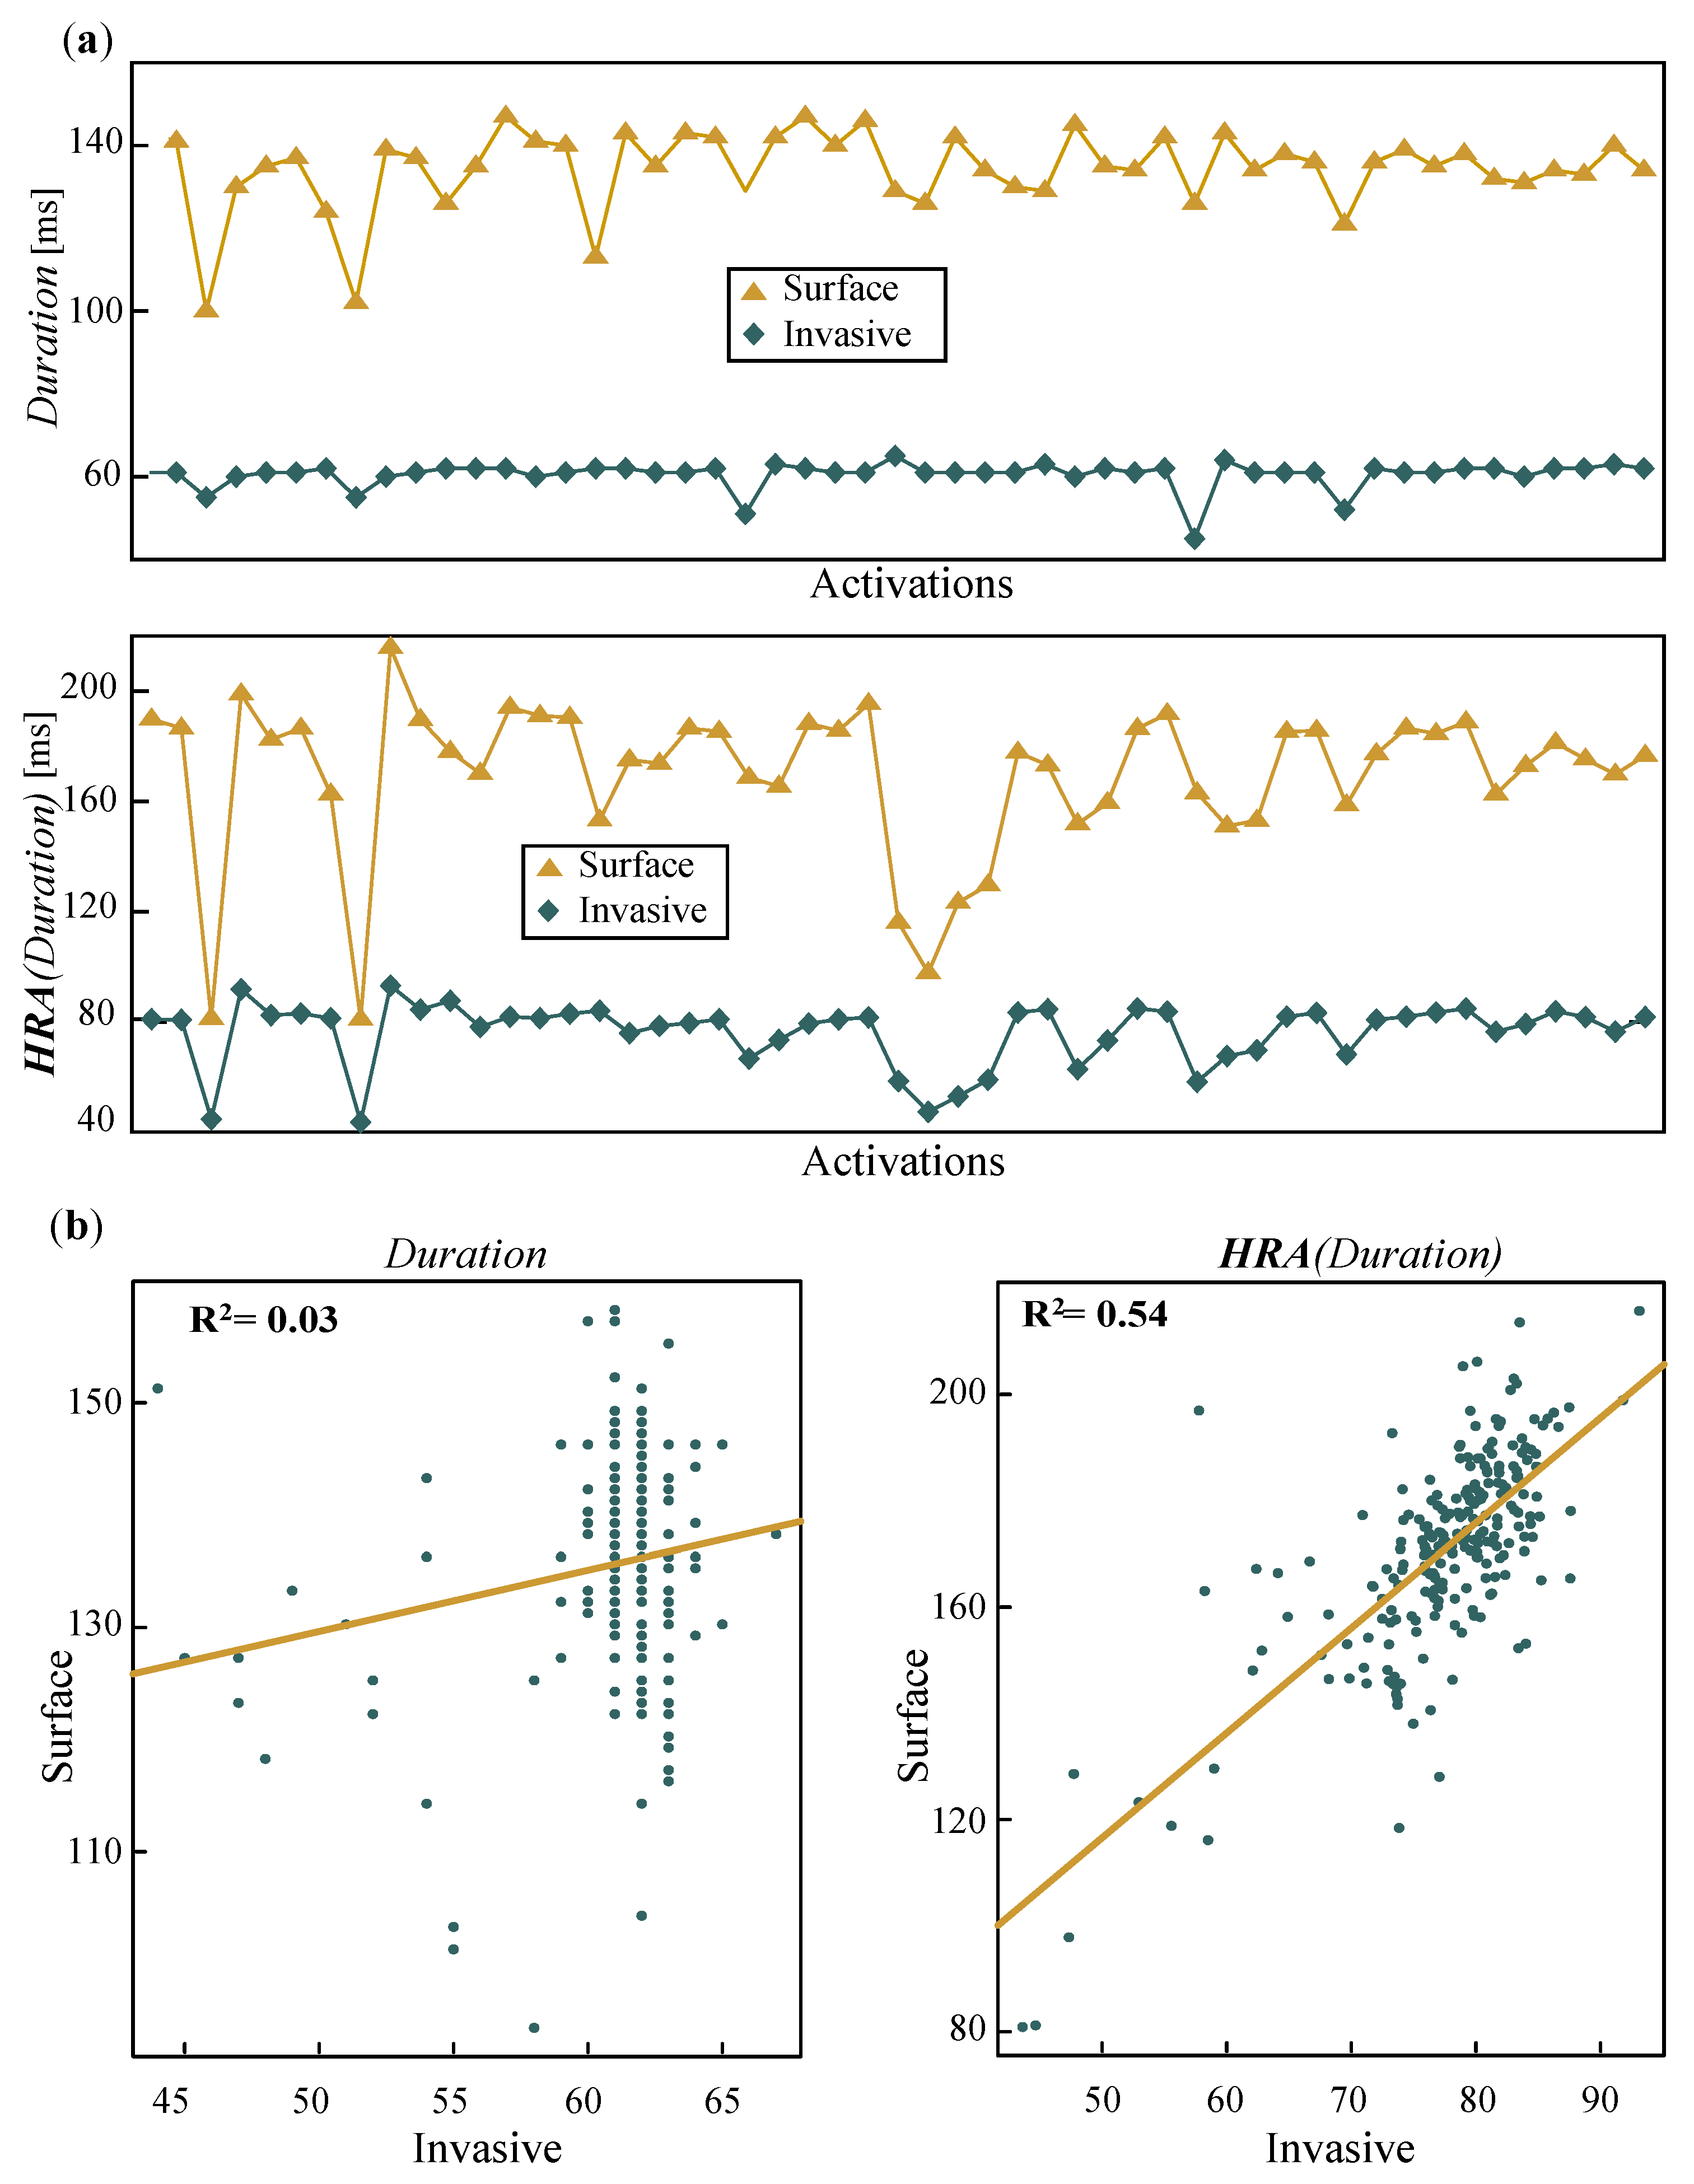
3.1. Linear Analysis

The results of Pearson correlation when each P-wave were compared with the corresponding LAW (P-wave/LAW analysis) by Pearson’s correlation, as illustrated in Figure 3 and shown further in detail in Table 1. Amplitude and Area features showed low positive and negative statistically significant correlations ( 3.92 % to + 18.36 % , p < 0.0142 ) regardless of the observation point (recordings before, during, or after CA). S m a x also showed a negligent positive correlation in recordings before and during CA. No statistically significant correlations were found for the remaining features.
After HRA, HRA ( D u r a t i o n ) showed a notably higher correlation ( + 43.82 % to + 69.91 % , p < 0.0001 ). The correlation between HRA ( A r e a ) of each P-wave and LAW also increased, still showing low values ( + 10.00 % to + 35.40 % , p 0.0425 ). The effect of scaling on S m a x was minor, with correlations either remaining almost the same or becoming negative ( + 0.71 % , p = 0.0114 for non-HRA versus 8.65 % , p = 0.0091 for HRA in recordings during CA).
When LR analysis was performed, statistical power remained the same for each feature as in Pearson correlation analysis. Nonetheless, correlations became weaker due to cross-validation. The effect of HRA was also present, converting Duration from low and statistically insignificant ( + 0.22 % to + 0.69 % , p < 0.2221 ) to low or moderate and statistically significant ( + 18.97 % to + 47.25 % , p < 0.0001 ) for HRA ( D u r a t i o n ) , as can be observed in Table 2. In both Pearson’s correlation and LR, features reached higher concordance during CA (after LPVI), especially after HRA.
CV between P-waves and LAWs can be seen in Figure 4 and Table 3. Before HRA, only RMS ( + 54.07 % , p = 0.0205 ) at the third transition, measuring the difference in features between the end of LPVI and the end of CA and S 10 ( + 26.29 % , p = 0.0009 ) at the first transition, measuring the difference in features between the beginning of CA and the end of LPVI, showed small to moderate correlations. In this case as well, HRA enhanced this effect for HRA ( S 10 ) ( + 73.23 % , p = 0.0055 ) and additionally revealed a moderate to high CV for HRA ( D u r a t i o n ) ( + 53.90 % to + 85.72 % , p < 0.0210 ). The effect of CA in ARV was quite similar for P-waves and LAWs, as can be observed from the moderate to high CV that they showed ( + 48.33 % to + 94.20 % , p < 0.0422 ). While the effect of LPVI seemed to affect in a more similar way the activation-based features and especially HRA ( D u r a t i o n ) of P-waves and LAWs, CV for ARV features was notably lower after LPVI, lacking statistical significance in most of the cases.

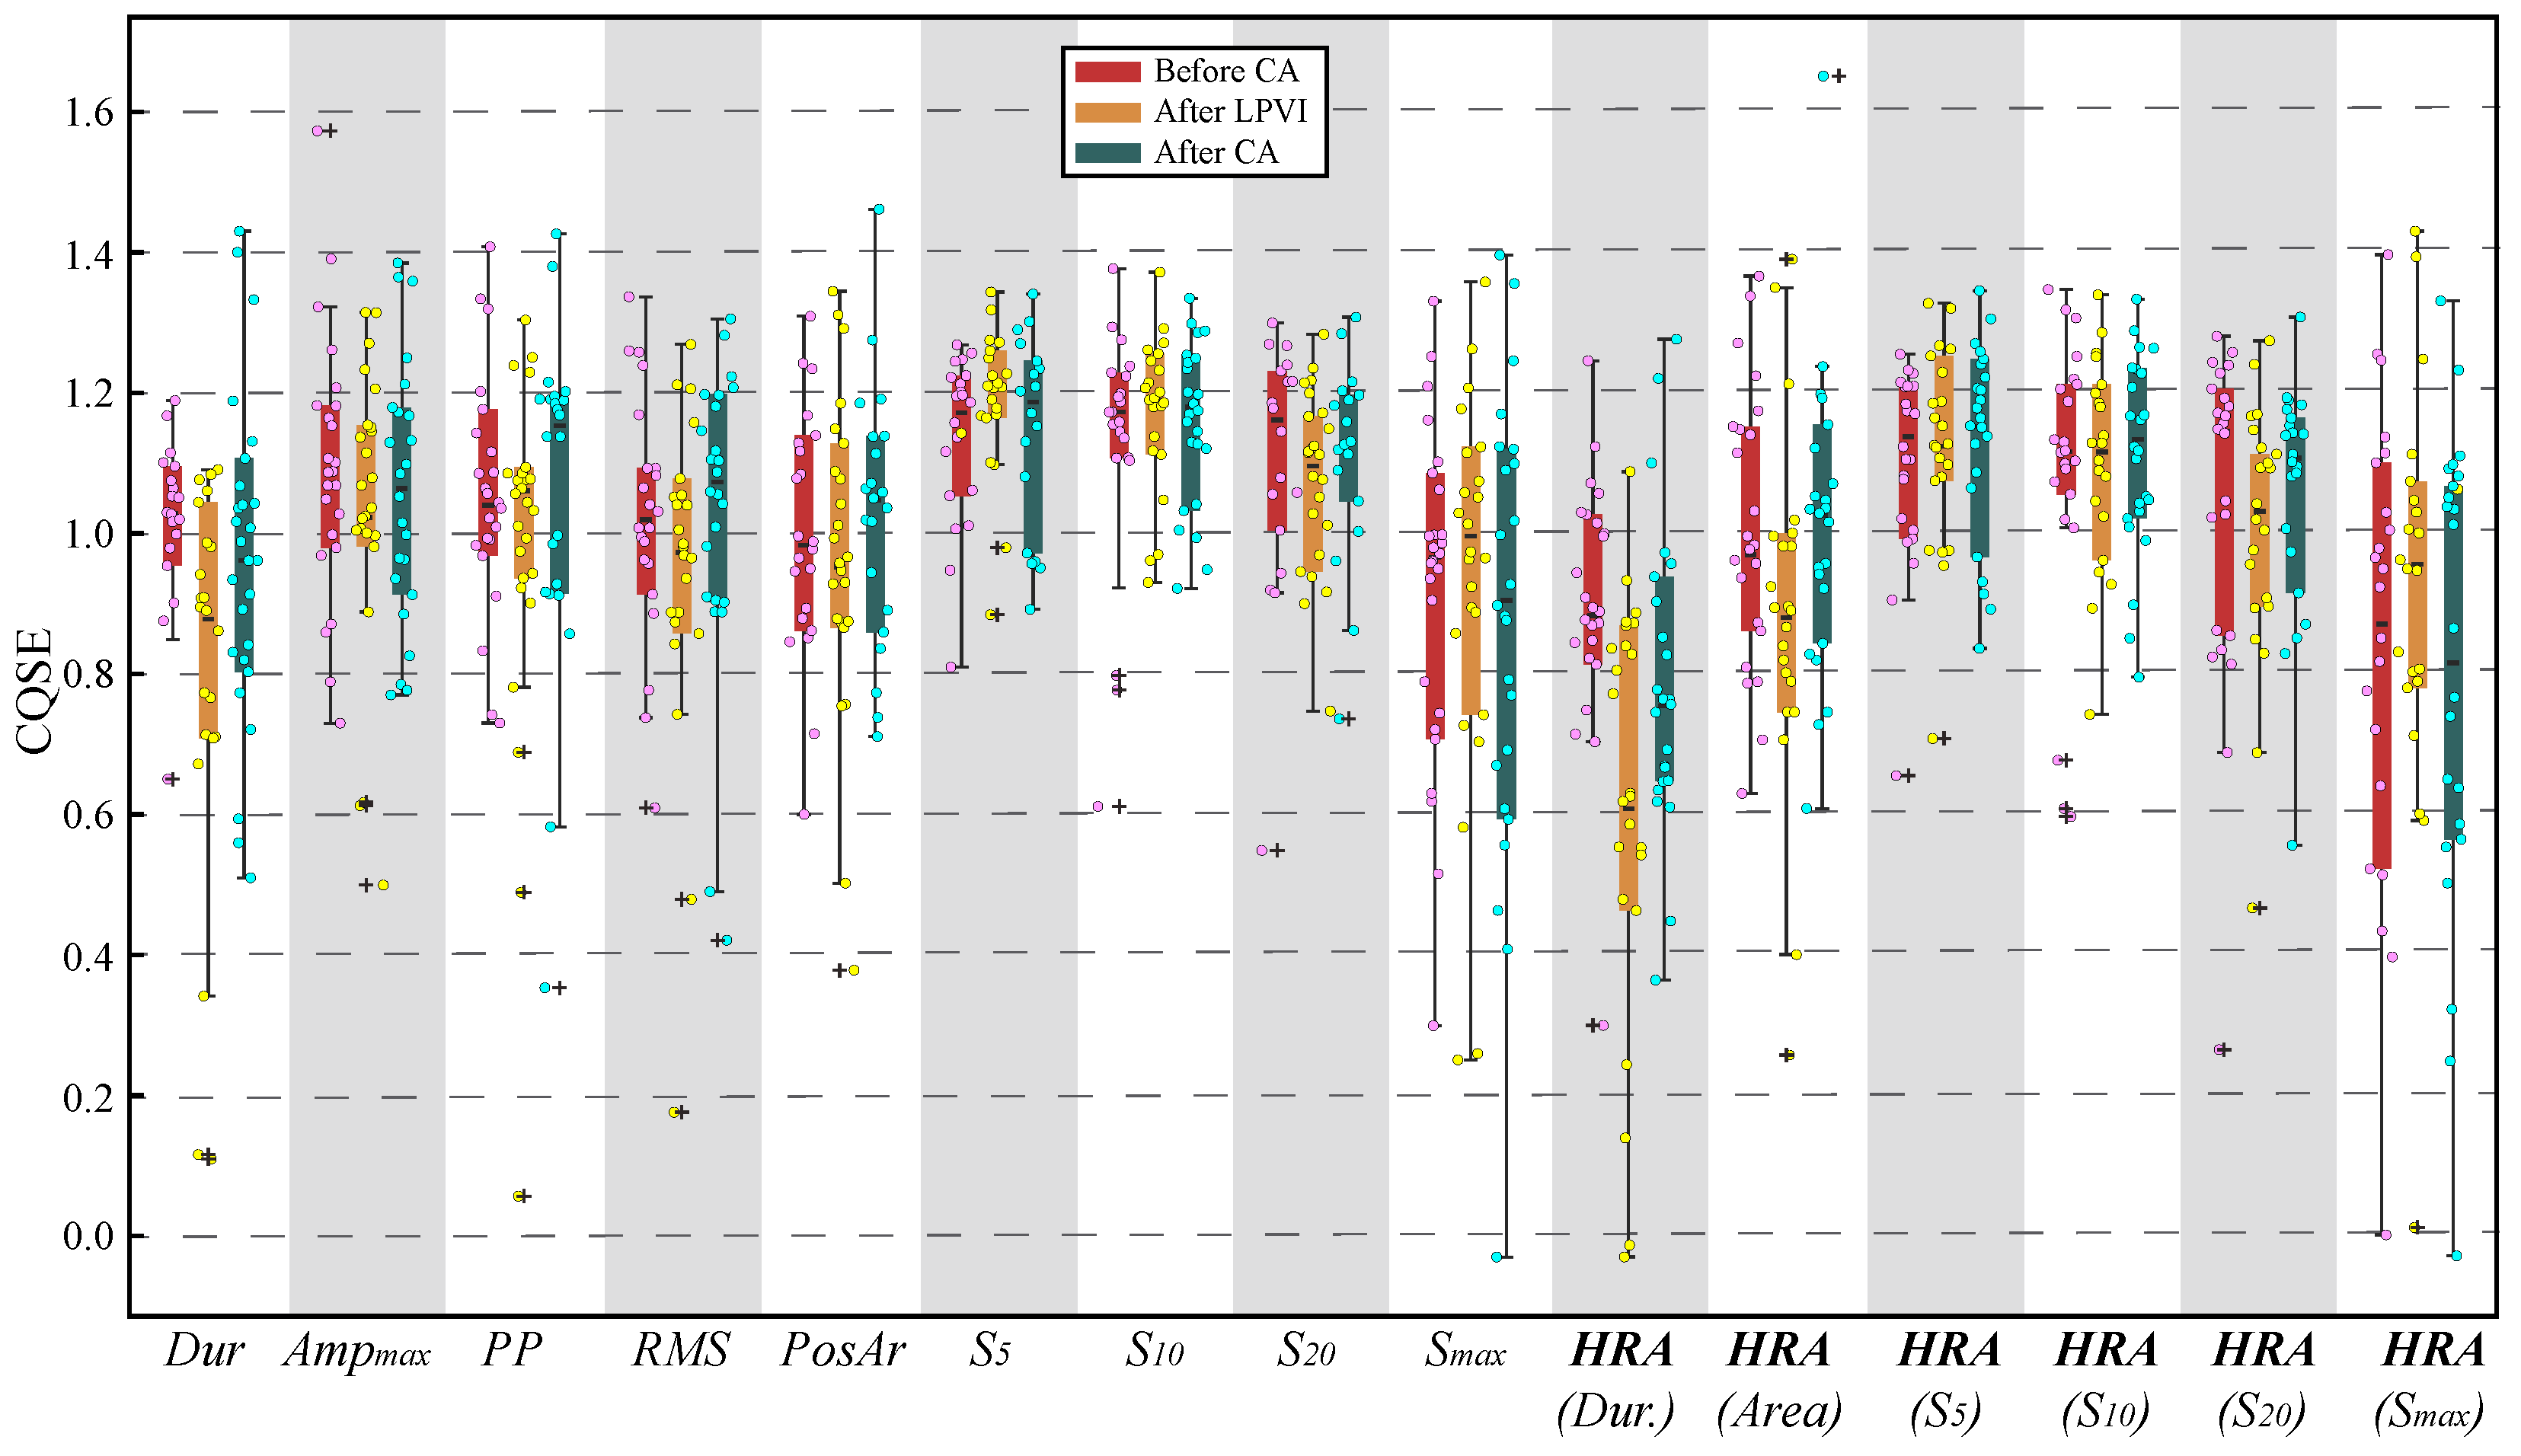
3.2. Nonlinear Analysis

The scatterplot of Figure 5 shows median CQSE values for all features of each recording. From the box and whiskers plot of the same figure, it can be seen that the median values are found in the range from about 0.6 to 1.2 , a fact that does not suggest strong nonlinear relationships between surface and invasive features. Unlike linear analysis, scaling for HR compensation did not improve the nonlinear relationships.

4. Discussion

Invasive EGM analysis is at the frontline of atrial substrate evaluation, assisting the detection of areas with structural remodeling [7,10]. During AF, these areas are specified as areas with a high dominant frequency and low-voltage EGMs or areas with highly complex EGMs, and various techniques have been developed to facilitate their detection as possible non-PV ablation targets [7,67,68]. During SR, the detection of areas sustaining the AF activity is achieved with the help of specific atrial sites that are used for pacing [10,14]. CS is the principal atrial site used for this purpose, allowing the detection of non-PV triggers spanning throughout the atria, while it has also been the object of non-PV CA, as it can trigger or sustain AF [14,16,22,23].
Considering the pivotal role of CS in AF perpetuation, as well as in AF mapping during CA procedures, more concrete knowledge on CS function and how it is affected by CA allows a different perspective on the atrial substrate modification due to the CA of AF. At the same time, given the popularity and effectiveness of P-waves and HRV in the atrial substrate modification analysis, correlating CS LAWs with P-waves acquired from ECGs allows a direct comparison with one of the most established methods in assessing the substrate modification. This was the original objective of the present study. For this purpose, recordings before, during, and after CA were acquired.
Before HRA, correlations found either between each P-wave and CS LAW or between lead II and CS recordings, when the correlation of CA-induced variations was assessed, were mainly loose and observed when Amplitude, Area, or Slope rate features were analyzed. Therefore, in SR, any attempt to observe the P-waves’ evolution through CS recordings or vice versa would lead to the loss of information. The effect of each CA step on P-waves and CS LAWs was not similar either. Nonlinear analysis also failed to detect any strong relationships between P-waves and CS LAWs. Despite the important role of CS in CA, the aforementioned findings suggest that it functions in a way that is different than that observed from the P-waves, which refer to the entire atria.
Although no significant correlations between P-wave and CS LAW features were detected, the present study led to an interesting revelation. Recordings after LPVI were acquired while RF energy was being emitted to PVs, possibly affecting the functionality of the atria. At the same time, RF energy was proven to affect the autonomous nervous system both during and after RFCA, in a different way [48,69,70]. During RF energy application, HR is decreased and HRV is increased. HRV incrementation implies a possible masking of the correlation in Duration between surface and invasive recordings, which should be unmasked after HRA. Indeed, although in all cases, HRA had a significant effect in the correlation of Duration, comparison after LPVI especially benefited from the application of HRA to the analyzed features. As CS is closer to the tissue under ablation, it is quite possible that HRV is more intense in CS recordings, being responsible for the low and negative correlations observed before HRA.
When assessing the correlation of the effect of each CA step between P-wave and CS LAW features, LPVI was once more the critical step that affected the variation of Duration in a more similar way. In our case, ARV was measured from time-domain HRV analysis on the atrial instead of ventricular activations of lead II and CS recordings in order to focus on the atrial rate and its fluctuations along the procedure. Unlike activation-based features, higher discrepancies between the ARV of surface and invasive recordings were observed after LPVI with respect to the remaining CA steps. This observation corroborates the theory of the different and probably more prominent effect of RF energy on CS function, manifested by the difference in ARV between the surface and invasive recordings during RF exposure and explains the significant role of HRA in potentiating the correlation of Duration. It should also be noted that although not highly correlated, the effect of CA on the Duration of P-wave and LAWs after HRA is similar. After the end of the procedure, ARV correlation between surface and invasive recordings notably increased. Previous studies reported temporary autonomous nervous system impairment as a consequence of RFCA manifested by decreased HRV [48,49]. This effect may also explain the high correlation of ARV features after the CA procedure in the present study.
As already mentioned, scaling in order to compensate for the HR variations had a major effect on linear analysis results regarding Area and Duration features. Moderate or moderate to high correlations were revealed for the latter, reaching up to 85.72 % of concordance regarding the effect of LPVI on P-wave and CS LAW HRA ( D u r a t i o n ) . These correlations were hidden by the variable HR observed across the recordings due to the effect of RF applications [61,71]. Although correlation levels between P-wave and CS LAW Duration even after scaling do not imply an absolute tuning, it would be impossible to appreciate the similarity degree without this adjustment. As P-wave Duration is probably one of the most highlighted atrial electrical characteristics recruited to assess atrial substrate modification [33,36,41,42,72], the unbiased processing of this feature is of high importance. Therefore, studies combining the analysis of surface and invasive recordings acquired during SR are highly suggested to apply scaling techniques in order to achieve more robust results.
In AF research, the correlation between surface and invasive recordings has been primarily performed in order to verify the reliability of noninvasive methods in describing or mapping the atrial substrate [73]. Nonetheless, some of them report interesting findings regarding the association between parameters from ECG recordings and invasive EGMs. During SR, correlations have been found between the Duration of lead II P-waves and right atrium (RA) LAWs on AF and sick sinus syndrome patients [74]. Nonlinear correlations between RA recordings and recordings from lead II or V1 have also been observed during AF [75]. Finally, the analysis of post-operative recordings of V1 channel and unipolar RA EGMs during AF showed high correlations on f-wave organization and amplitude [76].
Compared to the present study, an essential difference exists in the aforementioned works. The invasive part of the these studies employed recordings from various RA sites, where fibrosis can also be found, versus recordings acquired only from CS in the present study [77]. Given the position of CS between the left atrium (LA), where PVs are found, and the RA, which also contributes to the AF perpetuation, and additionally taking into account the previous works, we would accordingly expect a more direct and robust relationship between CS LAWs and P-waves, which in any case was weak, but not negligent.
A limitation of the present study, which could affect the weak CS LAWs’ and P-waves’ correlations, is the not very large dataset analyzed. A significantly wider database could reaffirm or, by contrast, vary the findings of the current study. In any case, electrical substrate modification involves multiple atrial sites, expressing atrial alteration in a cumulative way. Therefore, one possible explanation, other than the small dataset, is that substrate alteration is a collective process, and the correlation between P-waves and various atrial sites, one by one, would fail to show significant relationships. Another possible explanation is that specific atrial sites correlate to a higher degree with P-wave behavior, and CS is not one of them. In that case, correlation with more atrial sites should be investigated. Nevertheless, this is a complex procedure, as the catheter placed in the atria is constantly moving and continuous recordings from one site cannot be easily acquired.

5. Conclusions

The lack of very high linear or nonlinear correlations between surface P-waves and invasive CS LAWs may discourage the employment of CS analysis to assess CA-induced changes of atrial function, as well as the possibility to predict the effect of CA from CS LAWs’ analysis. However, a scaling technique to mitigate the effect of variable HR has notably potentiated the surface-invasive correlations, and its implementation is suggested in analyses comparing between the characteristics of surface and invasive recordings. For a more detailed and in-depth analysis, the processing of simultaneous recordings both from surface ECG leads and CS EGMs is also encouraged.

Author Contributions

Conceptualisation, A.V., R.A. and J.J.R.; methodology, A.V., R.A. and J.J.R.; software, A.V.; validation, A.V., J.M.-A., J.M.G.-B., F.H., R.A. and J.J.R.; resources, J.M.-A., J.M.G.-B., F.H. and J.J.R.; data curation, A.V., J.M.-A., J.M.G.-B. and F.H.; writing—original draft preparation, A.V.; writing—review and editing, A.V., J.M.-A., J.M.G.-B., F.H., R.A. and J.J.R.; All authors have read and agreed to the published version of the manuscript.

Funding

This research received partial financial support from public grants DPI2017-83952-C3, PID2021-00X128525-IV0, PID2021-123804OB-I00. And TED2021-129996B-I00 of the Spanish Government 10.13039/501100011033 jointly with the European Regional Development Fund (EU), SBPLY/17/180501/000411 from Junta de Comunidades de Castilla-La Mancha. And AICO/2021/286 from Generalitat Valenciana.

Institutional Review Board Statement

The study was conducted according to the guidelines of the Declaration of Helsinki, complied with Law 14/2007, of 3 July, on Biomedical Research and other Spanish regulations. and was approved by the Ethical Review Board of the University Hospital of San Juan (San Juan de Alicante, Alicante, Spain) with protocol code 21/046.

Informed Consent Statement

Written informed consent was granted by all the subjects participating in the present research. All acquired data were anonymised before processing.

Data Availability Statement

The data supporting the reported results and presented in this study are available upon request from the corresponding author.

Conflicts of Interest

The authors have no association with commercial entities that could be viewed as having an interest in the general area of the submitted manuscript. The funders had no role in the design of the study; in the collection, analyses, or interpretation of the data; in the writing of the manuscript; nor in the decision to publish the results.

References

  1. Virani, S.S.; Alonso, A.; Benjamin, E.J.; Bittencourt, M.S.; Callaway, C.W.; Carson, A.P.; Chamberlain, A.M.; Chang, A.R.; Cheng, S.; Delling, F.N.; et al. Heart Disease and Stroke Statistics-2020 Update: A Report From the American Heart Association. Circulation 2020, 141, e139–e596. [Google Scholar] [CrossRef] [PubMed]
  2. Hindricks, G.; Potpara, T.; Dagres, N.; Arbelo, E.; Bax, J.J.; Blomstro, C.; Boriani, G.; Castella, M.; Dan, G.A.; Dilaveris, P.E.; et al. 2020 ESC Guidelines for the diagnosis and management of atrial fibrillation developed in collaboration with the European Association of Cardio-Thoracic Surgery (EACTS). Eur. Heart J. 2020, 42, 374–498. [Google Scholar] [CrossRef]
  3. Haissaguerre, M.; Jaïs, P.; Shah, D.C.; Takahashi, A.; Hocini, M.; Quiniou, G.; Garrigue, S.; Le Mouroux, A.; Le Métayer, P.; Clémenty, J. Spontaneous initiation of atrial fibrillation by ectopic beats originating in the pulmonary veins. N. Engl. J. Med. 1998, 339, 659–666. [Google Scholar] [CrossRef] [PubMed] [Green Version]
  4. Shah, D.; Haïssaguerre, M.; Jaïs, P. Catheter Ablation of Pulmonary Vein Foci for Atrial Fibrillation. Thorac. Cardiovasc. Surg. 1999, 47, 352–356. [Google Scholar] [CrossRef] [PubMed]
  5. Oral, H.; Knight, B.; Tada, H. Pulmonary vein isolation for paroxysmal and persistent atrial fibrillation. ACC Curr. J. Rev. 2002, 11, 83. [Google Scholar] [CrossRef]
  6. Cheng, W.H.; Lo, L.W.; Lin, Y.J.; Chang, S.L.; Hu, Y.F.; Hung, Y.; Chung, F.P.; Liao, J.N.; Tuan, T.C.; Chao, T.F.; et al. Ten-year ablation outcomes of patients with paroxysmal atrial fibrillation undergoing pulmonary vein isolation. Heart Rhythm 2019, 16, 1327–1333. [Google Scholar] [CrossRef]
  7. Lau, D.H.; Linz, D.; Schotten, U.; Mahajan, R.; Sanders, P.; Kalman, J.M. Pathophysiology of Paroxysmal and Persistent Atrial Fibrillation: Rotors, Foci and Fibrosis. Heart Lung Circ. 2017, 26, 887–893. [Google Scholar] [CrossRef]
  8. Thomas, L.; Abhayaratna, W.P. Left Atrial Reverse Remodeling: Mechanisms, Evaluation, and Clinical Significance. JACC Cardiovasc. Imaging 2017, 10, 65–77. [Google Scholar] [CrossRef]
  9. Knecht, S.; Pradella, M.; Reichlin, T.; Mühl, A.; Bossard, M.; Stieltjes, B.; Conen, D.; Bremerich, J.; Osswald, S.; Kühne, M.; et al. Left atrial anatomy, atrial fibrillation burden, and P-wave duration-relationships and predictors for single-procedure success after pulmonary vein isolation. EP Eur. 2018, 20, 271–278. [Google Scholar] [CrossRef]
  10. Maille, B.; Das, M.; Hussein, A.; Shaw, M.; Chaturvedi, V.; Williams, E.; Morgan, M.; Ronayne, C.; Snowdon, R.L.; Gupta, D. Reverse electrical and structural remodelling of the left atrium occurs early after pulmonary vein isolation for persistent atrial fibrillation. J. Interv. Card. Electrophysiol. 2020, 58, 9–19. [Google Scholar] [CrossRef]
  11. Wen, S.; Indrabhinduwat, M.; Brady, P.A.; Pislaru, C.; Miller, F.A.; Ammash, N.M.; Nkomo, V.T.; Padang, R.; Pislaru, S.V.; Lin, G. Post Procedural Peak Left Atrial Contraction Strain Predicts Recurrence of Arrhythmia after Catheter Ablation of Atrial Fibrillation. Cardiovasc. Ultrasound 2021, 19, 22. [Google Scholar] [CrossRef] [PubMed]
  12. Liu, H.T.; Lee, H.L.; Wo, H.T.; Chang, P.C.; Wen, M.S.; Lin, F.C.; Yeh, S.J.; Chou, C.C. P wave duration ≥ 150 ms predicts poor left atrial function and ablation outcomes in non-paroxysmal atrial fibrillation. J. Electrocardiol. 2021, 69, 124–131. [Google Scholar] [CrossRef] [PubMed]
  13. Vraka, A.; Bertomeu-González, V.; Fácila, L.; Moreno-Arribas, J.; Alcaraz, R.; Rieta, J.J. The Dissimilar Impact in Atrial Substrate Modificationof Left and Right Pulmonary Veins Isolation after Catheter Ablation of Paroxysmal Atrial Fibrillation. J. Pers. Med. 2022, 12, 462. [Google Scholar] [CrossRef] [PubMed]
  14. Santangeli, P.; Marchlinski, F.E. Techniques for the provocation, localization, and ablation of non–pulmonary vein triggers for atrial fibrillation. Heart Rhythm 2017, 14, 1087–1096. [Google Scholar] [CrossRef] [Green Version]
  15. Young, M.L.; Niu, J. Using coronary sinus ostium as the reference for the slow pathway ablation of atrioventricular nodal reentrant tachycardia in children. J. Arrhythmia 2020, 36, 712–719. [Google Scholar] [CrossRef]
  16. Antz, M.; Otomo, K.; Arruda, M.; Scherlag, B.J.; Pitha, J.; Tondo, C.; Lazzara, R.; Jackman, W.M. Electrical conduction between the right atrium and the left atrium via the musculature of the coronary sinus. Circulation 1998, 98, 1790–1795. [Google Scholar] [CrossRef] [Green Version]
  17. Tritto, M.; Zardini, M.; De Ponti, R.; Salerno-Uriarte, J.A. Iterative atrial tachycardia originating from the coronary sinus musculature. J. Cardiovasc. Electrophysiol. 2001, 12, 1187–1189. [Google Scholar] [CrossRef]
  18. Giudici, M.; Winston, S.; Kappler, J.; Shinn, T.; Singer, I.; Scheiner, A.; Berrier, H.; Herner, M.; Sample, R. Mapping the coronary sinus and great cardiac vein. PACE 2002, 25, 414–419. [Google Scholar] [CrossRef]
  19. Ahmed, N.; Perveen, S.; Mehmood, A.; Rani, G.F.; Molon, G. Coronary Sinus Ablation Is a Key Player Substrate in Recurrence of Persistent Atrial Fibrillation. Cardiology 2019, 143, 107–113. [Google Scholar] [CrossRef]
  20. Razeghian-Jahromi, I.; Natale, A.; Nikoo, M.H. Coronary sinus diverticulum: Importance, function, and treatment. PACE 2020, 43, 1582–1587. [Google Scholar] [CrossRef]
  21. Morita, H.; Zipes, D.P.; Morita, S.T.; Wu, J. The role of coronary sinus musculature in the induction of atrial fibrillation. Heart Rhythm 2012, 9, 581–589. [Google Scholar] [CrossRef] [PubMed]
  22. Oral, H.; Ozaydin, M.; Chugh, A.; Scharf, C.; Tada, H.; Hall, B.; Cheung, P.; Pelosi, F.; Knight, B.P.; Morady, F. Role of the coronary sinus in maintenance of atrial fibrillation. J. Cardiovasc. Electrophysiol. 2003, 14, 1329–1336. [Google Scholar] [CrossRef] [PubMed] [Green Version]
  23. Haïssaguerre, M.; Hocini, M.; Takahashi, Y.; O’Neill, M.D.; Pernat, A.; Sanders, P.; Jonsson, A.; Rotter, M.; Sacher, F.; Rostock, T.; et al. Impact of catheter ablation of the coronary sinus on paroxysmal or persistent atrial fibrillation. J. Cardiovasc. Electrophysiol. 2007, 18, 378–386. [Google Scholar] [CrossRef] [PubMed]
  24. Yoshida, K.; Ulfarsson, M.; Tada, H.; Chugh, A.; Good, E.; Kuhne, M.; Crawford, T.; Sarrazin, J.F.; Chalfoun, N.; Wells, D.; et al. Complex electrograms within the coronary sinus: Time- and frequency-domain characteristics, effects of antral pulmonary vein isolation, and relationship to clinical outcome in patients with paroxysmal and persistent atrial fibrillation. J. Cardiovasc. Electrophysiol. 2008, 19, 1017–1023. [Google Scholar] [CrossRef] [Green Version]
  25. Marco, L.Y.D.; Raine, D.; Bourke, J.P.; Langley, P. Characteristics of atrial fibrillation cycle length predict restoration of sinus rhythm by catheter ablation. Heart Rhythm 2013, 10, 1303–1310. [Google Scholar] [CrossRef]
  26. Yin, X.; Zhao, Z.; Gao, L.; Chang, D.; Xiao, X.; Zhang, R.; Chen, Q.; Cheng, J.; Yang, Y.; Xi, Y.; et al. Frequency Gradient Within Coronary Sinus Predicts the Long-Term Outcome of Persistent Atrial Fibrillation Catheter Ablation. J. Am. Heart Assoc. 2017, 6, e004869. [Google Scholar] [CrossRef] [Green Version]
  27. Yoshida, K.; Chugh, A.; Good, E.; Crawford, T.; Myles, J.; Veerareddy, S.; Billakanty, S.; Wong, W.S.; Ebinger, M.; Pelosi, F.; et al. A critical decrease in dominant frequency and clinical outcome after catheter ablation of persistent atrial fibrillation. Heart Rhythm 2010, 7, 295–302. [Google Scholar] [CrossRef]
  28. Teh, A.W.; Kalman, J.M.; Kistler, P.M.; Lee, G.; Sutherland, F.; Morton, J.B.; Vohra, J.K.; Sparks, P.B. Prevalence of fractionated electrograms in the coronary sinus: Comparison between patients with persistent or paroxysmal atrial fibrillation and a control population. Heart Rhythm 2010, 7, 1200–1204. [Google Scholar] [CrossRef]
  29. Kanemaru, Y.; Arima, Y.; Kaikita, K.; Kiyama, T.; Kaneko, S.; Ito, M.; Yamabe, H.; Motozato, K.; Yamanaga, K.; Fujisue, K.; et al. Elongation of the high right atrium to coronary sinus conduction time predicts the recurrence of atrial fibrillation after radiofrequency catheter ablation. Int. J. Cardiol. 2020, 300, 147–153. [Google Scholar] [CrossRef] [Green Version]
  30. Boles, U.; Gul, E.E.; Enriquez, A.; Starr, N.; Haseeb, S.; Abdollah, H.; Simpson, C.; Baranchuk, A.; Redfearn, D.; Michael, K.; et al. Coronary Sinus Electrograms May Predict New-onset Atrial Fibrillation After Typical Atrial Flutter Radiofrequency Ablation (CSE-AF). J. Atr. Fibrillation 2018, 11, 1809. [Google Scholar] [CrossRef]
  31. McGuinness, S.; McKee, A.; Sidebotham, D. Chapter 8—Monitoring. In Cardiothoracic Critical Care; Butterworth-Heinemann: Oxford, UK, 2007; pp. 120–137. [Google Scholar] [CrossRef]
  32. Stafford, P.J.; Vincent, R. Spectrotemporal and spectral turbulence analysis of the signal-averaged P wave in paroxysmal atrial fibrillation. J. Electrocardiol. 1997, 30, 79–86. [Google Scholar] [CrossRef]
  33. Van Beeumen, K.; Houben, R.; Tavernier, R.; Ketels, S.; Duytschaever, M. Changes in P-wave area and P-wave duration after circumferential pulmonary vein isolation. EP Eur. 2010, 12, 798–804. [Google Scholar] [CrossRef] [PubMed]
  34. Vassilikos, V.; Dakos, G.; Chatzizisis, Y.S.; Chouvarda, I.; Karvounis, C.; Maynard, C.; Maglaveras, N.; Paraskevaidis, S.; Stavropoulos, G.; Styliadis, C.I.; et al. Novel non-invasive P wave analysis for the prediction of paroxysmal atrial fibrillation recurrences in patients without structural heart disease: A prospective pilot study. Int. J. Cardiol. 2011, 153, 165–172. [Google Scholar] [CrossRef]
  35. Salah, A.; Zhou, S.; Liu, Q.; Yan, H. P wave indices to predict atrial fibrillation recurrences post pulmonary vein isolation. Arq. Bras. Cardiol. 2013, 101, 519–527. [Google Scholar] [CrossRef]
  36. Maan, A.; Mansour, M.; Ruskin, J.N.; Heist, E.K. Impact of catheter ablation on P-wave parameters on 12-lead electrocardiogram in patients with atrial fibrillation. J. Electrocardiol. 2014, 47, 725–733. [Google Scholar] [CrossRef]
  37. Alcaraz, R.; Martínez, A.; Rieta, J.J. The P Wave Time-Frequency Variability Reflects Atrial Conduction Defects before Paroxysmal Atrial Fibrillation. Ann. Noninvasive Electrocardiol. 2015, 20, 433–445. [Google Scholar] [CrossRef] [PubMed]
  38. Kizilirmak, F.; Demir, G.G.; Gokdeniz, T.; Gunes, H.M.; Cakal, B.; Guler, E.; Karaca, I.O.; Omaygenç, M.O.; Yılmaz, F.; Olgun, F.E.; et al. Changes in Electrocardiographic P Wave Parameters after Cryoballoon Ablation and Their Association with Atrial Fibrillation Recurrence. Ann. Noninvasive Electrocardiol. 2016, 21, 580–587. [Google Scholar] [CrossRef]
  39. Ortigosa, N.; Ayala, G.; Cano, Ó. Variation of P-wave indices in paroxysmal atrial fibrillation patients before and after catheter ablation. Biomed. Signal Process. Control 2021, 66, 102500. [Google Scholar] [CrossRef]
  40. Simpson, R.J.; Foster, J.R.; Gettes, L.S. Atrial excitability and conduction in patients with interatrial conduction defects. Am. J. Cardiol. 1982, 50, 1331–1337. [Google Scholar] [CrossRef]
  41. Chen, Q.; Mohanty, S.; Trivedi, C.; Gianni, C.; Della Rocca, D.G.; Canpolat, U.; Burkhardt, J.D.; Sanchez, J.E.; Hranitzky, P.; Gallinghouse, G.J.; et al. Association between prolonged P wave duration and left atrial scarring in patients with paroxysmal atrial fibrillation. J. Cardiovasc. Electrophysiol. 2019, 30, 1811–1818. [Google Scholar] [CrossRef]
  42. Pranata, R.; Yonas, E.; Vania, R. Prolonged P-wave duration in sinus rhythm pre-ablation is associated with atrial fibrillation recurrence after pulmonary vein isolation-A systematic review and meta-analysis. Ann. Noninvasive Electrocardiol. 2019, 24, e12653. [Google Scholar] [CrossRef] [PubMed] [Green Version]
  43. Vraka, A.; Bertomeu-González, V.; Hornero, F.; Quesada, A.; Alcaraz, R.; Rieta, J.J. Splitting the P-Wave: Improved Evaluation of Left Atrial Substrate Modification after Pulmonary Vein Isolation of Paroxysmal Atrial Fibrillation. Sensors 2022, 22, 290. [Google Scholar] [CrossRef] [PubMed]
  44. Task Force of the European Society of Cardiology the North American Society of Pacing Electrophysiology. Heart rate variability. Standards of measurement, physiological interpretation, and clinical use. Eur. Heart J. 1996, 17, 354–381. [Google Scholar] [CrossRef] [Green Version]
  45. Perkiömäki, J.; Ukkola, O.; Kiviniemi, A.; Tulppo, M.; Ylitalo, A.; Kesäniemi, Y.A.; Huikuri, H. Heart rate variability findings as a predictor of atrial fibrillation in middle-aged population. J. Cardiovasc. Electrophysiol. 2014, 25, 719–724. [Google Scholar] [CrossRef] [PubMed]
  46. Habibi, M.; Chahal, H.; Greenland, P.; Guallar, E.; Lima, J.A.C.; Soliman, E.Z.; Alonso, A.; Heckbert, S.R.; Nazarian, S. Resting Heart Rate, Short-Term Heart Rate Variability and Incident Atrial Fibrillation (from the Multi-Ethnic Study of Atherosclerosis (MESA)). Am. J. Cardiol. 2019, 124, 1684–1689. [Google Scholar] [CrossRef]
  47. Huikuri, H.V.; Mäkikallio, T.H.; Perkiömäki, J. Measurement of heart rate variability by methods based on nonlinear dynamics. J. Electrocardiol. 2003, 36 (Suppl. 1), 95–99. [Google Scholar] [CrossRef]
  48. Hsieh, M.H.; Chiou, C.W.; Wen, Z.C.; Wu, C.H.; Tai, C.T.; Tsai, C.F.; Ding, Y.A.; Chang, M.S.; Chen, S.A. Alterations of heart rate variability after radiofrequency catheter ablation of focal atrial fibrillation originating from pulmonary veins. Circulation 1999, 100, 2237–2243. [Google Scholar] [CrossRef]
  49. Zhu, Z.; Wang, W.; Cheng, Y.; Wang, X.; Sun, J. The predictive value of heart rate variability indices tested in early period after radiofrequency catheter ablation for the recurrence of atrial fibrillation. J. Cardiovasc. Electrophysiol. 2020, 31, 1350–1355. [Google Scholar] [CrossRef] [PubMed]
  50. Călburean, P.A.; Osorio, T.G.; Sorgente, A.; Almorad, A.; Pannone, L.; Monaco, C.; Miraglia, V.; Al Housari, M.; Mojica, J.; Bala, G.; et al. High vagal tone predicts pulmonary vein reconnection after cryoballoon ablation for paroxysmal atrial fibrillation. PACE 2021, 44, 2075–2083. [Google Scholar] [CrossRef]
  51. Sörnmo, L.; Laguna, P. Electrocardiogram (ECG) Signal Processing. In Wiley Encyclopedia of Biomedical Engineering; John Wiley and Sons: Hoboken, NJ, USA, 2006; Volume 2, pp. 1298–1313. [Google Scholar] [CrossRef]
  52. García, M.; Martínez-Iniesta, M.; Ródenas, J.; Rieta, J.J.; Alcaraz, R. A novel wavelet-based filtering strategy to remove powerline interference from electrocardiograms with atrial fibrillation. Physiol. Meas. 2018, 39, 115006. [Google Scholar] [CrossRef]
  53. Martínez, A.; Alcaraz, R.; Rieta, J.J. Detection and removal of ventricular ectopic beats in atrial fibrillation recordings via principal component analysis. In Proceedings of the 2011 Annual International Conference of the IEEE Engineering in Medicine and Biology Society, Boston, MA, USA, 30 August–3 September 2011; pp. 4693–4696. [Google Scholar] [CrossRef]
  54. Choi, A.; Shin, H. Quantitative Analysis of the Effect of an Ectopic Beat on the Heart Rate Variability in the Resting Condition. Front. Physiol. 2018, 9, 922. [Google Scholar] [CrossRef]
  55. Martinez, A.; Alcaraz, R.; Rieta, J.J. A new method for automatic delineation of ECG fiducial points based on the Phasor Transform. In Proceedings of the 2010 Annual International Conference of the IEEE Engineering in Medicine and Biology, Buenos Aires, Argentina, 31 August–4 September 2010; pp. 4586–4589. [Google Scholar] [CrossRef]
  56. González, F.; Alcaraz, R.; Rieta, J.J. Electrocardiographic P-wave delineation based on adaptive slope Gaussian detection. In Proceedings of the 2017 Computing in Cardiology (CinC), Rennes, France, 24–27 September 2017; pp. 1–4. [Google Scholar] [CrossRef]
  57. Alcaraz, R.; Rieta, J.J. Adaptive singular value cancelation of ventricular activity in single-lead atrial fibrillation electrocardiograms. Physiol. Meas. 2008, 29, 1351–1369. [Google Scholar] [CrossRef]
  58. Martínez-Iniesta, M.; Ródenas, J.; Rieta, J.J.; Alcaraz, R. The stationary wavelet transform as an efficient reductor of powerline interference for atrial bipolar electrograms in cardiac electrophysiology. Physiol. Meas. 2019, 40, 075003. [Google Scholar] [CrossRef]
  59. Osorio, D.; Alcaraz, R.; Rieta, J.J. A fractionation-based local activation wave detector for atrial electrograms of atrial fibrillation. In Proceedings of the 2017 Computing in Cardiology (CinC), Rennes, France, 24–27 September 2017; pp. 1–4. [Google Scholar] [CrossRef]
  60. Vraka, A.; Bertomeu-González, V.; Osca, J.; Ravelli, F.; Alcaraz, R.; Rieta, J.J. Study on How Catheter Ablation Affects Atrial Structures in Patients with Paroxysmal Atrial Fibrillation: The Case of the Coronary Sinus. In Proceedings of the 2020 International Conference on e-Health and Bioengineering (EHB), Iasi, Romania, 29–30 October 2020; pp. 1–4. [Google Scholar] [CrossRef]
  61. Toman, O.; Hnatkova, K.; Smetana, P.; Huster, K.M.; Šišáková, M.; Barthel, P.; Novotný, T.; Schmidt, G.; Malik, M. Physiologic heart rate dependency of the PQ interval and its sex differences. Sci. Rep. 2020, 10, 2551. [Google Scholar] [CrossRef]
  62. Shapiro, S.S.; Wilk, M.B. An Analysis of Variance Test for Normality (Complete Samples); Oxford University Press: Oxford, UK, 1965; Volume 52, pp. 591–611. [Google Scholar]
  63. Yan, X.; Su, X.G. Simple Linear Regression. In Linear Regression Analysis: Theory and Computing; World Scientific: Singapore, 2009; pp. 9–39. [Google Scholar] [CrossRef]
  64. Pincus, S.M. Irregularity and asynchrony in biologic network signals. In Numerical Computer Methods, Part C; Academic Press: Cambridge, MA, USA, 2000; Volume 321, pp. 149–182. [Google Scholar] [CrossRef]
  65. Alcaraz, R.; Rieta, J.J. Nonlinear synchronization assessment between atrial and ventricular activations series from the surface ECG in atrial fibrillation. Biomed. Signal Process. Control 2013, 8, 1000–1007. [Google Scholar] [CrossRef]
  66. Lake, D.E.; Moorman, J.R. Accurate estimation of entropy in very short physiological time series: The problem of atrial fibrillation detection in implanted ventricular devices. Am. J. Physiol. 2011, 300, H319–H325. [Google Scholar] [CrossRef]
  67. Vraka, A.; Hornero, F.; Bertomeu-González, V.; Osca, J.; Alcaraz, R.; Rieta, J.J. Short-Time Estimation of Fractionation in Atrial Fibrillation with Coarse-Grained Correlation Dimension for Mapping the Atrial Substrate. Entropy 2020, 22, 232. [Google Scholar] [CrossRef] [Green Version]
  68. de Groot, N.; Shah, D.; Boyle, P.M.; Anter, E.; Clifford, G.D.; Deisenhofer, I.; Deneke, T.; van Dessel, P.; Doessel, O.; Dilaveris, P.; et al. Critical appraisal of technologies to assess electrical activity during atrial fibrillation: A position paper from the European Heart Rhythm Association and European Society of Cardiology Working Group on eCardiology in collaboration with the Heart Rhythm Society, Asia Pacific Heart Rhythm Society, Latin American Heart Rhythm Society and Computing in Cardiology. EP Eur. 2021, 24, 313–330. [Google Scholar] [CrossRef]
  69. Misek, J.; Belyaev, I.; Jakusova, V.; Tonhajzerova, I.; Barabas, J.; Jakus, J. Heart rate variability affected by radiofrequency electromagnetic field in adolescent students. Bioelectromagnetics 2018, 39, 277–288. [Google Scholar] [CrossRef]
  70. Misek, J.; Veternik, M.; Tonhajzerova, I.; Jakusova, V.; Janousek, L.; Jakus, J. Radiofrequency Electromagnetic Field Affects Heart Rate Variability in Rabbits. Physiol. Res. 2020, 69, 633–643. [Google Scholar] [CrossRef]
  71. Chen, P.S.; Chen, L.S.; Fishbein, M.C.; Lin, S.F.; Nattel, S. Role of the autonomic nervous system in atrial fibrillation: Pathophysiology and therapy. Circ. Res. 2014, 114, 1500–1515. [Google Scholar] [CrossRef] [Green Version]
  72. Martínez, A.; Alcaraz, R.; Rieta, J.J. Study on the P-wave feature time course as early predictors of paroxysmal atrial fibrillation. Physiol. Meas. 2012, 33, 1959–1974. [Google Scholar] [CrossRef]
  73. Rodrigo, M.; Climent, A.M.; Hernández-Romero, I.; Liberos, A.; Baykaner, T.; Rogers, A.J.; Alhusseini, M.; Wang, P.J.; Fernández-Avilés, F.; Guillem, M.S.; et al. Noninvasive Assessment of Complexity of Atrial Fibrillation: Correlation With Contact Mapping and Impact of Ablation. Circ. Arrhythmia Electrophysiol. 2020, 13, e007700. [Google Scholar] [CrossRef]
  74. Liu, Z.; Hayano, M.; Hirata, T.; Tsukahara, K.; Quin, Y.; Nakao, K.; Nonaka, M.; Ishimatsu, T.; Ueyama, C.; Yano, K. Abnormalities of electrocardiographic P wave morphology and their relation to electrophysiological parameters of the atrium in patients with sick sinus syndrome. PACE 1998, 21, 79–86. [Google Scholar] [CrossRef] [PubMed]
  75. Yahyazadeh, S.; Firoozabadi, S.; Haghjoo, M.; Parvaneh, S. Quantitative relation between chaotic features of surface electrocardiogram and Intracardiac Electrogram. In Proceedings of the 2010 Computing in Cardiology, Belfast, UK, 26–29 September 2010; pp. 593–596. [Google Scholar]
  76. Alcaraz, R.; Hornero, F.; Rieta, J.J. Validation of surface atrial fibrillation organization indicators through invasive recordings. In Proceedings of the 2011 Annual International Conference of the IEEE Engineering in Medicine and Biology Society, Boston, MA, USA, 30 August–3 September 2011; pp. 5519–5522. [Google Scholar] [CrossRef]
  77. Kharbanda, R.; Knops, P.; van der Does, L.; Kik, C.; Taverne, Y.; Roos-Serote, M.; Heida, A.; Oei, F.; Bogers, A.; de Groot, N. Simultaneous Endo-Epicardial Mapping of the Human Right Atrium: Unraveling Atrial Excitation. J. Am. Heart Assoc. 2020, 9, e017069. [Google Scholar] [CrossRef]
Figure 1. (a) Representation of how correlations between features of each P-wave (a1) and CS LAW (a2) of one patient are computed. (b) CV of the same patient, example shown for Duration, for recordings before and after CA. Variation due to CA in Duration is calculated for surface (left) and invasive (right) recordings. Correlation between the surface and invasive variations is then calculated across the entire patient cohort. CS: coronary sinus; LAW: local activation wave; CV: correlation of variation; CA: catheter ablation.
Jcdd 09 00176 g001
Figure 2. Example of how HRA affects the correlation of the computed features. (a) Time instance of 50 activations for the correlation of Duration, unprocessed (top) and after HRA (bottom). (b) Linear regression of the same recording before (left) and after (right) HRA. Linear correlation increased from R 2 = 0.03 to R 2 = 0.54 . HRA: heart-rate adjustment.
Jcdd 09 00176 g002
Figure 3. Pearson correlation between surface and invasive features of each activation, measured before CA (red), after LPVI or during CA (green), and after the end of the CA procedure (blue). Statistically significant results are marked with an asterisk (∗).
Jcdd 09 00176 g003
Figure 4. Pearson correlation between surface and invasive features for the variation measured between the recordings before CA and after LPVI (red), before the beginning and after the end of the CA procedure (orange), and after LPVI and after the end of the CA procedure (green). Statistically significant results are marked with asterisk (∗).
Jcdd 09 00176 g004
Figure 5. Combined box and whiskers plot with scatterplot for CQSE between surface and invasive features before (left), after LPVI (centre), and after full CA (right). Dur: Duration.
Jcdd 09 00176 g005
Table 1. Correlations (%) and p values for Pearson analysis between surface and invasive features for each and every activation. Statistically significant results are shown in bold. LPVI: left pulmonary vein isolation; PP: peak-to-peak amplitude; RMS: root mean square; Si: Slope rate at i% of Duration.
CorrpreCorrLPVICorrpost
Featureρ [%]p Valueρ [%]p Valueρ [%]p Value
Duration 2.19 0.1291 3.08 0.1040 4.53 0.2221
A m p m a x 3.87 0.0001 18.05 0.0001 3.92 0.0001
PP 1.98 0.0090 15.19 0.0033 7.26 0.0016
RMS 0.38 0.0019 18.36 0.0017 5.46 0.0142
PosAr 3.30 0.0032 16.18 0.0015 0.99 0.0142
S 5 0.76 0.4283 3.93 0.1863 2.59 0.2170
S 10 1.47 0.2359 4.15 0.3062 2.82 0.2923
S 20 2.38 0.0839 0.97 0.3927 0.64 0.1426
S m a x 7.05 0.0066 0.71 0.0114 5.96 0.1300
HRA ( D u r a t i o n ) 45.25 < 0.0001 69.91 < 0.0001 43.82 < 0.0001
HRA ( P o s A r ) 10.00 0.0142 35.40 < 0.0001 10.66 0.0425
HRA ( S 5 ) 0.70 0.2707 4.84 0.0703 2.55 0.2249
HRA ( S 10 ) 5.71 0.2337 5.68 0.1593 0.13 0.1738
HRA ( S 20 ) 2.78 0.1431 0.60 0.0843 0.44 0.1187
HRA ( S m a x ) 8.09 < 0.0001 8.65 0.0091 5.21 0.1623
Table 2. Linear regression analysis results between surface and invasive features for each and every activation. Statistically significant results are shown in bold.
Pre-CALPVIPost-CA
FeatureR2-adj [%]p ValueR2-adj [%]p ValueR2-adj [%]p Value
Duration 0.56 0.1291 0.69 0.1040 0.22 0.2221
A m p m a x 2.68 0.0100 4.27 0.0001 2.12 0.0094
PP 2.12 0.0090 2.34 0.0033 3.49 0.0016
RMS 5.33 0.0019 3.60 0.0017 4.12 0.0142
PosAr 2.94 0.0032 3.24 0.0015 1.40 0.0148
S 5 0.12 0.4283 0.32 0.1863 0.20 0.2170
S 10 0.17 0.2359 0.02 0.3062 0.05 0.2923
S 20 0.61 0.0840 0.09 0.3927 0.38 0.1426
S m a x 2.07 0.0066 1.98 0.0114 0.52 0.1300
HRA ( D u r a t i o n ) 20.32 < 0.0001 47.25 < 0.0001 18.97 < 0.0001
HRA ( P o s A r ) 1.90 0.0142 12.22 < 0.0001 1.03 0.0425
HRA ( S 5 ) 0.72 0.2707 0.86 0.0703 0.18 0.2249
HRA ( S 10 ) 0.14 0.2337 0.43 0.1593 0.24 0.1739
HRA ( S 20 ) 0.47 0.1431 0.78 0.0843 0.47 0.1187
HRA ( S m a x ) 7.65 < 0.0001 2.11 0.0091 0.38 0.1623
Table 3. Pearson’s correlations (%) and p values between LAWs and P-waves for CV measured every two ablation steps. Statistically significant results are shown in bold. CV: correlation of variation.
CVpre CA−LPVICVpre−post CACVLPVI−post
Featureρ [%]p Valueρ [%]p Valueρ [%]p Value
Duration 34.82 0.1567 13.31 0.5984 17.58 0.4854
A m p m a x 6.16 0.8081 11.40 0.6253 38.24 0.1173
PP 8.67 0.7326 3.56 0.8885 39.20 0.1077
RMS 1.41 0.9556 18.28 0.4679 54.07 0.0205
PosAr 43.37 0.0722 20.56 0.4131 36.60 0.1352
S 5 18.78 0.4555 11.53 0.6486 10.31 0.6840
S 10 26.29 0.0009 22.54 0.3684 10.44 0.6803
S 20 26.29 0.2919 26.10 0.2955 7.77 0.7593
S m a x 14.36 0.5690 14.37 0.5695 31.11 0.2089
HRA ( D u r a t i o n ) 85.72 < 0.0001 78.89 < 0.0001 53.90 0.0210
HRA ( P o s A r ) 2.76 0.9135 9.01 0.7220 42.64 0.0776
HRA ( S 5 ) 17.84 0.4788 10.33 0.6835 13.94 0.5811
HRA ( S 10 ) 73.23 0.0055 18.91 0.4523 15.06 0.5508
HRA ( S 20 ) 28.33 0.2546 28.46 0.2523 5.88 0.8167
HRA ( S m a x ) 3.91 0.8776 39.45 0.1052 28.70 0.2482
SDNN 48.33 0.0422 92.75 < 0.0001 89.15 < 0.0001
VARNN 17.44 0.4883 92.23 < 0.0001 86.63 < 0.0001
RMSSD 42.12 0.0817 51.23 0.0297 94.20 < 0.0001
Publisher’s Note: MDPI stays neutral with regard to jurisdictional claims in published maps and institutional affiliations.

