
CD147 Levels in Blood and Adipose Tissues Correlate with Vascular Dysfunction in Obese Diabetic Adults

 ,
, 
Abstract
:1. Introduction
2. Materials and Methods
2.1. Study Participants
2.2. Anthropometric and Cardiometabolic Measures
2.3. Plasma CD147, MMP2/9, and AGEs
2.4. Nitric Oxide (NO) and Inflammatory Biomarkers
2.5. In Vivo Vascular Measurements
2.6. Arteriolar FID and NO Measurements
2.7. Western Blotting
2.8. MMP2/9 Activity Assay
2.9. Immunoprecipitation and Glycoprotein Staining
2.10. Statistical Analyses
3. Results
3.1. Cardiometabolic Risk Factors
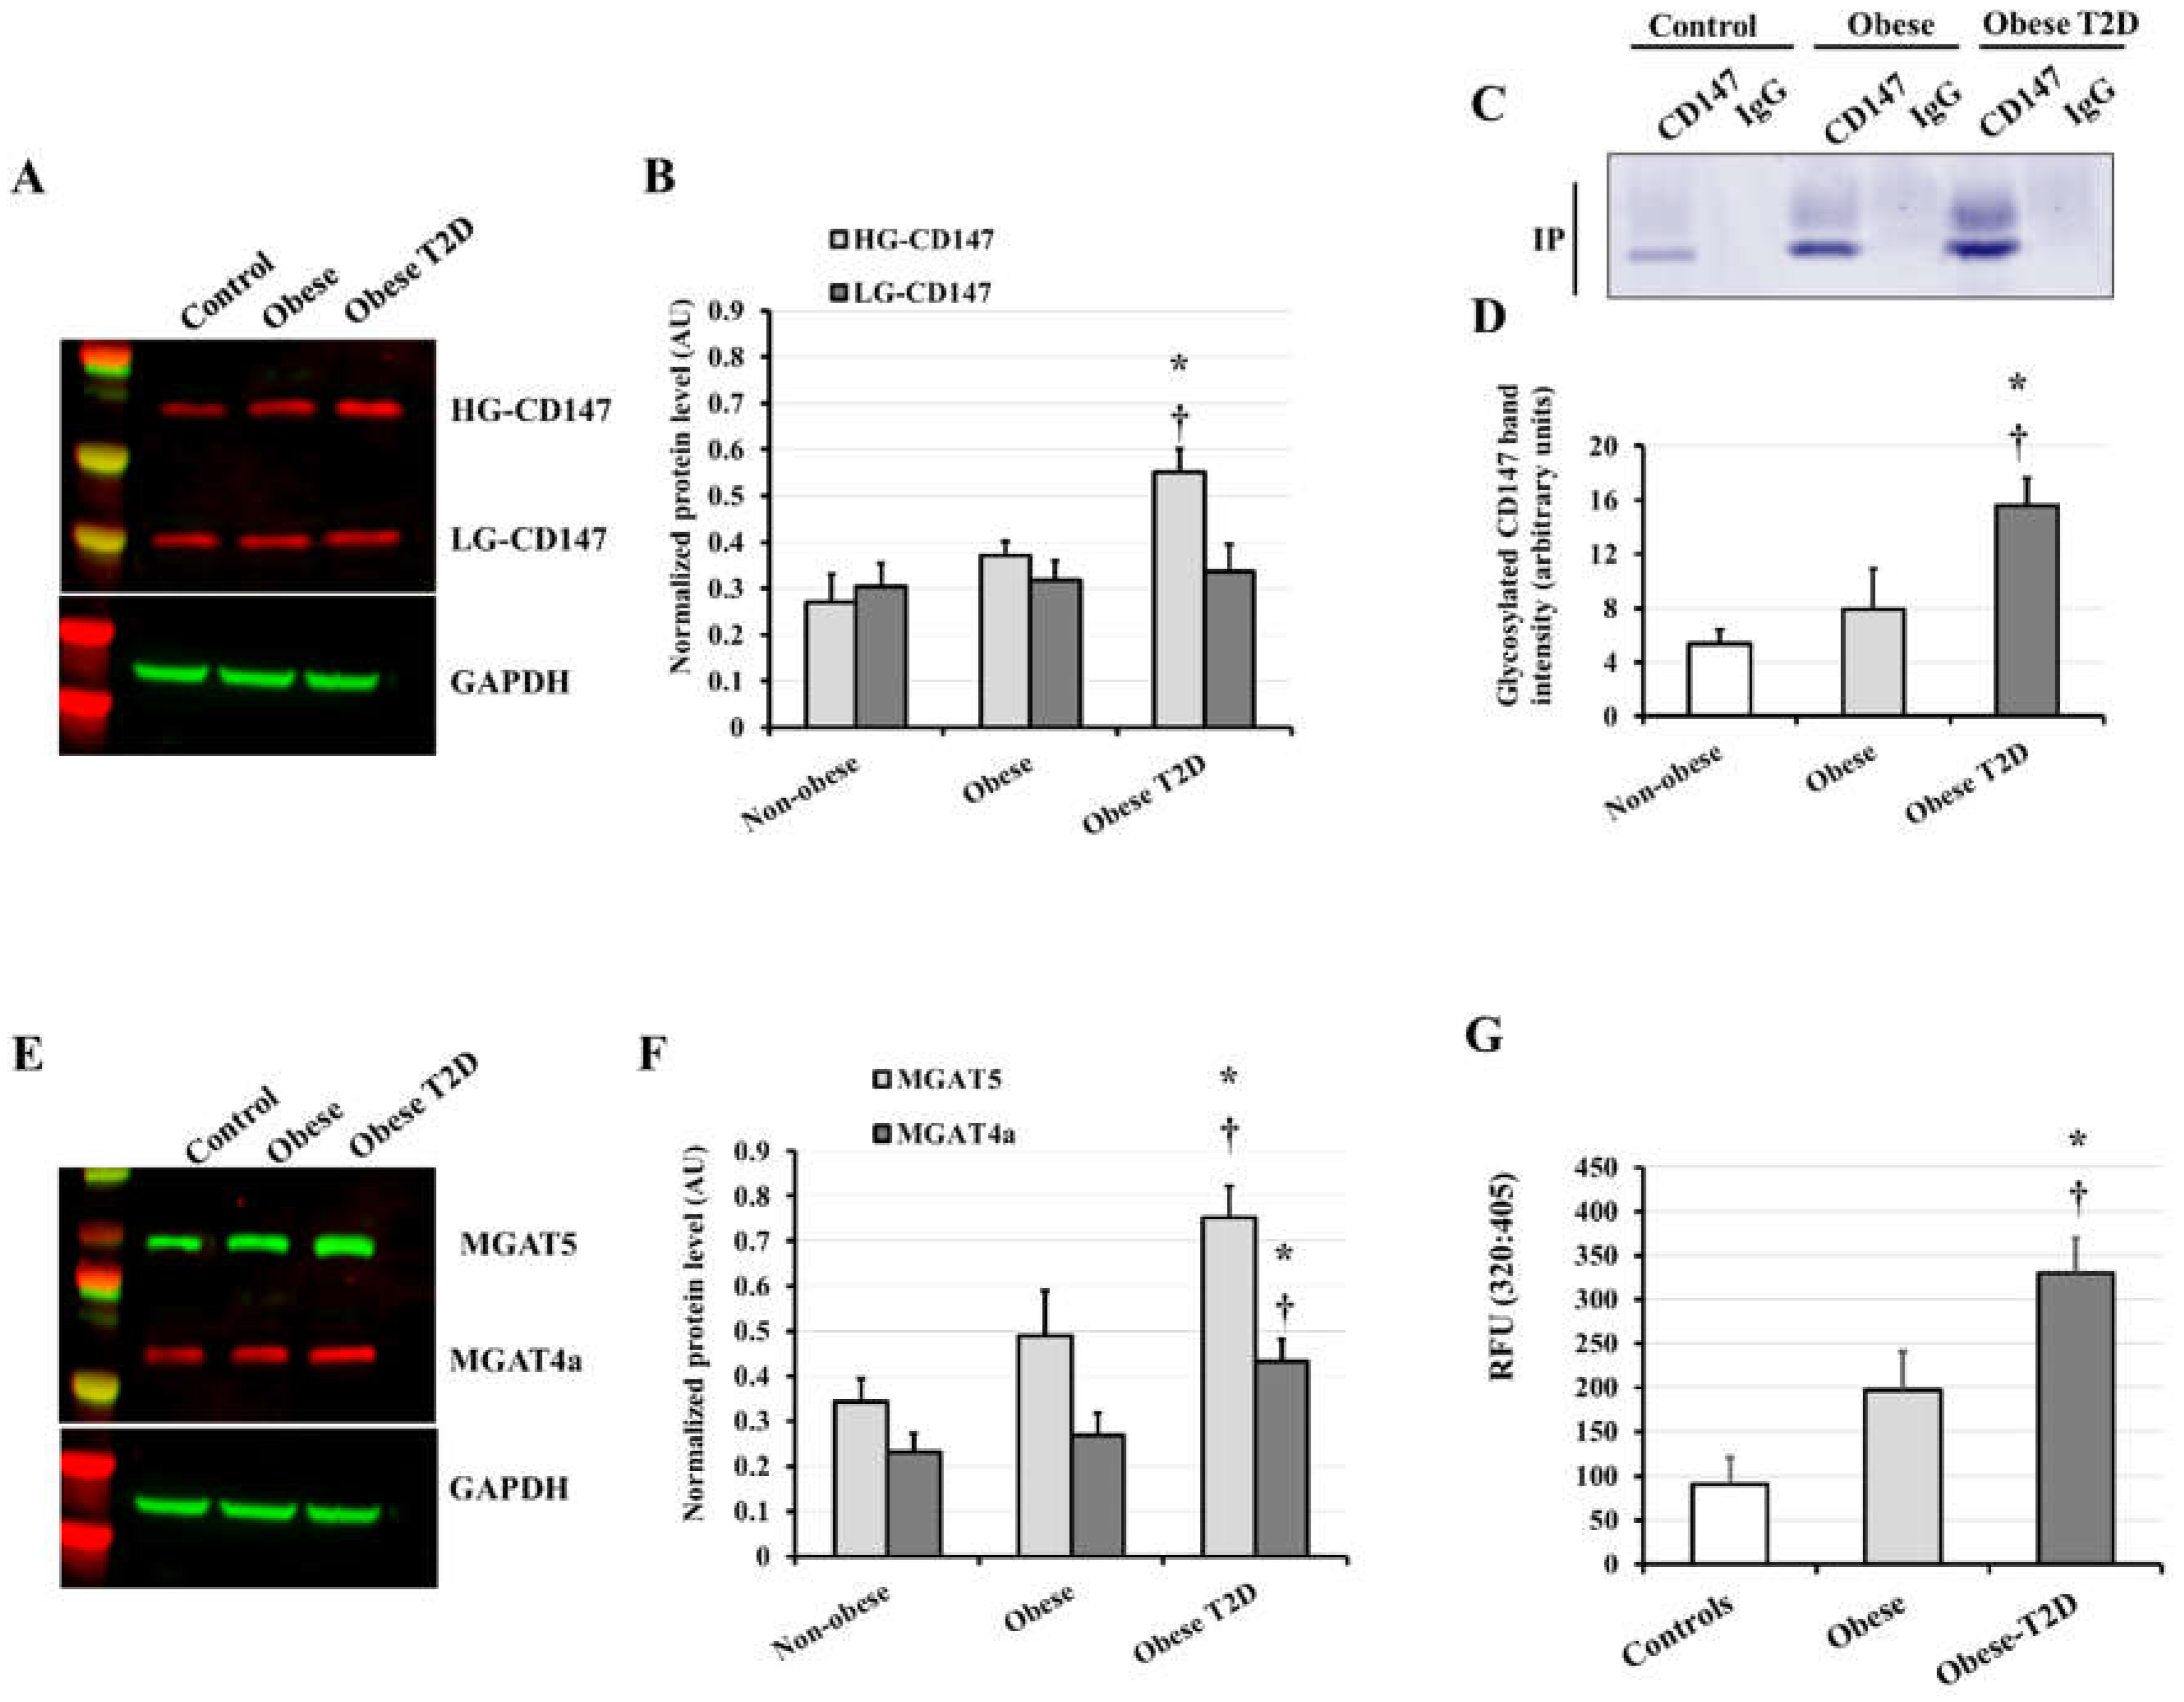
3.2. CD147, MMP2/9, and AGE Measurements
3.3. Vascular Measurements
3.4. CD147 Correlations with Cardiometabolic Risk Factors
4. Discussion
Author Contributions
Funding
Institutional Review Board Statement
Informed Consent Statement
Data Availability Statement
Acknowledgments
Conflicts of Interest
References
- Leon, B.M.; Maddox, T.M. Diabetes and cardiovascular disease: Epidemiology, biological mechanisms, treatment recommendations and future research. World J. Diabetes 2015, 6, 1246–1258. [Google Scholar] [CrossRef]
- Papazafiropoulou, A.; Tentolouris, N. Matrix metalloproteinases and cardiovascular diseases. Hippokratia 2009, 13, 76–82. [Google Scholar]
- Newby, A.C. Metalloproteinases and vulnerable atherosclerotic plaques. Trends Cardiovasc. Med. 2007, 17, 253–258. [Google Scholar] [CrossRef] [PubMed] [Green Version]
- Grass, G.D.; Toole, B.P. How, with whom and when: An overview of CD147-mediated regulatory networks influencing matrix metalloproteinase activity. Biosci. Rep. 2015, 36, e00283. [Google Scholar] [CrossRef] [Green Version]
- Bai, Y.; Huang, W.; Ma, L.T.; Jiang, J.L.; Chen, Z.N. Importance of N-glycosylation on CD147 for its biological functions. Int. J. Mol. Sci. 2014, 15, 6356–6377. [Google Scholar] [CrossRef] [PubMed] [Green Version]
- Wang, C.; Jin, R.; Zhu, X.; Yan, J.; Li, G. Function of CD147 in atherosclerosis and atherothrombosis. J. Cardiovasc. Transl. Res. 2015, 8, 59–66. [Google Scholar] [CrossRef] [PubMed] [Green Version]
- Shi, W.P.; Ju, D.; Li, H.; Yuan, L.; Cui, J.; Luo, D.; Chen, Z.N.; Bian, H. CD147 Promotes CXCL1 Expression and Modulates Liver Fibrogenesis. Int. J. Mol. Sci. 2018, 19, 1145. [Google Scholar] [CrossRef] [Green Version]
- Xin, X.; Zeng, X.; Gu, H.; Li, M.; Tan, H.; Jin, Z.; Hua, T.; Shi, R.; Wang, H. CD147/EMMPRIN overexpression and prognosis in cancer: A systematic review and meta-analysis. Sci. Rep. 2016, 6, 32804. [Google Scholar] [CrossRef] [Green Version]
- Schmidt, R.; Bultmann, A.; Ungerer, M.; Joghetaei, N.; Bulbul, O.; Thieme, S.; Chavakis, T.; Toole, B.P.; Gawaz, M.; Schomig, A.; et al. Extracellular matrix metalloproteinase inducer regulates matrix metalloproteinase activity in cardiovascular cells: Implications in acute myocardial infarction. Circulation 2006, 113, 834–841. [Google Scholar] [CrossRef] [Green Version]
- Yoon, Y.W.; Kwon, H.M.; Hwang, K.C.; Choi, E.Y.; Hong, B.K.; Kim, D.; Kim, H.S.; Cho, S.H.; Song, K.S.; Sangiorgi, G. Upstream regulation of matrix metalloproteinase by EMMPRIN; extracellular matrix metalloproteinase inducer in advanced atherosclerotic plaque. Atherosclerosis 2005, 180, 37–44. [Google Scholar] [CrossRef]
- Stanaway, S.E.R.S.; Gill, G.V. Protein glycosylation in diabetes mellitus: Biochemical and clinical considerations. Pract. Diabetes Int. 2000, 17, 21–25. [Google Scholar] [CrossRef]
- Mahmoud, A.M.; Ali, M.M. High Glucose and Advanced Glycation End Products Induce CD147-Mediated MMP Activity in Human Adipocytes. Cells 2021, 10, 2098. [Google Scholar] [CrossRef] [PubMed]
- Bao, W.; Min, D.; Twigg, S.M.; Shackel, N.A.; Warner, F.J.; Yue, D.K.; McLennan, S.V. Monocyte CD147 is induced by advanced glycation end products and high glucose concentration: Possible role in diabetic complications. Am. J. Physiol. Cell Physiol. 2010, 299, C1212–C1219. [Google Scholar] [CrossRef] [PubMed]
- Vlassara, H.; Uribarri, J. Advanced glycation end products (AGE) and diabetes: Cause, effect, or both? Curr. Diabetes Rep. 2014, 14, 453. [Google Scholar] [CrossRef] [Green Version]
- Mahmoud, A.M.; Somal, V.S.; Solomon, T.P.; Kasumov, T.; Fealy, C.E.; Malin, S.K.; Kirwan, J.P.; Haus, J.M. RAGE Expression in Human Skeletal Muscle Is Normalized Following Aerobic Exercise Training. In Diabetes; American Diabetes Association: Arlington, VA, USA, 2013; p. A14. [Google Scholar]
- Matthews, D.R.; Hosker, J.P.; Rudenski, A.S.; Naylor, B.A.; Treacher, D.F.; Turner, R.C. Homeostasis model assessment: Insulin resistance and beta-cell function from fasting plasma glucose and insulin concentrations in man. Diabetologia 1985, 28, 412–419. [Google Scholar] [CrossRef] [PubMed] [Green Version]
- Haloul, M.; Vinjamuri, S.J.; Naquiallah, D.; Mirza, M.I.; Qureshi, M.; Hassan, C.; Masrur, M.; Bianco, F.M.; Frederick, P.; Cristoforo, G.P.; et al. Hyperhomocysteinemia and Low Folate and Vitamin B12 Are Associated with Vascular Dysfunction and Impaired Nitric Oxide Sensitivity in Morbidly Obese Patients. Nutrients 2020, 12, 2014. [Google Scholar] [CrossRef]
- Ali, M.M.; Naquiallah, D.; Qureshi, M.; Mirza, M.I.; Hassan, C.; Masrur, M.; Bianco, F.M.; Frederick, P.; Cristoforo, G.P.; Gangemi, A.; et al. DNA methylation profile of genes involved in inflammation and autoimmunity correlates with vascular function in morbidly obese adults. Epigenetics 2021, 1–17. [Google Scholar] [CrossRef] [PubMed]
- Ali, M.M.; Hassan, C.; Masrur, M.; Bianco, F.M.; Naquiallah, D.; Mirza, I.; Frederick, P.; Fernandes, E.T.; Giulianotti, C.P.; Gangemi, A.; et al. Adipose Tissue Hypoxia Correlates with Adipokine Hypomethylation and Vascular Dysfunction. Biomedicines 2021, 9, 1034. [Google Scholar] [CrossRef]
- Lane, A.D.; Wu, P.T.; Kistler, B.; Fitschen, P.; Tomayko, E.; Jeong, J.H.; Chung, H.R.; Yan, H.; Ranadive, S.M.; Phillips, S.; et al. Arterial stiffness and walk time in patients with end-stage renal disease. Kidney Blood Press. Res. 2013, 37, 142–150. [Google Scholar] [CrossRef] [PubMed]
- Mahmoud, A.M.; Szczurek, M.R.; Blackburn, B.K.; Mey, J.T.; Chen, Z.; Robinson, A.T.; Bian, J.T.; Unterman, T.G.; Minshall, R.D.; Brown, M.D.; et al. Hyperinsulinemia augments endothelin-1 protein expression and impairs vasodilation of human skeletal muscle arterioles. Physiol. Rep. 2016, 4, e12895. [Google Scholar] [CrossRef] [Green Version]
- Mahmoud, A.M.; Hwang, C.L.; Szczurek, M.R.; Bian, J.T.; Ranieri, C.; Gutterman, D.D.; Phillips, S.A. Low-Fat Diet Designed for Weight Loss But Not Weight Maintenance Improves Nitric Oxide-Dependent Arteriolar Vasodilation in Obese Adults. Nutrients 2019, 11, 1339. [Google Scholar] [CrossRef] [Green Version]
- Mahmoud, A.M.; Szczurek, M.; Hassan, C.; Masrur, M.; Gangemi, A.; Phillips, S.A. Vitamin D Improves Nitric Oxide-Dependent Vasodilation in Adipose Tissue Arterioles from Bariatric Surgery Patients. Nutrients 2019, 11, 2521. [Google Scholar] [CrossRef] [Green Version]
- Hwang, C.L.; Ranieri, C.; Szczurek, M.R.; Ellythy, A.M.; Elokda, A.; Mahmoud, A.M.; Phillips, S.A. The Effect of Low-Carbohydrate Diet on Macrovascular and Microvascular Endothelial Function is Not Affected by the Provision of Caloric Restriction in Women with Obesity: A Randomized Study. Nutrients 2020, 12, 1649. [Google Scholar] [CrossRef]
- Peppa, M.; Uribarri, J.; Vlassara, H. Glucose, Advanced Glycation End Products, and Diabetes Complications: What Is New and What Works. Clin. Diabetes 2003, 21, 186–187. [Google Scholar] [CrossRef] [Green Version]
- Sluijter, J.P.; Pulskens, W.P.; Schoneveld, A.H.; Velema, E.; Strijder, C.F.; Moll, F.; de Vries, J.P.; Verheijen, J.; Hanemaaijer, R.; de Kleijn, D.P.; et al. Matrix metalloproteinase 2 is associated with stable and matrix metalloproteinases 8 and 9 with vulnerable carotid atherosclerotic lesions: A study in human endarterectomy specimen pointing to a role for different extracellular matrix metalloproteinase inducer glycosylation forms. Stroke 2006, 37, 235–239. [Google Scholar] [CrossRef]
- Varki, A.; Cummings, R.D.; Esko, J.D.; Stanley, P.; Hart, G.W.; Aebi, M.; Darvill, A.G.; Kinoshita, T.; Packer, N.H.; Prestegard, J.H.; et al. (Eds.) Essentials of Glycobiology; Cold Spring Harbor Laboratory Press: New York, NY, USA, 2015. [Google Scholar]
- Hoffmann, B.R.; Widlansky, M.E.; Greene, A.S. Hyperglycemia-induced Glycosylation: A Driving Force for Vascular Dysfunction in Diabetes? FASEB J. 2016, 30, 1213–1282. [Google Scholar] [CrossRef]
- Keser, T.; Gornik, I.; Vuckovic, F.; Selak, N.; Pavic, T.; Lukic, E.; Gudelj, I.; Gasparovic, H.; Biocina, B.; Tilin, T.; et al. Increased plasma N-glycome complexity is associated with higher risk of type 2 diabetes. Diabetologia 2017, 60, 2352–2360. [Google Scholar] [CrossRef]
- Wittenbecher, C.; Stambuk, T.; Kuxhaus, O.; Rudman, N.; Vuckovic, F.; Stambuk, J.; Schiborn, C.; Rahelic, D.; Dietrich, S.; Gornik, O.; et al. Plasma N-Glycans as Emerging Biomarkers of Cardiometabolic Risk: A Prospective Investigation in the EPIC-Potsdam Cohort Study. Diabetes Care 2020, 43, 661–668. [Google Scholar] [CrossRef]
- Yoshida, S.; Shibata, M.; Yamamoto, S.; Hagihara, M.; Asai, N.; Takahashi, M.; Mizutani, S.; Muramatsu, T.; Kadomatsu, K. Homo-oligomer formation by basigin, an immunoglobulin superfamily member, via its N-terminal immunoglobulin domain. Eur. J. Biochem. 2000, 267, 4372–4380. [Google Scholar] [CrossRef]
- Huang, W.; Luo, W.J.; Zhu, P.; Tang, J.; Yu, X.L.; Cui, H.Y.; Wang, B.; Zhang, Y.; Jiang, J.L.; Chen, Z.N. Modulation of CD147-induced matrix metalloproteinase activity: Role of CD147 N-glycosylation. Biochem. J. 2013, 449, 437–448. [Google Scholar] [CrossRef]
- Cui, H.Y.; Wang, S.J.; Song, F.; Cheng, X.; Nan, G.; Zhao, Y.; Qian, M.R.; Chen, X.; Li, J.Y.; Liu, F.L.; et al. CD147 receptor is essential for TFF3-mediated signaling regulating colorectal cancer progression. Signal Transduct. Target. Ther. 2021, 6, 268. [Google Scholar] [CrossRef]
- Pan, S.; Su, Y.; Sun, B.; Hao, R.; Gao, X.; Han, B. Knockout of CD147 inhibits the proliferation, invasion, and drug resistance of human oral cancer CAL27 cells in Vitro and in Vivo. Int. J. Biol. Macromol. 2021, 181, 378–389. [Google Scholar] [CrossRef]
- Landras, A.; Reger de Moura, C.; Jouenne, F.; Lebbe, C.; Menashi, S.; Mourah, S. CD147 Is a Promising Target of Tumor Progression and a Prognostic Biomarker. Cancers 2019, 11, 1803. [Google Scholar] [CrossRef] [Green Version]
- Liu, C.; von Brunn, A.; Zhu, D. Cyclophilin A and CD147: Novel therapeutic targets for the treatment of COVID-19. Med. Drug Discov. 2020, 7, 100056. [Google Scholar] [CrossRef]
- Avolio, E.; Carrabba, M.; Milligan, R.; Kavanagh Williamson, M.; Beltrami, A.; Gupta, K.; Elvers, K.T.; Gamez, M.; Foster, R.; Gillespie, K.; et al. The SARS-CoV-2 Spike protein disrupts human cardiac pericytes function through CD147-receptor-mediated signalling: A potential non-infective mechanism of COVID-19 microvascular disease. Clin. Sci. Lond. 2021, 135, 2667–2689. [Google Scholar] [CrossRef]
- Ahmetaj-Shala, B.; Vaja, R.; Atanur, S.S.; George, P.M.; Kirkby, N.S.; Mitchell, J.A. Cardiorenal Tissues Express SARS-CoV-2 Entry Genes and Basigin (BSG/CD147) Increases with Age in Endothelial Cells. JACC Basic Transl. Sci. 2020, 5, 1111–1123. [Google Scholar] [CrossRef]
- Xie, Y.; Wang, Y.; Ding, H.; Guo, M.; Wang, X.; Dong, Q.; Cui, M. Highly glycosylated CD147 promotes hemorrhagic transformation after rt-PA treatment in diabetes: A novel therapeutic target? J. Neuroinflamm. 2019, 16, 72. [Google Scholar] [CrossRef] [Green Version]
- Wang, Y.X.; Gao, Y.T.; Cui, L.B.; Ru, N.Y.; Zhang, H.J.; Jiao, B.; Yu, Z.B. Effects of tamoxifen on CD147 glycosylation and MMPs in the diabetic rat myocardium. Chin. J. Appl. Physiol. 2015, 31, 1–5. [Google Scholar]
- Guo, J.; Zhang, J.; Huang, Z.; Qi, M. Role of CD147 in regulating the RSK2/Slug/EMT pathway in diabetic foot ulcer healing. J. Cent. South Univ. Med. Sci. 2020, 45, 929–934. [Google Scholar] [CrossRef]
- Chiu, P.F.; Su, S.L.; Tsai, C.C.; Wu, C.L.; Kuo, C.L.; Kor, C.T.; Chang, C.C.; Liu, C.S. Cyclophilin A and CD147 associate with progression of diabetic nephropathy. Free Radic. Res. 2018, 52, 1456–1463. [Google Scholar] [CrossRef]
- Sun, J.; Hemler, M.E. Regulation of MMP-1 and MMP-2 production through CD147/extracellular matrix metalloproteinase inducer interactions. Cancer Res. 2001, 61, 2276–2281. [Google Scholar]
- Guo, H.; Zucker, S.; Gordon, M.K.; Toole, B.P.; Biswas, C. Stimulation of matrix metalloproteinase production by recombinant extracellular matrix metalloproteinase inducer from transfected Chinese hamster ovary cells. J. Biol. Chem. 1997, 272, 24–27. [Google Scholar] [CrossRef] [PubMed] [Green Version]
- Wang, X.; Khalil, R.A. Matrix Metalloproteinases, Vascular Remodeling, and Vascular Disease. Adv. Pharmacol. 2018, 81, 241–330. [Google Scholar] [CrossRef]
- Liu, J.; Khalil, R.A. Matrix Metalloproteinase Inhibitors as Investigational and Therapeutic Tools in Unrestrained Tissue Remodeling and Pathological Disorders. Prog. Mol. Biol. Transl. Sci. 2017, 148, 355–420. [Google Scholar] [CrossRef] [Green Version]
- Kowluru, R.A.; Kanwar, M. Oxidative stress and the development of diabetic retinopathy: Contributory role of matrix metalloproteinase-2. Free Radic. Biol. Med. 2009, 46, 1677–1685. [Google Scholar] [CrossRef] [PubMed] [Green Version]
- Azevedo, A.; Prado, A.F.; Antonio, R.C.; Issa, J.P.; Gerlach, R.F. Matrix metalloproteinases are involved in cardiovascular diseases. Basic Clin. Pharmacol. Toxicol. 2014, 115, 301–314. [Google Scholar] [CrossRef]
- Hadi, H.A.; Carr, C.S.; Al Suwaidi, J. Endothelial dysfunction: Cardiovascular risk factors, therapy, and outcome. Vasc. Health Risk Manag. 2005, 1, 183–198. [Google Scholar] [PubMed]
- George, A.M.; Jacob, A.G.; Fogelfeld, L. Lean diabetes mellitus: An emerging entity in the era of obesity. World J. Diabetes 2015, 6, 613–620. [Google Scholar] [CrossRef]
- Dearborn, J.L.; Viscoli, C.M.; Inzucchi, S.E.; Young, L.H.; Kernan, W.N. Metabolic syndrome identifies normal weight insulin-resistant stroke patients at risk for recurrent vascular disease. Int. J. Stroke 2019, 14, 639–645. [Google Scholar] [CrossRef]


| Variable | Healthy Controls (n = 40, ♂ = 18) | Obese (n = 40, ♂ = 15) | Obese T2D (n = 40, ♂ = 16) | p Value |
|---|---|---|---|---|
| Age, y | 35.4 ± 1.3 | 36.1 ± 1.2 | 36.2 ± 1 | 0.8712 |
| Weight, kg | 74.4 ± 1.6 | 142.4 ± 3.8 * | 144.4 ± 3.7 * | <0.0001 |
| BMI, kg/m2 | 24.9 ± 0.5 | 48.7 ± 1.3 * | 49.6 ± 1.1 * | <0.0001 |
| WC, cm | 91.5 ± 2.0 | 133.5 ± 3.2 * | 135.5 ± 4 * | <0.0001 |
| Body fat, % | 32.2 ± 2.5 | 51.3 ± 1.1 * | 54.3 ± 1.0 * | <0.0001 |
| Body lean, % | 65.3 ± 2.4 | 42.5 ± 0.7 * | 38.5 ± 0.9 * | <0.0001 |
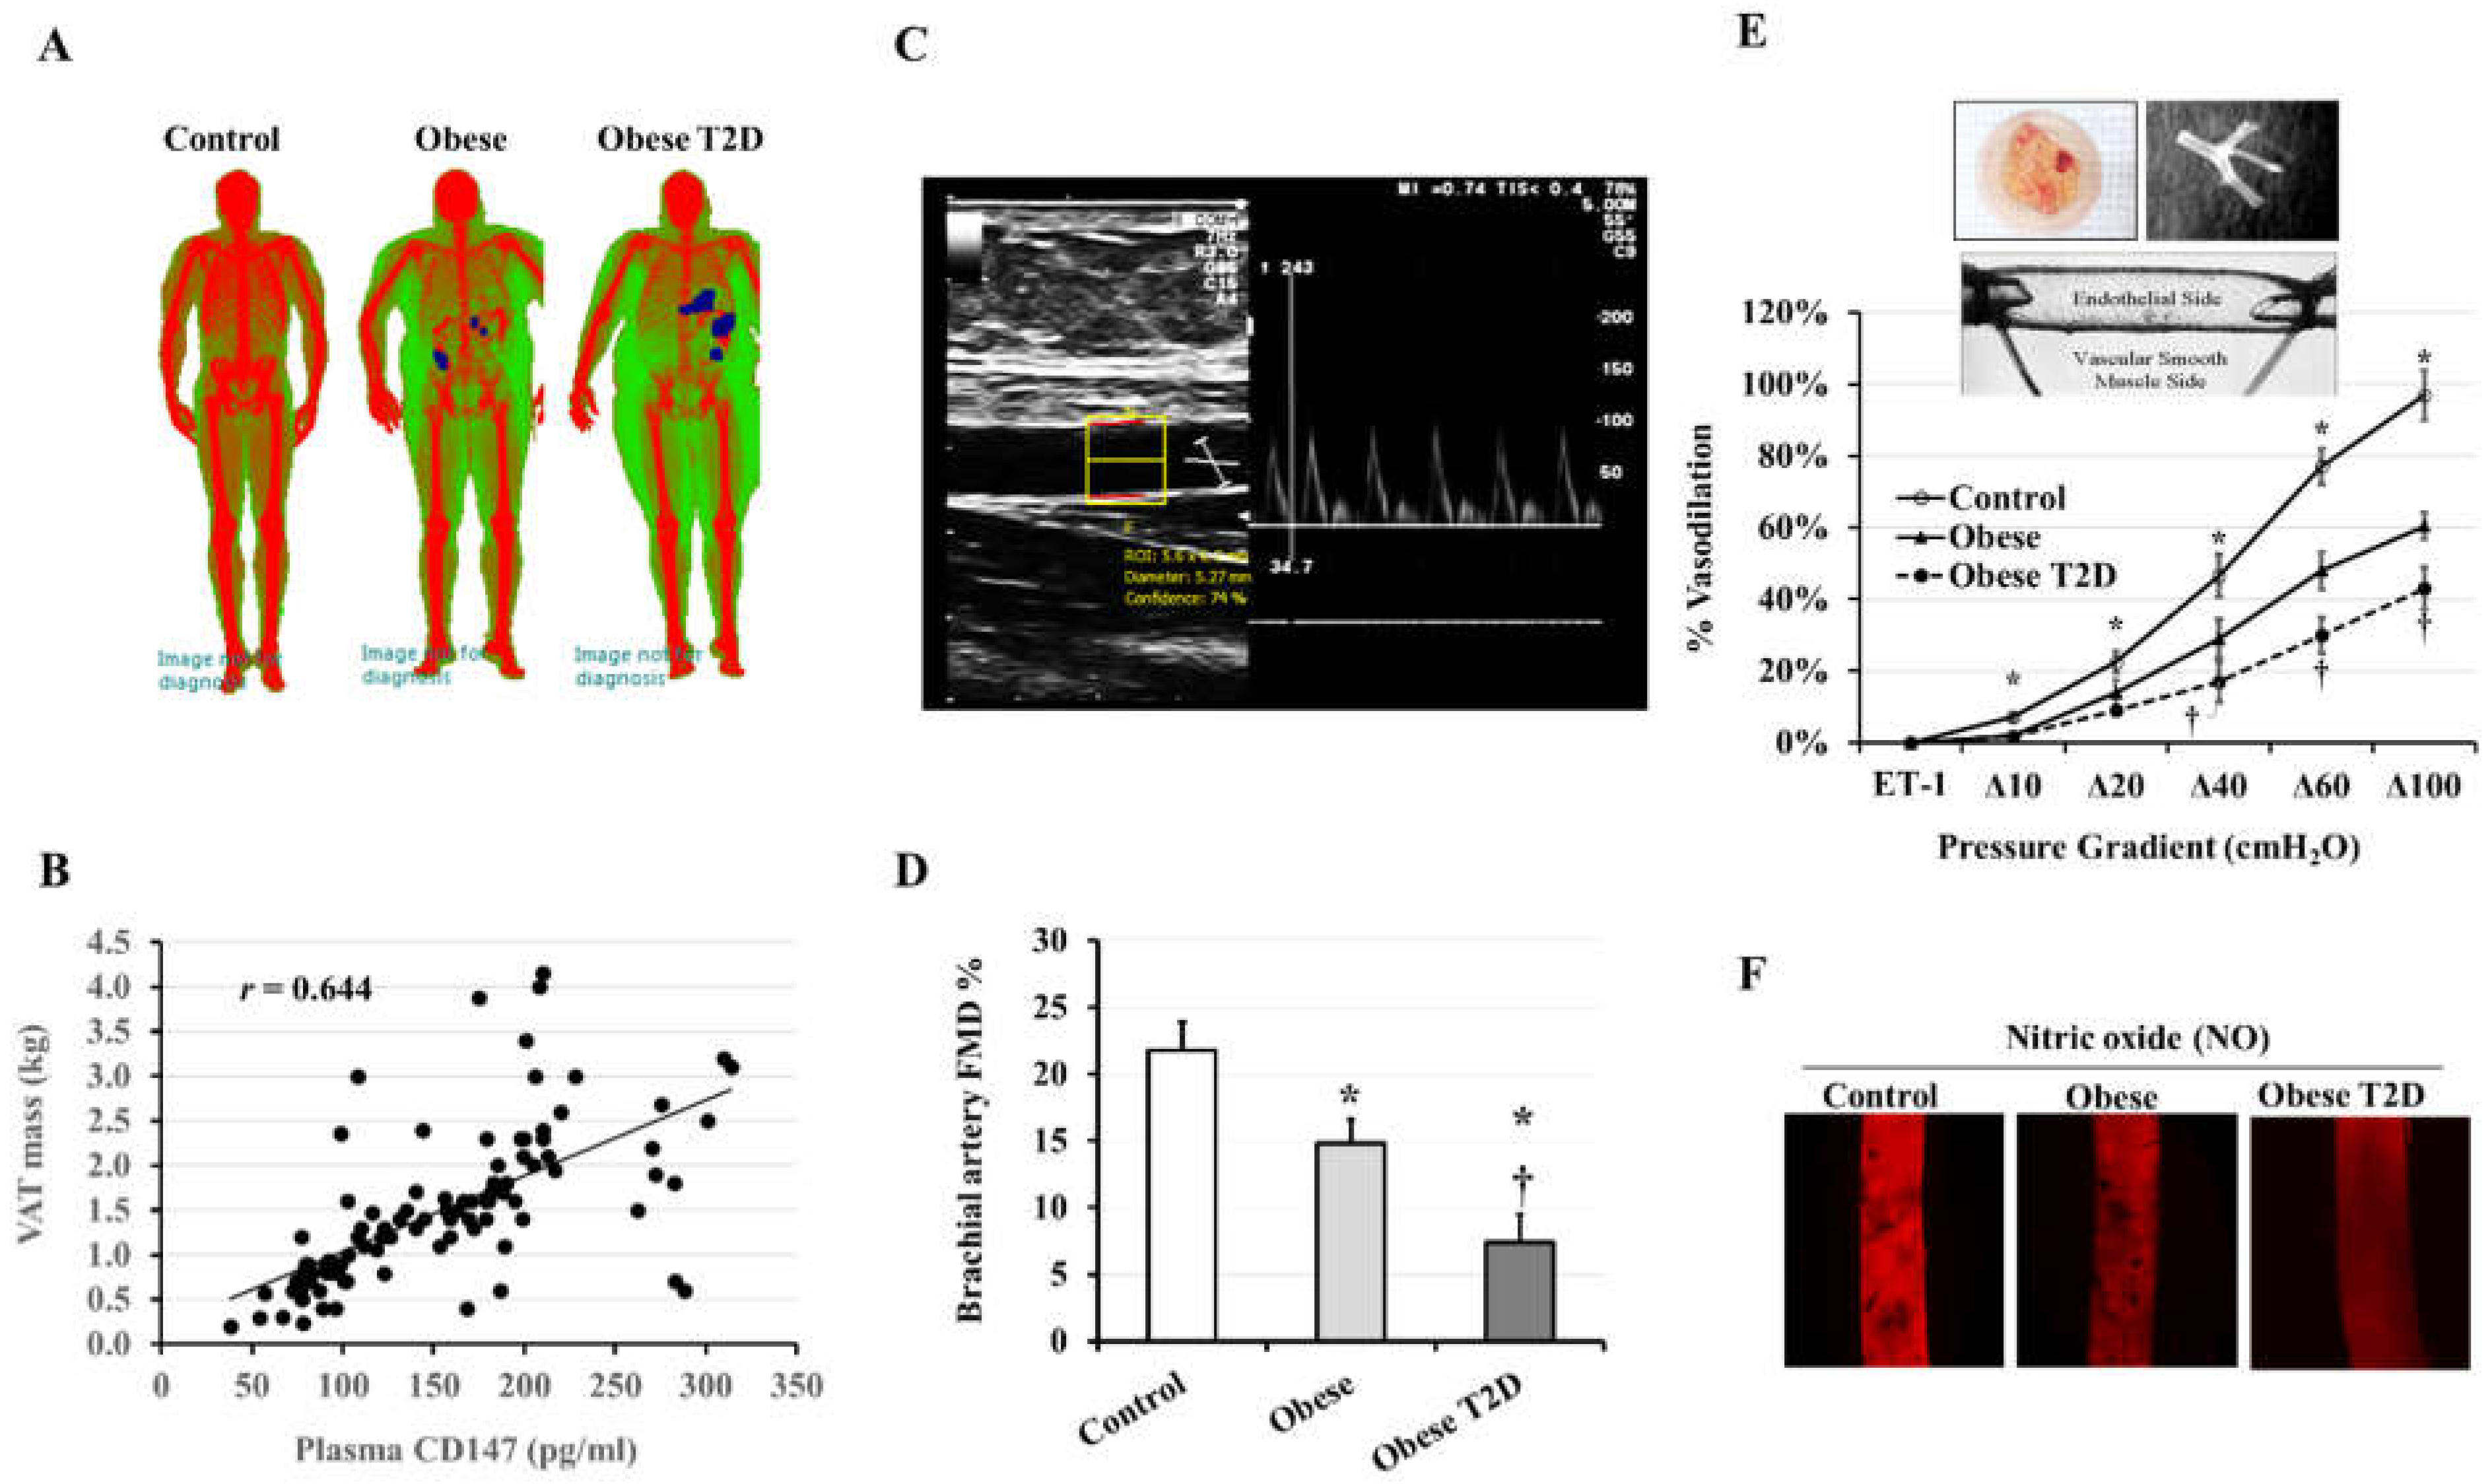
| VAT mass, kg | 0.7 ± 0.1 | 2.3 ± 0.3 * | 2.7 ± 0.2 * | <0.0001 |
| HR, bpm | 74 ± 2 | 81 ± 1 * | 84 ± 1 * | <0.0001 |
| SBP, mmHg | 118 ± 2 | 132 ± 4 * | 141 ± 2 * | <0.0001 |
| DBP, mmHg | 75 ± 1 | 82 ± 1 * | 87 ± 1 *† | <0.0001 |
| FPG, mg/dL | 87 ± 8 | 103 ± 9 | 135 ± 8 *† | 0.0003 |
| FPI, µU/mL | 8.1 ± 0.8 | 11.2 ± 0.4 * | 18.9 ± 1.2 *† | <0.0001 |
| HOMA-IR | 1.6 ± 0.1 | 2.5 ± 0.2 * | 6.4 ± 0.4 *† | <0.0001 |
| HbA1c, % | 5.3 ± 0.1 | 5.4 ± 0.2 | 6.8 ± 0.3 *† | <0.0001 |
| T-Chol, mg/dL | 155 ± 9 | 165 ± 8 | 190 ± 4 *† | 0.0031 |
| HDL, mg/dL | 56 ± 6 | 44 ± 2 | 34 ± 1 * | 0.0003 |
| LDL, mg/dL | 81 ± 7 | 99 ± 4 * | 131 ± 4 *† | <0.0001 |
| TG, mg/dL | 92 ± 11 | 108 ± 8 | 128 ± 8 * | 0.0225 |
| NO, µmol/L | 6.0 ± 0.4 | 3.7 ± 0.2 * | 2.7 ± 0.1 *† | <0.0001 |
| CRP, mg/dL | 0.7 ± 0.1 | 3.8 ± 0.2 * | 4.1 ± 0.4 * | <0.0001 |
| IL6, pg/mL | 5.2 ± 0.6 | 15.6 ± 3.6 * | 26.8 ± 1.6 *† | <0.0001 |
| TNFα, pg/mL | 2.6 ± 0.2 | 3.4 ± 0.1 * | 5.7 ± 0.2 *† | <0.0001 |
| CD147, pg/mL | 87.7 ± 19.1 | 121.1 ± 21.6 | 184.1 ± 11.6 *† | 0.0009 |
| MMP2, ng/mL | 6.1 ± 1.5 | 14.3 ± 2.4 * | 18.1 ± 3.1 * | 0.0023 |
| MMP9, ng/mL | 8.3 ± 2.5 | 19.8 ± 2.3 * | 20.8 ± 4.6 * | 0.0140 |
| MG, ng/mL | 38.1 ± 9.0 | 51.1 ± 13.1 | 89.3 ± 11.1 *† | 0.0045 |
| CML, ng/mL | 81.2 ± 12.1 | 140.4 ± 25 | 211.5 ± 15.2 *† | <0.0001 |
| Variable | Correlation Coefficient | p-Value |
|---|---|---|
| Weight | 0.329 | 0.0002 |
| BMI | 0.360 | <0.0001 |
| VAT mass | 0.644 | <0.0001 |
| FPG | 0.480 | <0.0001 |
| HOMA-IR | 0.410 | <0.0001 |
| HbA1c | 0.320 | 0.0004 |
| Plasma CRP | 0.365 | <0.0001 |
| Plasma IL6 | 0.420 | <0.0001 |
| Plasma CML | 0.451 | <0.0001 |
| Plasma MMP2 | 0.366 | <0.0001 |
| Plasma MMP9 | 0.436 | <0.0001 |
| Fat HG-CD147 | 0.662 | <0.0001 |
| Fat MGAT5 | 0.447 | <0.0001 |
| Arteriolar FID | −0.305 | 0.0007 |
| Arteriolar NO | −0.281 | 0.0018 |
Publisher’s Note: MDPI stays neutral with regard to jurisdictional claims in published maps and institutional affiliations. |
© 2021 by the authors. Licensee MDPI, Basel, Switzerland. This article is an open access article distributed under the terms and conditions of the Creative Commons Attribution (CC BY) license (https://creativecommons.org/licenses/by/4.0/).
Share and Cite
Ali, M.M.; Mirza, I.; Naquiallah, D.; Hassan, C.; Masrur, M.; Bianco, F.M.; Mahmoud, A.M. CD147 Levels in Blood and Adipose Tissues Correlate with Vascular Dysfunction in Obese Diabetic Adults. J. Cardiovasc. Dev. Dis. 2022, 9, 7. https://doi.org/10.3390/jcdd9010007
Ali MM, Mirza I, Naquiallah D, Hassan C, Masrur M, Bianco FM, Mahmoud AM. CD147 Levels in Blood and Adipose Tissues Correlate with Vascular Dysfunction in Obese Diabetic Adults. Journal of Cardiovascular Development and Disease. 2022; 9(1):7. https://doi.org/10.3390/jcdd9010007
Chicago/Turabian StyleAli, Mohamed M., Imaduddin Mirza, Dina Naquiallah, Chandra Hassan, Mario Masrur, Francesco M. Bianco, and Abeer M. Mahmoud. 2022. "CD147 Levels in Blood and Adipose Tissues Correlate with Vascular Dysfunction in Obese Diabetic Adults" Journal of Cardiovascular Development and Disease 9, no. 1: 7. https://doi.org/10.3390/jcdd9010007
APA StyleAli, M. M., Mirza, I., Naquiallah, D., Hassan, C., Masrur, M., Bianco, F. M., & Mahmoud, A. M. (2022). CD147 Levels in Blood and Adipose Tissues Correlate with Vascular Dysfunction in Obese Diabetic Adults. Journal of Cardiovascular Development and Disease, 9(1), 7. https://doi.org/10.3390/jcdd9010007