
Electrocardiographic Characteristics and Their Correlation with Echocardiographic Alterations in Fabry Disease

 , , and
Abstract
:
1. Introduction
2. Materials and Methods
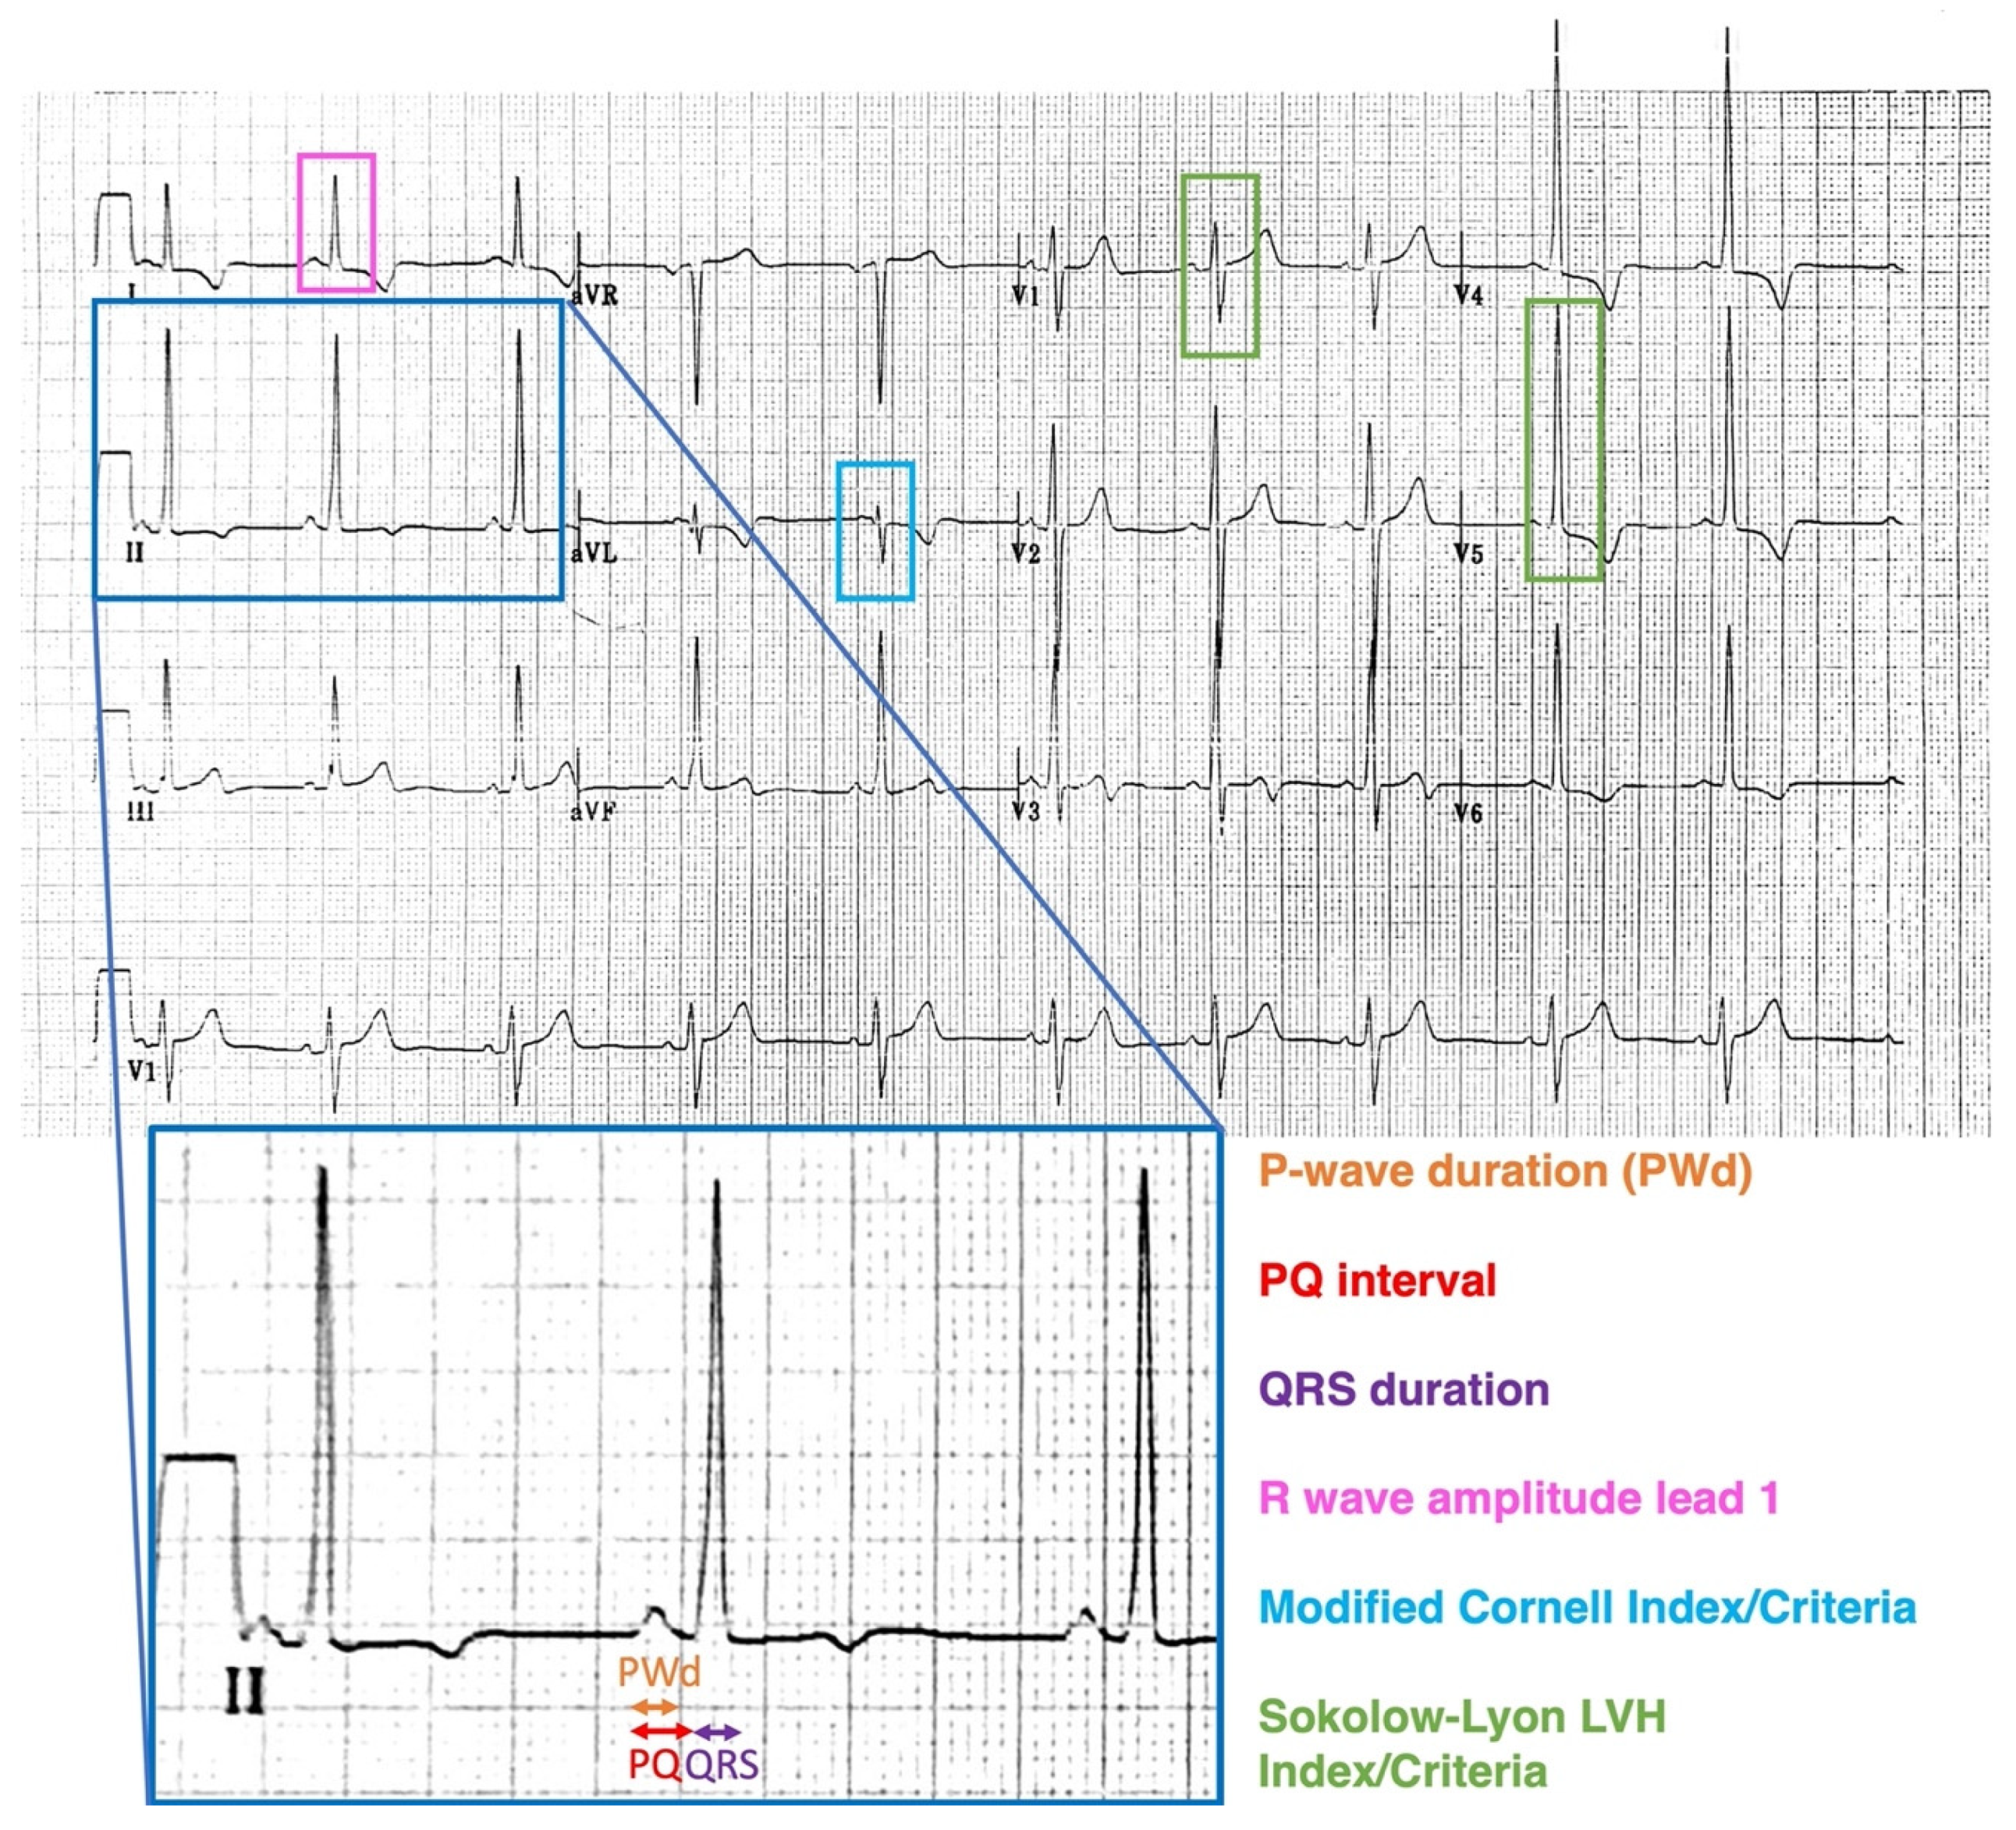
2.1. Electrocardiography
2.2. Echocardiography
2.3. Strain Analysis
2.4. Inter-Observer and Intra-Observer Variability
2.5. Statistical Analysis
3. Results
3.1. ECG in FD versus Controls
3.2. Male FD vs. Female FD: ECG and Echocardiographic Correlates
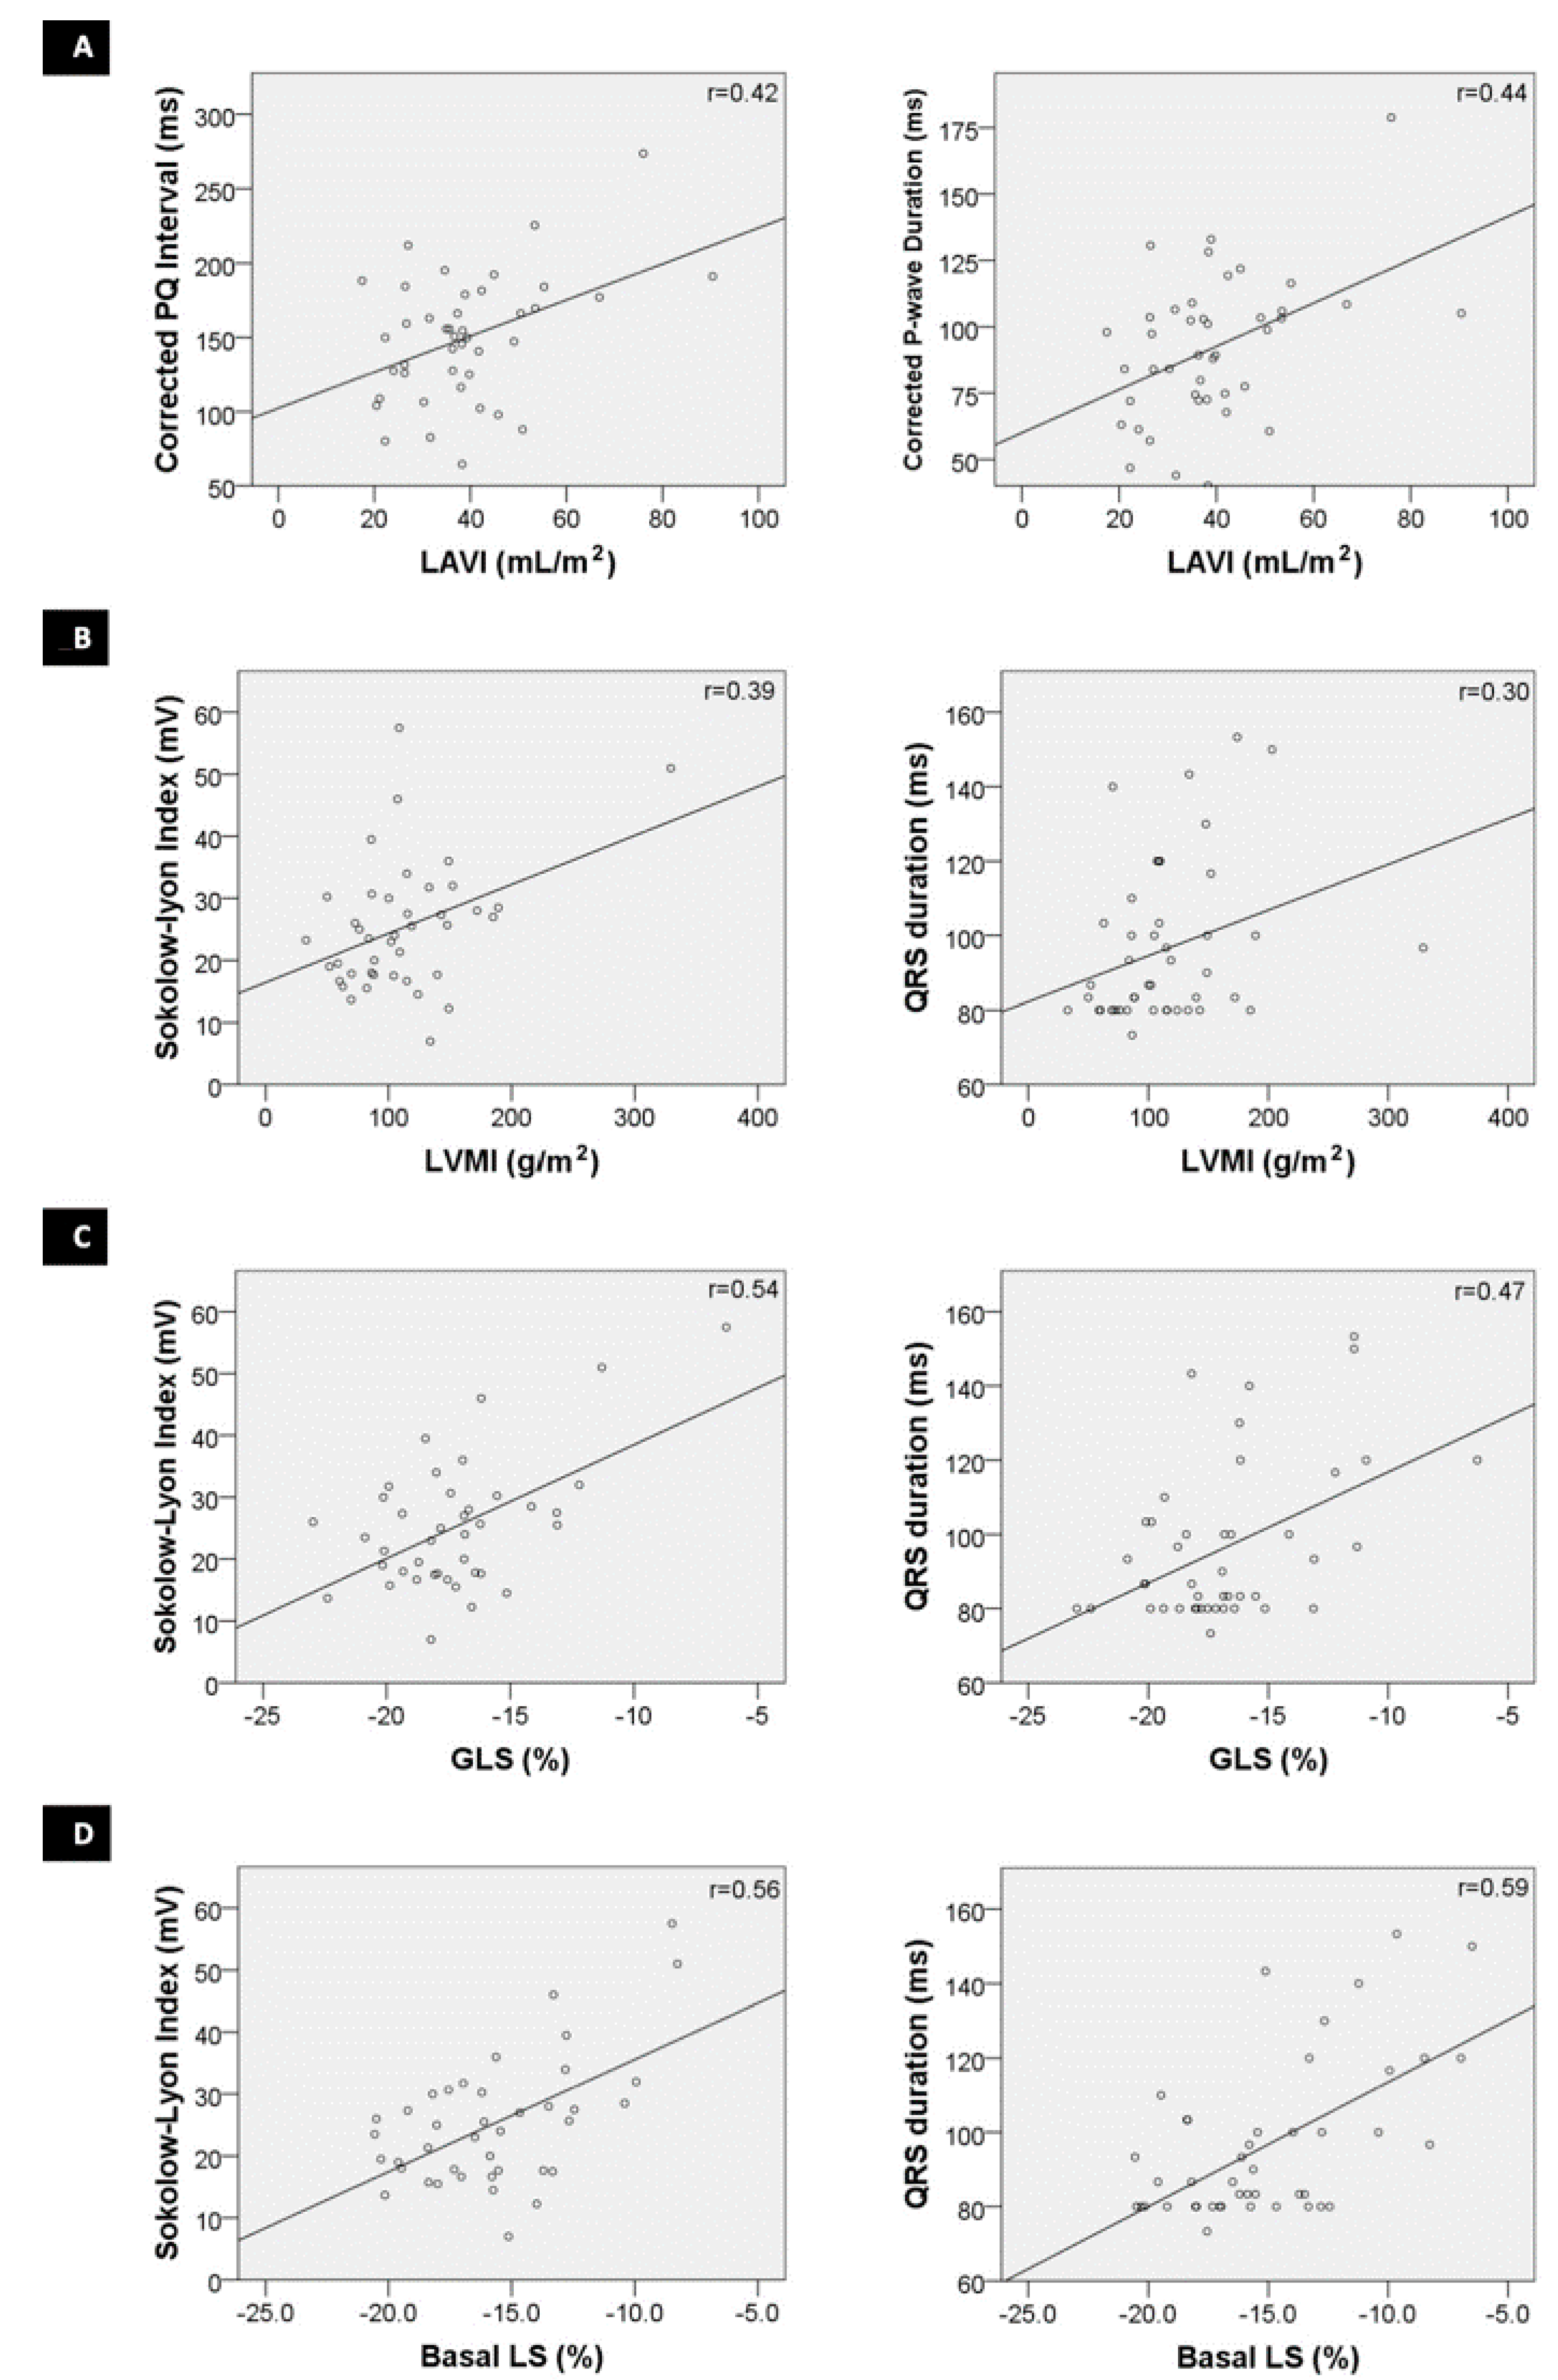
3.3. Correlation of Electrocardiographic and Echocardiographic Markers
3.4. ECG Characteristics in FD Patients with Altered TTE Parameters: Increased Wall Thickness, Altered GLS and Basal Segmental LS
3.5. Reproducibility of ECG Analysis
4. Discussion
4.1. ECG Parameters in FD Males and Females
4.2. Alterations in Conduction: PQ Interval and P-Wave Duration
4.3. Alterations in Conduction: QRS Interval and Right Bundle Branch Block
4.4. ECG for Detecting LVH (Sokolow–Lyon Criteria)
4.5. Correlating Electrocardiographic and Echocardiographic Parameters
4.6. Limitations
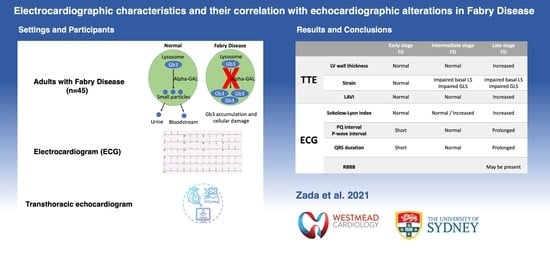
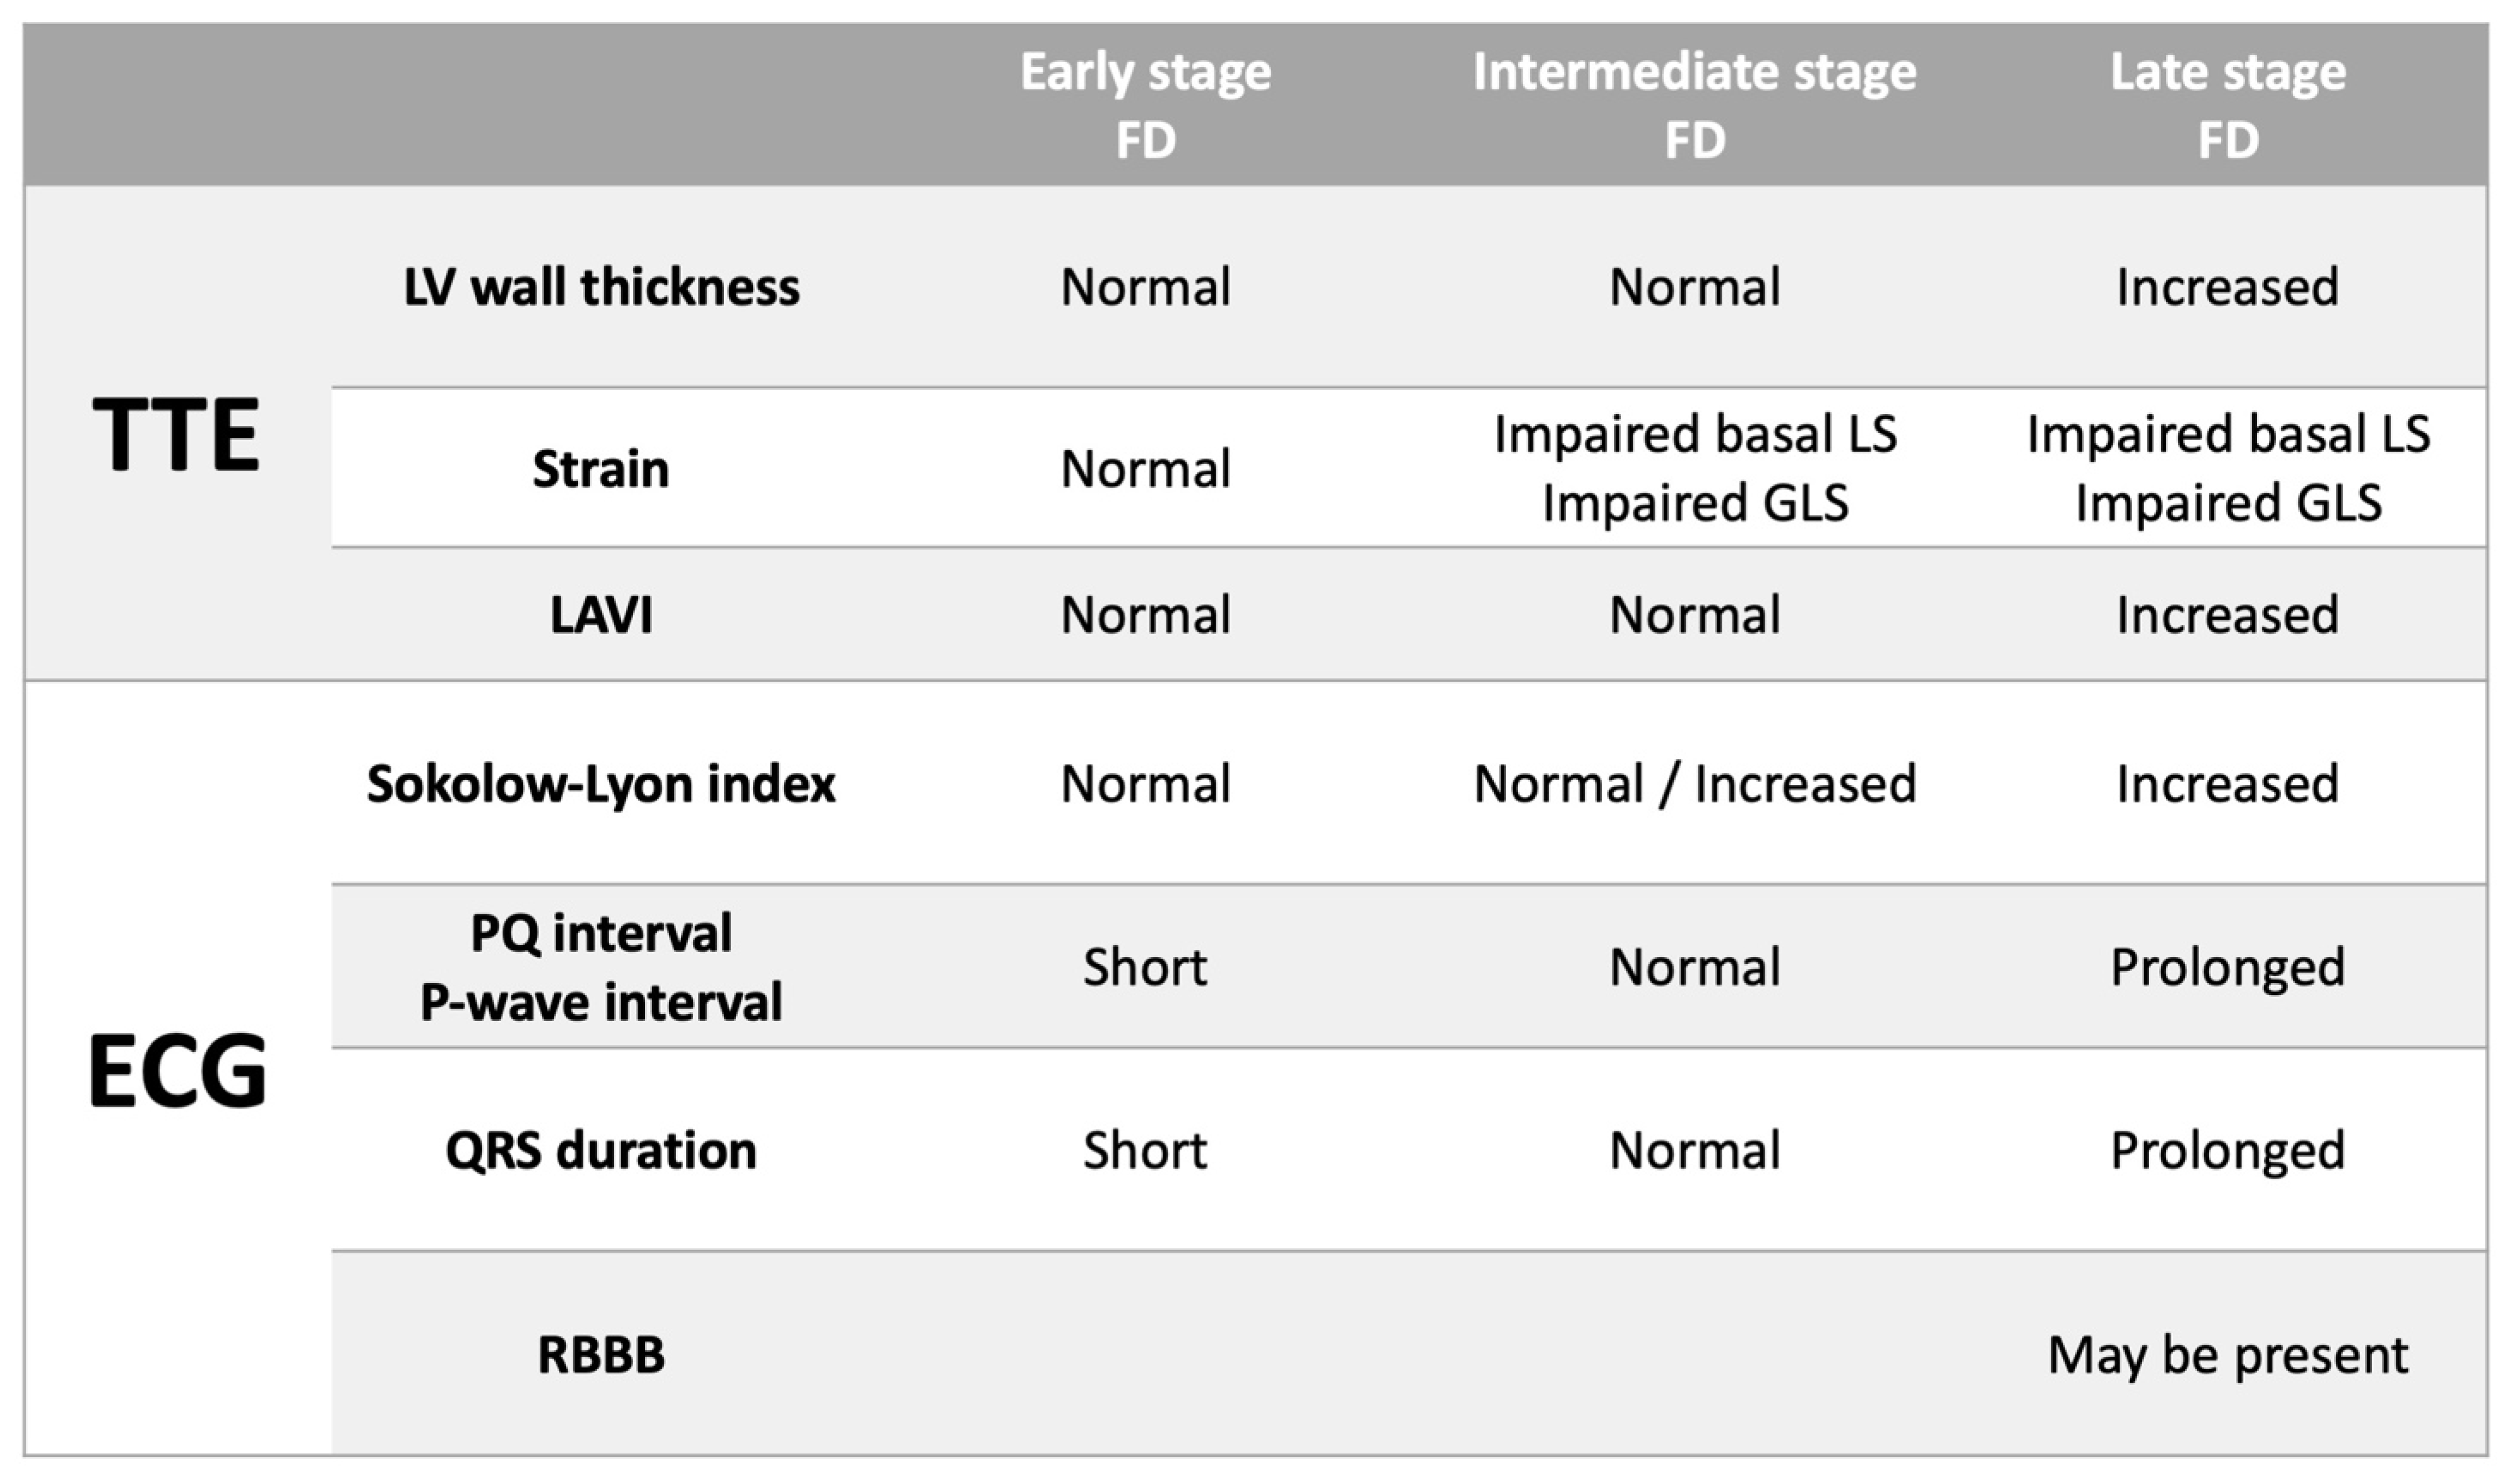
5. Conclusions
Supplementary Materials
Author Contributions
Funding
Institutional Review Board Statement
Informed Consent Statement
Conflicts of Interest
References
- Garman, S.C.; Garboczi, D.N. The molecular defect leading to Fabry disease: Structure of human alpha-galactosidase. J. Mol. Biol. 2004, 337, 319–335. [Google Scholar] [CrossRef]
- Favalli, V.; Disabella, E.; Molinaro, M. Genetic Screening of Anderson-Fabry Disease in Probands Referred From Multispecialty Clinics. J. Am. Coll Cardiol. 2016, 68, 1037–1050. [Google Scholar] [CrossRef]
- Linhart, A.; Elliott, P.M. The heart in Anderson-Fabry disease and other lysosomal storage disorders. Heart. 2007, 93, 528–535. [Google Scholar] [CrossRef] [Green Version]
- Weidemann, F.; Breunig, F.; Beer, M. The variation of morphological and functional cardiac manifestation in Fabry disease: Potential implications for the time course of the disease. Eur. Heart J. 2005, 26, 1221–1227. [Google Scholar] [CrossRef]
- Namdar, M. Electrocardiographic Changes and Arrhythmia in Fabry Disease. Front. Cardiovasc. Med. 2016, 3, 7. [Google Scholar] [CrossRef] [PubMed] [Green Version]
- Namdar, M.; Kampmann, C.; Steffel, J. PQ interval in patients with Fabry disease. Am. J. Cardiol. 2010, 105, 753–756. [Google Scholar] [CrossRef] [PubMed]
- Marafioti, V. The electrocardiographic features of Fabry disease and amyloidosis. Am. J. Emerg. Med. 2006, 24, 640. [Google Scholar] [CrossRef] [PubMed]
- Kampmann, C.; Wiethoff, C.M.; Martin, C. Electrocardiographic signs of hypertrophy in fabry disease-associated hypertrophic cardiomyopathy. Acta Paediat. Suppl. 2002, 91, 21–27. [Google Scholar] [CrossRef]
- Niemann, M.; Hartmann, T.; Namdar, M. Cross-sectional baseline analysis of electrocardiography in a large cohort of patients with untreated Fabry disease. J. Inherit. Metabol. Dis. 2013, 36, 873–879. [Google Scholar] [CrossRef]
- Pieroni, M.; Moon, J.C.; Arbustini, E. Cardiac Involvement in Fabry Disease: JACC Review Topic of the Week. J. Am. Coll Cardiol. 2021, 77, 922–936. [Google Scholar] [CrossRef] [PubMed]
- Namdar, M.; Richardot, P.; Johner, N. Recognition of pre-hypertrophic cardiac involvement in Fabry Disease based on automated electrocardiographic measures. Int. J. Cardiol. 2021, 338, 121–126. [Google Scholar] [CrossRef] [PubMed]
- Figliozzi, S.; Camporeale, A.; Boveri, S. ECG-based score estimates the probability to detect Fabry Disease cardiac involvement. Int. J. Cardiol. 2021, 339, 110–117. [Google Scholar] [CrossRef] [PubMed]
- Desnick, R.I.Y.; Eng, C. Fabry Disease: Alpha Galactosidase A Deficiency; McGraw Hill: New York, NY, USA, 1995. [Google Scholar]
- Mehta, A.; Ricci, R.; Widmer, U.; Dehout, F.; de Lorenzo, A.G.; Kampmann, C.; Linhart, A.; Sunder-Plassmann, G.; Ries, M.; Beck, M. Fabry disease defined: Baseline clinical manifestations of 366 patients in the Fabry Outcome Survey. Eur. J. Clin. Investig. 2004, 34, 236–242.e402. [Google Scholar] [CrossRef]
- Zada, M.; Lo, Q.; Boyd, A.C. Basal Segmental Longitudinal Strain: A Marker of Subclinical Myocardial Involvement in Anderson-Fabry Disease. J. Am. Soc. Echocardiogr. 2021, 34, 405–413.e402. [Google Scholar] [CrossRef] [PubMed]
- Namdar, M.; Steffel, J.; Jetzer, S. Value of electrocardiogram in the differentiation of hypertensive heart disease, hypertrophic cardiomyopathy, aortic stenosis, amyloidosis, and Fabry disease. Am. J. Cardiol. 2012, 109, 587–593. [Google Scholar] [CrossRef]
- Mitchell, C.; Rahko, P.S.; Blauwet, L.A. Guidelines for Performing a Comprehensive Transthoracic Echocardiographic Examination in Adults: Recommendations from the American Society of Echocardiography. J. Am. Soc. Echocardiogr. 2019, 32, 1–64. [Google Scholar] [CrossRef]
- Marwick, T.H.; Gillebert, T.C.; Aurigemma, G. Recommendations on the use of echocardiography in adult hypertension: A report from the European Association of Cardiovascular Imaging (EACVI) and the American Society of Echocardiography (ASE). Eur. Heart J. Cardiovasc. Imag. 2015, 16, 577–605. [Google Scholar] [CrossRef] [Green Version]
- Lang, R.M.; Badano, L.P.; Mor-Avi, V. Recommendations for cardiac chamber quantification by echocardiography in adults: An update from the American Society of Echocardiography and the European Association of Cardiovascular Imaging. J. Am. Soc. Echocardiogr. 2015, 28, 1–39.e14. [Google Scholar] [CrossRef] [Green Version]
- Nagata, Y.; Wu, V.C.; Otsuji, Y.; Takeuchi, M. Normal range of myocardial layer-specific strain using two-dimensional speckle tracking echocardiography. PLoS ONE 2017, 12, e0180584. [Google Scholar] [CrossRef] [PubMed]
- Linhart, A.; Germain, D.P.; Olivotto, I. An expert consensus document on the management of cardiovascular manifestations of Fabry disease. Eur. J. Heart Fail. 2020, 22, 1076–1096. [Google Scholar] [CrossRef]
- Wolf, C.M.; Arad, M.; Ahmad, F. Reversibility of PRKAG2 Glycogen-Storage Cardiomyopathy and Electrophysiological Manifestations. Circulation 2008, 117, 144–154. [Google Scholar] [CrossRef] [Green Version]
- Motwani, M.; Banypersad, S.; Woolfson, P.; Waldek, S. Enzyme replacement therapy improves cardiac features and severity of Fabry disease. Mol. Genet. Metabol. 2012, 107, 197–202. [Google Scholar] [CrossRef] [PubMed]
- Kansal, S.; Roitman, D.I.; Sheffield, L.T. A quantitative relationship of electrocardiographic criteria of left ventricular hypertrophy with echocardiographic left ventricular mass: A multivariate approach. Clin. Cardiol. 1983, 6, 456–463. [Google Scholar] [CrossRef]
- Romhilt, D.W.; Estes, E.H., Jr. A point-score system for the ECG diagnosis of left ventricular hypertrophy. Am. Heart J. 1968, 75, 752–758. [Google Scholar] [CrossRef]
- Braunstein, E.D.; Croft, L.B.; Halperin, J.L.; Liao, S.L. Improved scoring system for the electrocardiographic diagnosis of left ventricular hypertrophy. World J. Cardiol. 2019, 11, 94–102. [Google Scholar] [CrossRef]
- Sadick, N.; Thomas, L. Cardiovascular manifestations in Fabry disease: A clinical and echocardiographic study. Heart Lung Circul. 2007, 16, 200–206. [Google Scholar] [CrossRef]
- Wu, J.C.; Ho, C.Y.; Skali, H. Cardiovascular manifestations of Fabry disease: Relationships between left ventricular hypertrophy, disease severity, and alpha-galactosidase A activity. Eur. Heart J. 2010, 31, 1088–1097. [Google Scholar] [CrossRef] [Green Version]
- Akhtar, M.M.; Elliott, P.M. Anderson-Fabry disease in heart failure. Biophys. Rev. 2018, 10, 1107–1119. [Google Scholar] [CrossRef] [PubMed] [Green Version]
- Bressman, M.; Mazori, A.Y.; Shulman, E. Determination of Sensitivity and Specificity of Electrocardiography for Left Ventricular Hypertrophy in a Large, Diverse Patient Population. Am. J. Med. 2020, 133, e495–e500. [Google Scholar] [CrossRef]
- Mondillo, S.; Galderisi, M.; Mele, D. Speckle-tracking echocardiography: A new technique for assessing myocardial function. J. Ultrasound. Med. 2011, 30, 71–83. [Google Scholar] [CrossRef] [PubMed]
- Augusto, J.B.; Johner, N.; Shah, D. The myocardial phenotype of Fabry disease pre-hypertrophy and pre-detectable storage. Eur. Heart J. Cardiovasc. Imag. 2021, 22, 790–799. [Google Scholar] [CrossRef] [PubMed]
- Vijapurapu, R.; Nordin, S.; Baig, S. Global longitudinal strain, myocardial storage and hypertrophy in Fabry disease. Heart 2019, 105, 470–476. [Google Scholar] [CrossRef] [PubMed]

| (A) | |||||||||
|---|---|---|---|---|---|---|---|---|---|
| All FD Patients Compared to Matched Controls | Male FD Patients Compared to Matched Male Controls | Female FD Patients Compared to Matched Female Controls | |||||||
| FD [n = 45] | Controls [n = 45] | p-Value | Male FD [n = 26] | Male Controls [n = 26] | p-Value | Female FD [n = 19] | Female Controls [n = 19] | p-Value | |
| Age (yrs.) | 42 | 42 | 0.939 | 42 | 42 | 0.934 | 42 | 42 | 0.84 |
| Corrected PQ Interval (ms) | 150 | 137 | 0.051 | 169 | 148 | 0.027 † | 126 | 121 | 0.729 |
| Corrected PWD (ms) | 91 | 81 | 0.022 † | 105 | 88 | 0.008 † | 74 | 72 | 0.644 |
| QRS duration (ms) | 96 | 84 | <0.001 † | 103 | 85 | <0.001 † | 87 | 82 | 0.271 |
| R wave amplitude lead I (mV) | 8.1 | 5.7 | 0.047 † | 9.1 | 5.8 | 0.014 † | 6.7 | 5.6 | 0.885 |
| Sokolow–Lyon index (mV) | 25 | 19 | 0.002 † | 28.4 | 19.6 | 0.008 † | 21.5 | 17.7 | 0.065 |
| Sokolow–Lyon LVH criteria | 14/45 (31%) | 3/45 (7%) | 0.006 † | 11/26 (42%) | 2/26 (8%) | 0.009 † | 3/19 (16%) | 1/19 (5%) | 0.604 |
| Modified Cornell Index (mV) | 4.2 | 3 | 0.507 | 5.3 | 3.2 | 0.374 | 2.7 | 2.7 | 0.965 |
| Modified Cornell LVH criteria | Apr-45 | 0/45 | 0.117 | 26-Apr | 0/26 | 0.11 | 0/19 | 0/19 | - |
| RBBB criteria | 5/45 (11%) | 2/45 (4%) | 0.434 | 5/26 (19%) | 2/26 (8%) | 0.419 | 0/19 | 0/19 | - |
| (B) | |||||||||
| ECG Parameters | Male FD [n = 26] | Female FD [n = 19] | p-value | ||||||
| Age (yrs) | 42 | 42 | 0.818 | ||||||
| Corrected PQ Interval (ms) | 169 | 126 | 0.001 † | ||||||
| Corrected PWD (ms) | 105 | 74 | <0.001 † | ||||||
| QRS duration (ms) | 103 | 87 | 0.004 † | ||||||
| R wave amplitude lead I (mV) | 9.1 | 6.7 | 0.051 | ||||||
| Sokolow–Lyon index (mV) | 28.4 | 21.5 | 0.043 † | ||||||
| Sokolow–Lyon LVH criteria | 11/26 (42%) | 3/19 (16%) | 0.102 | ||||||
| Modified Cornell Index (mV) | 5.3 | 2.7 | 0.164 | ||||||
| Modified Cornell LVH criteria | 4/26 | 0/19 | 0.126 | ||||||
| RBBB criteria | 5/26 (19%) | 0/19 | 0.063 | ||||||
| LVH on TTE | 20/26 (77%) | 7/19 (37%) | 0.013 † | ||||||
| Impaired GLS on TTE | 18/26 (69%) | 10/18 (55%) | 0.525 | ||||||
| Impaired Basal LS on TTE | 23/26 (89%%) | 11/18 (61%) | 0.064 | ||||||
| Normal LV Wall Thickness & Normal Basal LS [n = 8] [Group A] | Normal LV Wall Thickness & Impaired Basal LS [n = 9] [Group B] | Increased LV Wall Thickness & Impaired Basal LS [n = 25] [Group C] | |
|---|---|---|---|
| Clinical characteristics | |||
| Age | 31 | 46 * | 45 |
| Males | 3 (38%) | 3 (33%) | 20 (80%) |
| ERT—no. on ERT at time of simultaneous ECG/TTE | 0 | 1 (11%) | 6 (24%) |
| ERT—total no. who were treated with ERT after ECG/TTE | 1 (13%) | 4 (44%) | 21 (84%) |
| Albuminuria/Chronic kidney disease | 0 | 1 (11%) | 12 (48%) |
| Dyslipidaemia | 1 (13%) | 5 (56%) | 15 (60%) |
| Diabetes mellitus | 0 | 2 (22%) | 1 (4%) |
| Arterial hypertension | 0 | 2 (22%) | 15 (60%) |
| Transient ischaemic attack / stroke | 1 (13%) | 2 (22%) | 5 (20%) |
| Ischaemic heart disease | 0 | 1 (11%) | 2 (8%) |
| Echocardiographic parameters | |||
| Average LV wall thickness (mm) | 8.3 | 7.5 | 14.6 + |
| Left ventricular mass index (g/m2) | 73.4 | 76.9 | 141.9 + |
| LVEF (%) | 61 | 60 | 61 |
| Peak E (cm/s) | 98 | 93 | 78 |
| Peak A (cm/s) | 63 | 64 | 66 |
| E/A | 1.61 | 1.63 | 1.26 |
| Lateral e’ (cm/s) | 14 | 12 | 9 + |
| Septal e’ (cm/s) | 11 | 9 * | 7 |
| Average E/e’ | 8.22 | 9.68 | 11.0 |
| LAVI (mL/m2) | 44.6 | 40.7 | 36.8 |
| Valvular disease | Moderate MR—1 Mitral prolapse—1 (mild) | Mild MR—2 Mild TR—3 | Moderate MR—3 Moderate PR—1 Mild MR—1 Mild TR—2 Mild AS—1 |
| ECG paramaters | |||
| Corrected PQ Interval (ms) | 138 | 146 | 160 |
| Corrected PWD (ms) | 85 | 87 | 98 |
| QRS duration (ms) | 90 | 88 | 102 |
| R wave amplitude lead I (mV) | 5.1 | 6.0 | 10.3+ |
| Sokolow–Lyon index (mV) | 20.7 | 22.6 | 28.0 |
| Sokolow–Lyon LVH criteria | 0/8 | 1/9 (11%) | 13/25 (52%) + |
| Modified Cornell index (mV) | 2.3 | 2.4 | 5.7 |
| Modified Cornell LVH criteria | 0/8 | 0/9 | 4/25 (16%) |
| RBBB criteria | 0/8 | 1/9 (11%) | 4/25 (16%) |
Publisher’s Note: MDPI stays neutral with regard to jurisdictional claims in published maps and institutional affiliations. |
© 2022 by the authors. Licensee MDPI, Basel, Switzerland. This article is an open access article distributed under the terms and conditions of the Creative Commons Attribution (CC BY) license (https://creativecommons.org/licenses/by/4.0/).
Share and Cite
Zada, M.; Lo, Q.; Trivedi, S.J.; Harapoz, M.; Boyd, A.C.; Devine, K.; Sadick, N.; Tchan, M.C.; Thomas, L. Electrocardiographic Characteristics and Their Correlation with Echocardiographic Alterations in Fabry Disease. J. Cardiovasc. Dev. Dis. 2022, 9, 11. https://doi.org/10.3390/jcdd9010011
Zada M, Lo Q, Trivedi SJ, Harapoz M, Boyd AC, Devine K, Sadick N, Tchan MC, Thomas L. Electrocardiographic Characteristics and Their Correlation with Echocardiographic Alterations in Fabry Disease. Journal of Cardiovascular Development and Disease. 2022; 9(1):11. https://doi.org/10.3390/jcdd9010011
Chicago/Turabian StyleZada, Matthew, Queenie Lo, Siddharth J. Trivedi, Mehmet Harapoz, Anita C. Boyd, Kerry Devine, Norman Sadick, Michel C. Tchan, and Liza Thomas. 2022. "Electrocardiographic Characteristics and Their Correlation with Echocardiographic Alterations in Fabry Disease" Journal of Cardiovascular Development and Disease 9, no. 1: 11. https://doi.org/10.3390/jcdd9010011
APA StyleZada, M., Lo, Q., Trivedi, S. J., Harapoz, M., Boyd, A. C., Devine, K., Sadick, N., Tchan, M. C., & Thomas, L. (2022). Electrocardiographic Characteristics and Their Correlation with Echocardiographic Alterations in Fabry Disease. Journal of Cardiovascular Development and Disease, 9(1), 11. https://doi.org/10.3390/jcdd9010011