
Can the Addition of NT-proBNP and Glucose Measurements Improve the Prognostication of High-Sensitivity Cardiac Troponin Measurements for Patients with Suspected Acute Coronary Syndrome?

 ,
,
Abstract
:
1. Introduction
2. Methods
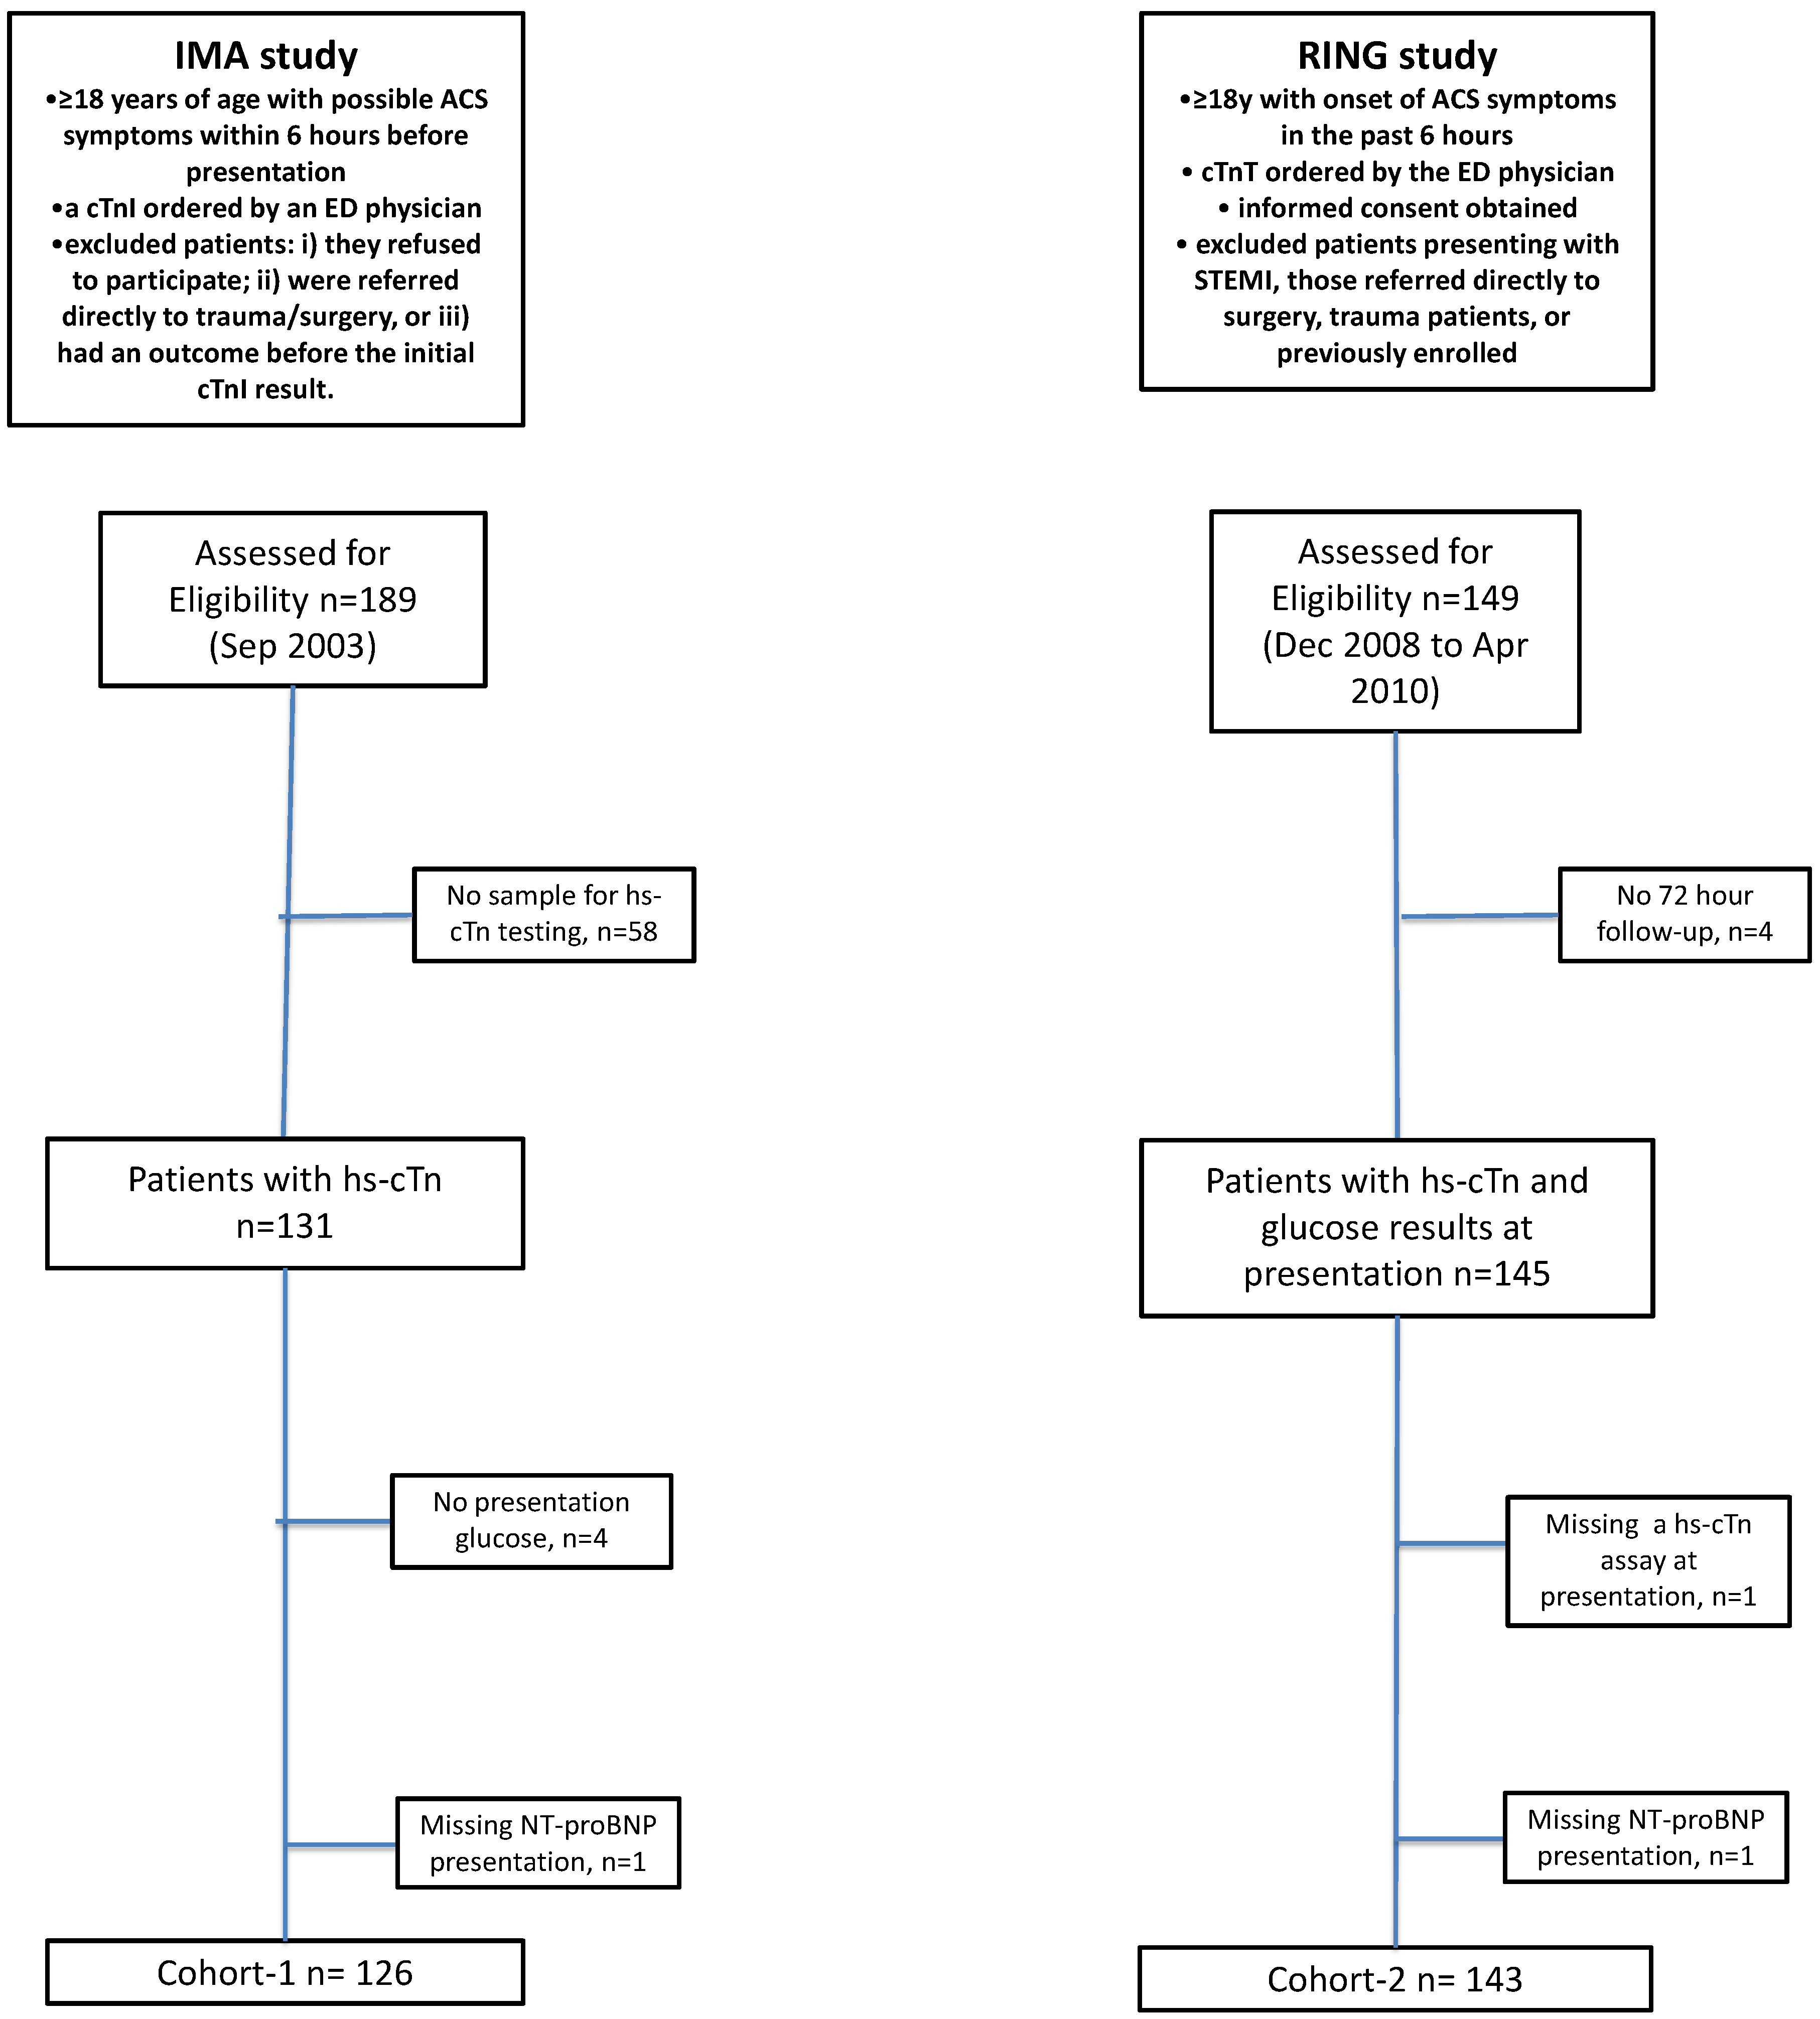
2.1. Study Cohorts
2.2. Outcomes
2.3. Statistical Analysis
3. Results
4. Discussion
Author Contributions
Funding
Institutional Review Board Statement
Informed Consent Statement
Data Availability Statement
Acknowledgments
Conflicts of Interest
References
- Collet, J.-P.; Thiele, H.; Barbato, E.; Barthélémy, O.; Bauersachs, J.; Bhatt, D.L.; Dendale, P.; Dorobantu, M.; Edvardsen, T.; Folliguet, T.; et al. 2020 ESC Guidelines for the management of acute coronary syndromes in patients presenting without persistent ST-segment elevation. Eur. Heart J. 2021, 42, 1289–1367. [Google Scholar] [CrossRef]
- Bozkurt, B.; Coats, A.J.; Tsutsui, H.; Abdelhamid, C.M.; Adamopoulos, S.; Albert, N.; Anker, S.D.; Atherton, J.; Böhm, M.; Butler, J.; et al. Universal definition and classification of heart failure: A report of the Heart Failure Society of America, Heart Failure Association of the European Society of Cardiology, Japanese Heart Failure Society and Writing Committee of the Universal Definition of Heart Failure. J. Card. Fail. 2021, 23, 352–380. [Google Scholar] [CrossRef]
- Segar, M.W.; Jaeger, B.C.; Patel, K.V.; Nambi, V.; Ndumele, C.E.; Correa, A.; Butler, J.; Chandra, A.; Ayers, C.; Rao, S.; et al. Development and Validation of Machine Learning-Based Race-Specific Models to Predict 10-Year Risk of Heart Failure: A Multi-Cohort Analysis. Circulation 2021, 143, 2370–2383. [Google Scholar] [CrossRef]
- Kavsak, P.A.; Neumann, J.; Cullen, L.; Than, M.; Shortt, C.; Greenslade, J.H.; Pickering, J.W.; Ojeda, F.; Ma, J.; Clayton, N.; et al. Clinical chemistry score versus high-sensitivity cardiac troponin I and T tests alone to identify patients at low or high risk for myocardial infarction or death at presentation to the emergency department. Can. Med. Assoc. J. 2018, 190, E974–E984. [Google Scholar] [CrossRef] [Green Version]
- Kavsak, P.A.; Cerasuolo, J.O.; Mondoux, S.E.; Sherbino, J.; Ma, J.; Hoard, B.K.; Perez, R.; Seow, H.; Ko, D.T.; Worster, A. Risk Stratification for Patients with Chest Pain Discharged Home from the Emergency Department. J. Clin. Med. 2020, 9, 2948. [Google Scholar] [CrossRef]
- Kavsak, P.A.; Cerasuolo, J.O.; Ko, D.T.; Ma, J.; Sherbino, J.; Mondoux, S.E.; Clayton, N.; Hill, S.A.; McQueen, M.; Griffith, L.E.; et al. Using the clinical chemistry score in the emergency department to detect adverse cardiac events: A diagnostic accuracy study. CMAJ Open 2020, 8, E676–E684. [Google Scholar] [CrossRef] [PubMed]
- Wildi, K.; Boeddinghaus, J.; Nestelberger, T.; Haaf, P.; Koechlin, L.; Ayala Lopez, P.; Walter, J.; Badertscher, P.; Ratmann, P.D.; Miró, Ò.; et al. External validation of the clinical chemistry score. Clin. Biochem. 2021, 91, 16–25. [Google Scholar] [CrossRef] [PubMed]
- Liu, L.; Mathias, A.; Kwong, T.; Worster, A.; Kavsak, P.A. Clinical chemistry score misses fewer deaths as compared to troponin T alone in a United States emergency department population. Clin. Biochem. 2021, 95, 91–92. [Google Scholar] [CrossRef]
- McQueen, M.J.; Kavsak, P.A.; Xu, L.; Shestakovska, O.; Yusuf, S. Predicting myocardial infarction and other serious cardiac outcomes using high-sensitivity cardiac troponin T in a high-risk stable population. Clin. Biochem. 2013, 46, 5–9. [Google Scholar] [CrossRef] [PubMed]
- Omland, T.; Pfeffer, M.A.; Solomon, S.D.; de Lemos, J.A.; Røsjø, H.; Šaltytė Benth, J.; Maggioni, A.; Domanski, M.J.; Rouleau, J.L.; Sabatine, M.S.; et al. Prognostic value of cardiac troponin I measured with a highly sensitive assay in patients with stable coronary artery disease. J. Am. Coll. Cardiol. 2013, 61, 1240–1249. [Google Scholar] [CrossRef] [Green Version]
- Selvin, E.; Lazo, M.; Chen, Y.; Shen, L.; Rubin, J.; McEvoy, J.W.; Hoogeveen, R.C.; Sharrett, A.R.; Ballantyne, C.M.; Coresh, J. Diabetes, Pre-Diabetes and Incidence of Subclinical Myocardial Damage. Circulation 2014, 130, 1374–1382. [Google Scholar] [CrossRef] [PubMed] [Green Version]
- Wu, A.H.; Christenson, R.H.; Greene, D.N.; Jaffe, A.S.; Kavsak, P.A.; Ordonez-Llanos, J.; Apple, F.S. Clinical Laboratory Practice Recommendations for the Use of Cardiac Troponin in Acute Coronary Syndrome: Expert Opinion from the Academy of the American Association for Clinical Chemistry and the Task Force on Clinical Applications of Cardiac Bio-Markers of the International Federation of Clinical Chemistry and Laboratory Medicine. Clin. Chem. 2018, 64, 645–655. [Google Scholar] [CrossRef]
- Bjurman, C.; Petzold, M.; Venge, P.; Farbemo, J.; Fu, M.L.; Hammarsten, O. High-sensitive cardiac troponin, NT-proBNP, hFABP and copeptin levels in relation to glomerular filtration rates and a medical record of cardiovascular disease. Clin. Biochem. 2015, 48, 302–307. [Google Scholar] [CrossRef] [PubMed] [Green Version]
- Kavsak, P.A.; Hill, S.A.; Supapol, W.B.; Devereaux, P.; Worster, A. Biomarkers for Predicting Serious Cardiac Outcomes at 72 Hours in Patients Presenting Early after Chest Pain Onset with Symptoms of Acute Coronary Syndromes. Clin. Chem. 2012, 58, 298–302. [Google Scholar] [CrossRef] [Green Version]
- Kavsak, P.A.; Worster, A.; You, J.J.; Oremus, M.; Shortt, C.; Phan, K.; Sohn, K.-Y.; Veljkovic, K.; Devereaux, P.J.; Hill, S.; et al. Ninety-Minute vs 3-h Performance of High-Sensitivity Cardiac Troponin Assays for Predicting Hospitalization for Acute Coronary Syndrome. Clin. Chem. 2013, 59, 1407–1410. [Google Scholar] [CrossRef] [PubMed] [Green Version]
- Worster, A.; Devereaux, P.; Heels-Ansdell, D.; Guyatt, G.H.; Opie, J.; Mookadam, F.; Hill, S.A. Capability of ischemia-modified albumin to predict serious cardiac outcomes in the short term among patients with potential acute coronary syndrome. Can. Med. Assoc. J. 2005, 172, 1685–1690. [Google Scholar] [CrossRef] [Green Version]
- Pickering, J.W.; Greenslade, J.H.; Cullen, L.; Flaws, D.; Parsonage, W.; Aldous, S.; George, P.; Worster, A.; Kavsak, P.A.; Than, M.P. Assessment of the European Society of Cardiology 0-Hour/1-Hour Algorithm to Rule-Out and Rule-In Acute Myocardial Infarction. Circulation 2016, 134, 1532–1541. [Google Scholar] [CrossRef]
- Shortt, C.; Phan, K.; Hill, S.A.; Worster, A.; Kavsak, P.A. An approach to rule-out an acute cardiovascular event or death in emergency department patients using outcome-based cutoffs for high-sensitivity cardiac troponin assays and glucose. Clin. Biochem. 2015, 48, 282–287. [Google Scholar] [CrossRef]
- Gallagher, E. Clinical utility of likelihood ratios. Ann. Emerg. Med. 1998, 31, 391–397. [Google Scholar] [CrossRef]
- Delong, E.R.; Delong, D.M.; Clarke-Pearson, D.L. Comparing the Areas under Two or More Correlated Receiver Operating Characteristic Curves: A Nonparametric Approach. Biometrics 1988, 44, 837. [Google Scholar] [CrossRef]
- Kavsak, P.A.; Shortt, C.; Ma, J.; Clayton, N.; Sherbino, J.; Hill, S.A.; McQueen, M.; Mehta, S.R.; Devereaux, P.; Worster, A. A laboratory score at presentation to rule-out serious cardiac outcomes or death in patients presenting with symptoms suggestive of acute coronary syndrome. Clin. Chim. Acta 2017, 469, 69–74. [Google Scholar] [CrossRef] [PubMed]
- Kavsak, P.A.; McRae, A.; Vatanpour, S.; Ismail, O.Z.; Worster, A. A Multicenter Assessment of the Sensitivity and Specificity for a Single High-Sensitivity Cardiac Troponin Test at Emergency Department Presentation for Hospital Admission. J. Appl. Lab. Med. 2019, 4, 170–179. [Google Scholar] [CrossRef]
- Neumann, J.; Twerenbold, R.; Ojeda, F.; Sörensen, N.A.; Chapman, A.; Shah, A.; Anand, A.; Boeddinghaus, J.; Nestelberger, T.; Badertscher, P.; et al. Application of High-Sensitivity Troponin in Suspected Myocardial Infarction. N. Engl. J. Med. 2019, 380, 2529–2540. [Google Scholar] [CrossRef] [PubMed]
- Kavsak, P.A.; Hewitt, M.K.; Mondoux, S.E.; Cerasuolo, J.O.; Ma, J.; Clayton, N.; McQueen, M.; Griffith, L.E.; Perez, R.; Seow, H.; et al. Diagnostic Performance of Serial High-Sensitivity Cardiac Troponin Measurements in the Emergency Setting. J. Cardiovasc. Dev. Dis. 2021, 8, 97. [Google Scholar] [CrossRef] [PubMed]


| Variable | Cohort-1 (n = 126) | Cohort-2 (n = 143) |
|---|---|---|
| Age, Years | 59 (49–72) | 60 (49–70) |
| Sex, Male | 78 (62%) | 92 (64%) |
| Presenting with Chest Pain | 107 (85%) | 133 (93%) |
| Glucose, mmol/L | 6.2 (5.4–7.4) | 6.0 (5.2–7.8) |
| Glucose ≥ 5.6 mmol/L | 88 (70%) | 94 (66%) |
| NT-proBNP, ng/L | 138 (38–504) | 136 (33–325) |
| NT-proBNP ≥ 125 ng/L | 67 (53%) | 76 (53%) |
| hs-cTnT, ng/L | 5 (<3–16) | 7 (<3–17) |
| hs-cTnT > 14 ng/L | 33 (26%) | 44 (31%) |
| hs-cTnI, ng/L | 7 (4–15) | 2 (<1–10) |
| hs-cTnI > 26 ng/L | 19 (15%) | 23 (16%) |
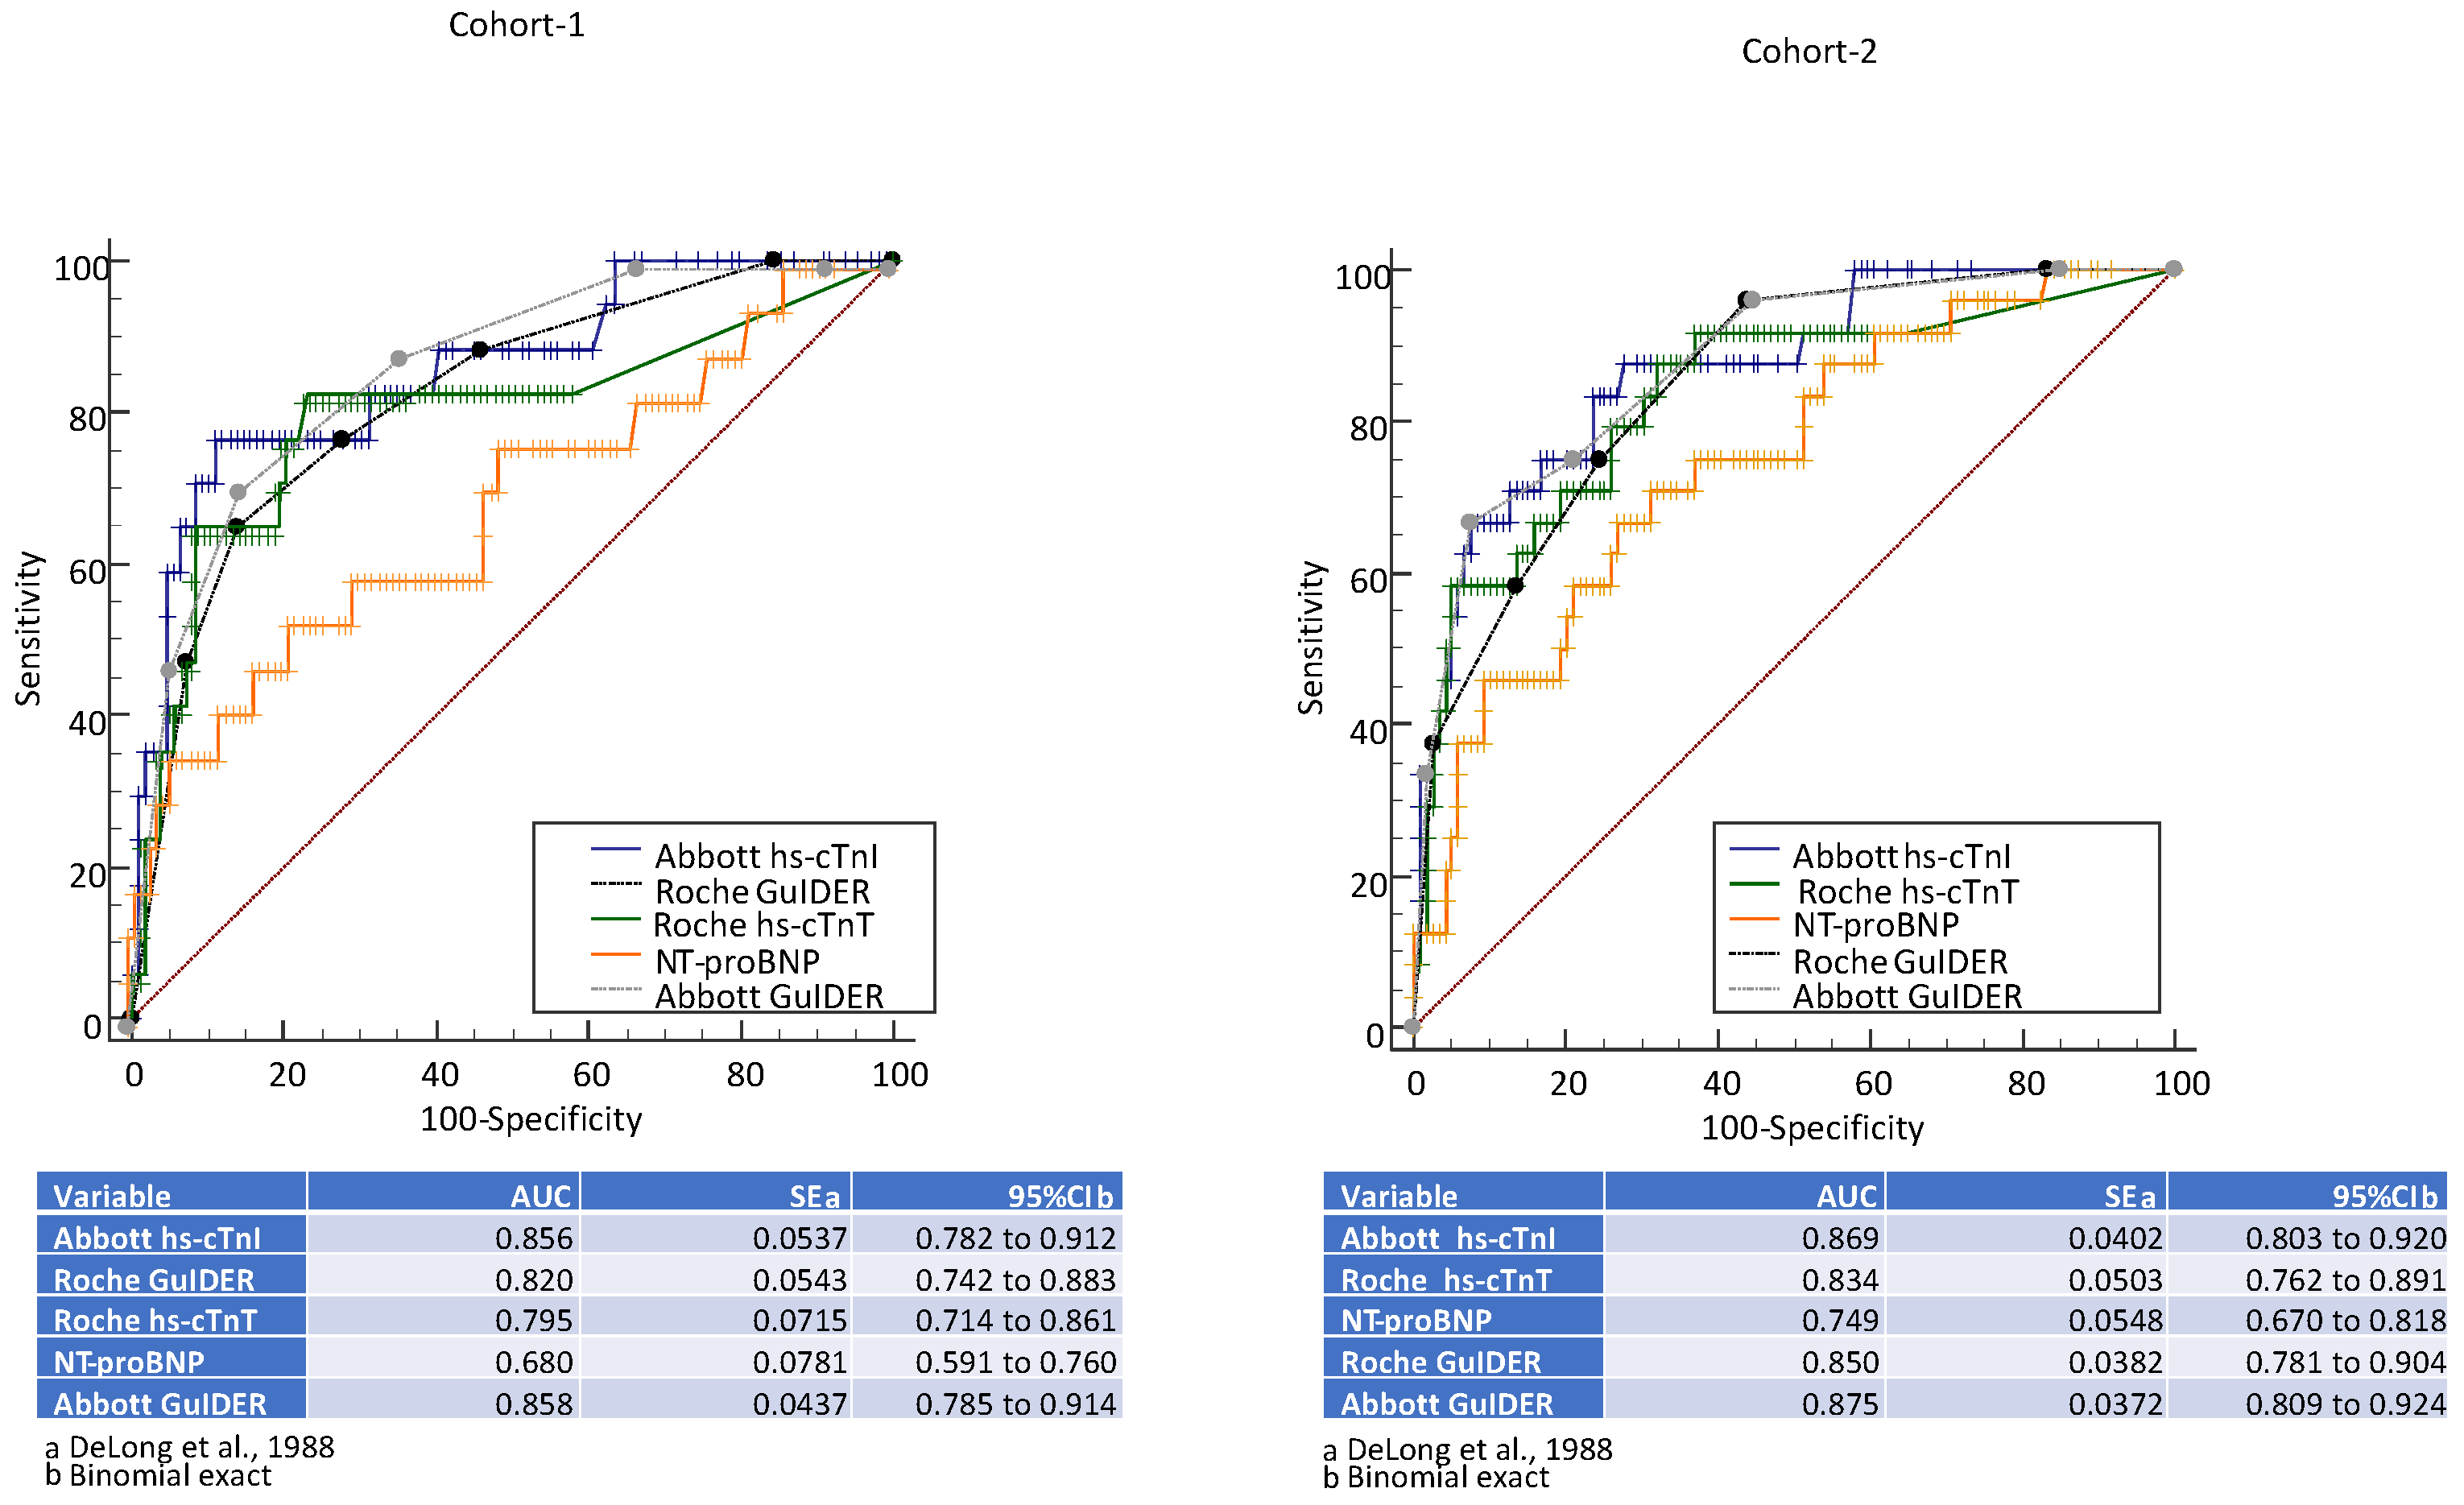
| Roche GuIDER Scores in Cohort-1 (AUC = 0.82) | ||||||||
| Criterion | Sensitivity | 95% CI | Specificity | 95% CI | +LR | 95% CI | −LR | 95% CI |
| >0 | 100 | 80.5–100.0 | 15.6 | 9.4–23.8 | 1.18 | 1.1–1.3 | 0.00 | |
| >1 | 88.2 | 63.6–98.5 | 54.1 | 44.3–63.7 | 1.92 | 1.5–2.5 | 0.22 | 0.06–0.8 |
| >2 | 76.5 | 50.1–93.2 | 72.5 | 63.1–80.6 | 2.78 | 1.9–4.2 | 0.32 | 0.1–0.8 |
| >3 | 64.7 | 38.3–85.8 | 86.2 | 78.3–92.1 | 4.70 | 2.6–8.5 | 0.41 | 0.2–0.8 |
| >4 | 47.1 | 23.0–72.2 | 92.7 | 86.0–96.8 | 6.41 | 2.8–14.8 | 0.57 | 0.4–0.9 |
| Roche GuIDER Scores in Cohort-2 (AUC = 0.85) | ||||||||
| Criterion | Sensitivity | 95% CI | Specificity | 95% CI | +LR | 95% CI | −LR | 95% CI |
| >0 | 100 | 85.8–100.0 | 16.8 | 10.6–24.8 | 1.20 | 1.1–1.3 | 0.00 | |
| >1 | 95.8 | 78.9–99.9 | 56.3 | 46.9–65.4 | 2.19 | 1.8–2.7 | 0.074 | 0.01–0.5 |
| >2 | 75.0 | 53.3–90.2 | 75.6 | 66.9–83.0 | 3.08 | 2.1–4.6 | 0.33 | 0.2–0.7 |
| >3 | 58.3 | 36.6–77.9 | 86.6 | 79.1–92.1 | 4.34 | 2.5–7.7 | 0.48 | 0.3–0.8 |
| >4 | 37.5 | 18.8–59.4 | 97.5 | 92.8–99.5 | 14.87 | 4.3–50.9 | 0.64 | 0.5–0.9 |
| Abbott GuIDER Scores in Cohort-1 (AUC = 0.86) | ||||||||
| Criterion | Sensitivity | 95% CI | Specificity | 95% CI | +LR | 95% CI | −LR | 95% CI |
| >1 | 100 | 80.5–100.0 | 33.0 | 24.3–42.7 | 1.49 | 1.3–1.7 | 0.00 | |
| >2 | 88.2 | 63.6–98.5 | 64.2 | 54.5–73.2 | 2.47 | 1.8–3.3 | 0.18 | 0.05–0.7 |
| >3 | 70.6 | 44.0–89.7 | 85.3 | 77.3–91.4 | 4.81 | 2.8–8.3 | 0.34 | 0.2–0.7 |
| >4 | 47.1 | 23.0–72.2 | 94.5 | 88.4–98.0 | 8.55 | 3.4–21.6 | 0.56 | 0.4–0.9 |
| Abbott GuIDER Scores in Cohort-2 (AUC = 0.88) | ||||||||
| Criterion | Sensitivity | 95% CI | Specificity | 95% CI | +LR | 95% CI | −LR | 95% CI |
| >0 | 100 | 85.8–100.0 | 15.1 | 9.2–22.8 | 1.18 | 1.1–1.3 | 0.00 | |
| >1 | 95.8 | 78.9–99.9 | 55.5 | 46.1–64.6 | 2.15 | 1.7–2.7 | 0.075 | 0.01–0.5 |
| >2 | 75.0 | 53.3–90.2 | 79.0 | 70.6–85.9 | 3.57 | 2.4–5.4 | 0.32 | 0.2–0.6 |
| >3 | 66.7 | 44.7–84.4 | 92.4 | 86.1–96.5 | 8.81 | 4.4–17.6 | 0.36 | 0.2–0.6 |
| >4 | 33.3 | 15.6–55.3 | 98.3 | 94.1–99.8 | 19.83 | 4.5–87.7 | 0.68 | 0.5–0.9 |
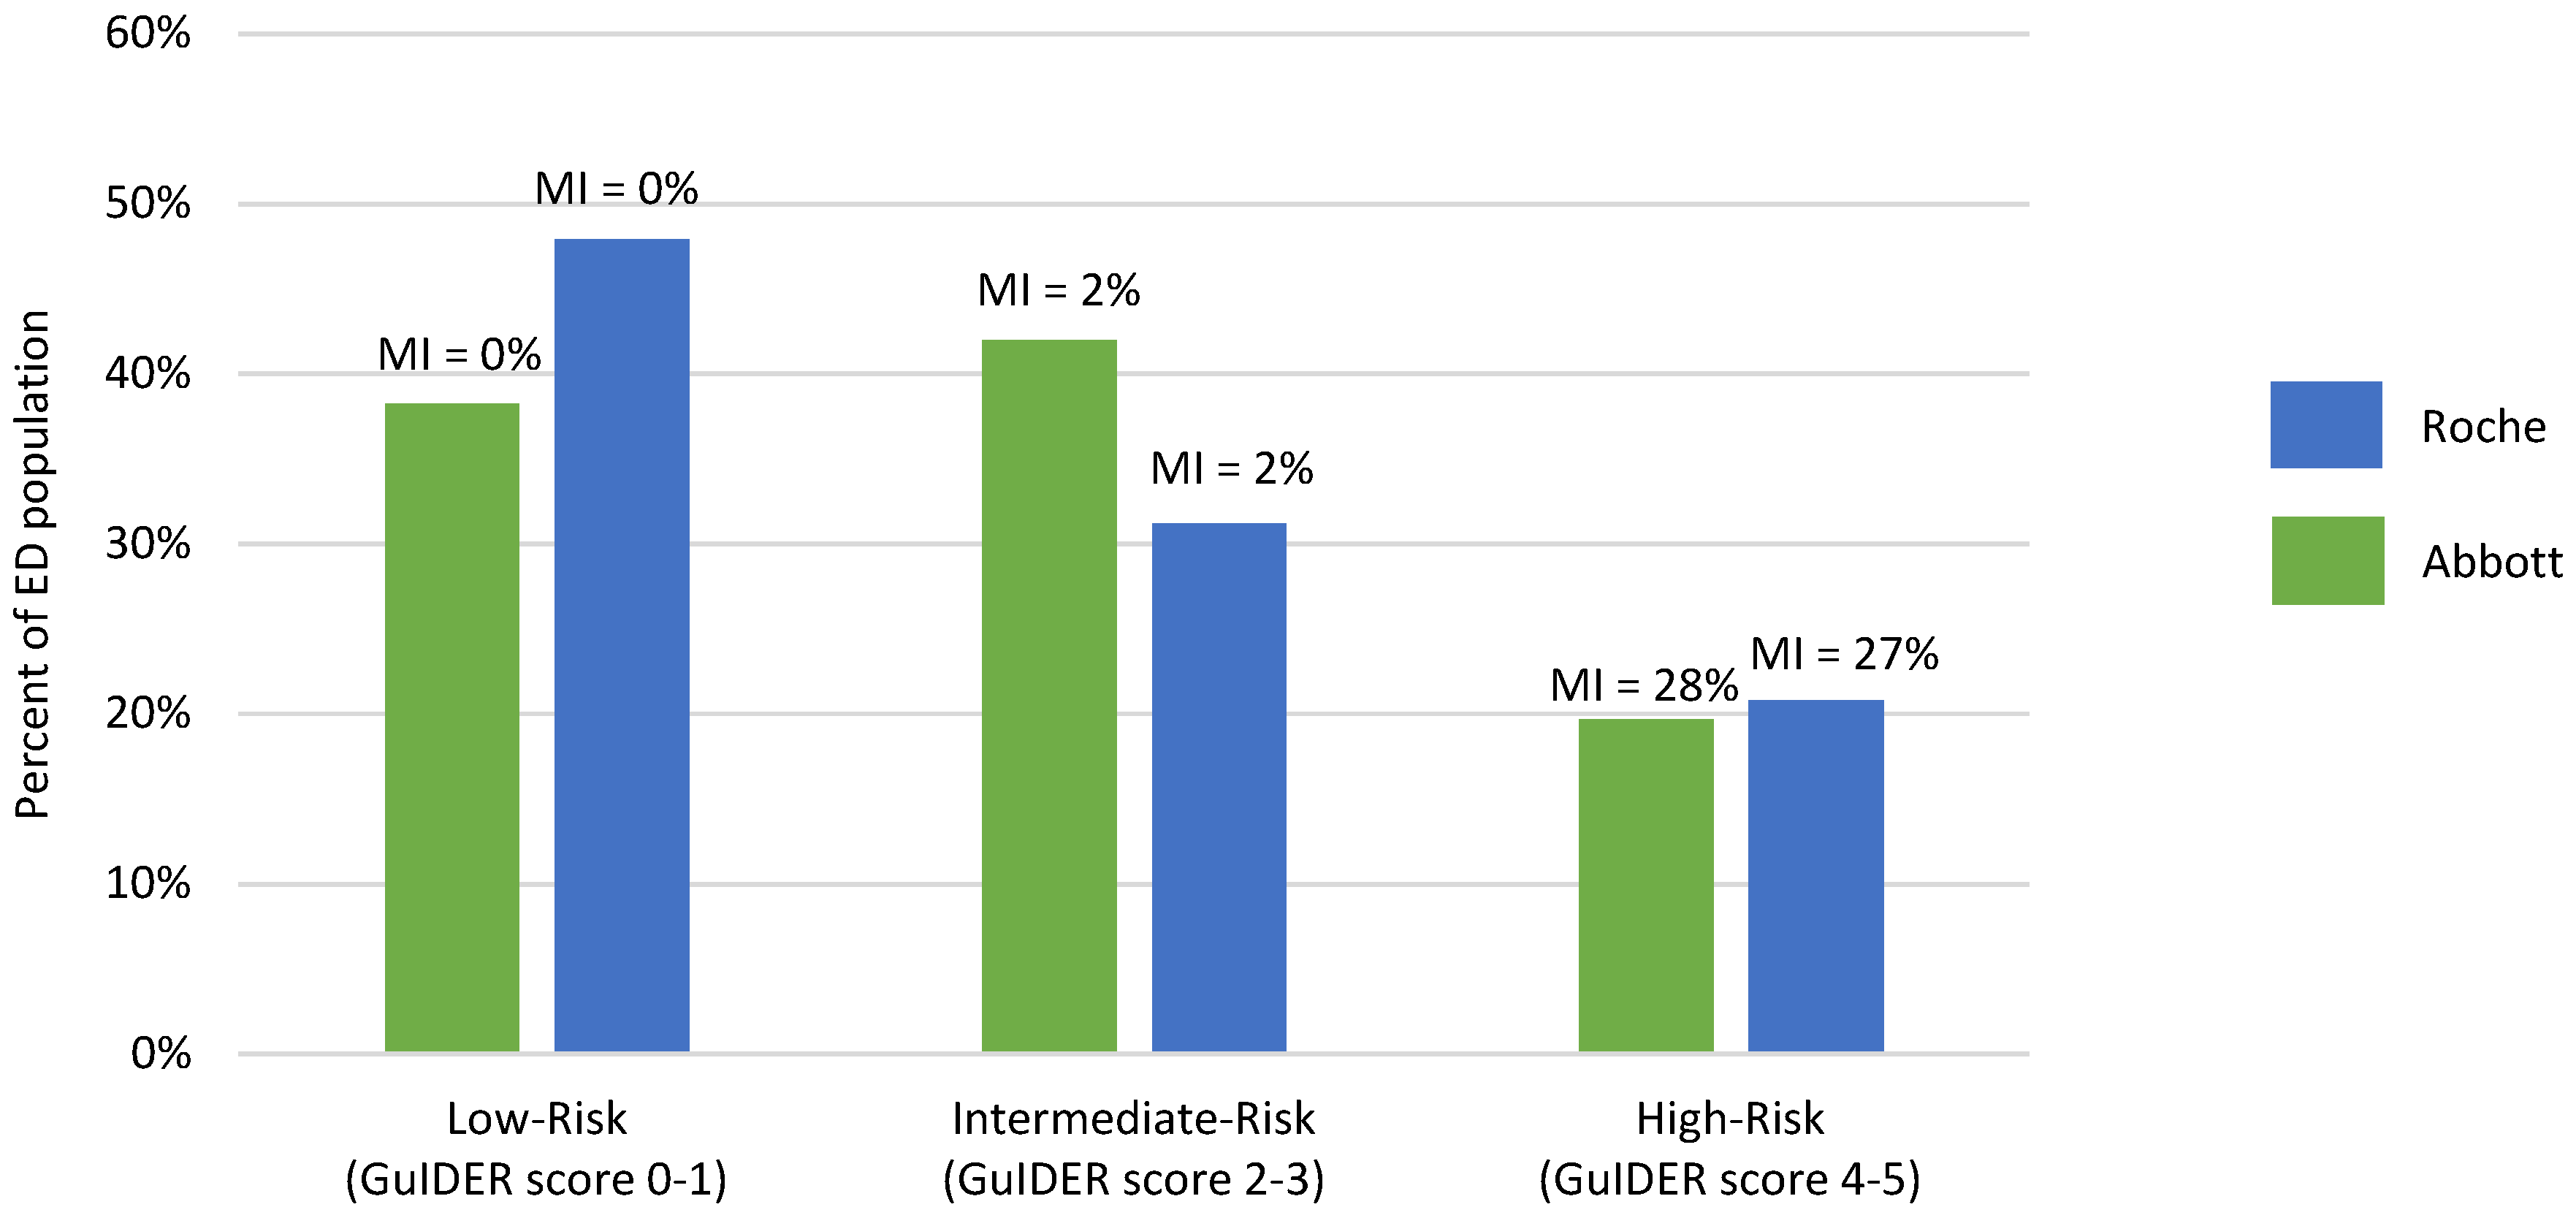
| Abbott GuIDER Score | 0 | 1 | 2 | 3 | 4 | 5 |
| Outcome | 0 | 1 | 7 | 5 | 12 | 16 |
| No Outcome | 27 | 75 | 62 | 39 | 17 | 8 |
| % Outcome | 0% | 1% | 10% | 11% | 41% | 67% |
| n (total = 269) | 27 | 76 | 69 | 44 | 29 | 24 |
| % of Patients | 10% | 28% | 26% | 16% | 11% | 9% |
| Chi-Square for Trend p < 0.001 | ||||||
| Roche GuIDER Score | 0 | 1 | 2 | 3 | 4 | 5 |
| Outcome | 0 | 3 | 7 | 6 | 8 | 17 |
| No Outcome | 37 | 89 | 43 | 28 | 20 | 11 |
| % Outcome | 0% | 3% | 14% | 18% | 29% | 61% |
| n (total = 269) | 37 | 92 | 50 | 34 | 28 | 28 |
| % of Patients | 14% | 34% | 19% | 13% | 10% | 10% |
| Chi-Square for Trend p < 0.001 | ||||||
Publisher’s Note: MDPI stays neutral with regard to jurisdictional claims in published maps and institutional affiliations. |
© 2021 by the authors. Licensee MDPI, Basel, Switzerland. This article is an open access article distributed under the terms and conditions of the Creative Commons Attribution (CC BY) license (https://creativecommons.org/licenses/by/4.0/).
Share and Cite
Kavsak, P.A.; Mondoux, S.E.; Hewitt, M.K.; Ainsworth, C.; Hill, S.; Worster, A. Can the Addition of NT-proBNP and Glucose Measurements Improve the Prognostication of High-Sensitivity Cardiac Troponin Measurements for Patients with Suspected Acute Coronary Syndrome? J. Cardiovasc. Dev. Dis. 2021, 8, 106. https://doi.org/10.3390/jcdd8090106
Kavsak PA, Mondoux SE, Hewitt MK, Ainsworth C, Hill S, Worster A. Can the Addition of NT-proBNP and Glucose Measurements Improve the Prognostication of High-Sensitivity Cardiac Troponin Measurements for Patients with Suspected Acute Coronary Syndrome? Journal of Cardiovascular Development and Disease. 2021; 8(9):106. https://doi.org/10.3390/jcdd8090106
Chicago/Turabian StyleKavsak, Peter A., Shawn E. Mondoux, Mark K. Hewitt, Craig Ainsworth, Stephen Hill, and Andrew Worster. 2021. "Can the Addition of NT-proBNP and Glucose Measurements Improve the Prognostication of High-Sensitivity Cardiac Troponin Measurements for Patients with Suspected Acute Coronary Syndrome?" Journal of Cardiovascular Development and Disease 8, no. 9: 106. https://doi.org/10.3390/jcdd8090106
APA StyleKavsak, P. A., Mondoux, S. E., Hewitt, M. K., Ainsworth, C., Hill, S., & Worster, A. (2021). Can the Addition of NT-proBNP and Glucose Measurements Improve the Prognostication of High-Sensitivity Cardiac Troponin Measurements for Patients with Suspected Acute Coronary Syndrome? Journal of Cardiovascular Development and Disease, 8(9), 106. https://doi.org/10.3390/jcdd8090106