
The Key Role of 3D TEE in Assessing the Morphology of Degenerative Mitral Valve Regurgitation


 ,
,
Abstract
1. Introduction
Three-Dimensional Echocardiography
2. Morphological Scenarios
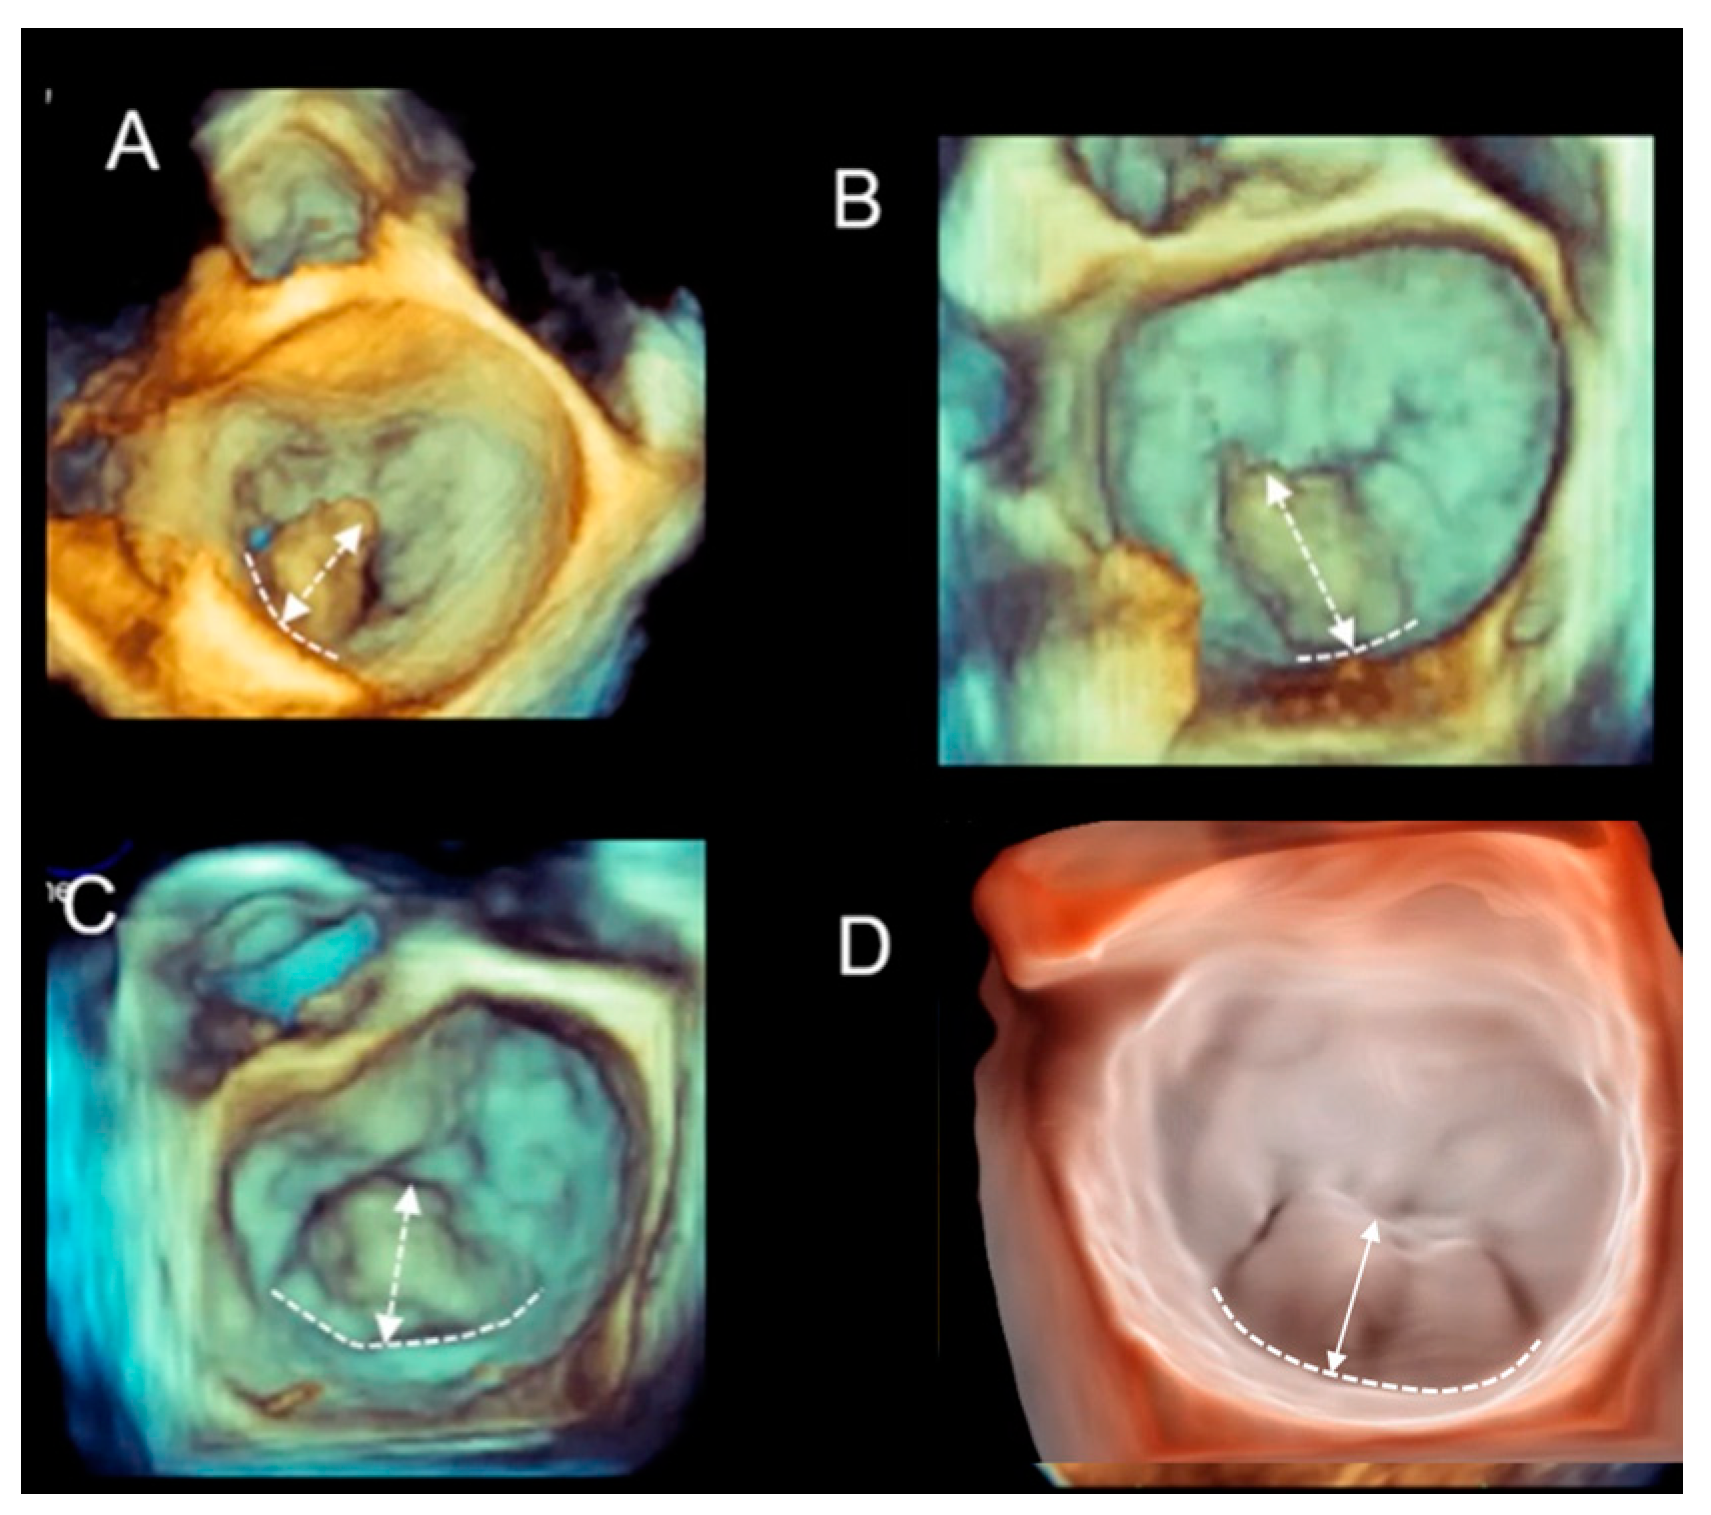
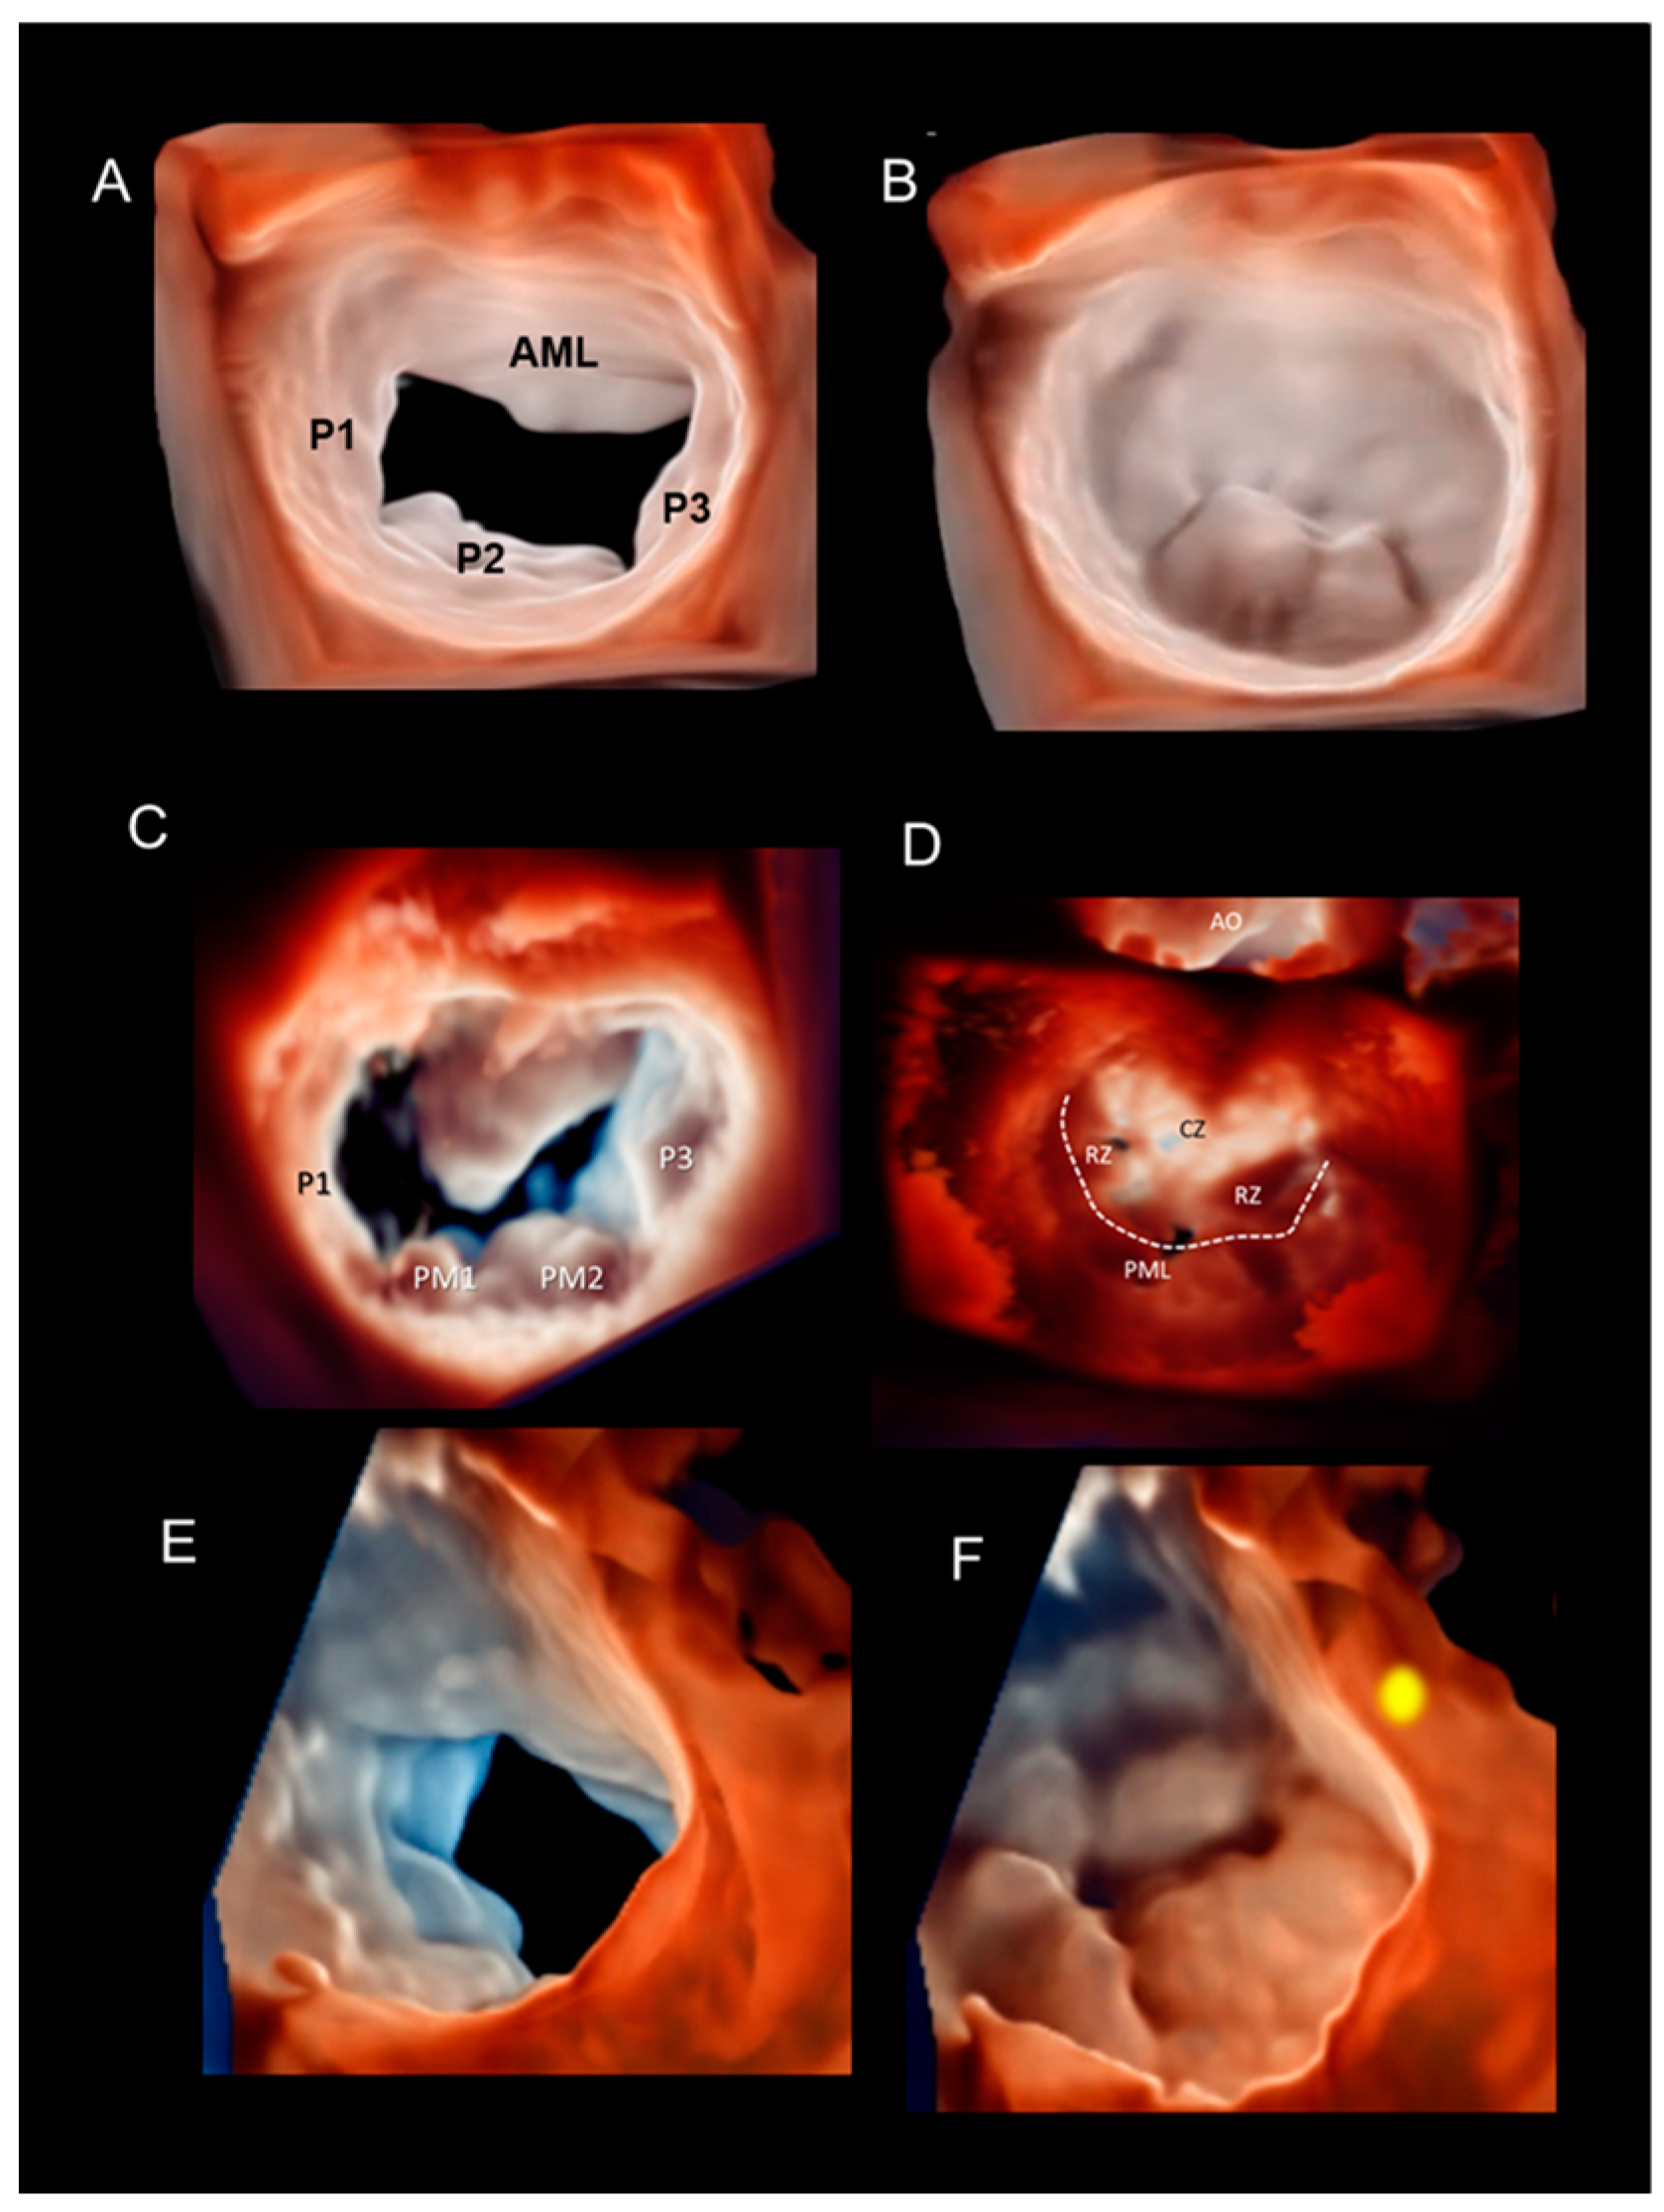
2.1. Scenario # 1
Multiple Perspectives
2.2. Scenario # 2
Phenotypes of DMVR
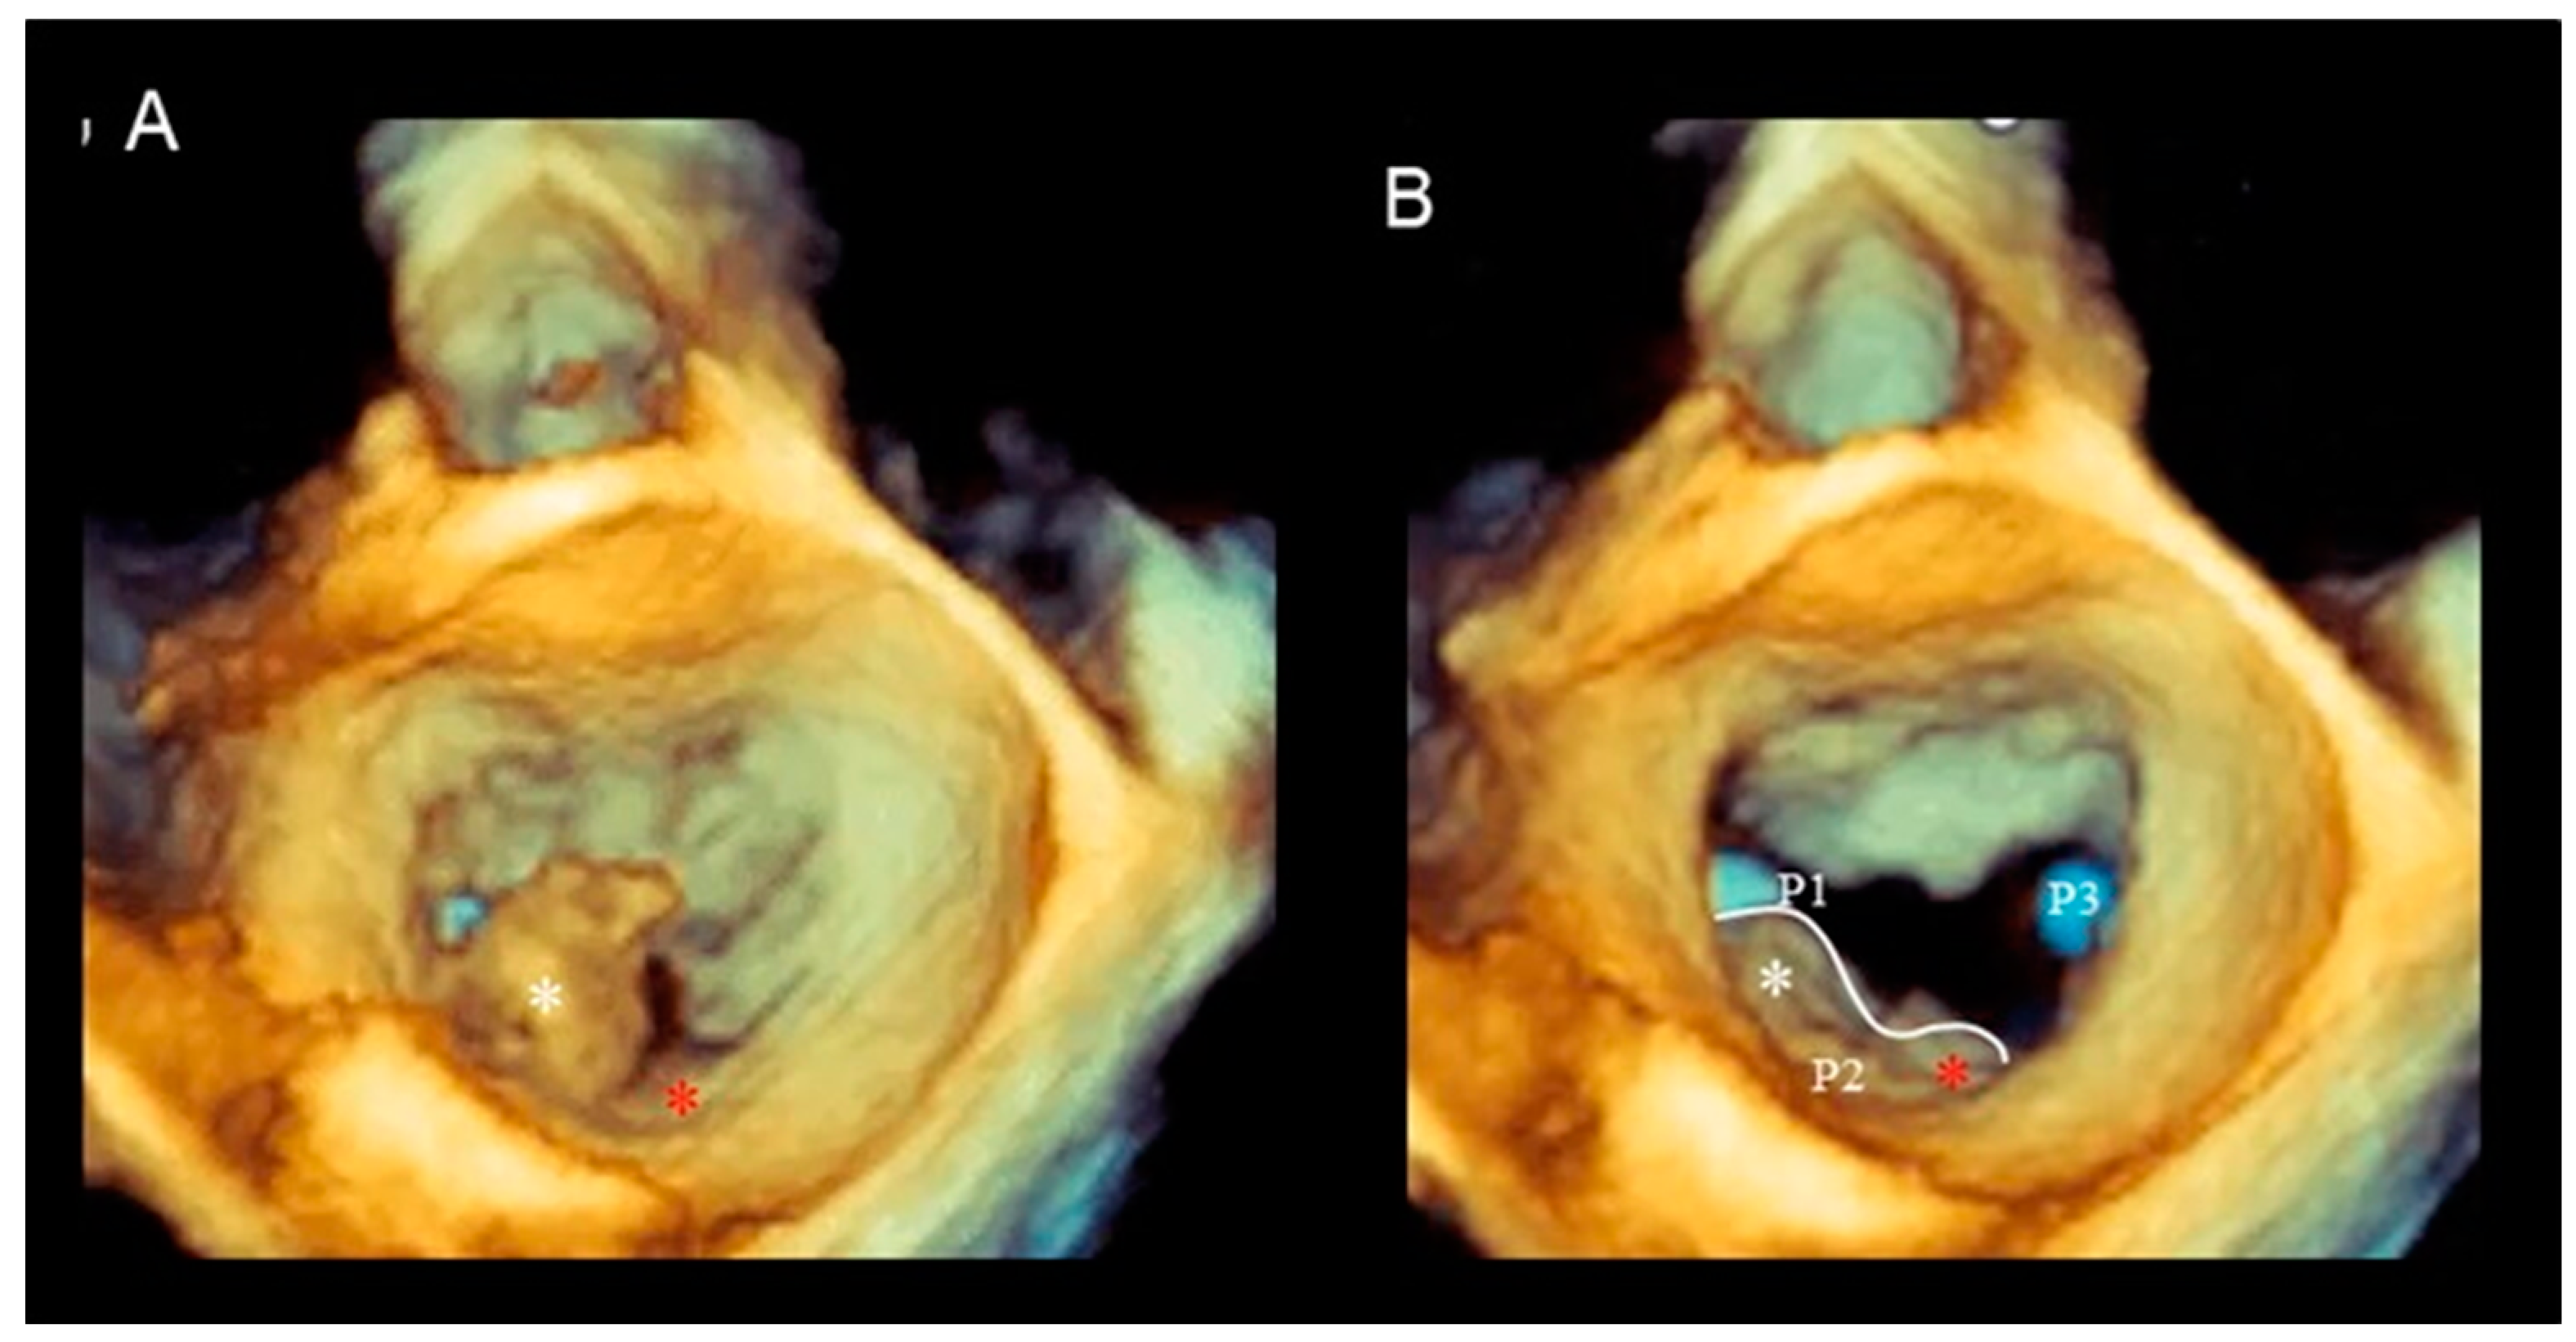
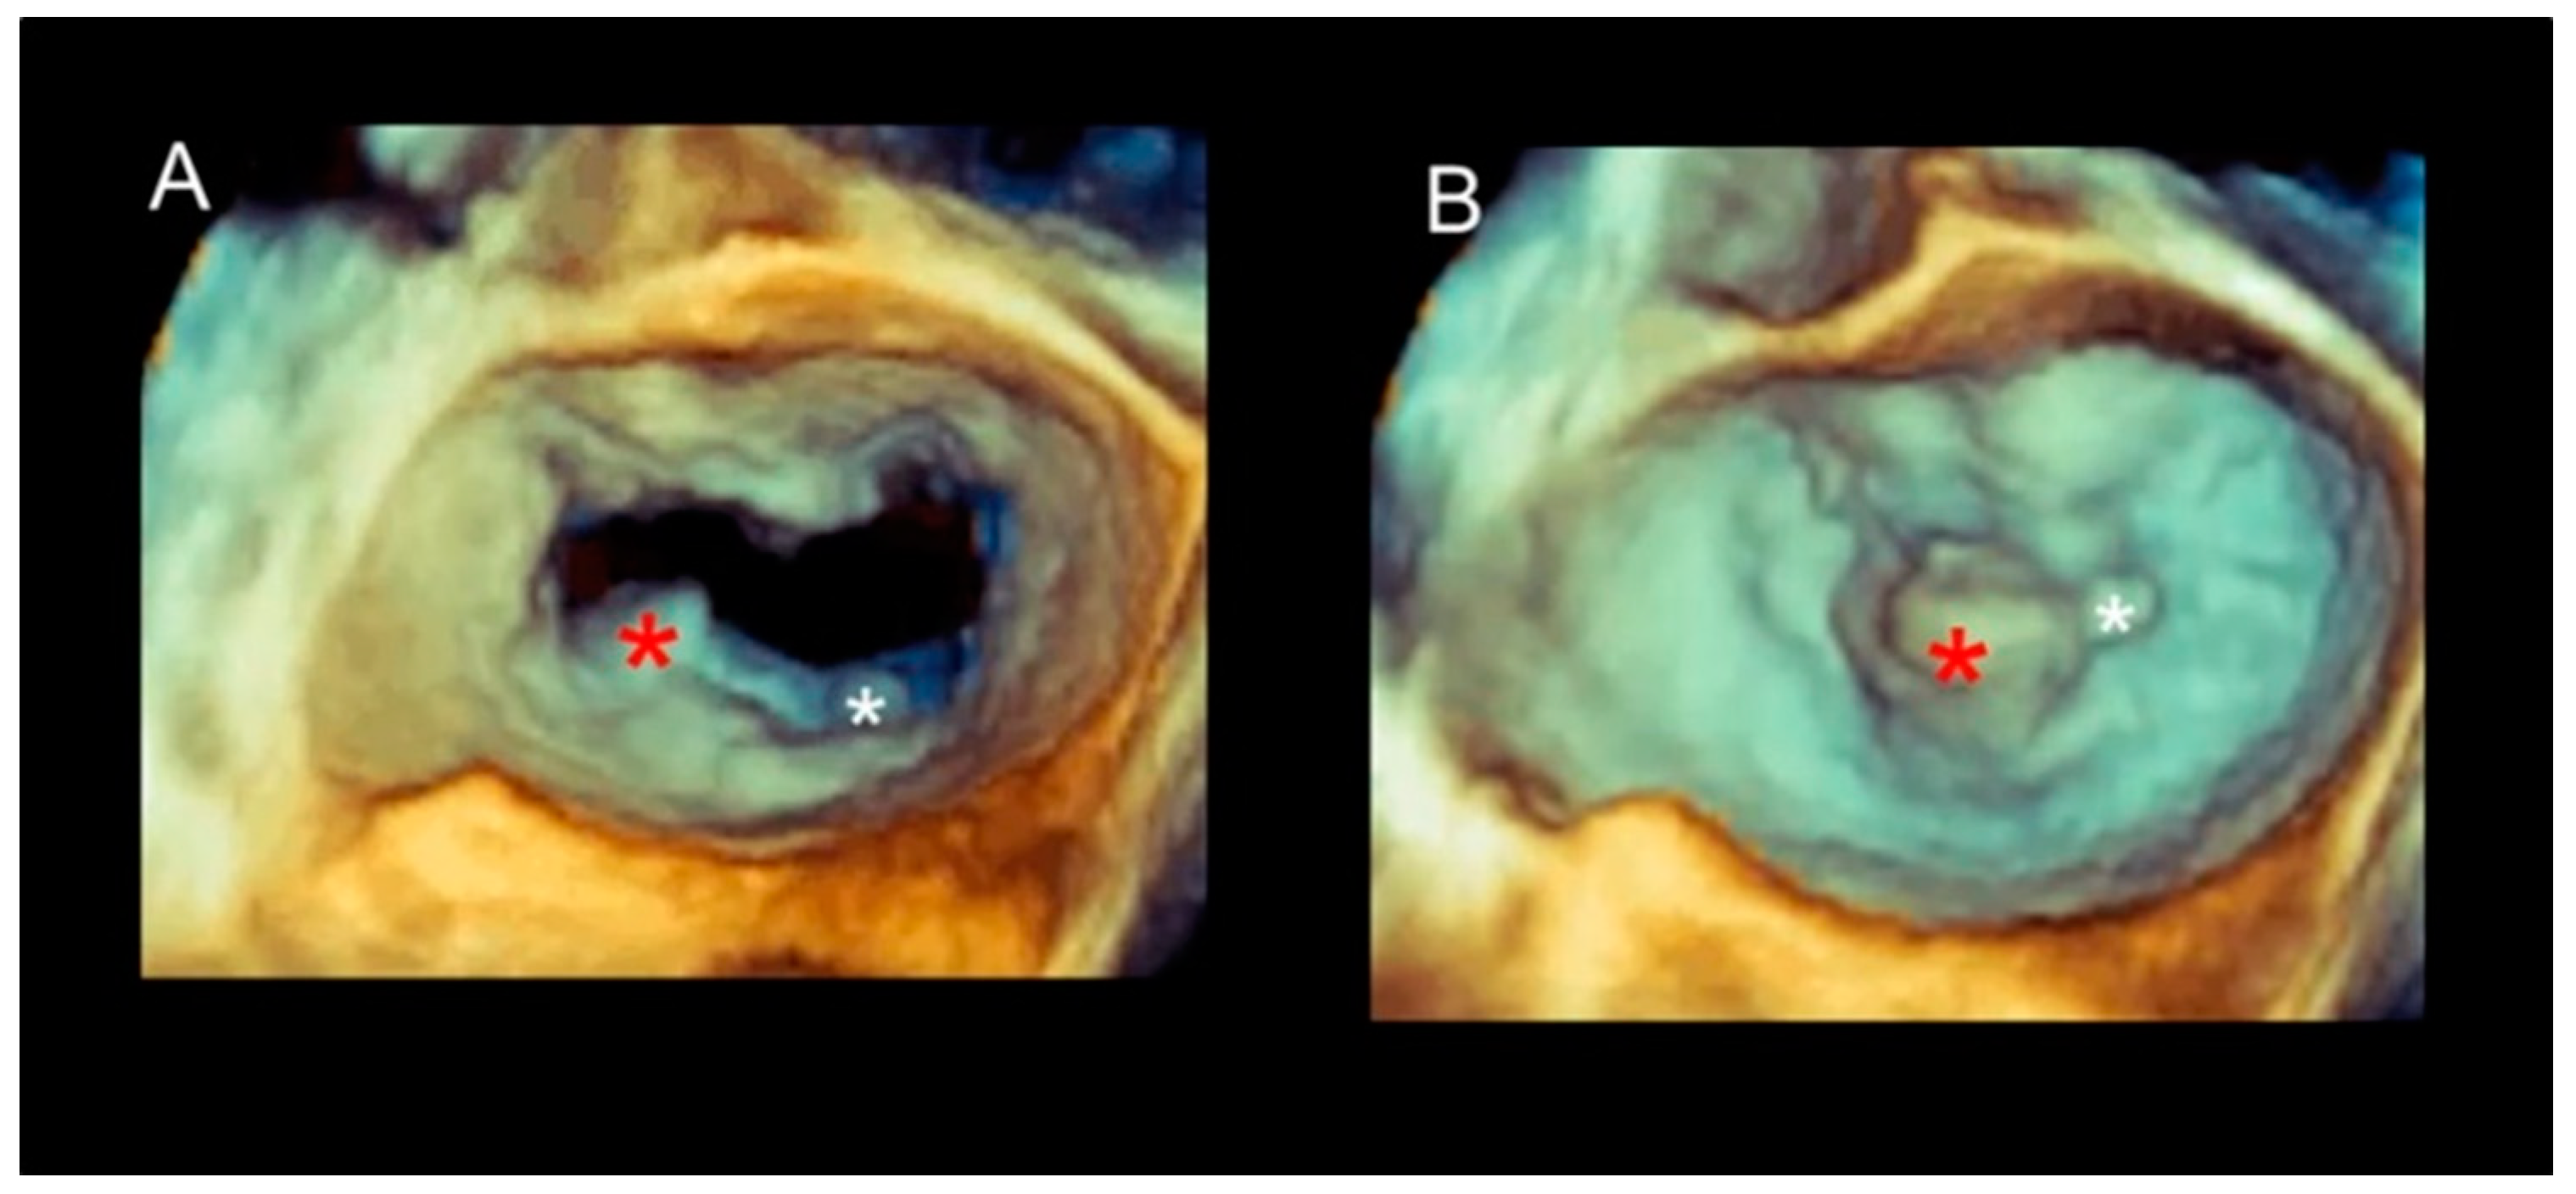
2.3. Scenario # 3
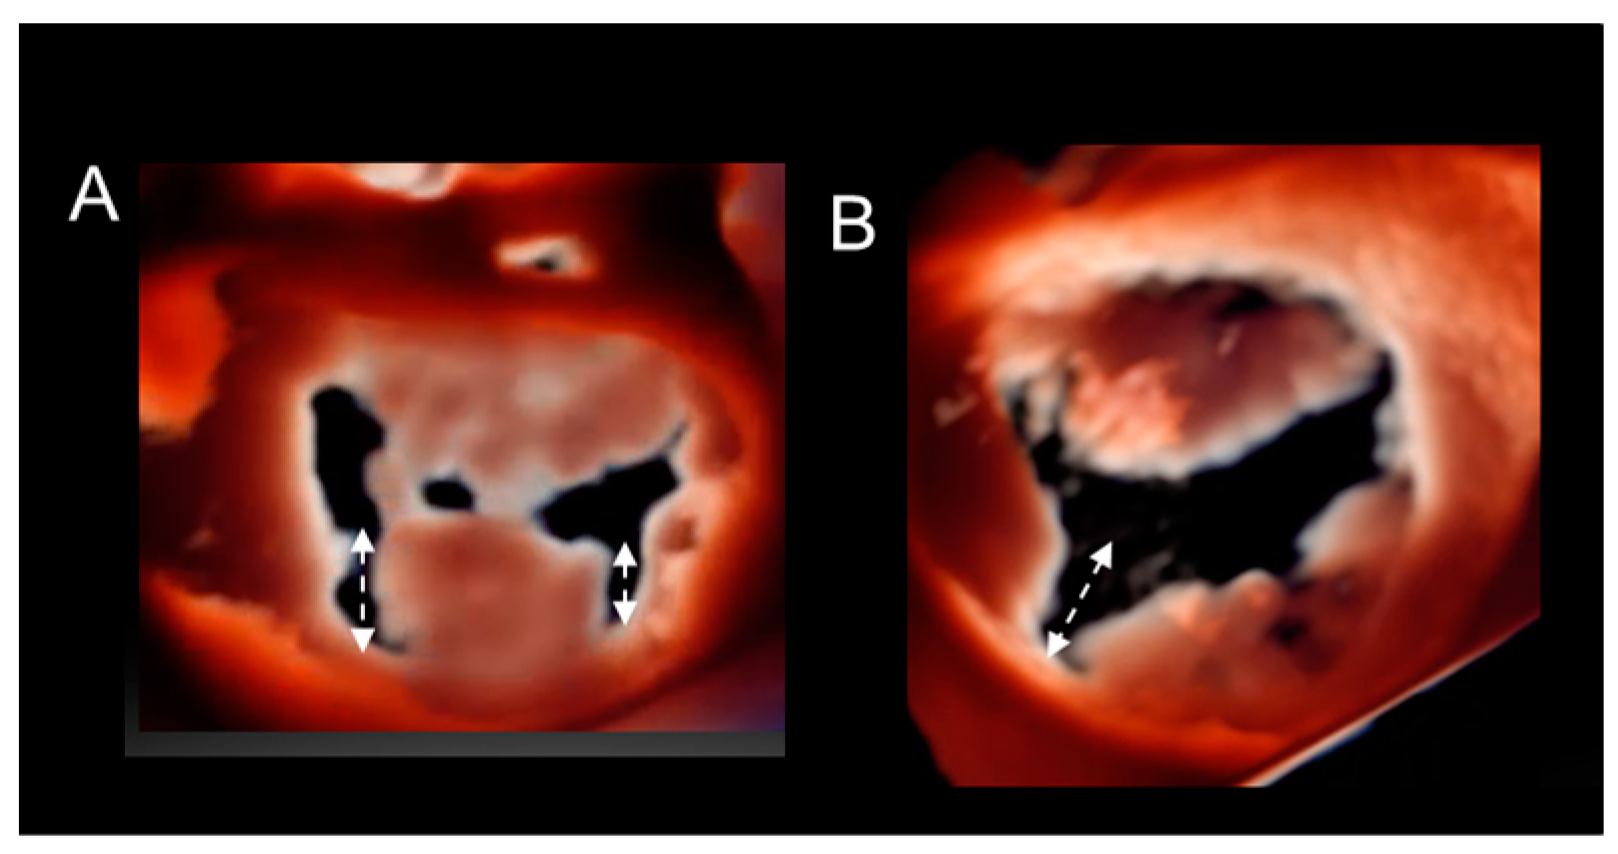
Cleft and Cleft-like Indentations
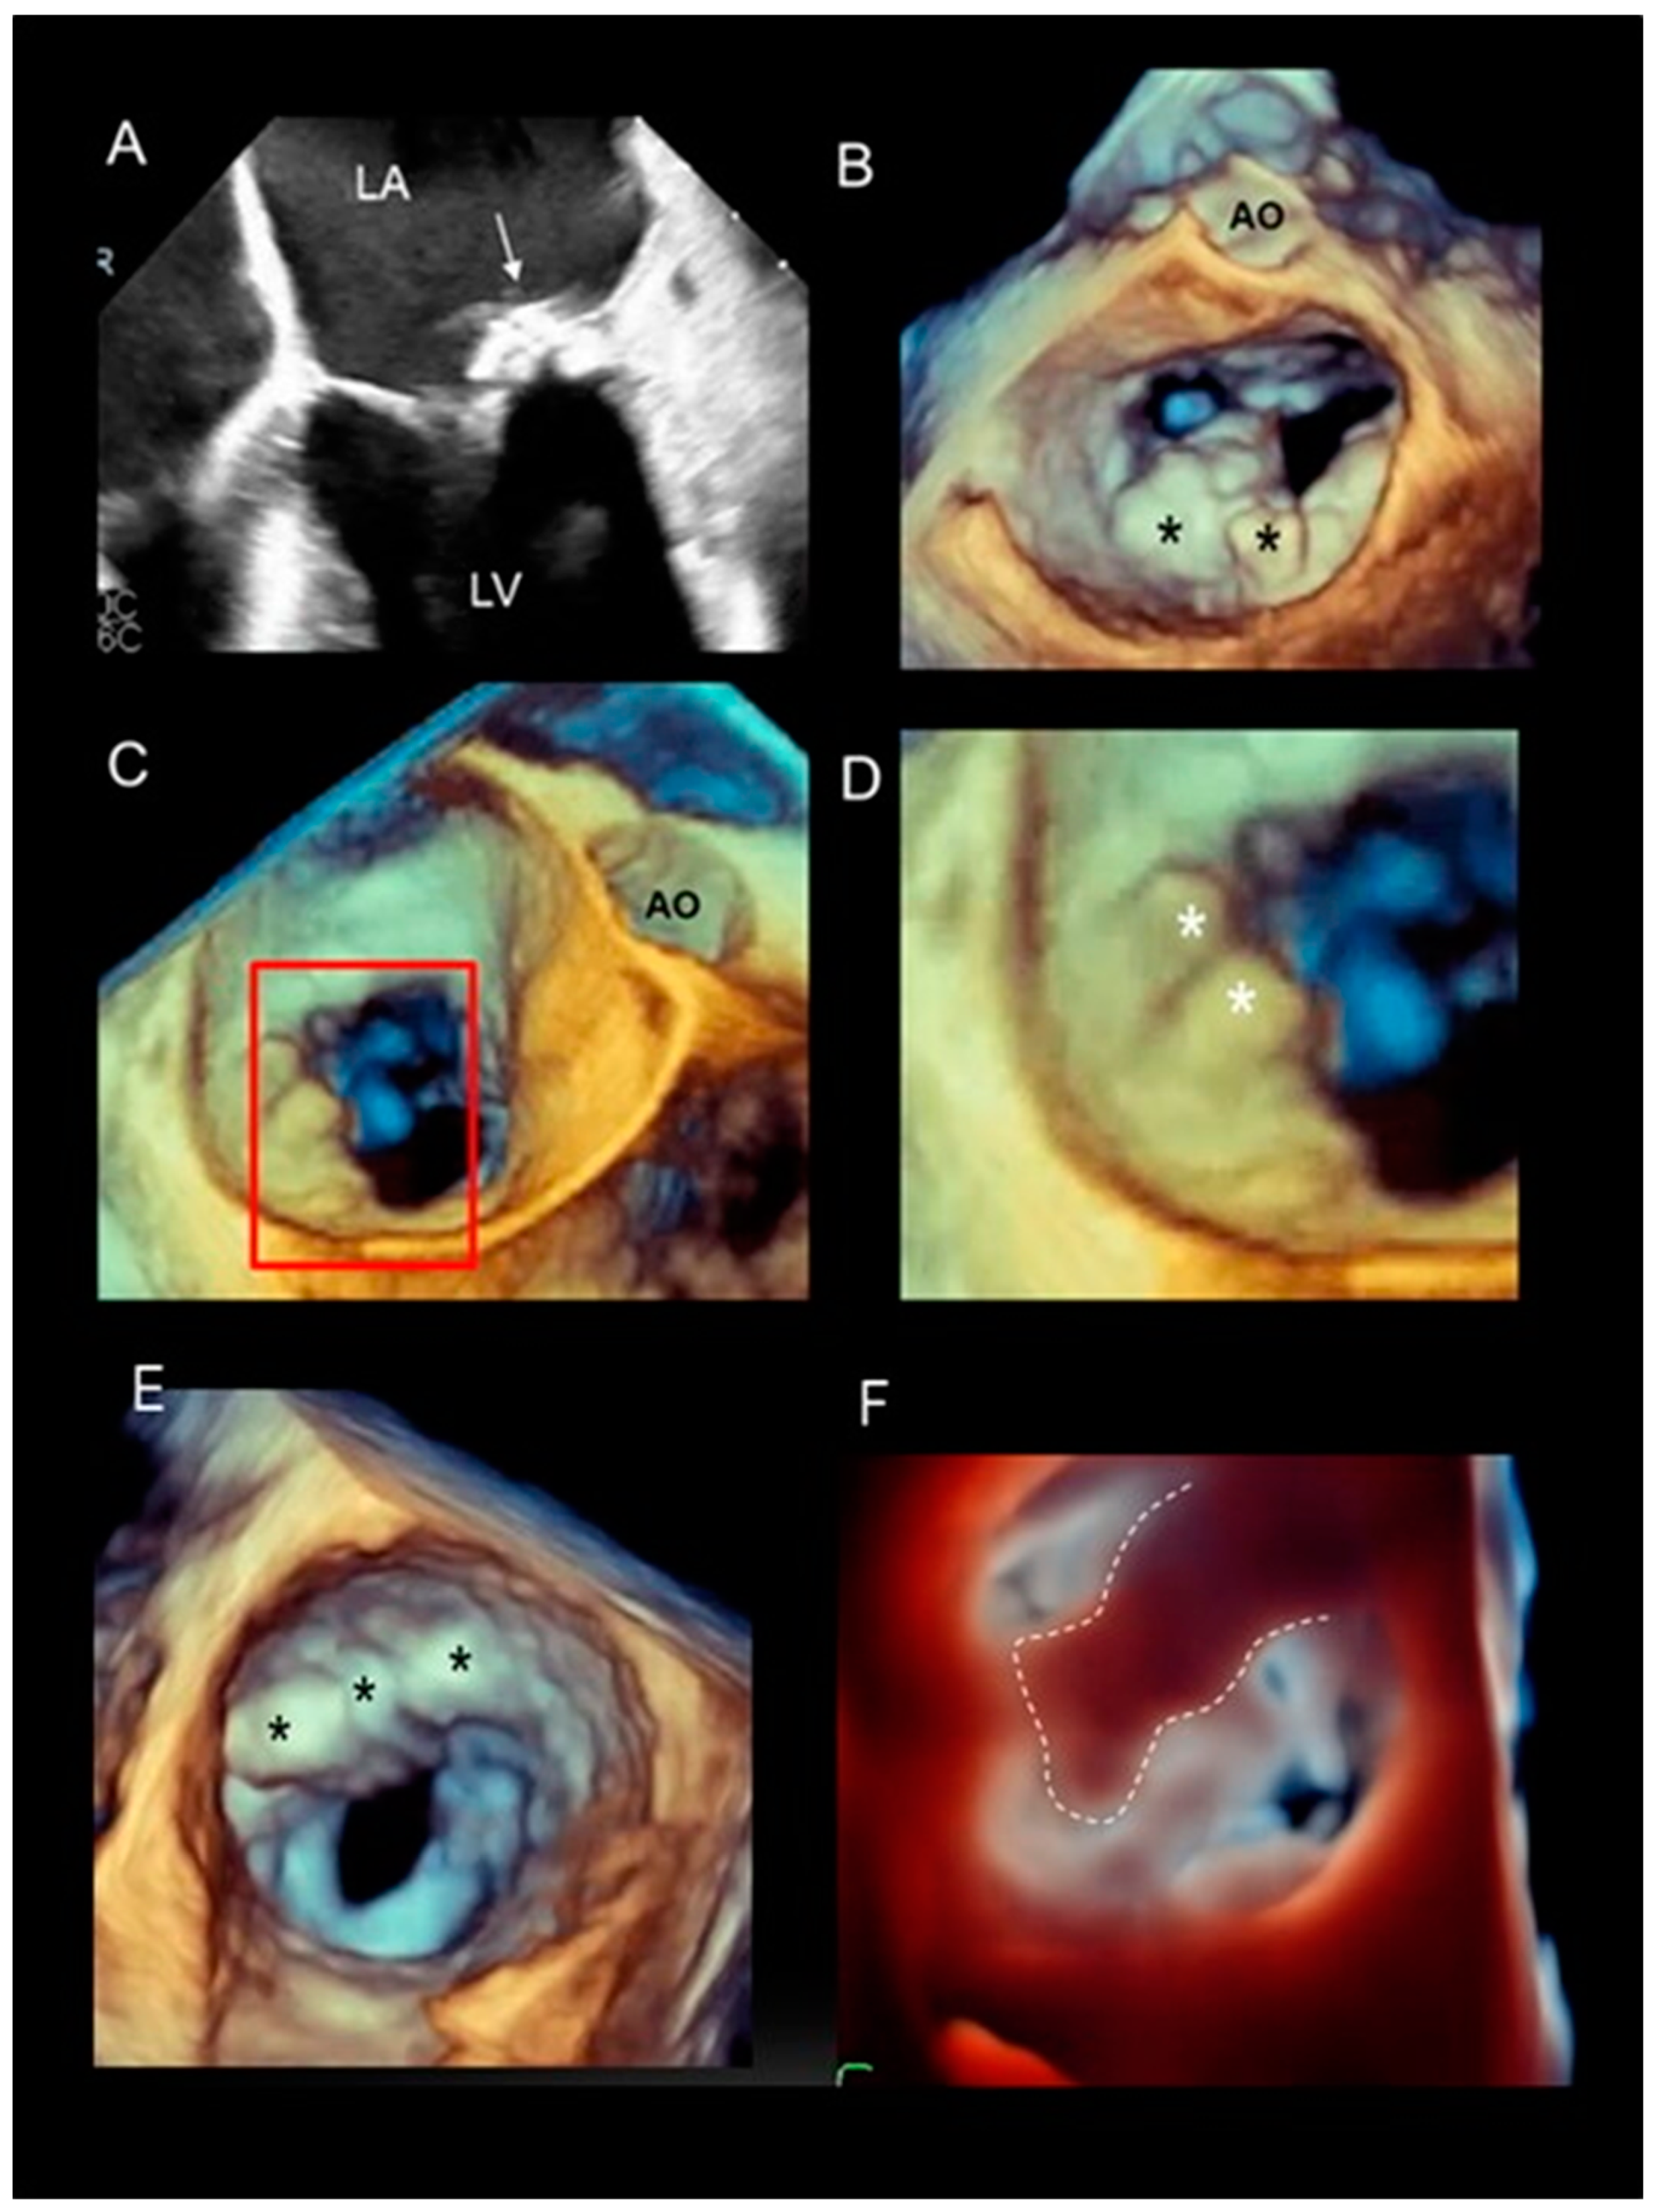
2.4. Scenario # 4
Different Shapes of P2 Prolapse, Partial Prolapse, and Commissural Prolapse
2.5. Scenario # 5
Secondary Lesions
2.6. Scenario # 6
Mitral Annular Calcification
2.7. Scenario # 7
3D TEE During MV Transcatheter Edge-to-Edge in DMVR
3. Pitfalls and Limitations of 3D TEE
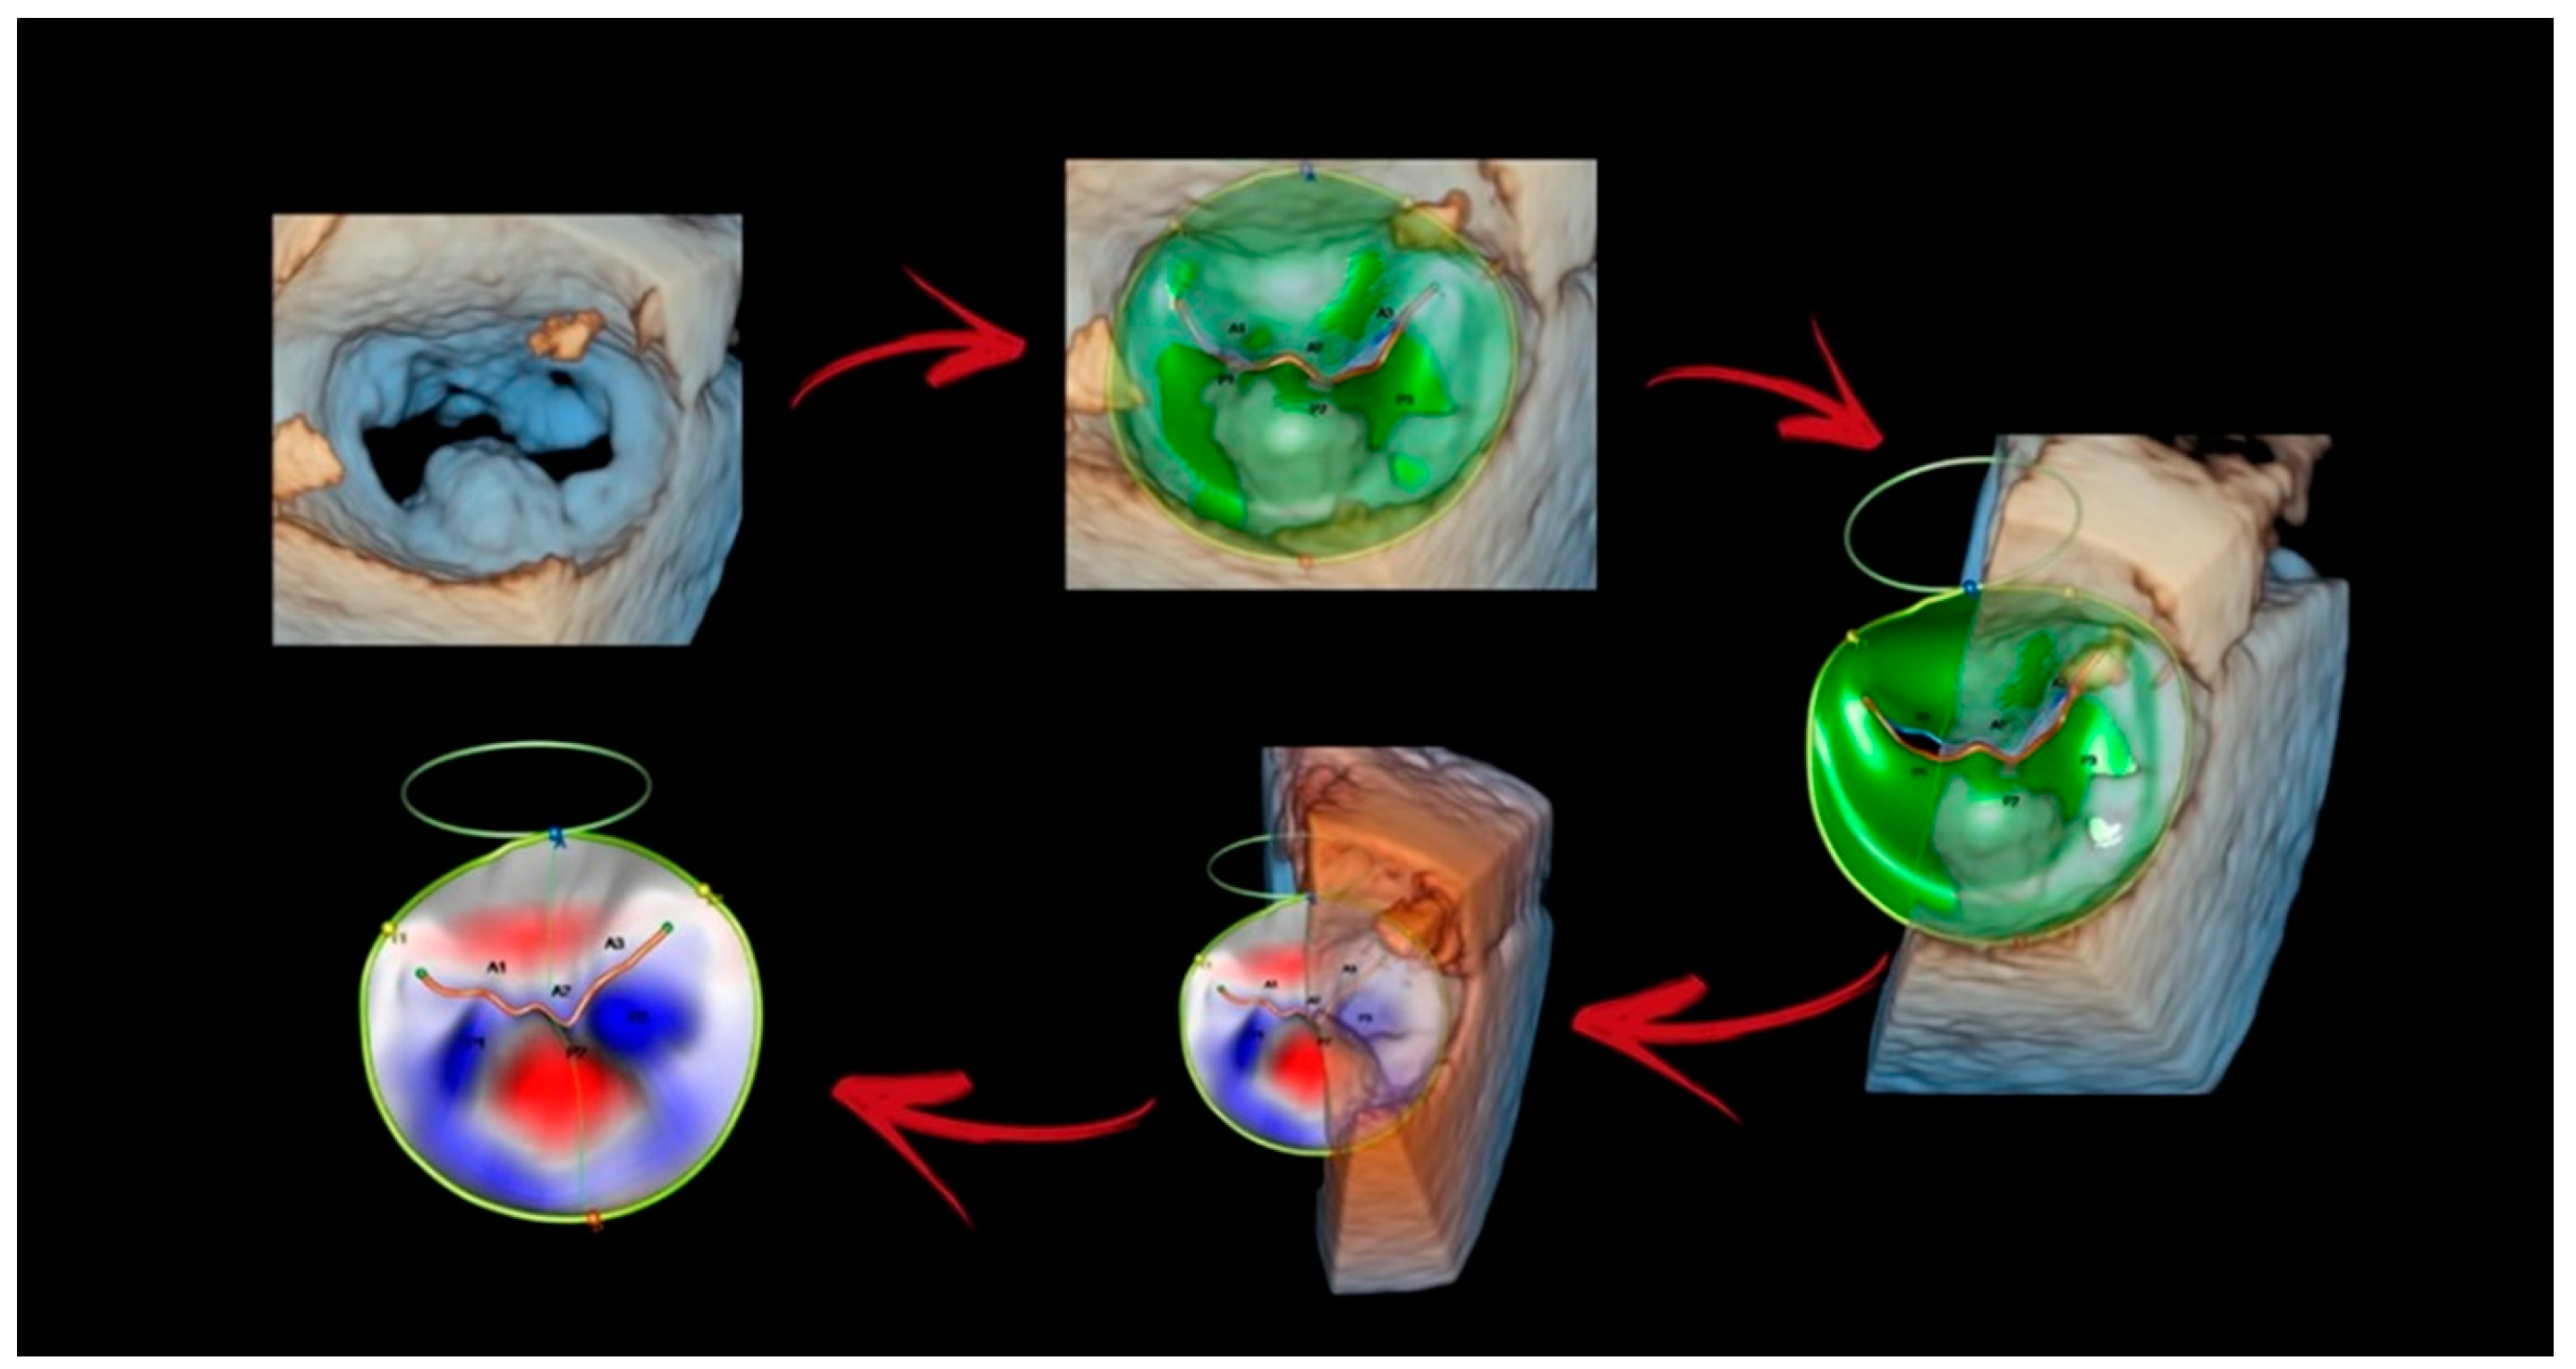
4. New Technologies
4.1. Photorealistic Vision and Transparency
4.2. Surface Rendering
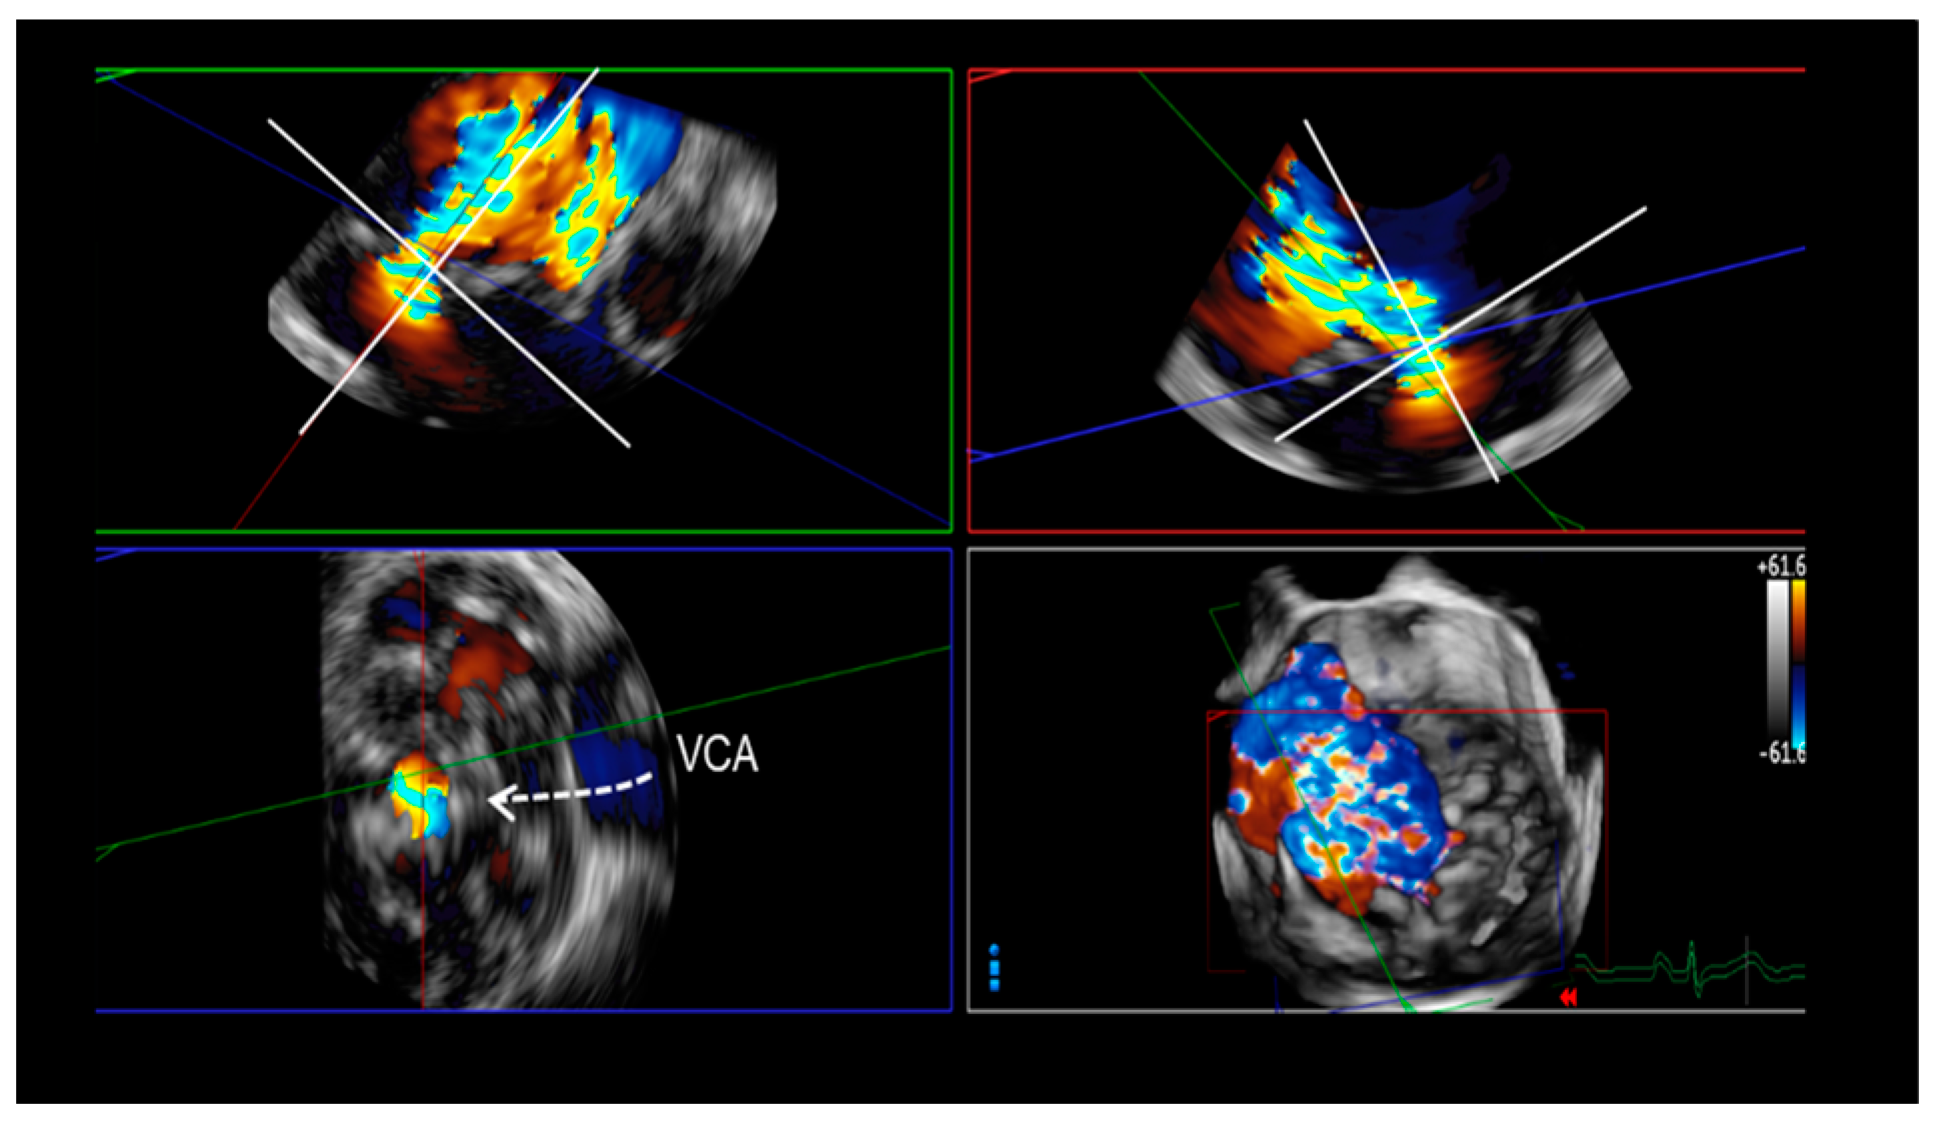
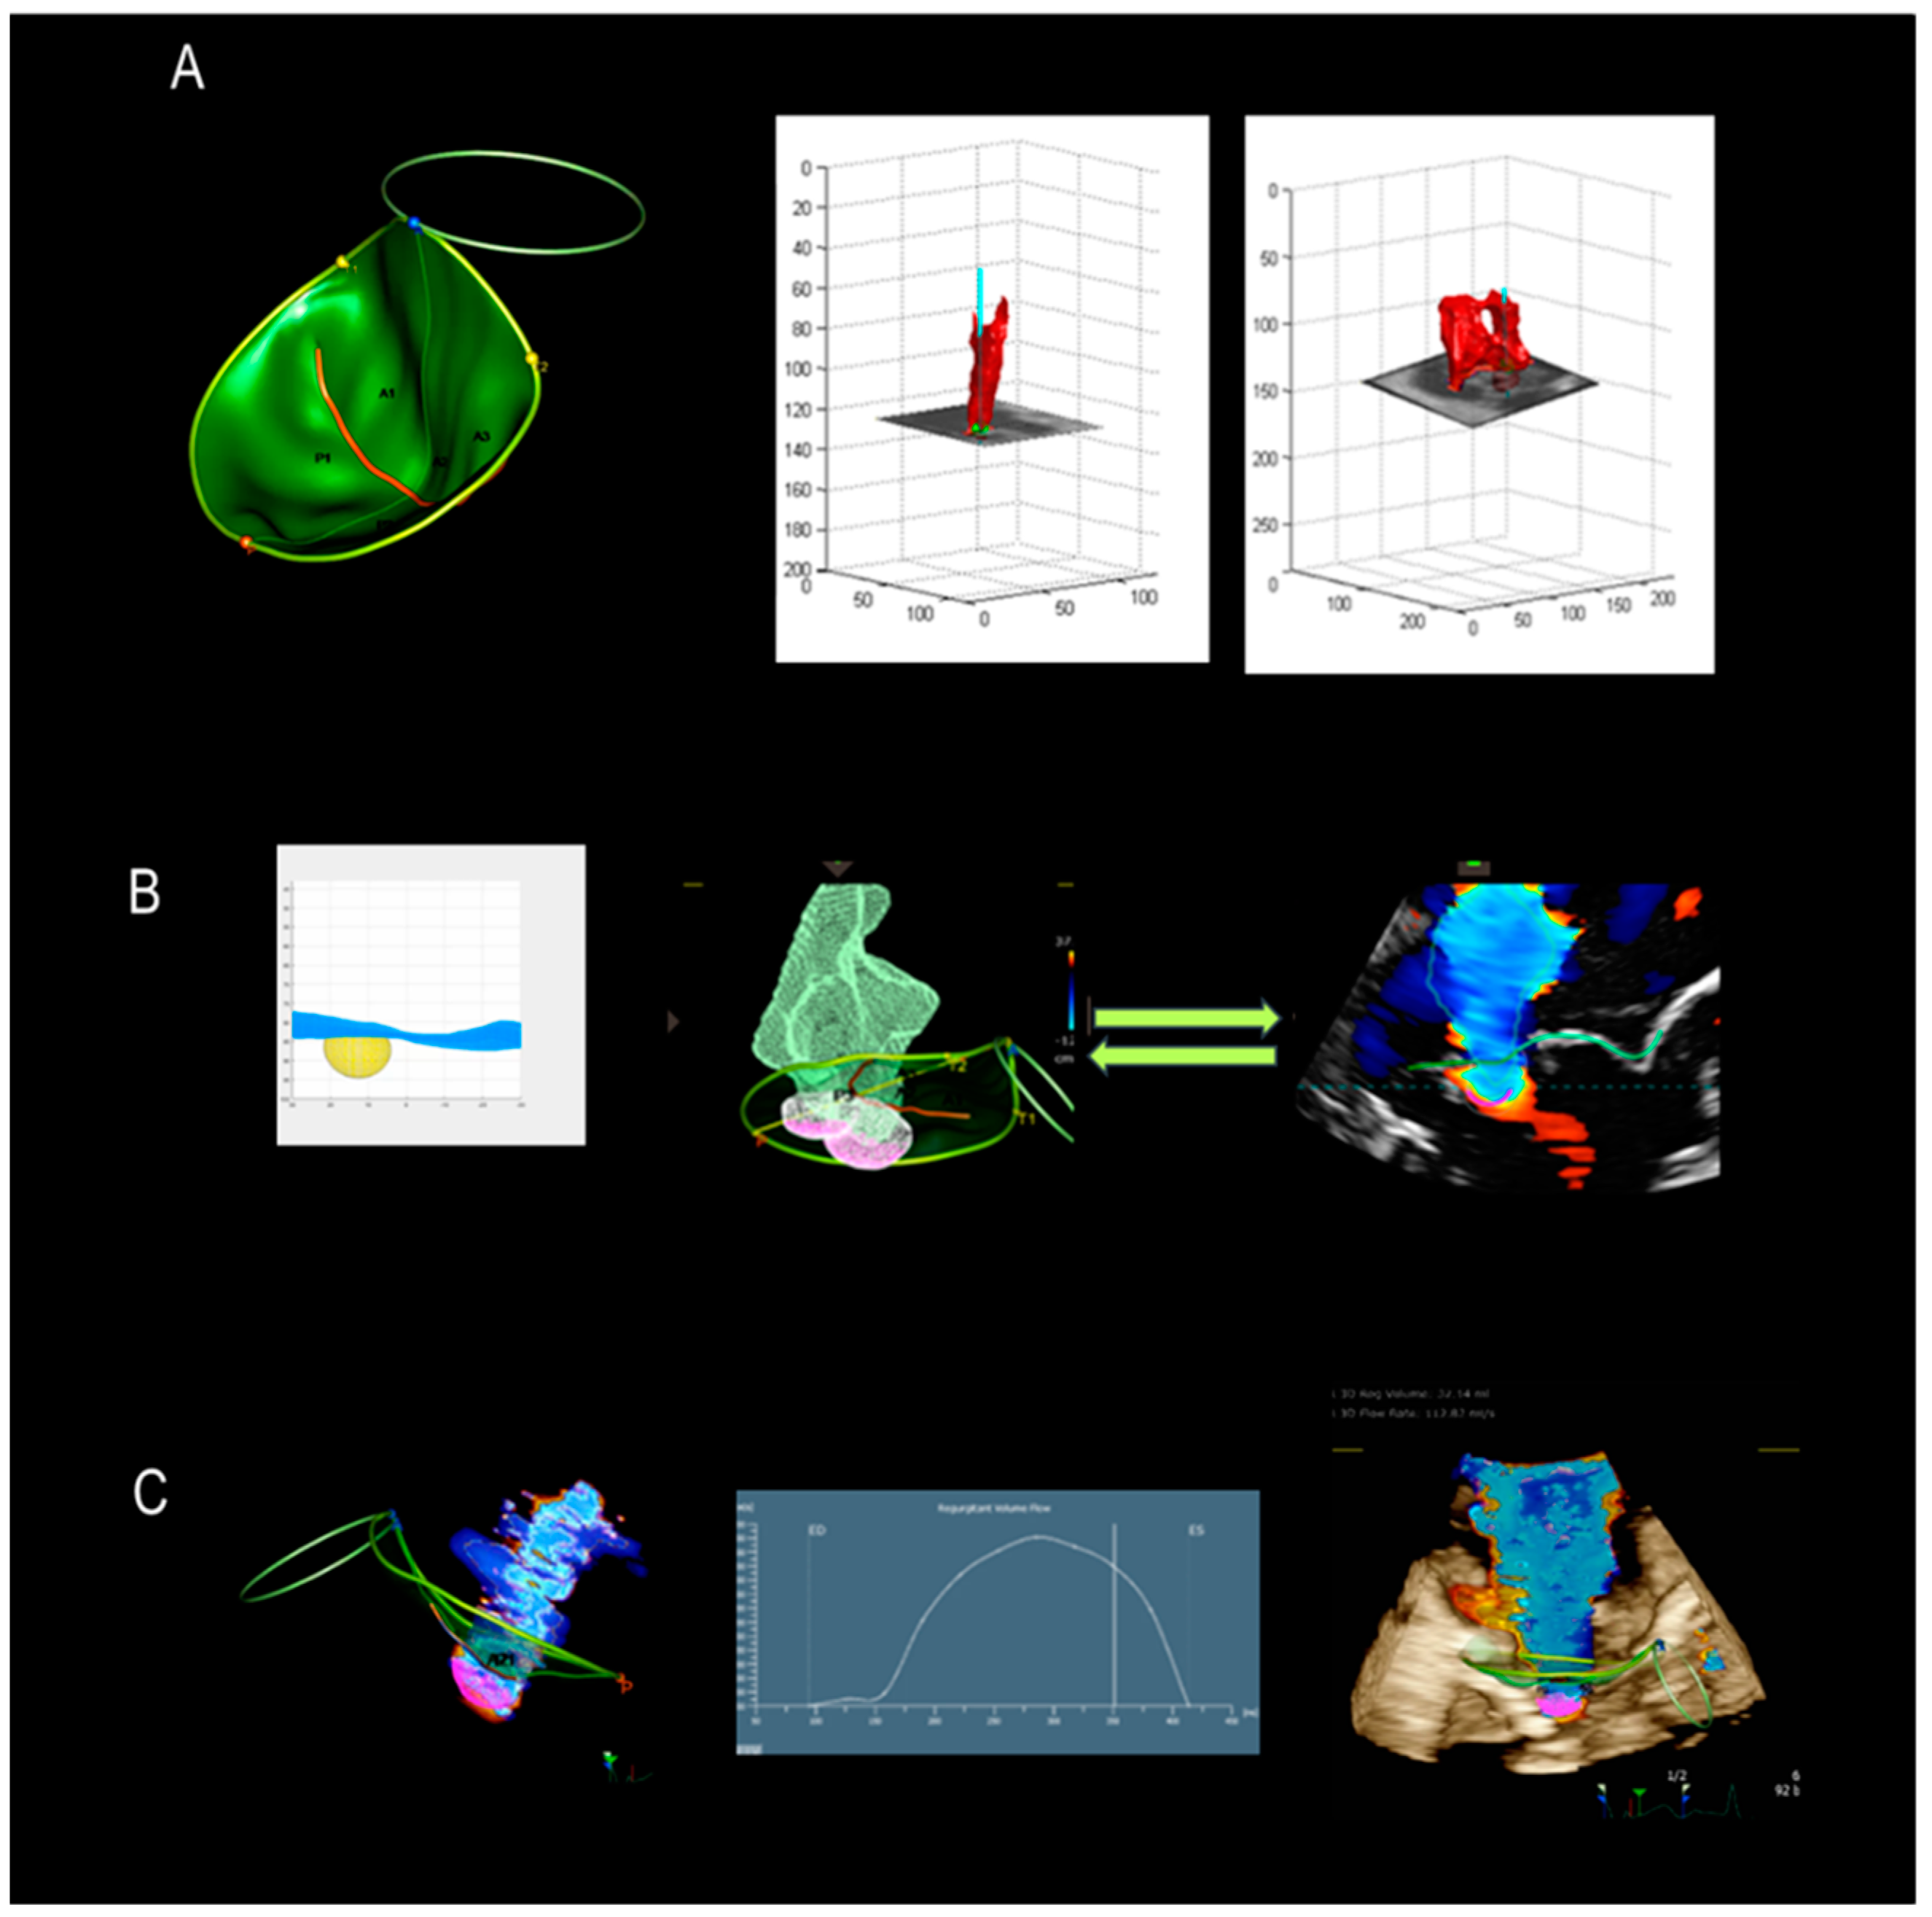
5. Assessment of Regurgitation Severity
Current Modalities
6. A New Tool
7. New Mini TEE Probe
8. Conclusions
Funding
Conflicts of Interest
Abbreviations and Acronyms
| 2D TTE | two-dimensional transthoracic echocardiography |
| 2D TEE | two-dimensional transesophageal echocardiography |
| 3D VCA | vena contracta area |
| AML | anterior mitral leaflet |
| CFQ | color flow quantification |
| DMVR | degenerative mitral valve regurgitation |
| EROA | effective regurgitant orifice area |
| FED | fibroelastic deficiency |
| MA | mitral annulus |
| MV | mitral valve |
| PML | posterior mitral leaflet |
| PISA | proximal isovelocity surface area |
| RVol | regurgitant volume |
| TEER | transcatheter edge-to-edge repair |
References
- Otto, C.M.; Nishimura, R.A.; Bonow, R.O.; Carabello, B.A.; Erwin, J.P., III; Gentile, F.; Jneid, H.; Krieger, E.V.; Mack, M.; McLeod, C.; et al. 2020 ACC/AHA Guideline for the Management of Patients With Valvular Heart Disease: Executive Summary: A Report of the American College of Cardiology/American Heart Association Joint Committee on Clinical Practice Guidelines. Circulation 2021, 143, e35–e71. [Google Scholar] [CrossRef]
- Hahn, R.T.; Abraham, T.; Adams, M.S.; Bruce, C.J.; Glas, K.E.; Lang, R.M.; Reeves, S.T.; Shanewise, J.S.; Siu, S.C.; Stewart, W.; et al. American Society of Echocardiography; Society of Cardiovascular Anesthesiologists. Guidelines for performing a comprehensive transesophageal echocardiographic examination: Recommendations from the American Society of Echocardiography and the Society of Cardiovascular Anesthesiologists. Anesth. Analg. 2014, 118, 21–68. [Google Scholar]
- Faletra, F.F.; Pedrazzini, G.; Pasotti, E.; Muzzarelli, S.; Dequarti, M.C.; Murzilli, R.; Schlossbauer, S.A.; Slater, I.P.; Moccetti, T. 3D TEE during catheter-based interventions. JACC Cardiovasc. Imaging 2014, 7, 292–308. [Google Scholar] [CrossRef]
- Faletra, F.F.; Agricola, E.; Flachskampf, F.A.; Hahn, R.; Pepi, M.; Marsan, N.A.; Wunderlich, N.; Sade, L.E.; Donal, E.; Zamorano, J.-L.; et al. Three-dimensional transoesophageal echocardiography: How to use and when to use—A clinical consensus statement from the European Association of Cardiovascular Imaging of the European Society of Cardiology. Eur. Heart J.—Cardiovasc. Imaging 2023, 24, e119–e197. [Google Scholar] [CrossRef]
- Faletra, F.F.; Demertzis, S.; Pedrazzini, G.; Murzilli, R.; Pasotti, E.; Muzzarelli, S.; Siclari, F.; Moccetti, T. Three-dimensional transesophageal echocardiography in degenerative mitral regurgitation. J. Am. Soc. Echocardiogr. 2015, 28, 437–448. [Google Scholar] [CrossRef]
- Biaggi, P.; Gruner, C.; Jedrzkiewicz, S.; Karski, J.; Meineri, M.; Vegas, A.; David, T.E.; Woo, A.; Rakowski, H. Assessment of Mitral Valve Prolapse by 3D TEE: Angled Views Are Key. JACC Cardiovasc. Imaging 2011, 4, 94–97. [Google Scholar] [CrossRef]
- Adams, D.H.; Rosenhek, R.; Falk, V. Degenerative mitral valve regurgitation: Best practice revolution. Eur. Heart J. 2010, 31, 1958–1966. [Google Scholar] [CrossRef]
- Carpentier, A. Cardiac valve surgery—The “French correction”. J. Thorac. Cardiovasc. Surg. 1983, 86, 323–337. [Google Scholar] [CrossRef]
- Faletra, F.F.; Nucifora, G.; Ho, S.Y. Real-time 3-dimensional transesophageal echocardiography of the atrioventricular septal defect. Circ. Cardiovasc. Imaging 2011, 4, e7–e9. [Google Scholar] [CrossRef] [PubMed]
- Timóteo, A.; Galrinho, A.; Fiarresga, A.; Branco, L.; Banazol, N.; Leal, A.; Fragata, J.; Quininha, J. Isolated cleft of the anterior mitral valve leaflet. Eur. J. Echocardiogr. 2007, 8, 59–62. [Google Scholar] [CrossRef] [PubMed]
- Ring, L.; Rana, B.S.; Ho, S.Y.; Wells, F.C. The prevalence and impact of deep clefts in the mitral leaflets in mitral valve prolapse. Eur. Heart J. Cardiovasc. Imaging 2013, 14, 595–602. [Google Scholar] [CrossRef] [PubMed]
- De Bonis, M.; Alfieri, O.; Dalrymple-Hay, M.; Del Forno, B.; Dulguerov, F.; Dreyfus, G. Mitral Valve Repair in Degenerative Mitral Regurgitation: State of the Art. Prog. Cardiovasc. Dis. 2017, 60, 386–393. [Google Scholar] [CrossRef] [PubMed]
- O’Gara, P.T.; Grayburn, P.A.; Badhwar, V.; Afonso, L.C.; Carroll, J.D.; Elmariah, S.; Kithcart, A.P.; Nishimura, R.A.; Ryan, T.J.; Schwartz, A.; et al. 2017 ACC Expert Consensus Decision Pathway on the Management of Mitral Regurgitation: A Report of the American College of Cardiology Task Force on Expert Consensus Decision Pathways. J. Am. Coll. Cardiol. 2017, 70, 2421–2449. [Google Scholar] [PubMed]
- Carino, D.; Lorusso, R.; Lapenna, E.; Del Forno, B.; Sala, A.; Zancanaro, E.; Ruggeri, S.; Abboud, S.; Schiavi, D.; Ascione, G.; et al. Commissural closure to treat severe mitral regurgitation: Standing the test of time. Eur. J. Cardiothorac. Surg. 2022, 62, ezac135. [Google Scholar] [CrossRef]
- Shernan, S.K. Perioperative transesophageal echocardiographic evaluation of the native mitral valve. Crit. Care Med. 2007, 35, S372–S383. [Google Scholar] [CrossRef]
- Sidebotham, D.A.; Allen, S.J.; Gerber, I.L.; Fayers, T. Intraoperative transesophageal echocardiography for surgical repair of mitral regurgitation. J. Am. Soc. Echocardiogr. 2014, 27, 345–366. [Google Scholar] [CrossRef]
- La Canna, G.; Arendar, I.; Maisano, F.; Monaco, F.; Collu, E.; Benussi, S.; De Bonis, M.; Castiglioni, A.; Alfieri, O. Real-time three-dimensional transesophageal echocardiography for assessment of mitral valve functional anatomy in patients with prolapse-related regurgitation. Am. J. Cardiol. 2011, 107, 1365–1374. [Google Scholar] [CrossRef]
- Churchill, T.W.; Yucel, E.; Deferm, S.; Levine, R.A.; Hung, J.; Bertrand, P.B. Mitral Valve Dysfunction in Patients with Annular Calcification: JACC Review Topic of the Week. J. Am. Coll. Cardiol. 2022, 80, 739–751. [Google Scholar] [CrossRef]
- Faletra, F.F.; Leo, L.A.; Paiocchi, V.L.; Caretta, A.; Viani, G.M.; Schlossbauer, S.A.; Demertzis, S.; Ho, S.Y. Anatomy of mitral annulus insights from non-invasive imaging techniques. Eur. Heart J. Cardiovasc. Imaging 2019, 20, 843–857. [Google Scholar] [CrossRef]
- Feldman, T.; Foster, E.; Glower, D.D.; Kar, S.; Rinaldi, M.J.; Fail, P.S.; Smalling, R.W.; Siegel, R.; Rose, G.A.; Engeron, E.; et al. EVEREST II Investigators. Percutaneous repair or surgery for mitral regurgitation. N. Engl. J. Med. 2011, 364, 1395–1406. [Google Scholar] [CrossRef]
- Agricola, E.; Ancona, F.; Bartel, T.; Brochet, E.; Dweck, M.; Faletra, F.; Lancellotti, P.; Mahmoud-Elsayed, H.; Marsan, N.A.; Maurovich-Hovart, P.; et al. Multimodality imaging for patient selection, procedural guidance, and follow-up of transcatheter interventions for structural heart disease: A consensus document of the EACVI Task Force on Interventional Cardiovascular Imaging: Part 1: Access routes, transcatheter aortic valve implantation, and transcatheter mitral valve interventions. Eur. Heart J. Cardiovasc. Imaging 2023, 24, e209–e268. [Google Scholar]
- Faletra, F.F.; Pedrazzini, G.; Pasotti, E.; Moccetti, T. Real-time three-dimensional transoesophageal echocardiography showing sequential events of the percutaneous mitral clip procedure. Eur. Heart J. 2009, 30, 2225. [Google Scholar] [CrossRef] [PubMed]
- Swaans, M.J.; Van den Branden, B.J.L.; Van der Heyden, J.A.S.; Post, M.C.; Rensing, B.J.W.M.; Eefting, F.D.; Plokker, H.W.M.; Jaarsma, W. Three-dimensional transoesophageal echocardiography in a patient undergoing percutaneous mitral valve repair using the edge-to-edge clip technique. Eur. J. Echocardiogr. 2009, 10, 982–983. [Google Scholar] [CrossRef]
- Genovese, D.; Addetia, K.; Kebed, K.; Kruse, E.; Yamat, M.; Narang, A.; Patel, A.R.; Badano, L.P.; Muraru, D.; Gonçalves, A.; et al. First Clinical Experience With 3-Dimensional Echocardiographic Transillumination Rendering. JACC Cardiovasc. Imaging 2019, 12, 1868–1871. [Google Scholar] [CrossRef]
- Zoghbi, W.A.; Adams, D.; Bonow, R.O.; Enriquez-Sarano, M.; Foster, E.; Grayburn, P.A.; Hahn, R.T.; Han, Y.; Hung, J.; Roberto; et al. Recommendations for Noninvasive Evaluation of Native Valvular Regurgitation: A Report. from the American Society of Echocardiography Developed in Collaboration with the Society for Cardiovascular Magnetic Resonance. J. Am. Soc. Echocardiogr. 2017, 30, 303–371. [Google Scholar] [CrossRef]
- Cobey, F.C.; Ashihkmina, E.; Edrich, T.; Fox, J.; Shook, D.; Bollen, B.; Breeze, J.L.; Ursprung, W.W.S.; Shernan, S.K. The Mechanism of Mitral Regurgitation Influences the Temporal Dynamics of the Vena Contracta Area as Measured with Color Flow Doppler. Anesth. Analg. 2016, 122, 321–329. [Google Scholar] [CrossRef]
- Yosefy, C.; Hung, J.; Chua, S.; Vaturi, M.; Ton-Nu, T.-T.; Handschumacher, M.D.; Levine, R.A. Direct measurement of vena contracta area by real-time 3-dimensional echocardiography for assessing severity of mitral regurgitation. Am. J. Cardiol. 2009, 104, 978–983. [Google Scholar] [CrossRef]
- Marsan, N.A.; Westenberg, J.J.M.; Ypenburg, C.; Delgado, V.; van Bommel, R.J.; Roes, S.D.; Nucifora, G.; van der Geest, R.J.; de Roos, A.; Johan; et al. Quantification of functional mitral regurgitation by real-time 3D echocardiography: Comparison with 3D velocity-encoded cardiac magnetic resonance. JACC Cardiovasc. Imaging 2009, 2, 1245–1252. [Google Scholar] [CrossRef]
- Singh, A.; Su, J.; This, A.; Allaire, S.; Rouet, J.-M.; Laghi, A.; Kebed, K.; Addetia, K.; Schreckenberg, M.; Lang, R.M.; et al. A Novel Approach for Semiautomated Three-Dimensional Quantification of Mitral Regurgitant Volume Reflects a More Physiologic Approach to Mitral Regurgitation. J. Am. Soc. Echocardiogr. 2022, 35, 940–946. [Google Scholar] [CrossRef]


| Development | Description |
|---|---|
| New generation of piezoelectric crystals |
|
| Miniaturization of piezoelectric crystals |
|
| Fully sampled matrix array transducer |
|
| Miniaturization of electronic circuitries |
|
| Phenotype | Description | Image |
|---|---|---|
| Fibroelastic deficiency | This phenotype is characterized by a deficient production of collagen, elastin, and proteoglycans. Leaflets preserve their own three-layer arrangement, but upon surgical inspection, they appear fragile and translucent. The etiology of connective tissue deficiency in FED is unknown, but it has been suggested that it may be the result of an accelerated ageing process. The cause of regurgitation is the rupture of one or more primary chordae tendineae, which usually involves a single scallop. The figure shows a small P2 prolapse in an otherwise apparently normal MV. | 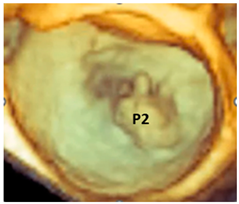 |
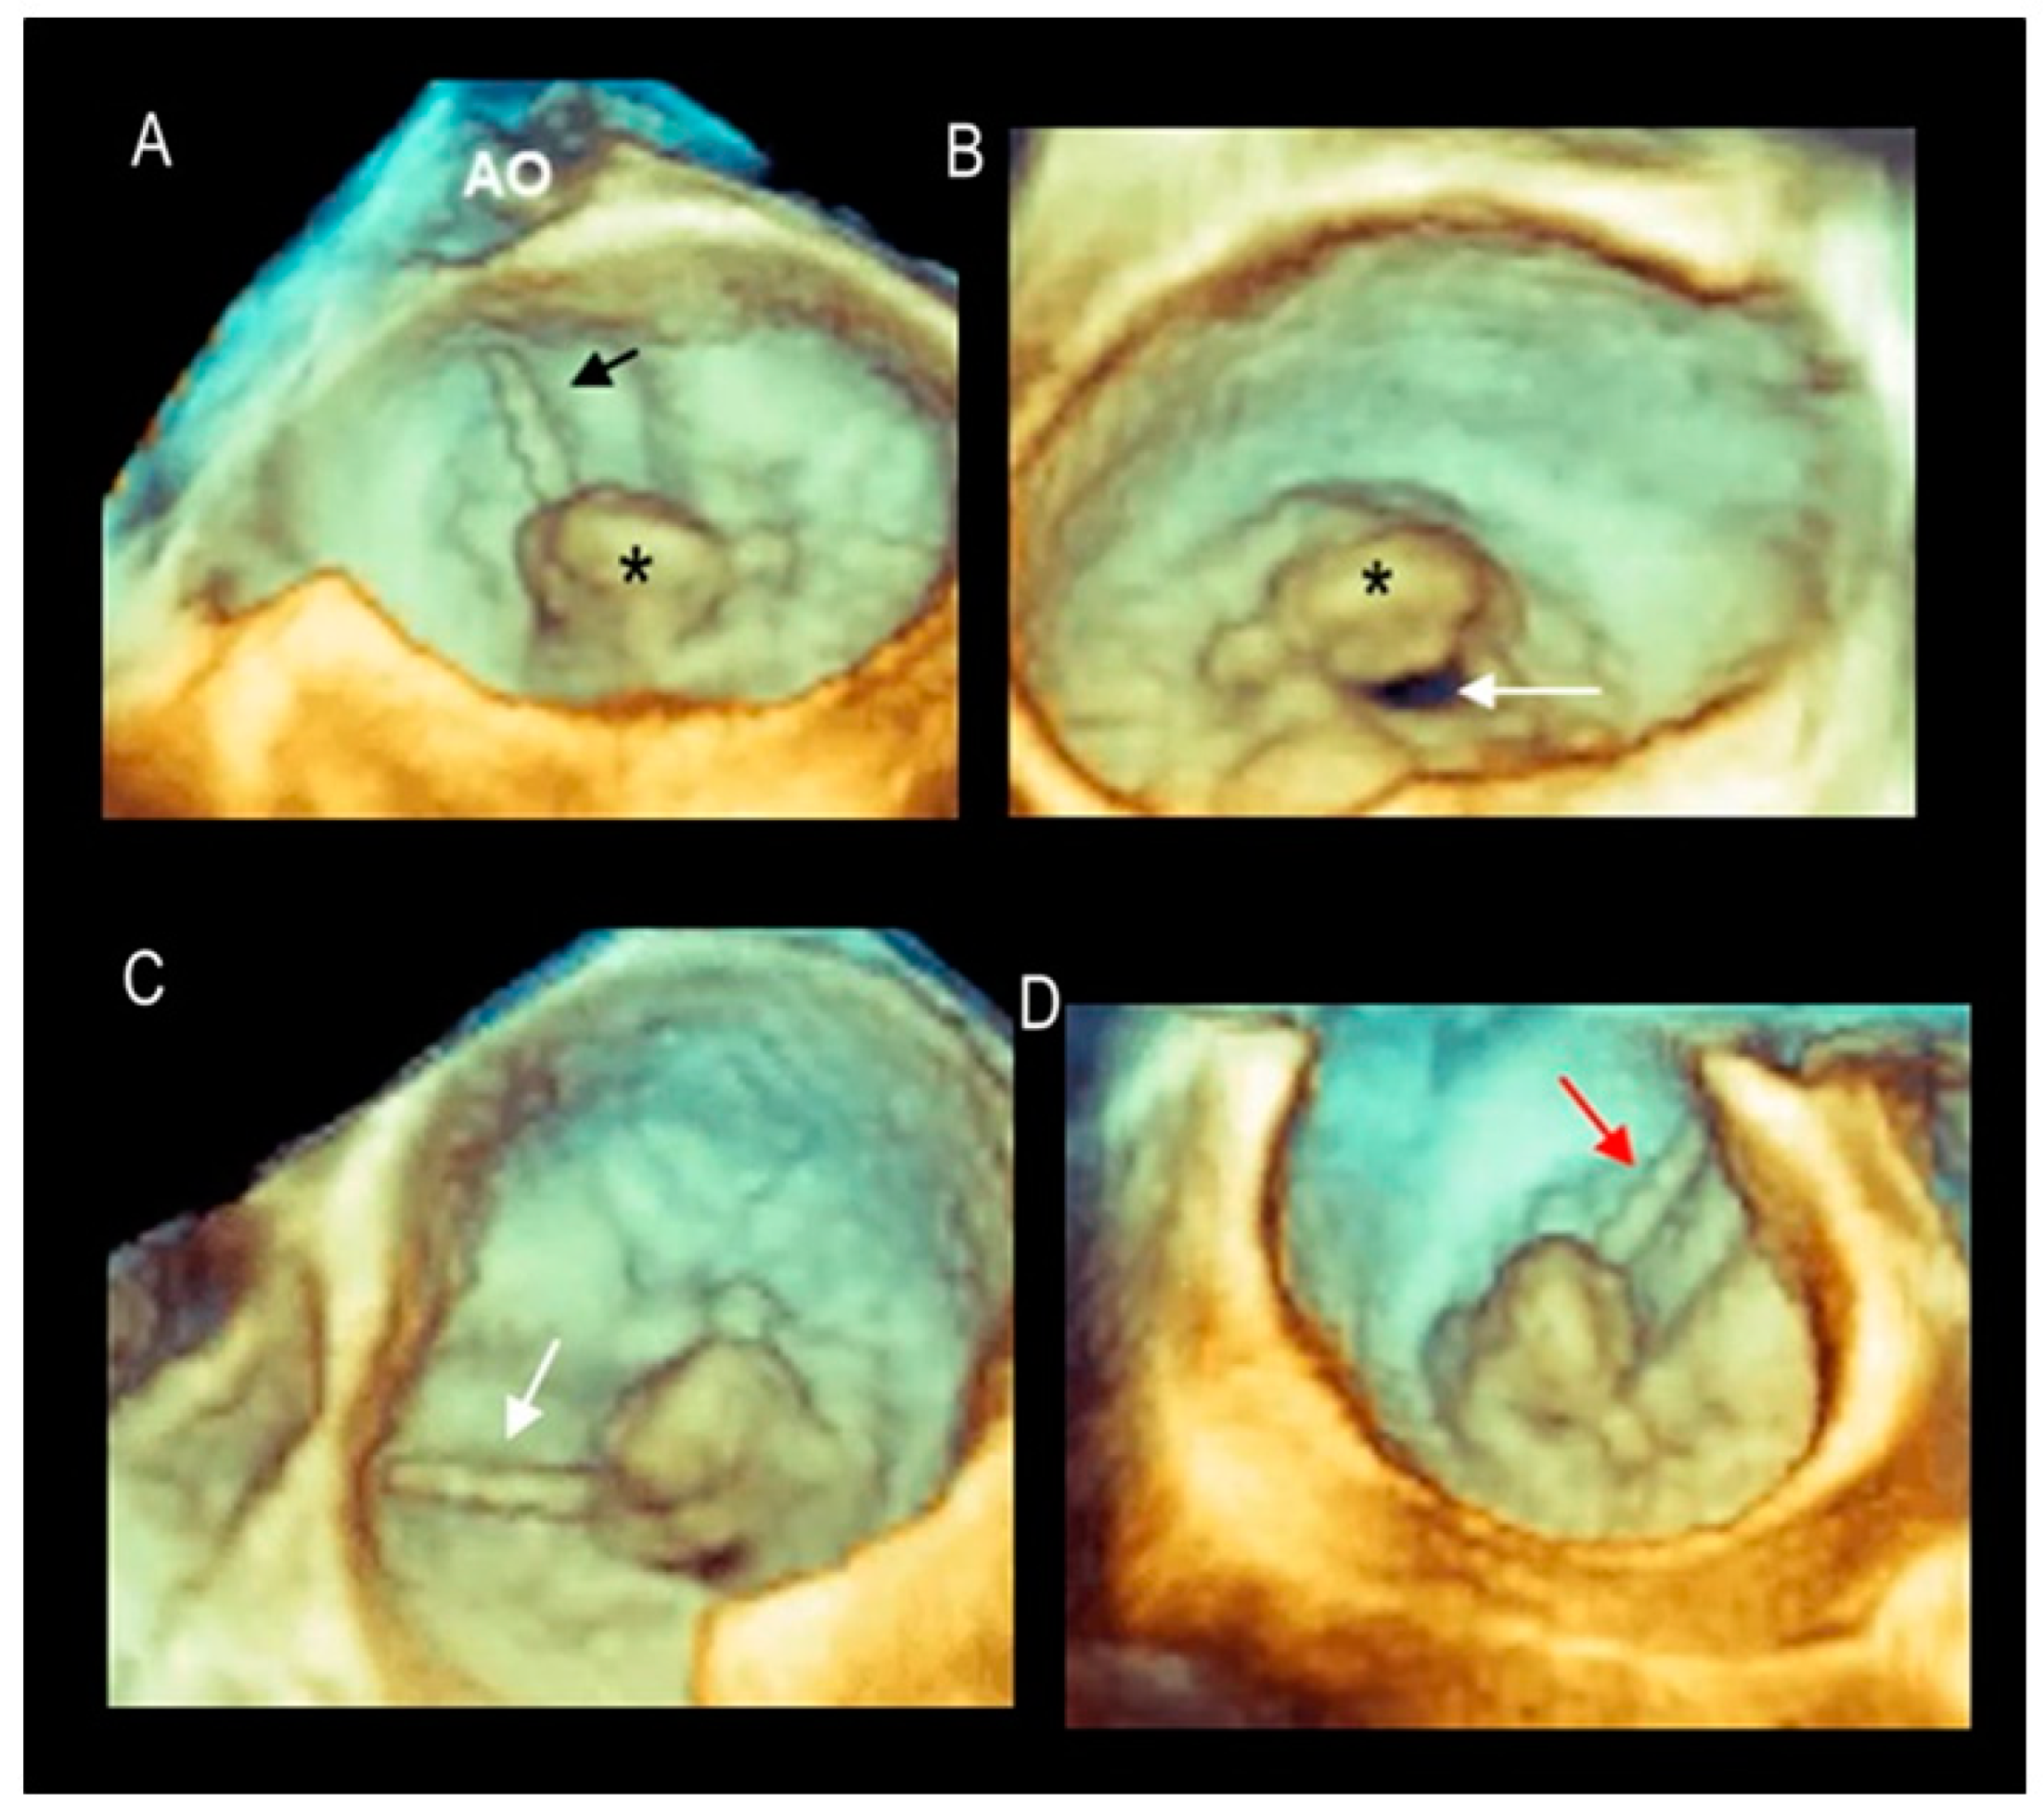
| Fibroelastic deficiency plus | This phenotype is characterized by a single scallop prolapse, but the involved scallop is redundant and affected by myxomatous degeneration. The remaining scallops are normal. Qualitative histological lesions in the prolapsed tissue of FED plus are similar to those of Barlow’s disease. It has been suggested that FED plus may be considered a sort of worsening stage of FED, leading to the hypothesis that the myxomatous changes could also be secondary to jet lesions. The figure shows a large P2 prolapse with ruptured chordae tendineae (arrows). | 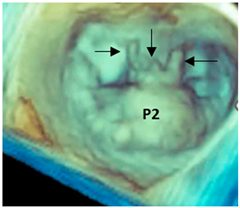 |
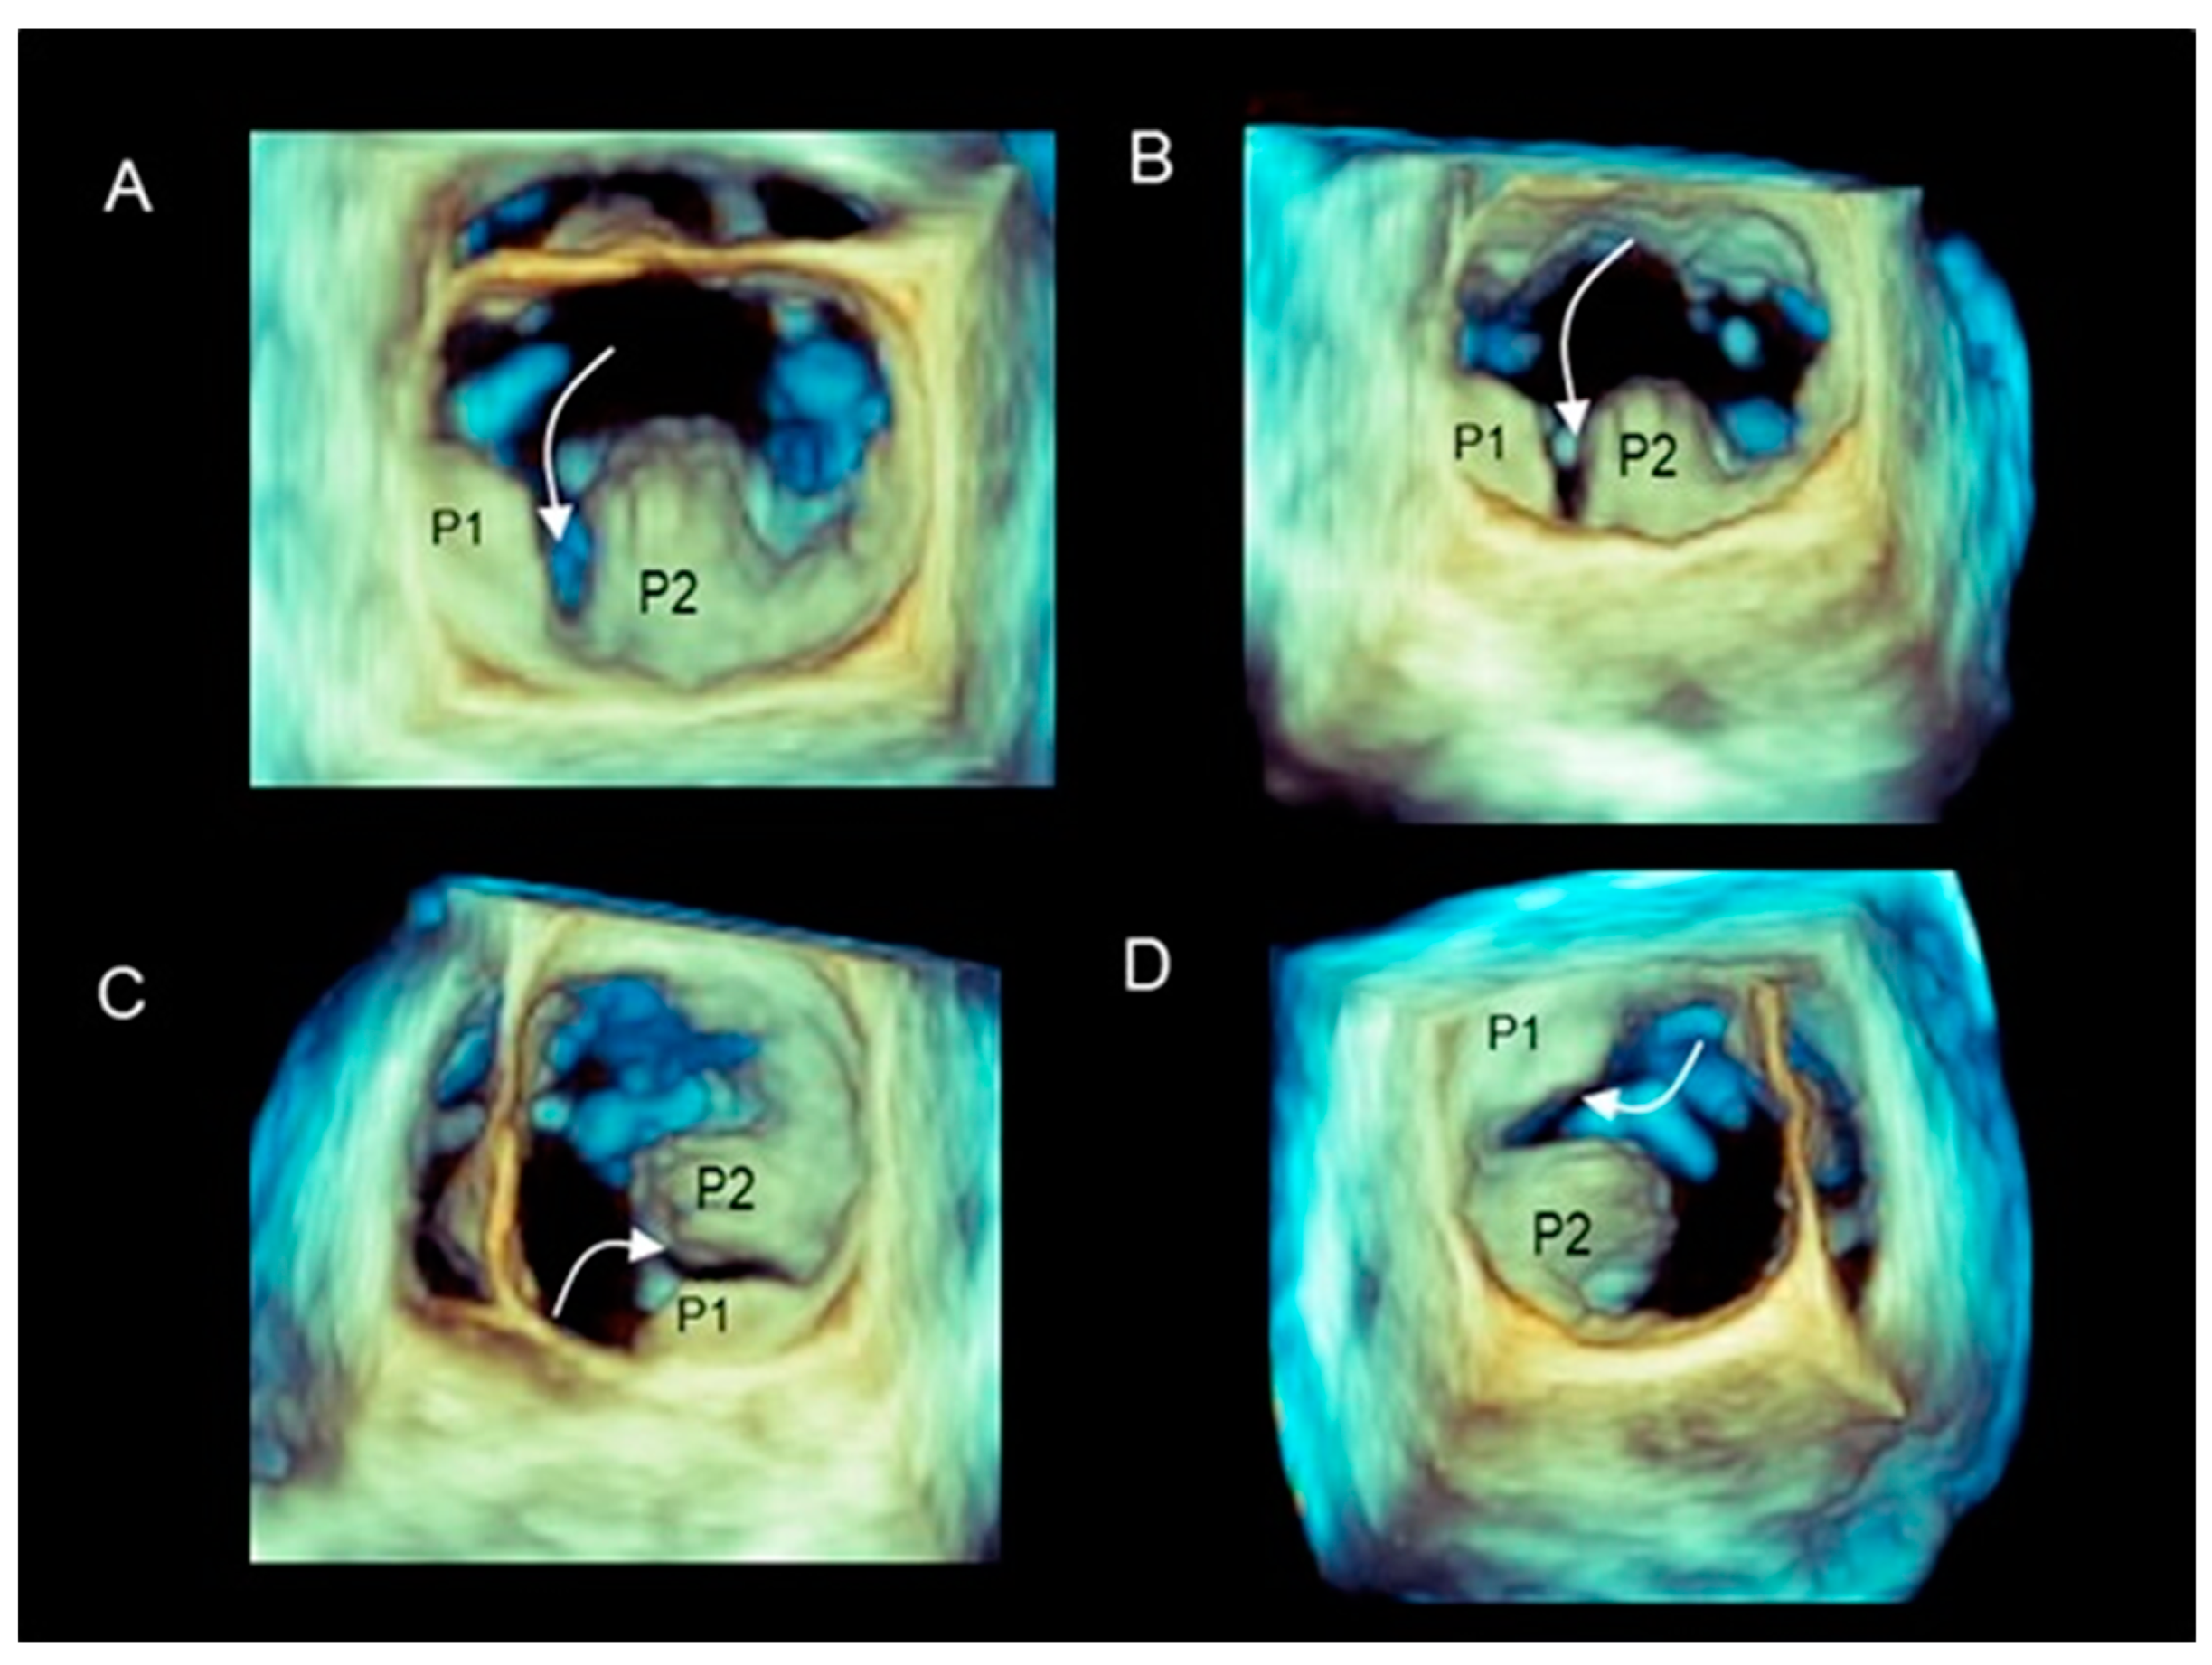
| Forme fruste | In this phenotype, the entire posterior leaflet is redundant and is affected by myxomatous degeneration, while the anterior leaflet is macroscopically and histologically normal. It can be speculated that this phenotype is an incomplete form of Barlow’s disease. The figure shows multiple prolapses (asterisks) of the posterior leaflet. | 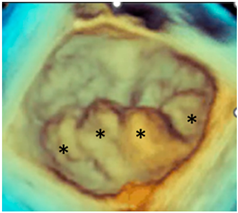 |
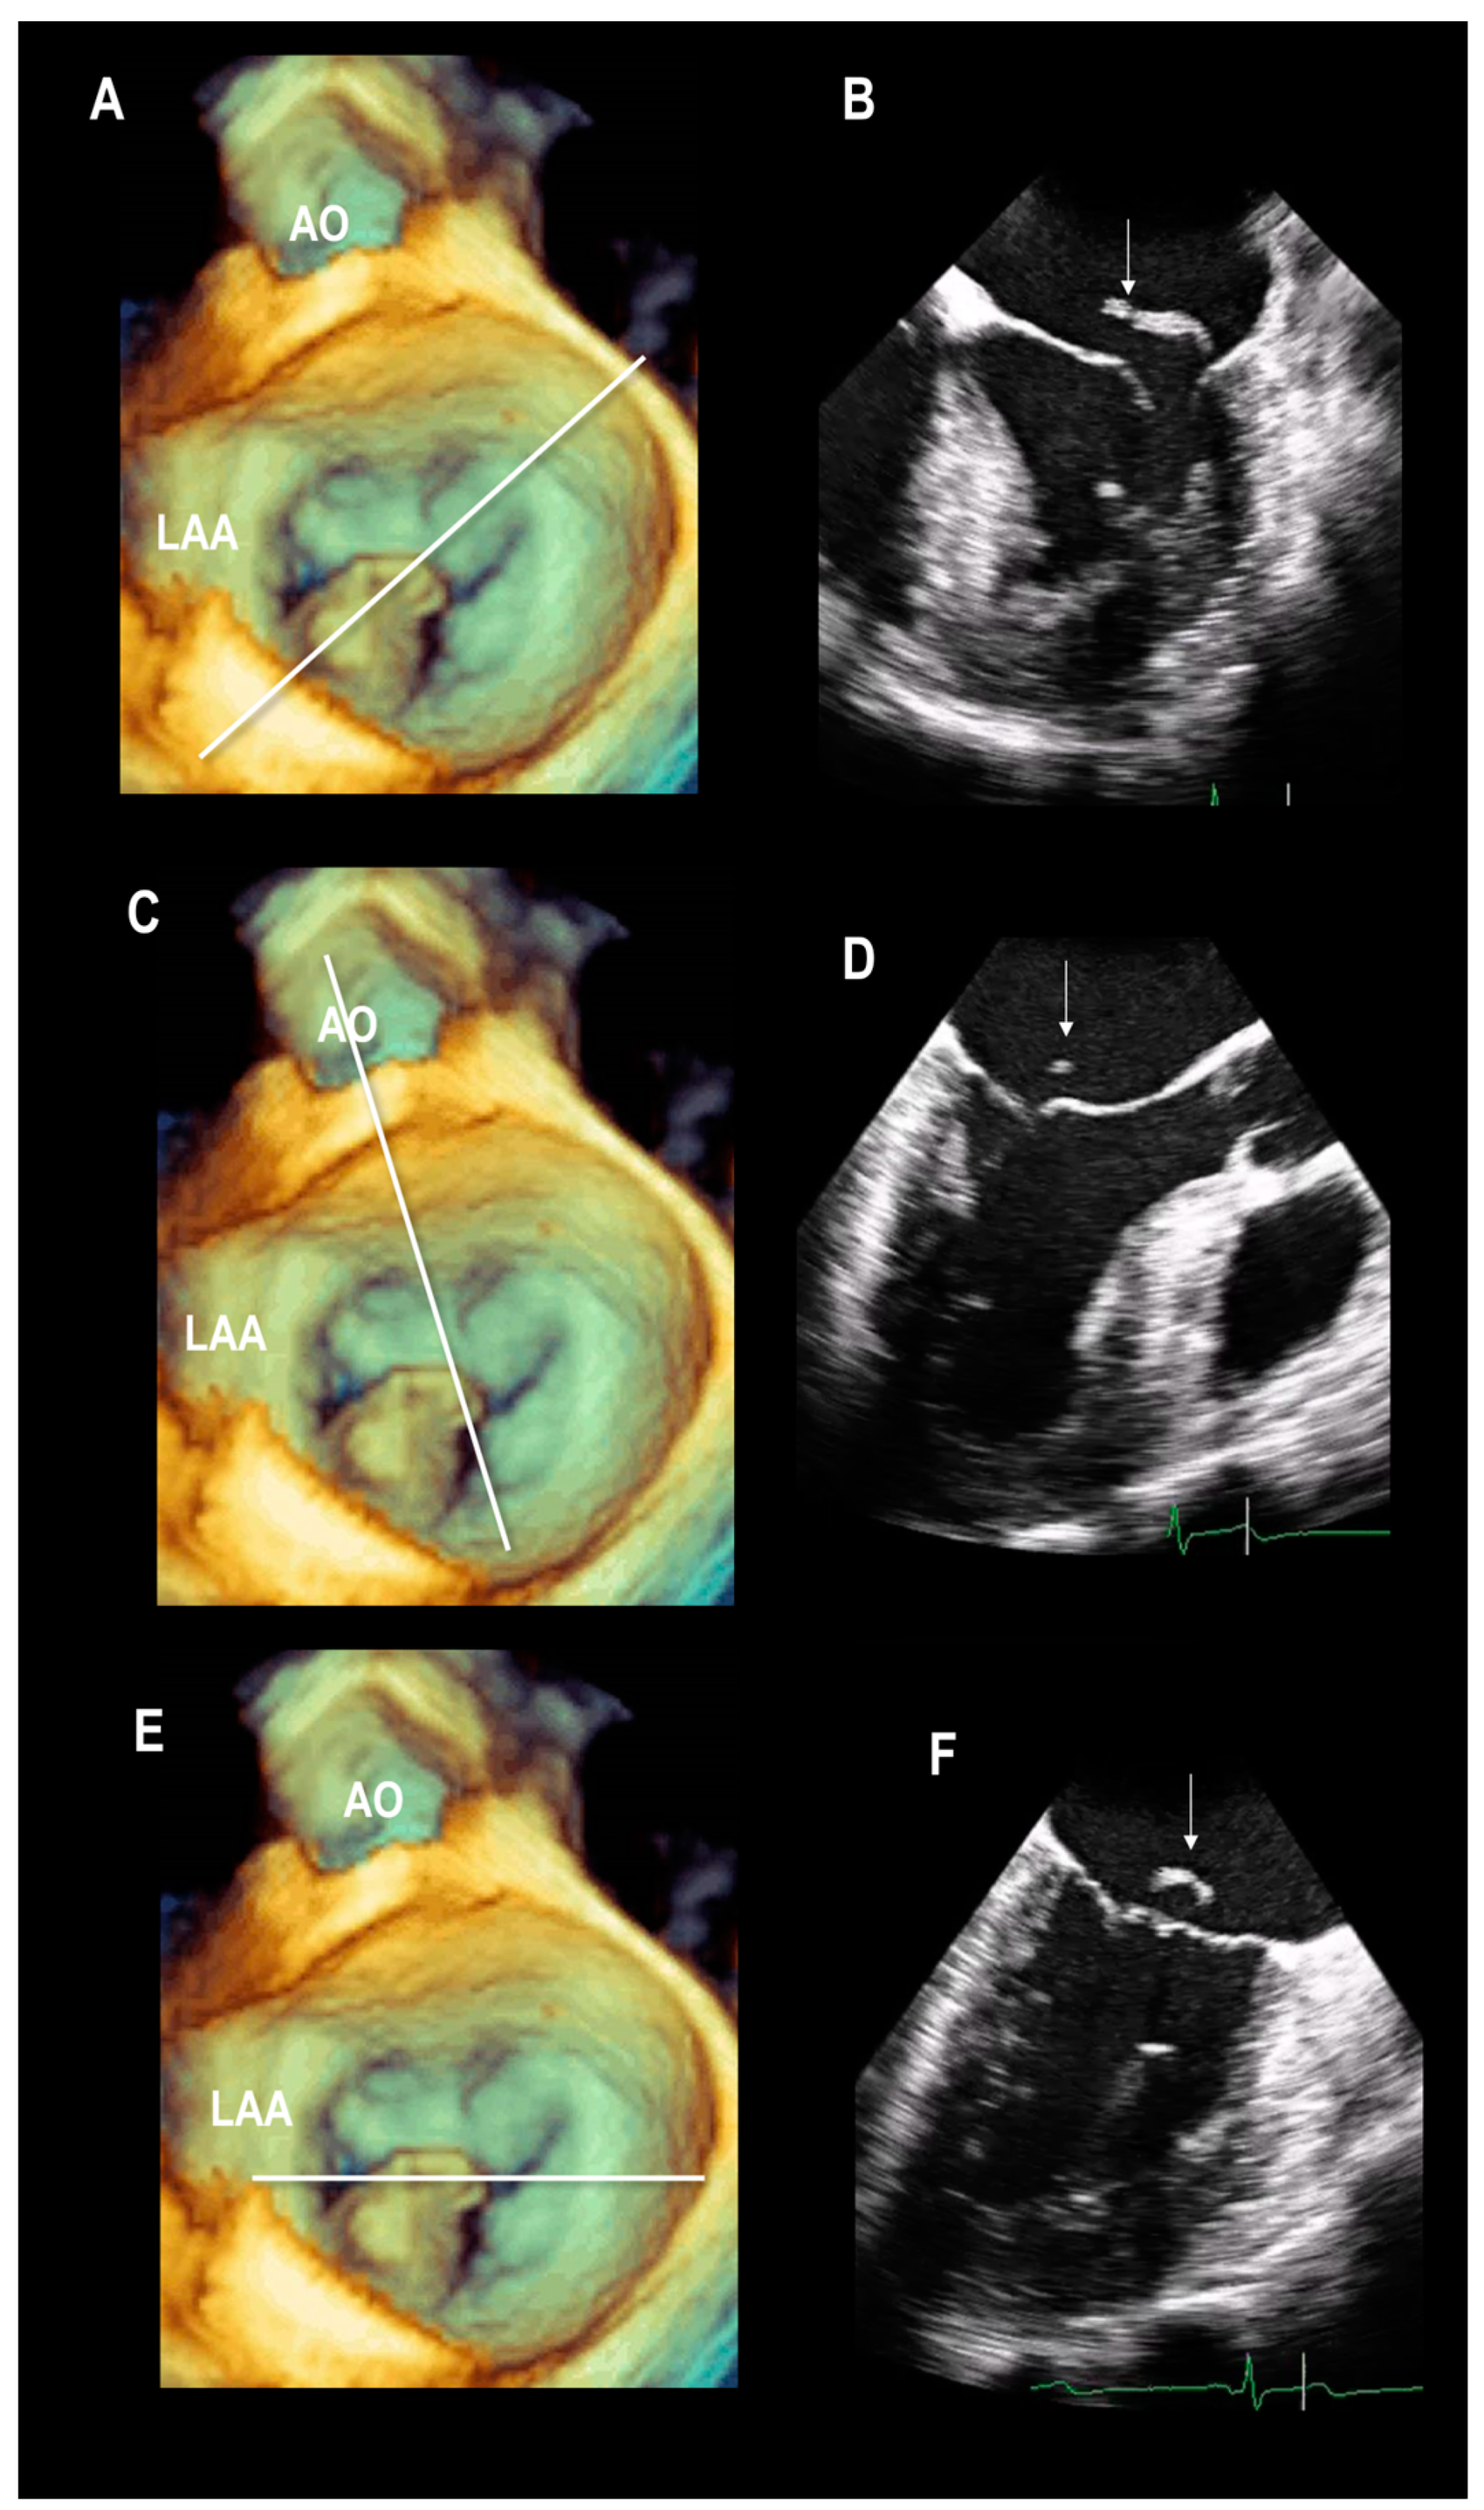
| Barlow’s disease | Barlow’s disease is the result of an abnormal accumulation of myxomatous substances (mainly proteoglycans) in the spongiosa layer, and a simultaneous disruption of collagen fibers in the fibrosa layer. As a consequence, the three-layered arrangement of the leaflets is lost. The characteristic macroscopic appearance, either in pathological specimens or in the operating room, is that of a thick, bulky, redundant leaflet, elongated chordae tendineae, and annular dilatation. The excess leaflet tissue leads to the displacement of both leaflets beyond the annulus, with a lack of coaptation and consequent MR. The figure shows an example of Barlow’s disease seen from a tangential view largely protruding into the left atrium. LAA = left atrial appendage, AML = anterior mitral leaflet; PML = posterior mitral leaflet. | 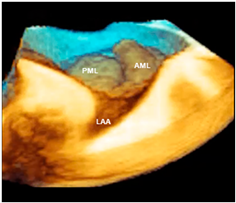 |
| Advantages of 3D TEE | Description | Image |
|---|---|---|
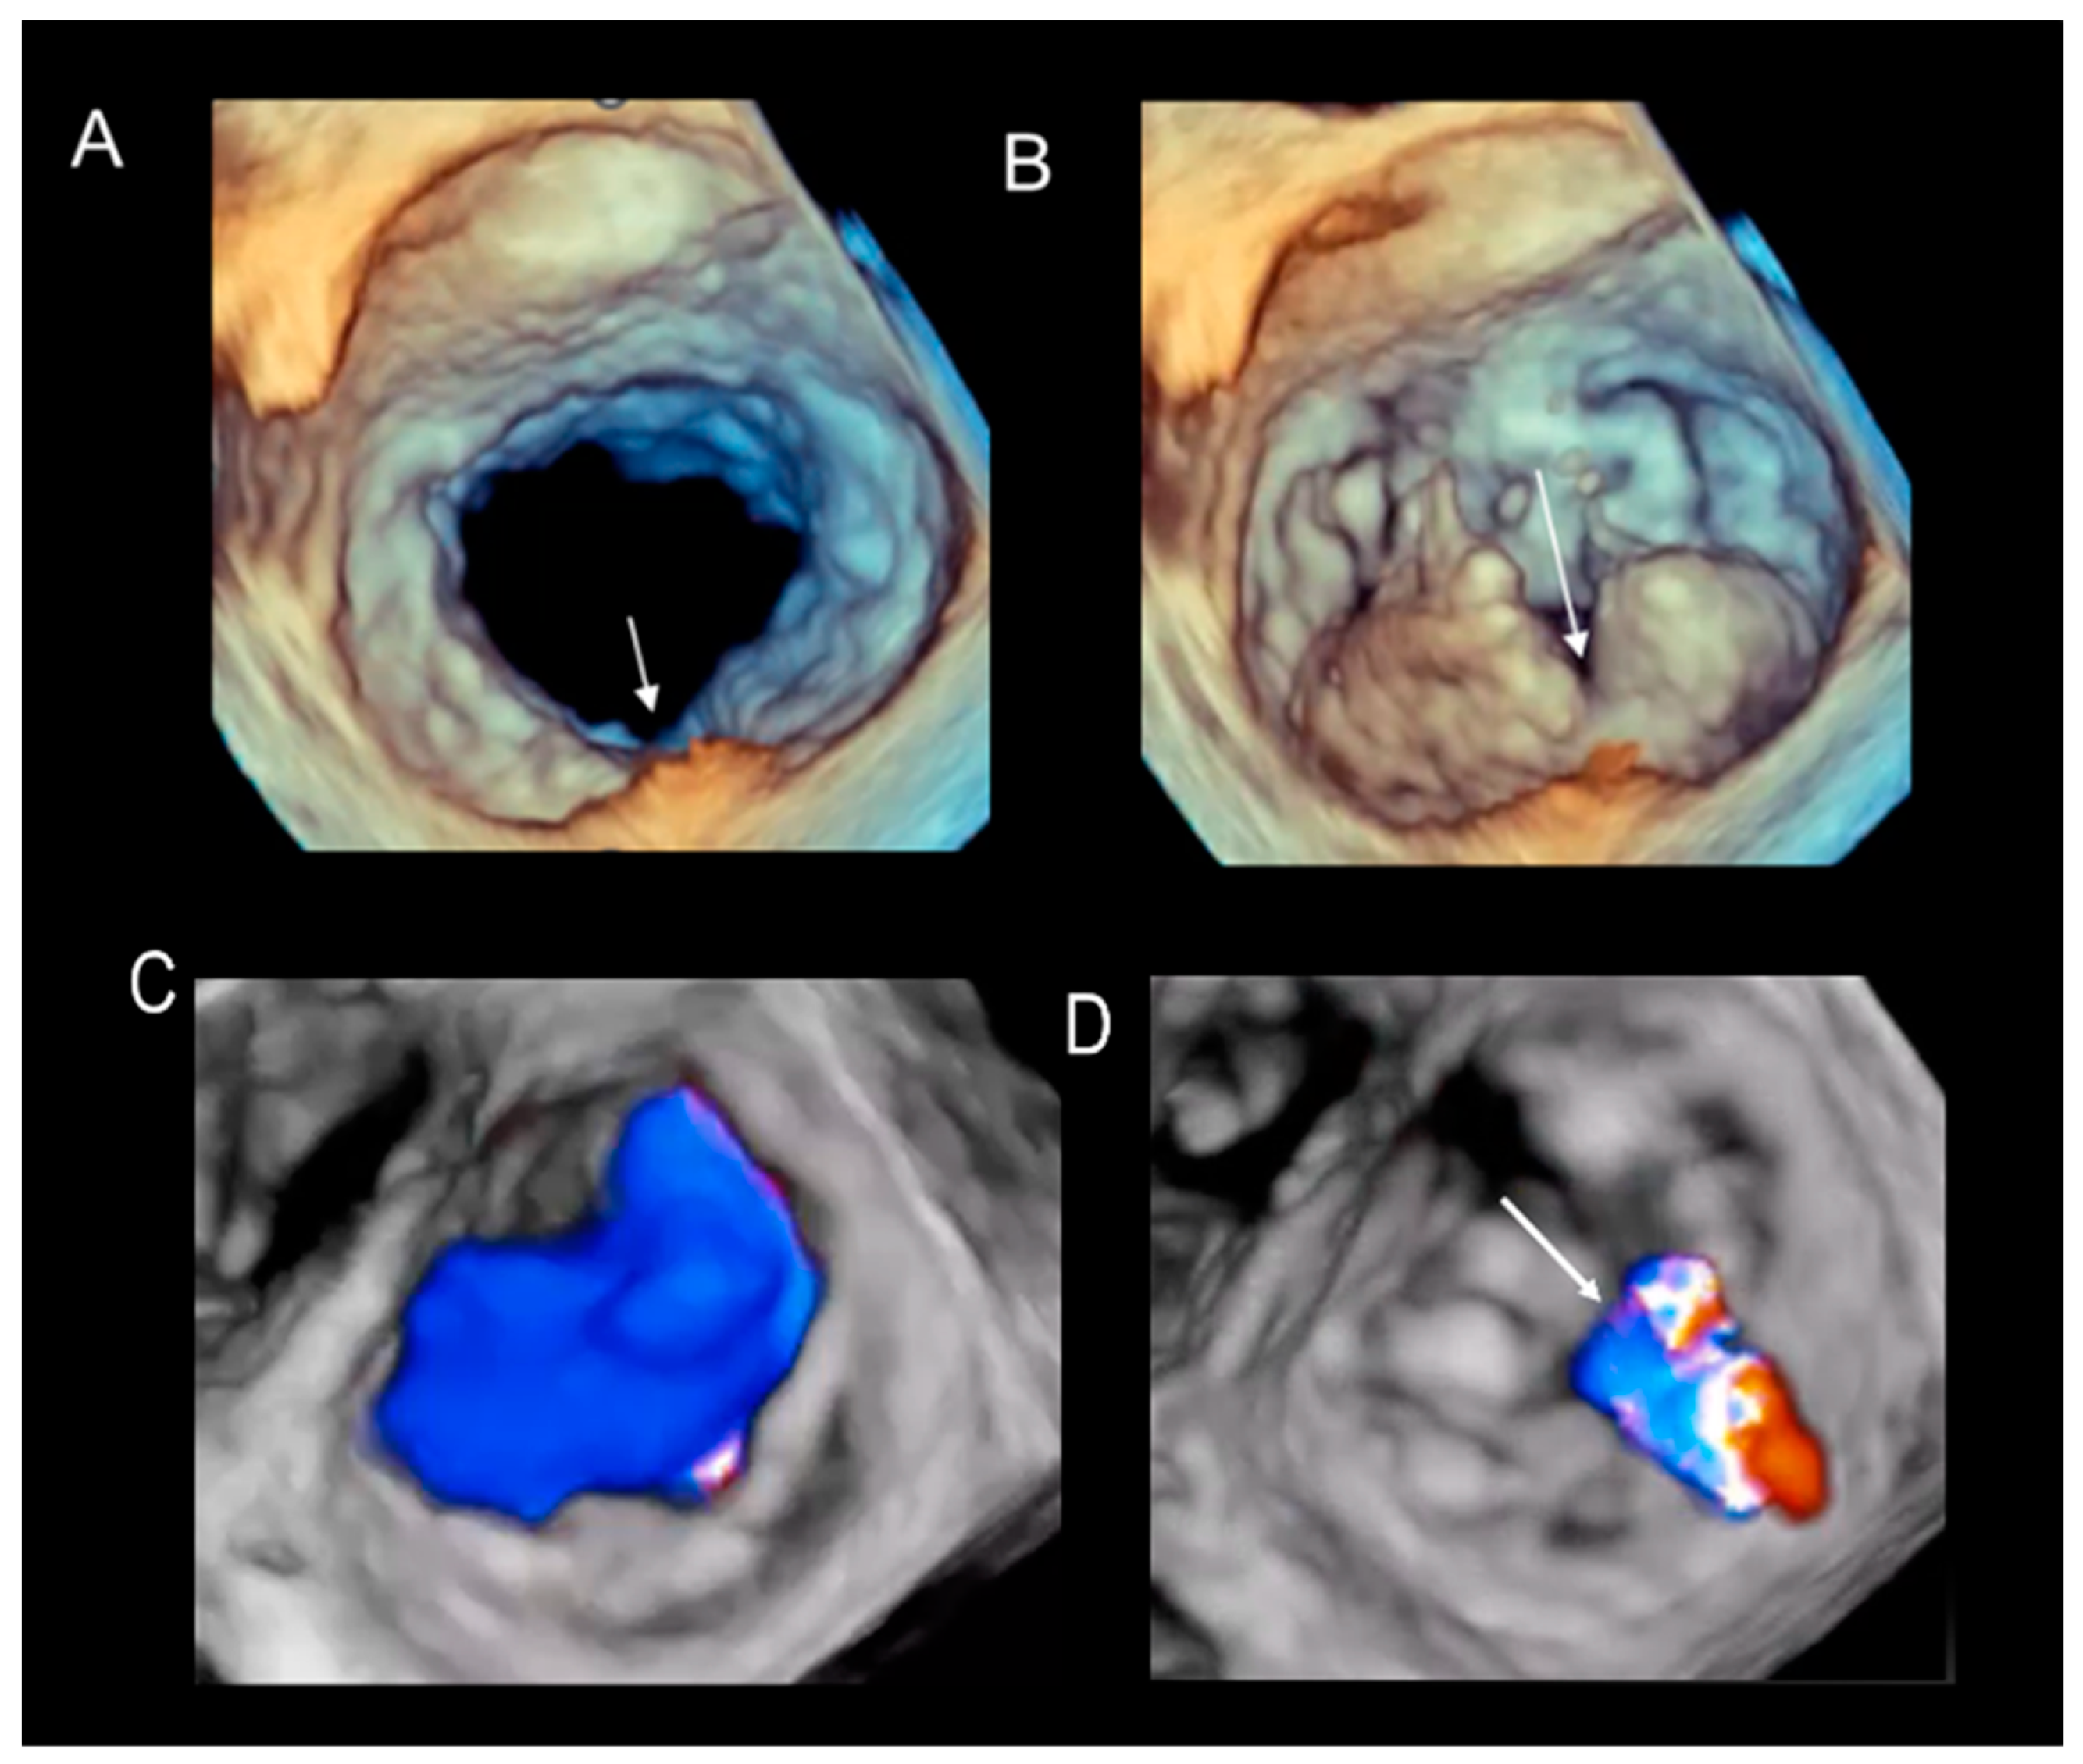
| Long segment of catheter | The pyramidal data set embraces large volumes of the 3D space and allows the visualization of long segments of guide catheter (GC) without moving the probe. Moreover, small details such as the double ring at the tip of the GC can be visualized. MCDS = mitral clip delivery system. | 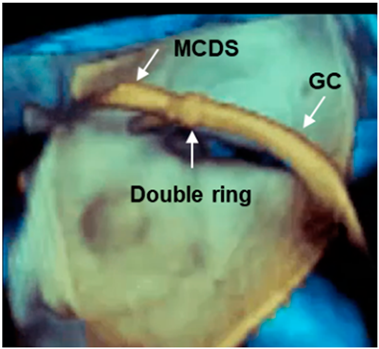 |
| Advancement and steering of device in the left atrium | 3D TEE allows the visualization of real-time, three-dimensional images of the motion of the GC and clip delivery system into the left atrium towards the MV. The dotted arrows in panels A–C point at the motion of the catheter. The arrows in panel D point at the arms of the clip. Of note is that the spatial relationship between the device and MV is easily understandable. | 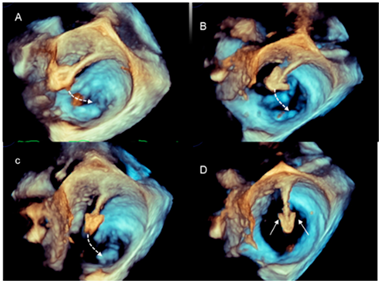 |
| Positioning the arms perpendicular to the coaptation line | Before the advent of 3D TEE, this step was guided by 2D TEE in a transgastric short-axis view at the level of the tip of the mitral leaflets. This cross-section is often difficult to obtain. Conversely, 3D TEE provides images easily and they are immediately understandable by interventionists, who can manipulate the system while adjusting the position. Figure A–D show a still frame of the position of the clip delivery system. |  |
| Panoramic view | 3D TEE has the ability to include in a single panoramic view the mitral clip delivery system (clip, catheter) and the anatomic structures involved in the procedure with an acceptable volume rate. | 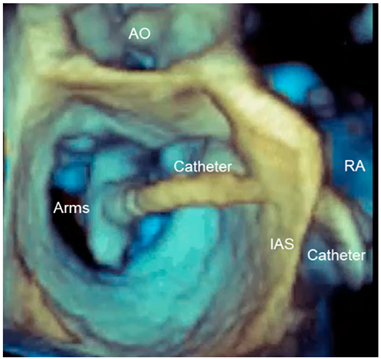 |
Disclaimer/Publisher’s Note: The statements, opinions and data contained in all publications are solely those of the individual author(s) and contributor(s) and not of MDPI and/or the editor(s). MDPI and/or the editor(s) disclaim responsibility for any injury to people or property resulting from any ideas, methods, instructions or products referred to in the content. |
© 2024 by the authors. Licensee MDPI, Basel, Switzerland. This article is an open access article distributed under the terms and conditions of the Creative Commons Attribution (CC BY) license (https://creativecommons.org/licenses/by/4.0/).
Share and Cite
Faletra, F.F.; La Franca, E.; Leo, L.A.; Sade, L.E.; Katz, W.; Musumeci, F.; Gandolfo, C.; Pilato, M.; Cipriani, M. The Key Role of 3D TEE in Assessing the Morphology of Degenerative Mitral Valve Regurgitation. J. Cardiovasc. Dev. Dis. 2024, 11, 342. https://doi.org/10.3390/jcdd11110342
Faletra FF, La Franca E, Leo LA, Sade LE, Katz W, Musumeci F, Gandolfo C, Pilato M, Cipriani M. The Key Role of 3D TEE in Assessing the Morphology of Degenerative Mitral Valve Regurgitation. Journal of Cardiovascular Development and Disease. 2024; 11(11):342. https://doi.org/10.3390/jcdd11110342
Chicago/Turabian StyleFaletra, Francesco Fulvio, Eluisa La Franca, Laura Anna Leo, Leyla Elif Sade, William Katz, Francesco Musumeci, Caterina Gandolfo, Michele Pilato, and Manlio Cipriani. 2024. "The Key Role of 3D TEE in Assessing the Morphology of Degenerative Mitral Valve Regurgitation" Journal of Cardiovascular Development and Disease 11, no. 11: 342. https://doi.org/10.3390/jcdd11110342
APA StyleFaletra, F. F., La Franca, E., Leo, L. A., Sade, L. E., Katz, W., Musumeci, F., Gandolfo, C., Pilato, M., & Cipriani, M. (2024). The Key Role of 3D TEE in Assessing the Morphology of Degenerative Mitral Valve Regurgitation. Journal of Cardiovascular Development and Disease, 11(11), 342. https://doi.org/10.3390/jcdd11110342