
Genetic Predisposition to a Higher Whole Body Water Mass May Increase the Risk of Atrial Fibrillation: A Mendelian Randomization Study

Abstract
1. Introduction
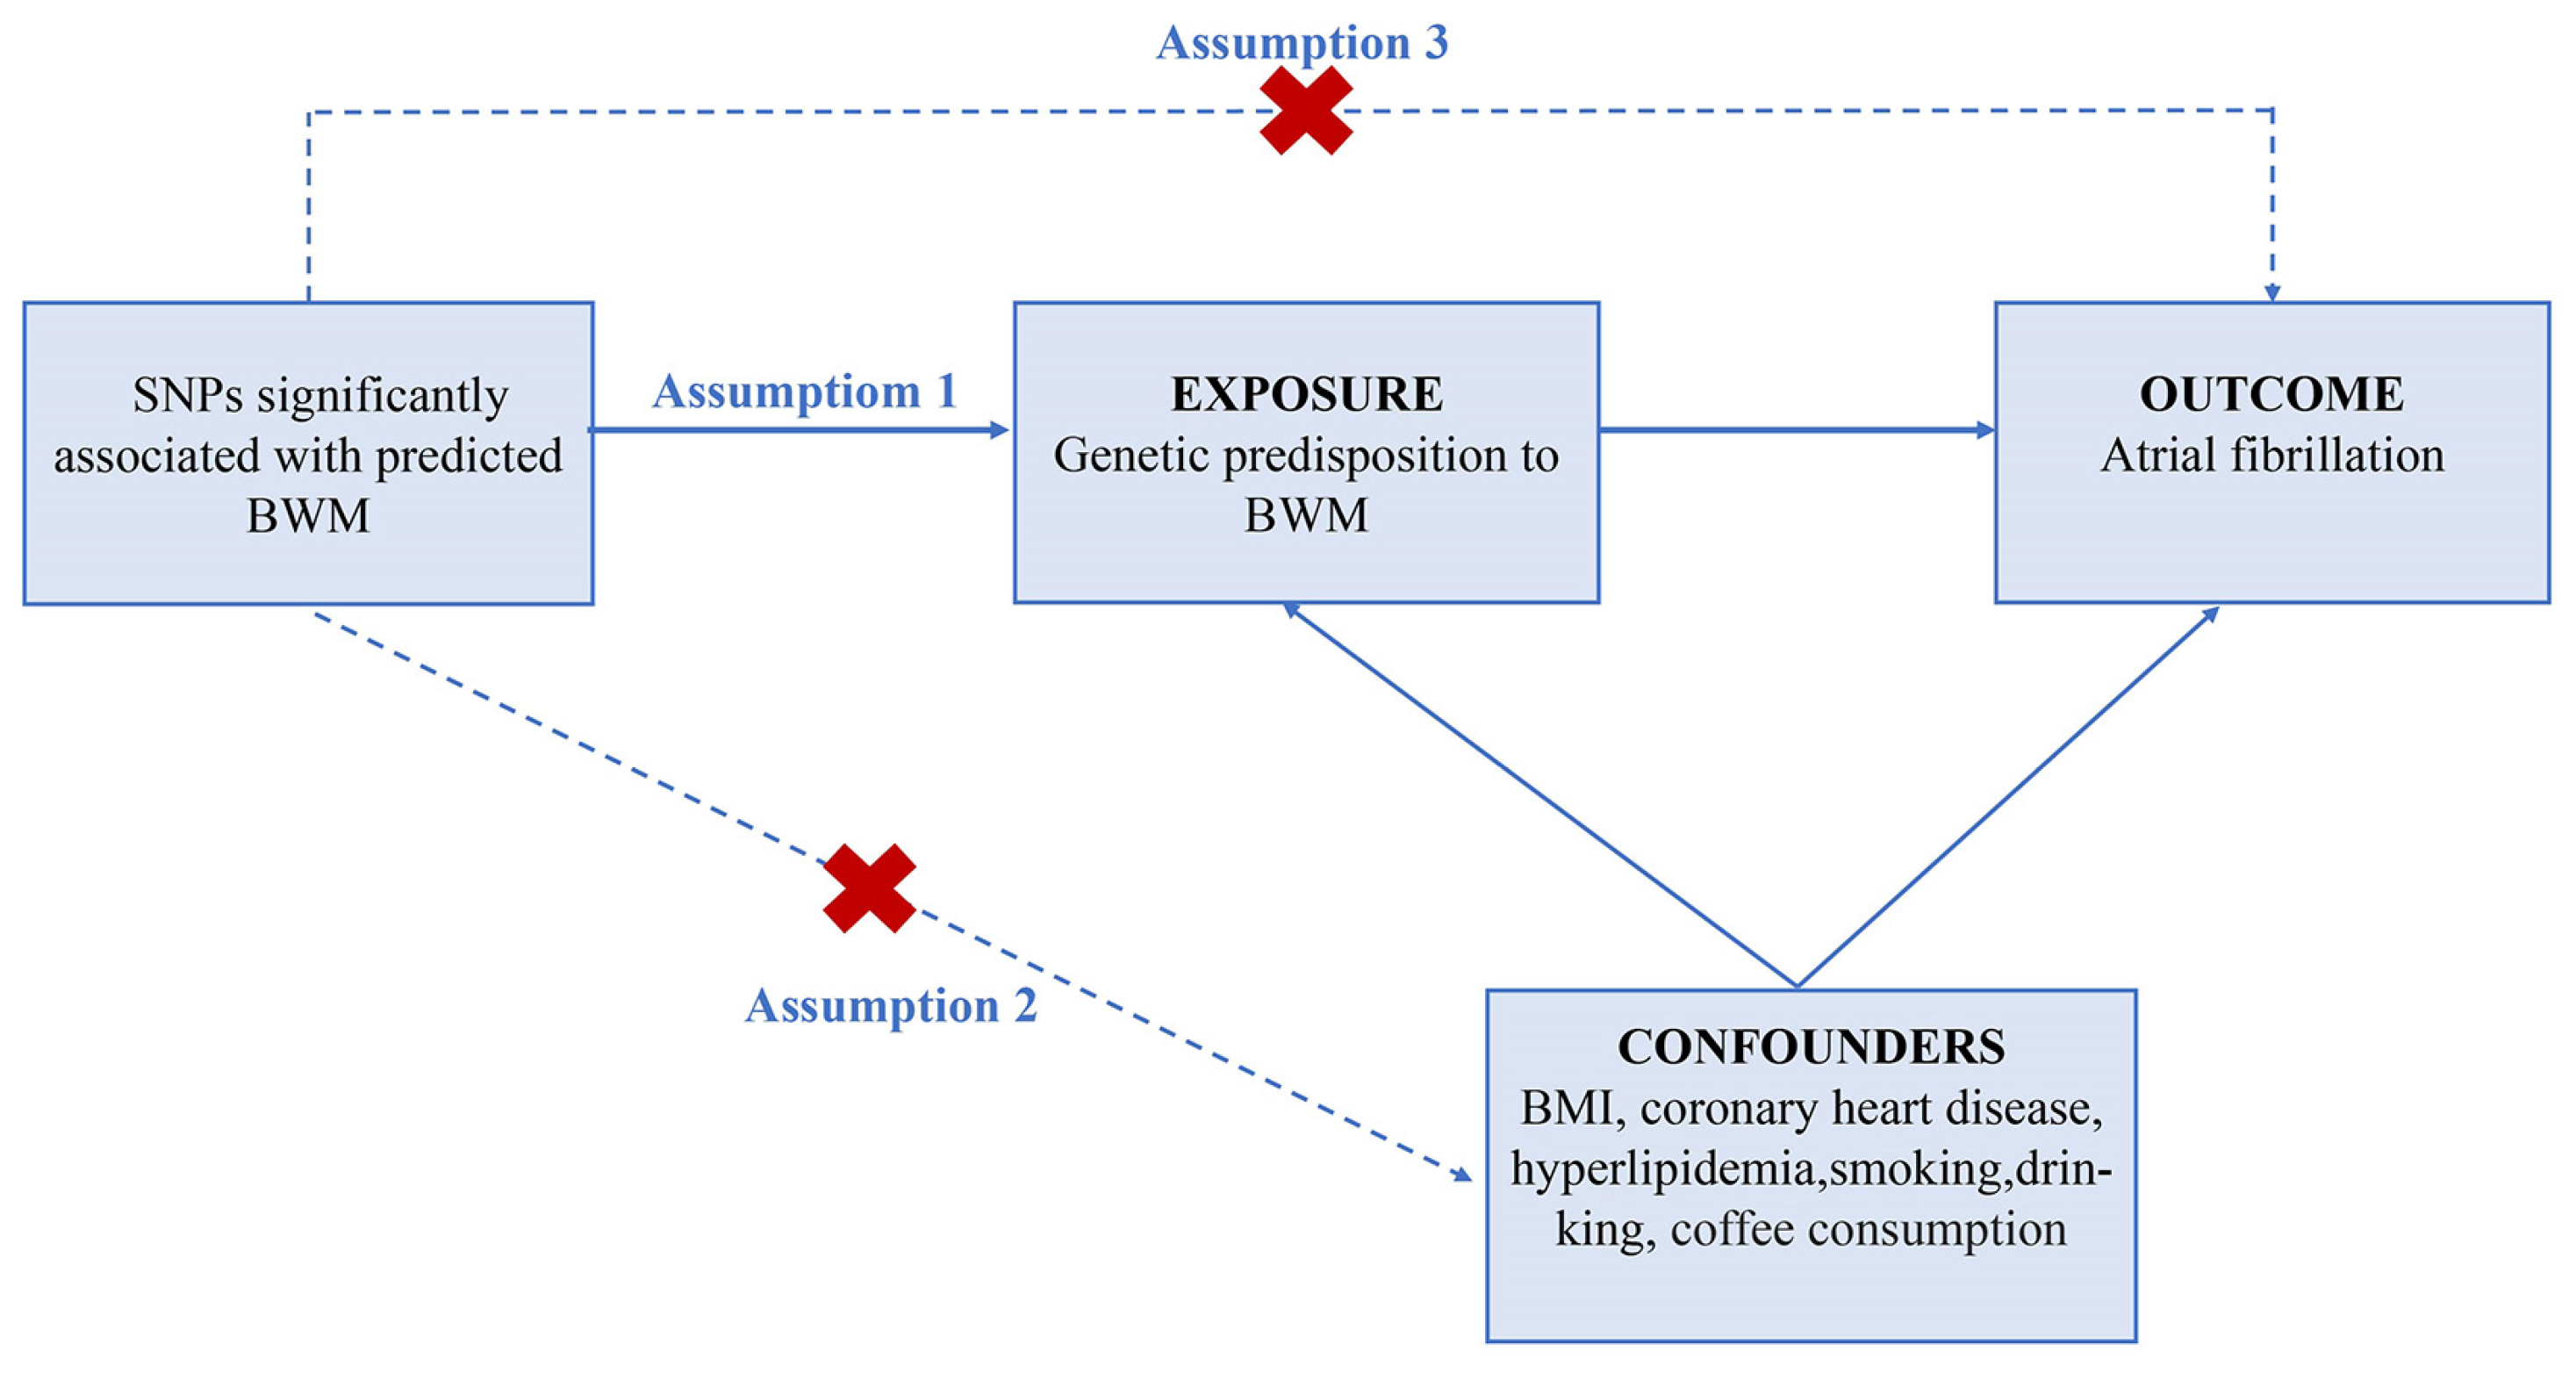
2. Methods
2.1. Data Sources
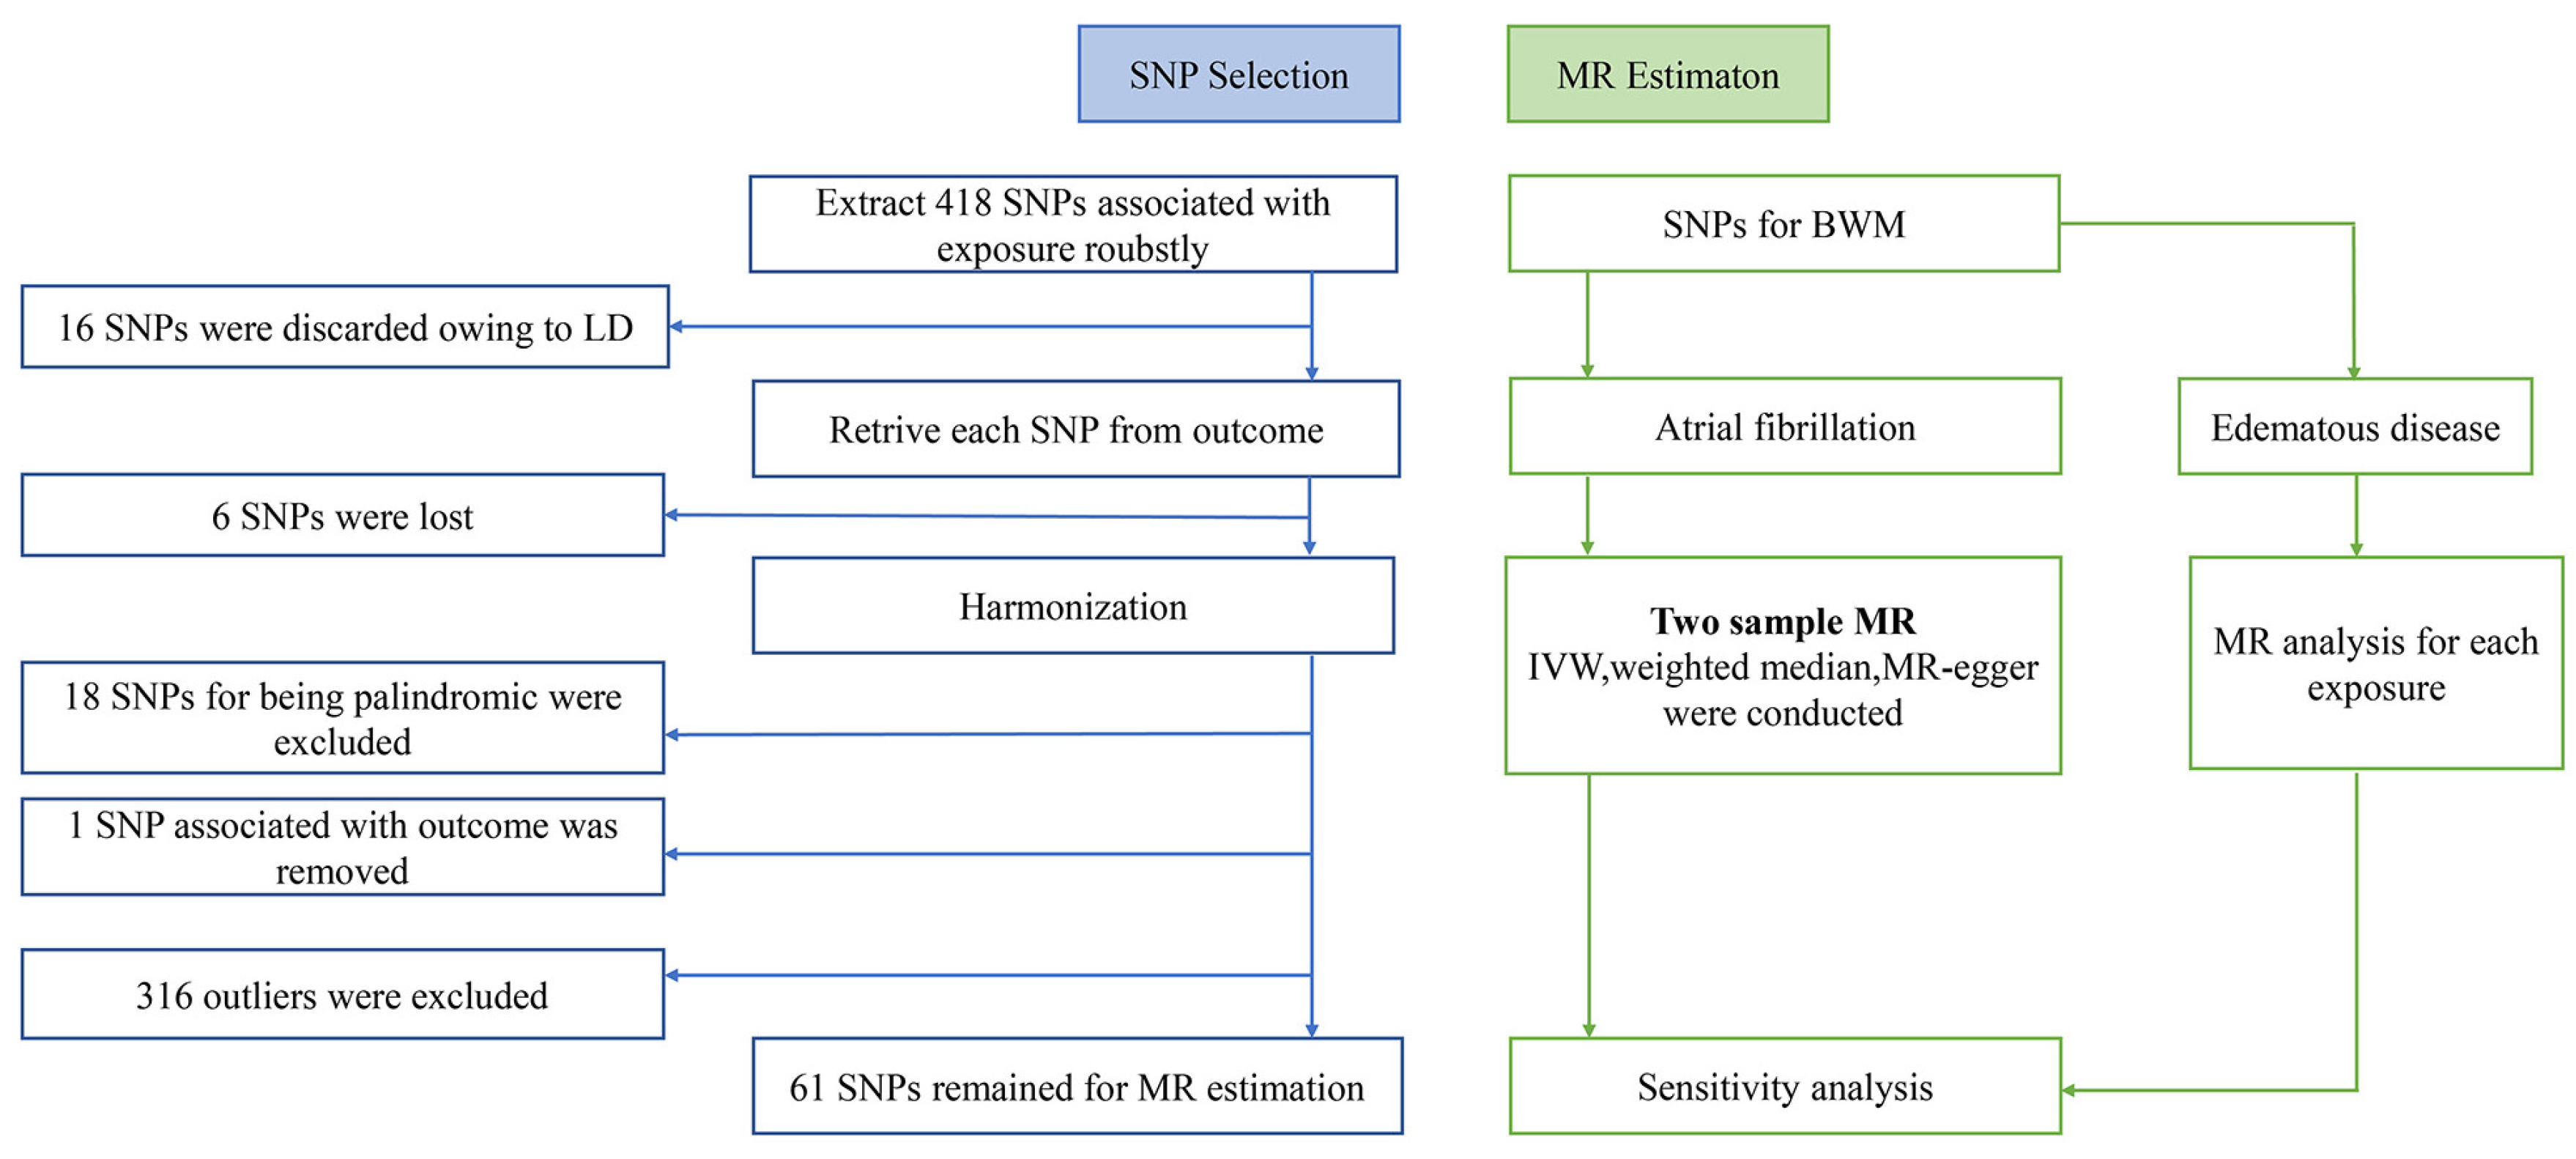
2.2. Selection of Genetic Instruments
2.3. MR Estimates
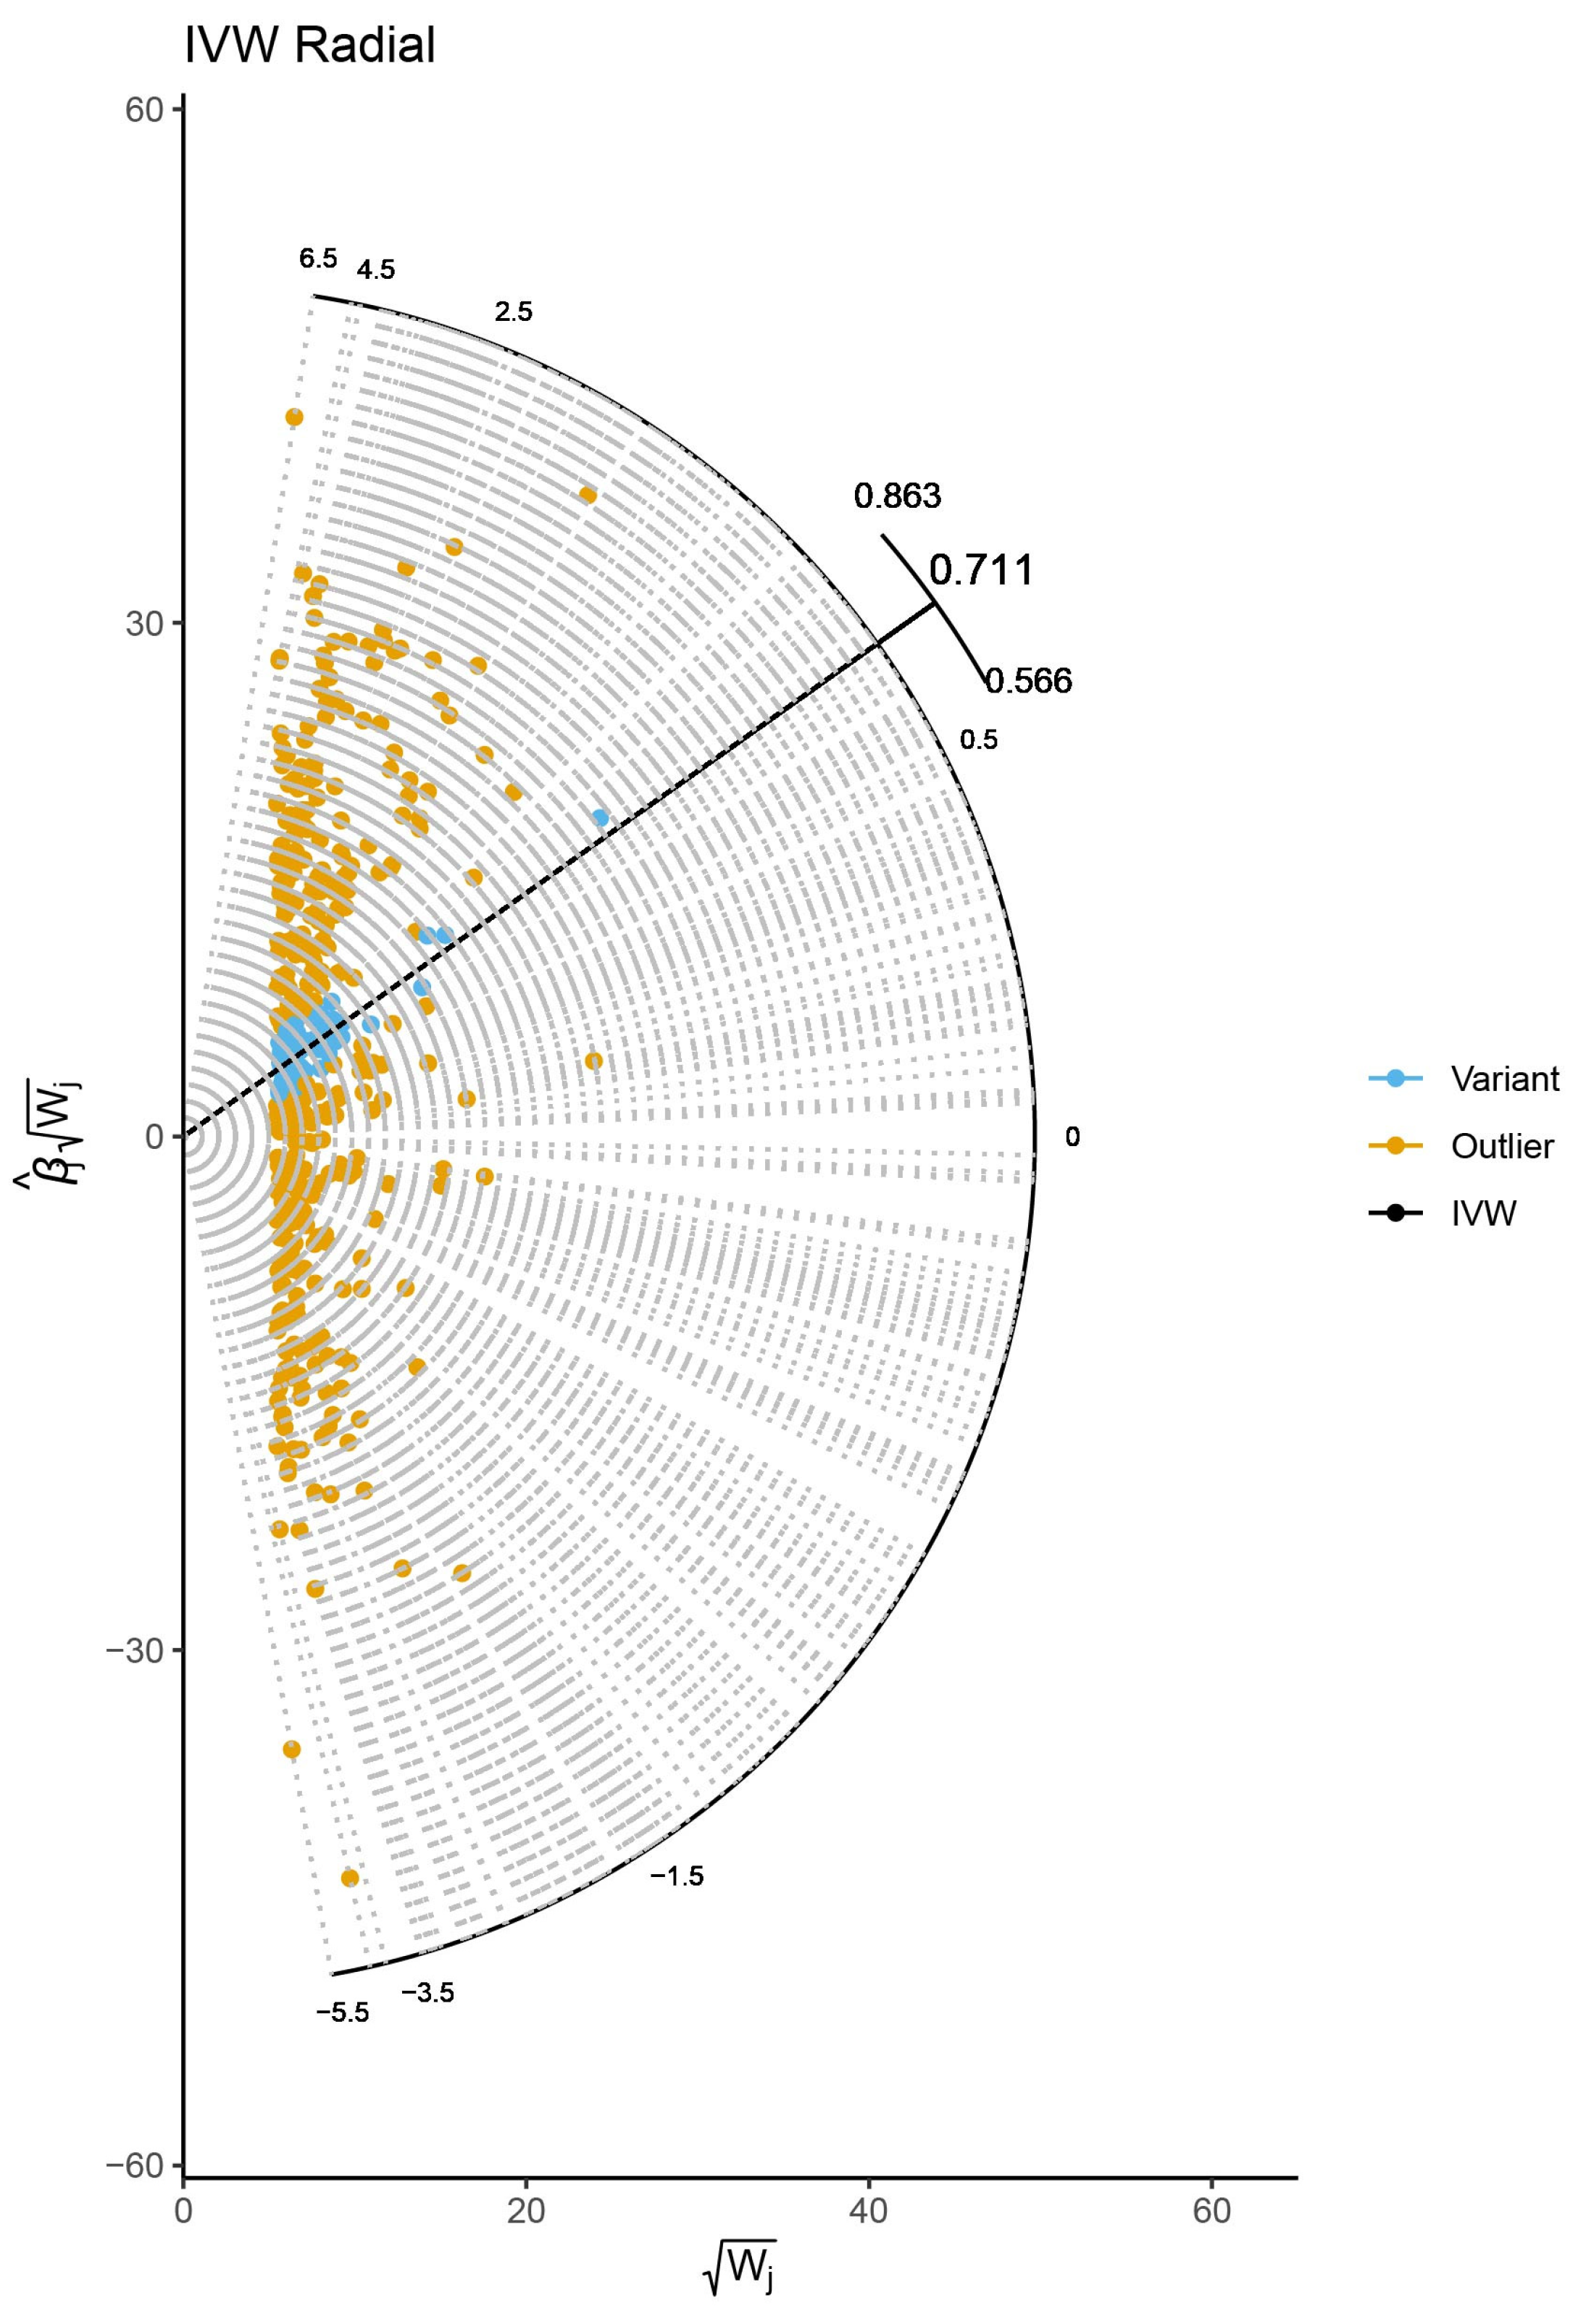
2.4. Sensitivity Analysis
2.5. Risk Factors
3. Results
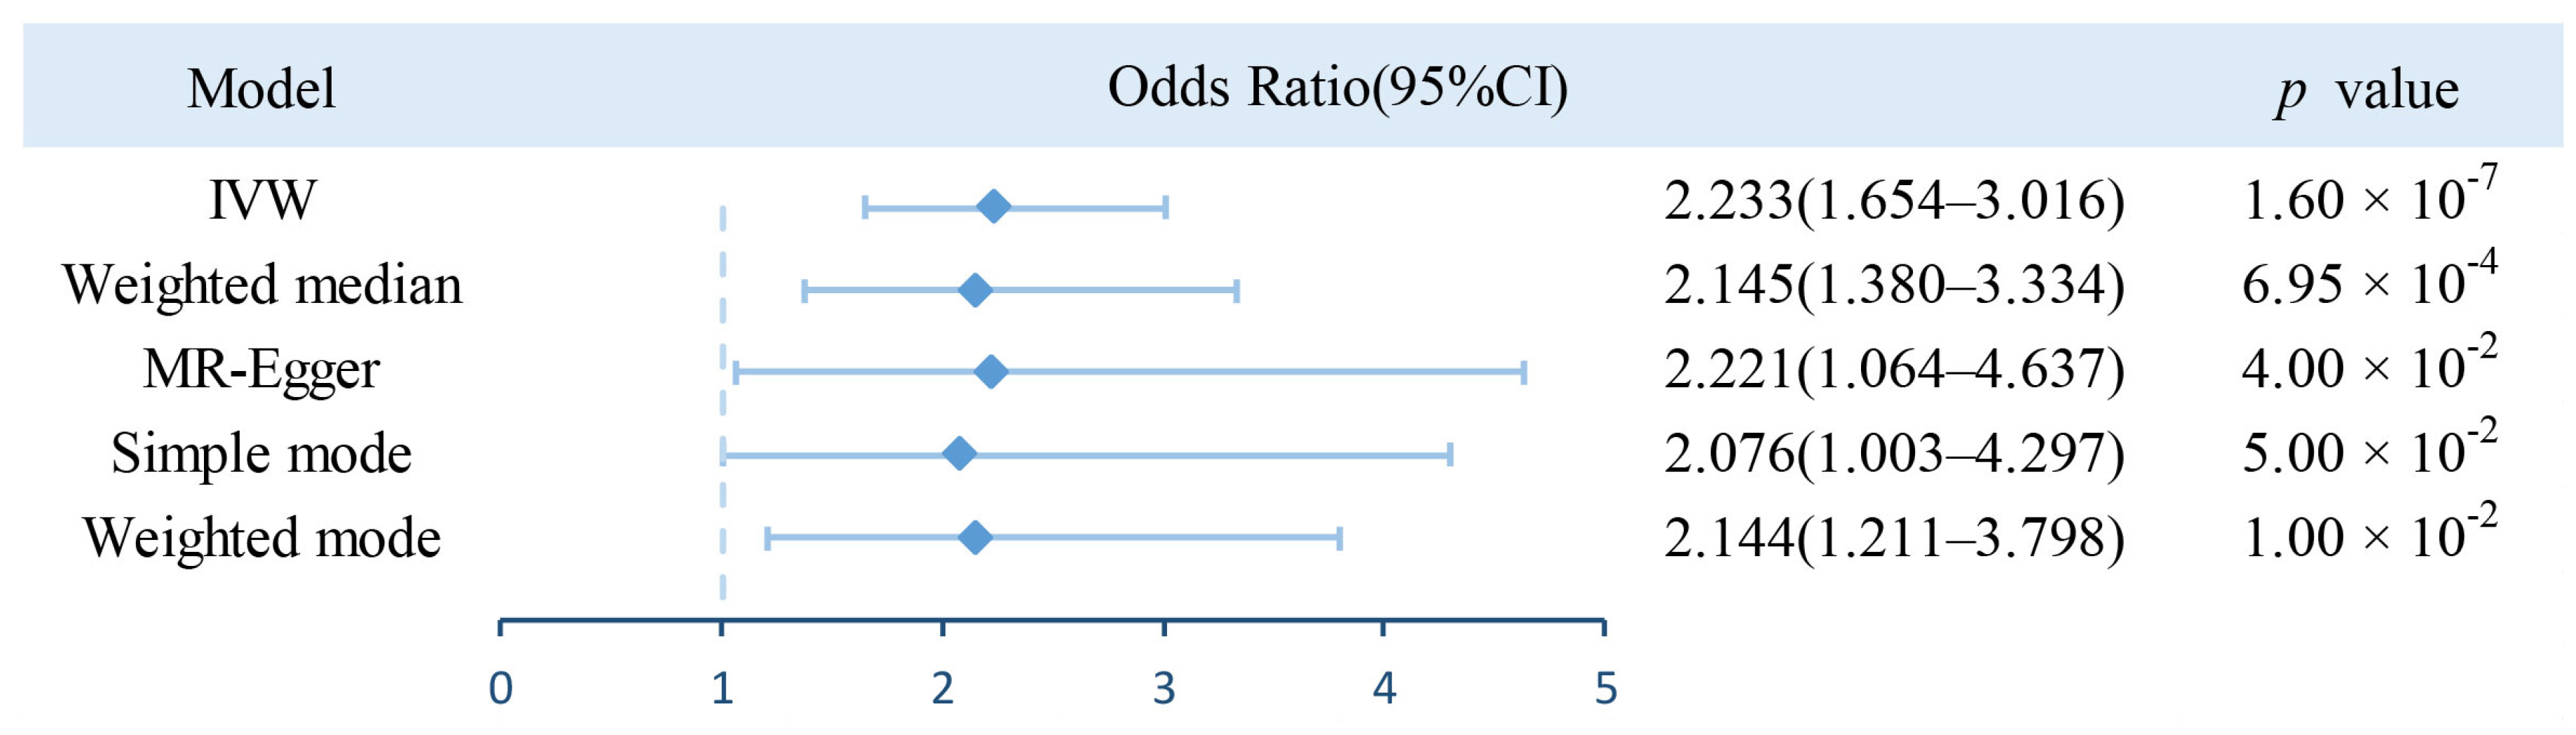
3.1. Estimation of Causal Effect of BWM on AF
3.2. Risk Factor Analysis
4. Discussion
5. Limitation
6. Conclusions
Supplementary Materials
Author Contributions
Funding
Institutional Review Board Statement
Informed Consent Statement
Data Availability Statement
Acknowledgments
Conflicts of Interest
References
- Pistoia, F.; Sacco, S.; Tiseo, C.; Degan, D.; Ornello, R.; Carolei, A. The Epidemiology of Atrial Fibrillation and Stroke. Cardiol. Clin. 2016, 34, 255–268. [Google Scholar] [CrossRef] [PubMed]
- Bunch, T.J. Atrial Fibrillation and Dementia. Circulation 2020, 142, 618–620. [Google Scholar] [CrossRef] [PubMed]
- Chugh, S.S.; Roth, G.A.; Gillum, R.F.; Mensah, G.A. Global burden of atrial fibrillation in developed and developing nations. Glob. Heart. 2014, 9, 113–119. [Google Scholar] [CrossRef]
- Schnabel, R.B.; Yin, X.; Gona, P.; Larson, M.G.; Beiser, A.S.; McManus, D.D.; Newton-Cheh, C.; Lubitz, S.A.; Magnani, J.W.; Ellinor, P.T.; et al. 50 year trends in atrial fibrillation prevalence, incidence, risk factors, and mortality in the Framingham Heart Study: A cohort study. Lancet 2015, 386, 154–162. [Google Scholar] [CrossRef] [PubMed]
- Rahman, F.; Kwan, G.F.; Benjamin, E.J. Global epidemiology of atrial fibrillation. Nat. Rev. Cardiol. 2014, 11, 639–654. [Google Scholar] [CrossRef]
- Kallistratos, M.S.; Poulimenos, L.E.; Manolis, A.J. Atrial fibrillation and arterial hypertension. Pharmacol. Res. 2018, 128, 322–326. [Google Scholar] [CrossRef]
- Benjamin, E.J.; Chen, P.S.; Bild, D.E.; Mascette, A.M.; Albert, C.M.; Alonso, A.; Calkins, H.; Connolly, S.J.; Curtis, A.B.; Darbar, D.; et al. Prevention of atrial fibrillation: Report from a national heart, lung, and blood institute workshop. Circulation 2009, 119, 606–618. [Google Scholar] [CrossRef]
- Fitzgerald, J.L.; Middeldorp, M.E.; Gallagher, C.; Sanders, P. Lifestyle Modification and Atrial Fibrillation: Critical Care for Successful Ablation. J. Clin. Med. 2022, 11, 2660. [Google Scholar] [CrossRef]
- Aronis, K.N.; Wang, N.; Phillips, C.L.; Benjamin, E.J.; Marcus, G.M.; Newman, A.B.; Rodondi, N.; Satterfield, S.; Harris, T.B.; Magnani, J.W.; et al. Associations of obesity and body fat distribution with incident atrial fibrillation in the biracial health aging and body composition cohort of older adults. Am. Heart J. 2015, 170, 498–505.e2. [Google Scholar] [CrossRef]
- Tedrow, U.B.; Conen, D.; Ridker, P.M.; Cook, N.R.; Koplan, B.A.; Manson, J.E.; Buring, J.E.; Albert, C.M. The long- and short-term impact of elevated body mass index on the risk of new atrial fibrillation the WHS (women’s health study). J. Am. Coll. Cardiol. 2010, 55, 2319–2327. [Google Scholar] [CrossRef]
- Tikkanen, E.; Gustafsson, S.; Knowles, J.W.; Perez, M.; Burgess, S.; Ingelsson, E. Body composition and atrial fibrillation: A Mendelian randomization study. Eur. Heart J. 2019, 40, 1277–1282. [Google Scholar] [CrossRef] [PubMed]
- Huang, H.C.; Walters, G.; Talaulikar, G.; Figurski, D.; Carroll, A.; Hurwitz, M.; Karpe, K.; Singer, R. Sleep apnea prevalence in chronic kidney disease-association with total body water and symptoms. BMC Nephrol. 2017, 18, 125. [Google Scholar] [CrossRef] [PubMed]
- Kaartinen, K.; Rautavaara, J.; Aitkoski, A.; Anttonen, O.; Ahvonen, J.; Vilpakka, M.; Koistinen, J.; Vääräniemi, K.; Miettinen, M.; Ylitalo, A.; et al. Fluid overload is an independent predictor of atrial fibrillation in end-stage renal disease: A prospective study using insertable cardiac and body composition monitors. Clin. Nephrol. 2020, 94, 127–134. [Google Scholar] [CrossRef] [PubMed]
- Anaszewicz, M.; Banaś, W.; Wawrzeńczyk, A.; Budzyński, J. Body Composition in Patients with Atrial Fibrillation. Acta Cardiol. Sin. 2019, 35, 484–492. [Google Scholar] [CrossRef]
- Chuda, A.; Kaszkowiak, M.; Banach, M.; Maciejewski, M.; Bielecka-Dabrowa, A. The Relationship of Dehydration and Body Mass Index With the Occurrence of Atrial Fibrillation in Heart Failure Patients. Front. Cardiovasc. Med. 2021, 8, 668653. [Google Scholar] [CrossRef]
- Haycock, P.C.; Burgess, S.; Wade, K.H.; Bowden, J.; Relton, C.; Davey Smith, G. Best (but oft-forgotten) practices: The design, analysis, and interpretation of Mendelian randomization studies. Am. J. Clin. Nutr. 2016, 103, 965–978. [Google Scholar] [CrossRef]
- Davey Smith, G.; Hemani, G. Mendelian randomization: Genetic anchors for causal inference in epidemiological studies. Hum. Mol. Genet. 2014, 23, R89–R98. [Google Scholar] [CrossRef]
- Sekula, P.; Del Greco, M.F.; Pattaro, C.; Köttgen, A. Mendelian Randomization as an Approach to Assess Causality Using Observational Data. J. Am. Soc. Nephrol. 2016, 27, 3253–3265. [Google Scholar] [CrossRef]
- Chen, W.; Cai, X.; Yan, H.; Pan, Y. Causal Effect of Obstructive Sleep Apnea on Atrial Fibrillation: A Mendelian Randomization Study. J. Am. Heart. Assoc. 2021, 10, e022560. [Google Scholar] [CrossRef]
- Larsson, S.C.; Lee, W.H.; Burgess, S.; Allara, E. Plasma Cortisol and Risk of Atrial Fibrillation: A Mendelian Randomization Study. J. Clin. Endocrinol. Metab. 2021, 106, e2521–e2526. [Google Scholar] [CrossRef]
- Park, S.; Lee, S.; Kim, Y.; Lee, Y.; Kang, M.W.; Kim, K.; Kim, Y.C.; Han, S.S.; Lee, H.; Lee, J.P.; et al. Atrial fibrillation and kidney function: A bidirectional Mendelian randomization study. Eur. Heart J. 2021, 42, 2816–2823. [Google Scholar] [CrossRef] [PubMed]
- Liao, L.Z.; Wen, X.Y.; Zhang, S.Z.; Li, W.D.; Zhuang, X.D. Hypertension and Atrial Fibrillation: A Study on Epidemiology and Mendelian Randomization Causality. Front. Cardiovasc. Med. 2021, 8, 644405. [Google Scholar] [CrossRef] [PubMed]
- Alonso, A.; Lopez, F.L.; Matsushita, K.; Loehr, L.R.; Agarwal, S.K.; Chen, L.Y.; Soliman, E.Z.; Astor, B.C.; Coresh, J. Chronic kidney disease is associated with the incidence of atrial fibrillation: The Atherosclerosis Risk in Communities (ARIC) study. Circulation 2011, 123, 2946–2953. [Google Scholar] [CrossRef] [PubMed]
- Qiu, H.; Ji, C.; Liu, W.; Wu, Y.; Lu, Z.; Lin, Q.; Xue, Z.; Liu, X.; Wu, H.; Jiang, W.; et al. Chronic Kidney Disease Increases Atrial Fibrillation Inducibility: Involvement of Inflammation, Atrial Fibrosis, and Connexins. Front. Physiol. 2018, 9, 1726. [Google Scholar] [CrossRef]
- Echouffo-Tcheugui, J.B.; Shrader, P.; Thomas, L.; Gersh, B.J.; Kowey, P.R.; Mahaffey, K.W.; Singer, D.E.; Hylek, E.M.; Go, A.S.; Peterson, E.D.; et al. Care Patterns and Outcomes in Atrial Fibrillation Patients With and Without Diabetes: ORBIT-AF Registry. J. Am. Coll. Cardiol. 2017, 70, 1325–1335. [Google Scholar] [CrossRef] [PubMed]
- Wang, A.; Green, J.B.; Halperin, J.L.; Piccini, J.P., Sr. Atrial Fibrillation and Diabetes Mellitus: JACC Review Topic of the Week. J. Am. Coll. Cardiol. 2019, 74, 1107–1115. [Google Scholar] [CrossRef]
- Conen, D.; Tedrow, U.B.; Koplan, B.A.; Glynn, R.J.; Buring, J.E.; Albert, C.M. Influence of systolic and diastolic blood pressure on the risk of incident atrial fibrillation in women. Circulation 2009, 119, 2146–2152. [Google Scholar] [CrossRef]
- Grundvold, I.; Skretteberg, P.T.; Liestøl, K.; Erikssen, G.; Kjeldsen, S.E.; Arnesen, H.; Erikssen, J.; Bodegard, J. Upper normal blood pressures predict incident atrial fibrillation in healthy middle-aged men: A 35-year follow-up study. Hypertension 2012, 59, 198–204. [Google Scholar] [CrossRef]
- Benjamin, E.J.; Levy, D.; Vaziri, S.M.; D’Agostino, R.B.; Belanger, A.J.; Wolf, P.A. Independent risk factors for atrial fibrillation in a population-based cohort. The Framingham Heart Study. JAMA 1994, 271, 840–844. [Google Scholar] [CrossRef]
- Sudlow, C.; Gallacher, J.; Allen, N.; Beral, V.; Burton, P.; Danesh, J.; Downey, P.; Elliott, P.; Green, J.; Landray, M.; et al. UK biobank: An open access resource for identifying the causes of a wide range of complex diseases of middle and old age. PLoS Med. 2015, 12, e1001779. [Google Scholar] [CrossRef]
- Bycroft, C.; Freeman, C.; Petkova, D.; Band, G.; Elliott, L.T.; Sharp, K.; Motyer, A.; Vukcevic, D.; Delaneau, O.; O’Connell, J.; et al. The UK Biobank resource with deep phenotyping and genomic data. Nature 2018, 562, 203–209. [Google Scholar] [CrossRef] [PubMed]
- Boef, A.G.; Dekkers, O.M.; le Cessie, S. Mendelian randomization studies: A review of the approaches used and the quality of reporting. Int. J. Epidemiol. 2015, 44, 496–511. [Google Scholar] [CrossRef] [PubMed]
- Bowden, J.; Spiller, W.; Del Greco, M.F.; Sheehan, N.; Thompson, J.; Minelli, C.; Davey Smith, G. Improving the visualization, interpretation and analysis of two-sample summary data Mendelian randomization via the Radial plot and Radial regression. Int. J. Epidemiol. 2018, 47, 1264–1278. [Google Scholar] [CrossRef] [PubMed]
- Burgess, S.; Thompson, S.G.; CRP CHD Genetics Collaboration. Avoiding bias from weak instruments in Mendelian randomization studies. Int. J. Epidemiol. 2011, 40, 755–764. [Google Scholar] [CrossRef] [PubMed]
- Bowden, J.; Davey Smith, G.; Haycock, P.C.; Burgess, S. Consistent Estimation in Mendelian Randomization with Some Invalid Instruments Using a Weighted Median Estimator. Genet. Epidemiol. 2016, 40, 304–314. [Google Scholar] [CrossRef]
- Bowden, J.; Davey Smith, G.; Burgess, S. Mendelian randomization with invalid instruments: Effect estimation and bias detection through Egger regression. Int. J. Epidemiol. 2015, 44, 512–525. [Google Scholar] [CrossRef]
- Ong, J.S.; MacGregor, S. Implementing MR-PRESSO and GCTA-GSMR for pleiotropy assessment in Mendelian randomization studies from a practitioner’s perspective. Genet. Epidemiol. 2019, 43, 609–616. [Google Scholar] [CrossRef]
- Brion, M.J.; Shakhbazov, K.; Visscher, P.M. Calculating statistical power in Mendelian randomization studies. Int. J. Epidemiol. 2013, 42, 1497–1501. [Google Scholar] [CrossRef]
- Verbanck, M.; Chen, C.Y.; Neale, B.; Do, R. Detection of widespread horizontal pleiotropy in causal relationships inferred from Mendelian randomization between complex traits and diseases. Nat. Genet. 2018, 50, 693–698. [Google Scholar] [CrossRef]
- Burgess, S.; Bowden, J.; Fall, T.; Ingelsson, E.; Thompson, S.G. Sensitivity Analyses for Robust Causal Inference from Mendelian Randomization Analyses with Multiple Genetic Variants. Epidemiology 2017, 28, 30–42. [Google Scholar] [CrossRef]
- Pattaro, C.; Teumer, A.; Gorski, M.; Chu, A.Y.; Li, M.; Mijatovic, V.; Garnaas, M.; Tin, A.; Sorice, R.; Li, Y.; et al. Genetic associations at 53 loci highlight cell types and biological pathways relevant for kidney function. Nat. Commun. 2016, 7, 10023. [Google Scholar] [CrossRef]
- Xue, A.; Wu, Y.; Zhu, Z.; Zhang, F.; Kemper, K.E.; Zheng, Z.; Yengo, L.; Lloyd-Jones, L.R.; Sidorenko, J.; Wu, Y.; et al. Genome-wide association analyses identify 143 risk variants and putative regulatory mechanisms for type 2 diabetes. Nat. Commun. 2018, 9, 2941. [Google Scholar] [CrossRef]
- Henckell, A.K.; Gusetu, G.; Rosu, R.; Ciobanu, D.M.; Istratoaie, S.; Muresan, L.; Lazea, C.; Pop, D.; Cismaru, G.; Bârsu, C.; et al. Low Atrial Rhythm in a Large Cohort of Children from Transylvania, Romania. Life 2022, 12, 1895. [Google Scholar] [CrossRef] [PubMed]
- van Wijk, S.W.; Su, W.; Wijdeveld, L.F.J.M.; Ramos, K.S.; Brundel, B.J.J.M. Cytoskeletal Protein Variants Driving Atrial Fibrillation: Potential Mechanisms of Action. Cells 2022, 11, 416. [Google Scholar] [CrossRef] [PubMed]
- Reinhardt, F.; Beneke, K.; Pavlidou, N.G.; Conradi, L.; Reichenspurner, H.; Hove-Madsen, L.; Molina, C.E. Abnormal Calcium Handling in Atrial Fibrillation Is Linked to Changes in Cyclic AMP Dependent Signaling. Cells 2021, 10, 3042. [Google Scholar] [CrossRef] [PubMed]
- Sánchez, J.; Trenor, B.; Saiz, J.; Dössel, O.; Loewe, A. Fibrotic Remodeling during Persistent Atrial Fibrillation: In Silico Investigation of the Role of Calcium for Human Atrial Myofibroblast Electrophysiology. Cells 2021, 10, 2852. [Google Scholar] [CrossRef] [PubMed]
- Cabrera, C.; Brunelli, S.M.; Rosenbaum, D.; Anum, E.; Ramakrishnan, K.; Jensen, D.E.; Stålhammar, N.O.; Stefánsson, B.V. A retrospective, longitudinal study estimating the association between interdialytic weight gain and cardiovascular events and death in hemodialysis patients. BMC Nephrol. 2015, 16, 113. [Google Scholar] [CrossRef] [PubMed]
- Hirose, M.; Takeishi, Y.; Miyamoto, T.; Kubota, I.; Laurita, K.R.; Chiba, S. Mechanism for atrial tachyarrhythmia in chronic volume overload-induced dilated atria. J. Cardiovasc. Electrophysiol. 2005, 16, 760–769. [Google Scholar] [CrossRef] [PubMed]
- Stone, E.; Kiat, H.; McLachlan, C.S. Atrial fibrillation in COVID-19, A review of possible mechanisms. FASEB J. 2020, 34, 11347–11354. [Google Scholar] [CrossRef]
- Lavie, C.J.; Pandey, A.; Lau, D.H.; Alpert, M.A.; Sanders, P. Obesity and Atrial Fibrillation Prevalence, Pathogenesis, and Prognosis: Effects of Weight Loss and Exercise. J. Am. Coll. Cardiol. 2017, 70, 2022–2035. [Google Scholar] [CrossRef]
- Sartorio, A.; Malavolti, M.; Agosti, F.; Marinone, P.G.; Caiti, O.; Battistini, N.; Bedogni, G. Body water distribution in severe obesity and its assessment from eight-polar bioelectrical impedance analysis. Eur. J. Clin. Nutr. 2005, 59, 155–160. [Google Scholar] [CrossRef] [PubMed]
- Chung, M.K.; Eckhardt, L.L.; Chen, L.Y.; Ahmed, H.M.; Gopinathannair, R.; Joglar, J.A.; Noseworthy, P.A.; Pack, Q.R.; Sanders, P.; Trulock, K.M. Lifestyle and Risk Factor Modification for Reduction of Atrial Fibrillation: A Scientific Statement From the American Heart Association. Circulation 2020, 141, e750–e772. [Google Scholar] [CrossRef] [PubMed]
- Nattel, S. Atrial Fibrillation and Body Composition: Is it Fat or Lean That Ultimately Determines the Risk? J. Am. Coll. Cardiol. 2017, 69, 2498–2501. [Google Scholar] [CrossRef] [PubMed]
- Neefs, J.; van den Berg, N.W.; Limpens, J.; Berger, W.R.; Boekholdt, S.M.; Sanders, P.; de Groot, J.R. Aldosterone Pathway Blockade to Prevent Atrial Fibrillation: A Systematic Review and Meta-Analysis. Int. J. Cardiol. 2017, 231, 155–161. [Google Scholar] [CrossRef]
- Solun, B.; Marcoviciu, D.; Dicker, D. Does treatment of hypertension decrease the incidence of atrial fibrillation and cardioembolic stroke? Eur. J. Intern Med. 2009, 20, 125–131. [Google Scholar] [CrossRef]


| Consortium /Pubmed ID | Phenotype | Participants | Sex | Ancestry | |
|---|---|---|---|---|---|
| Number of Cases | Number of Controls | ||||
| Neale lab | Whole body water mass | 331,315 | M/F | European | |
| FinnGen | Atrial fibrillation and flutter | 22,068 | 116,926 | M/F | European |
| 26831199 | Chronic kidney disease | 12,385 | 104,780 | M/F | European |
| 30054458 | Type 2 diabetes | 62,892 | 596,424 | M/F | European |
| FinnGen | Heart failure, strict | 13,087 | 195,091 | M/F | European |
| FinnGen | Hypertension | 55,917 | 162,837 | M/F | European |
| Outcomes | IVW | MR-Egger Method | ||
|---|---|---|---|---|
| Causa Effect (95% CI) | p | Intercept | p | |
| Chronic kidney disease | 1.432 (1.231–1.667) | 3.48 × 10⁻⁶ | −0.001 | 7.3 × 10⁻¹ |
| Type 2 diabetes | 1.339 (1.166–1.537) | 3.40 × 10⁻⁵ | 0.004 | 1.4 × 10⁻¹ |
| Heart failure | 1.555 (1.371–1.763) | 5.95 × 10⁻¹² | 0.00096 | 6.9 × 10⁻¹ |
| Hypertension | 1.119 (1.002–1.249) | 4.60 × 10⁻² | 0.001 | 5.5 × 10⁻¹ |
Disclaimer/Publisher’s Note: The statements, opinions and data contained in all publications are solely those of the individual author(s) and contributor(s) and not of MDPI and/or the editor(s). MDPI and/or the editor(s) disclaim responsibility for any injury to people or property resulting from any ideas, methods, instructions or products referred to in the content. |
© 2023 by the authors. Licensee MDPI, Basel, Switzerland. This article is an open access article distributed under the terms and conditions of the Creative Commons Attribution (CC BY) license (https://creativecommons.org/licenses/by/4.0/).
Share and Cite
Zhu, Q.; Chen, Q.; Tian, Y.; Zhang, J.; Ran, R.; Shu, S. Genetic Predisposition to a Higher Whole Body Water Mass May Increase the Risk of Atrial Fibrillation: A Mendelian Randomization Study. J. Cardiovasc. Dev. Dis. 2023, 10, 76. https://doi.org/10.3390/jcdd10020076
Zhu Q, Chen Q, Tian Y, Zhang J, Ran R, Shu S. Genetic Predisposition to a Higher Whole Body Water Mass May Increase the Risk of Atrial Fibrillation: A Mendelian Randomization Study. Journal of Cardiovascular Development and Disease. 2023; 10(2):76. https://doi.org/10.3390/jcdd10020076
Chicago/Turabian StyleZhu, Qi, Qiyu Chen, Ying Tian, Jing Zhang, Rui Ran, and Shiyu Shu. 2023. "Genetic Predisposition to a Higher Whole Body Water Mass May Increase the Risk of Atrial Fibrillation: A Mendelian Randomization Study" Journal of Cardiovascular Development and Disease 10, no. 2: 76. https://doi.org/10.3390/jcdd10020076
APA StyleZhu, Q., Chen, Q., Tian, Y., Zhang, J., Ran, R., & Shu, S. (2023). Genetic Predisposition to a Higher Whole Body Water Mass May Increase the Risk of Atrial Fibrillation: A Mendelian Randomization Study. Journal of Cardiovascular Development and Disease, 10(2), 76. https://doi.org/10.3390/jcdd10020076