The Quality of Life of Older Individuals Following the World Health Organization Assessment Criteria

 ,
, 

 ,
, 
Abstract
1. Introduction
2. Materials and Methods
2.1. Subjects
2.2. Statistical Procedures
3. Results
4. Discussion
5. Conclusions
Author Contributions
Funding
Acknowledgments
Conflicts of Interest
Ethics Approval and Consent to Participate
List of Abbreviations
References
- Ottati, F.; Campos, M. Quality of life and coping strategies in the treatment of oncologic patients. Acta Colomb. Psicol. 2014, 17, 103–111. [Google Scholar] [CrossRef][Green Version]
- WHOQOL Group. Introducing the WHOQOL instruments. Measuring Quality of Life. 2020. Available online: https://www.who.int/toolkits/whoqol (accessed on 3 December 2020).
- Fleck, M. A Avaliação da Qualidade de Vida—Guia para Profissionais de Saúde; Artmed Editora: Porto Alegre, Brasil, 2009. [Google Scholar]
- WHOQOL Group. Structure of the WHOQOL-BREF. WHOQOL: Measuring Quality of Life. 2020. Available online: https://www.who.int/toolkits/whoqol/whoqol-bref (accessed on 22 October 2019).
- WHOQOL Gorup. The Structure of the WHOQOL-100. WHOQOL: Measuring Quality of Life. 2019. Available online: https://www.who.int/healthinfo/survey/whoqol-qualityoflife/en/index4.html (accessed on 22 October 2019).
- Canavarro, M.; Serra, A.; Simões, M.; Pereira, M.; Gameiro, S.; Quartilho, M. WHOQOL-BREF (Versão em Português de Portugal do Instrumento Abreviado de Avaliação da Qualidade de Vida da Organização Mundial de Saúde). 2006. Available online: http://www.fpce.uc.pt/saude/WHOQOL_Bref.html (accessed on 22 October 2019).
- Canavarro, M.; Serra, A.; Pereira, M.; Simões, M.; Quartilho, M.; Rijo, D. WHOQOL disponível para Portugal: Desenvolvimento dos Instrumentos de Avaliação da Qualidade de Vida da Organização Mundial de Saúde (WHOQOL-100 e WHOQOL-BREF). In Qualidade de Vida e Saúde: Uma Abordagem na Perspectiva da Organização Mundial de Saúde; Canavarro, M., Serra, A., Eds.; Calouste Gulbenkian Foundation: Lisbon, Portugal, 2010. [Google Scholar]
- HECULSBA. The ULSBA’s Health Ethics Committee (Comissão de Ética para a Saúde da Unidade Local de Saúde do Baixo Alentejo). 2019. Available online: http://www.ulsba.min-saude.pt/2019/02/28/comissao-de-etica-para-a-saude/ (accessed on 22 October 2019).
- HECULSBA. The Health Ethics Committee of ULSBA is governed by an Operating Regulation, that was approved on 17 September 2015, by the Board of Directors. 2019. Available online: http://www.ulsba.min-saude.pt/wp-content/uploads/sites/15/2019/02/Documento-Guia.pdf (accessed on 22 October 2019).
- HECULSBA. Helsinki declaration 2008. 2019. Available online: http://www.ulsba.min-saude.pt/wp-content/uploads/sites/15/2019/02/declaracaohelsinquia.pdf (accessed on 22 October 2019).
- ULSBA. Unidade Local de Saúde do Baixo Alentejo. 2016. Available online: http://www.ulsba.min-saude.pt/ (accessed on 22 October 2019).
- Scheaffer, R.; Mendenhall, M.; Ott, R.; Gerow, K. Elementary Survey Sampling; Cengage Learning: Boston, MA, USA, 2012; p. 480. [Google Scholar]
- Marôco, J. Análise de Equações Estruturais: Fundamentos teóricos, Software and Aplicações, 2nd ed.; ReportNumber: Pêro Pinheiro, Portugal, 2014. [Google Scholar]


| Variables | n | % |
|---|---|---|
| Gender: | ||
| Male | 163 | 46.4 |
| Female | 188 | 53.6 |
| Age group: | ||
| 65–74 | 132 | 37.6 |
| 75–84 | 135 | 38.5 |
| 85 and higher | 84 | 23.9 |
| Marital Status: | ||
| Single/Divorced/Separated | 31 | 8.8 |
| Married/Living as Married | 206 | 58.7 |
| Widowed | 114 | 32.5 |
| Educational level: | ||
| Does not know how to read or write | 104 | 29.6 |
| Knows how to read and/or write | 59 | 16.8 |
| 1st–4th grade | 165 | 47 |
| More education | 23 | 6.6 |
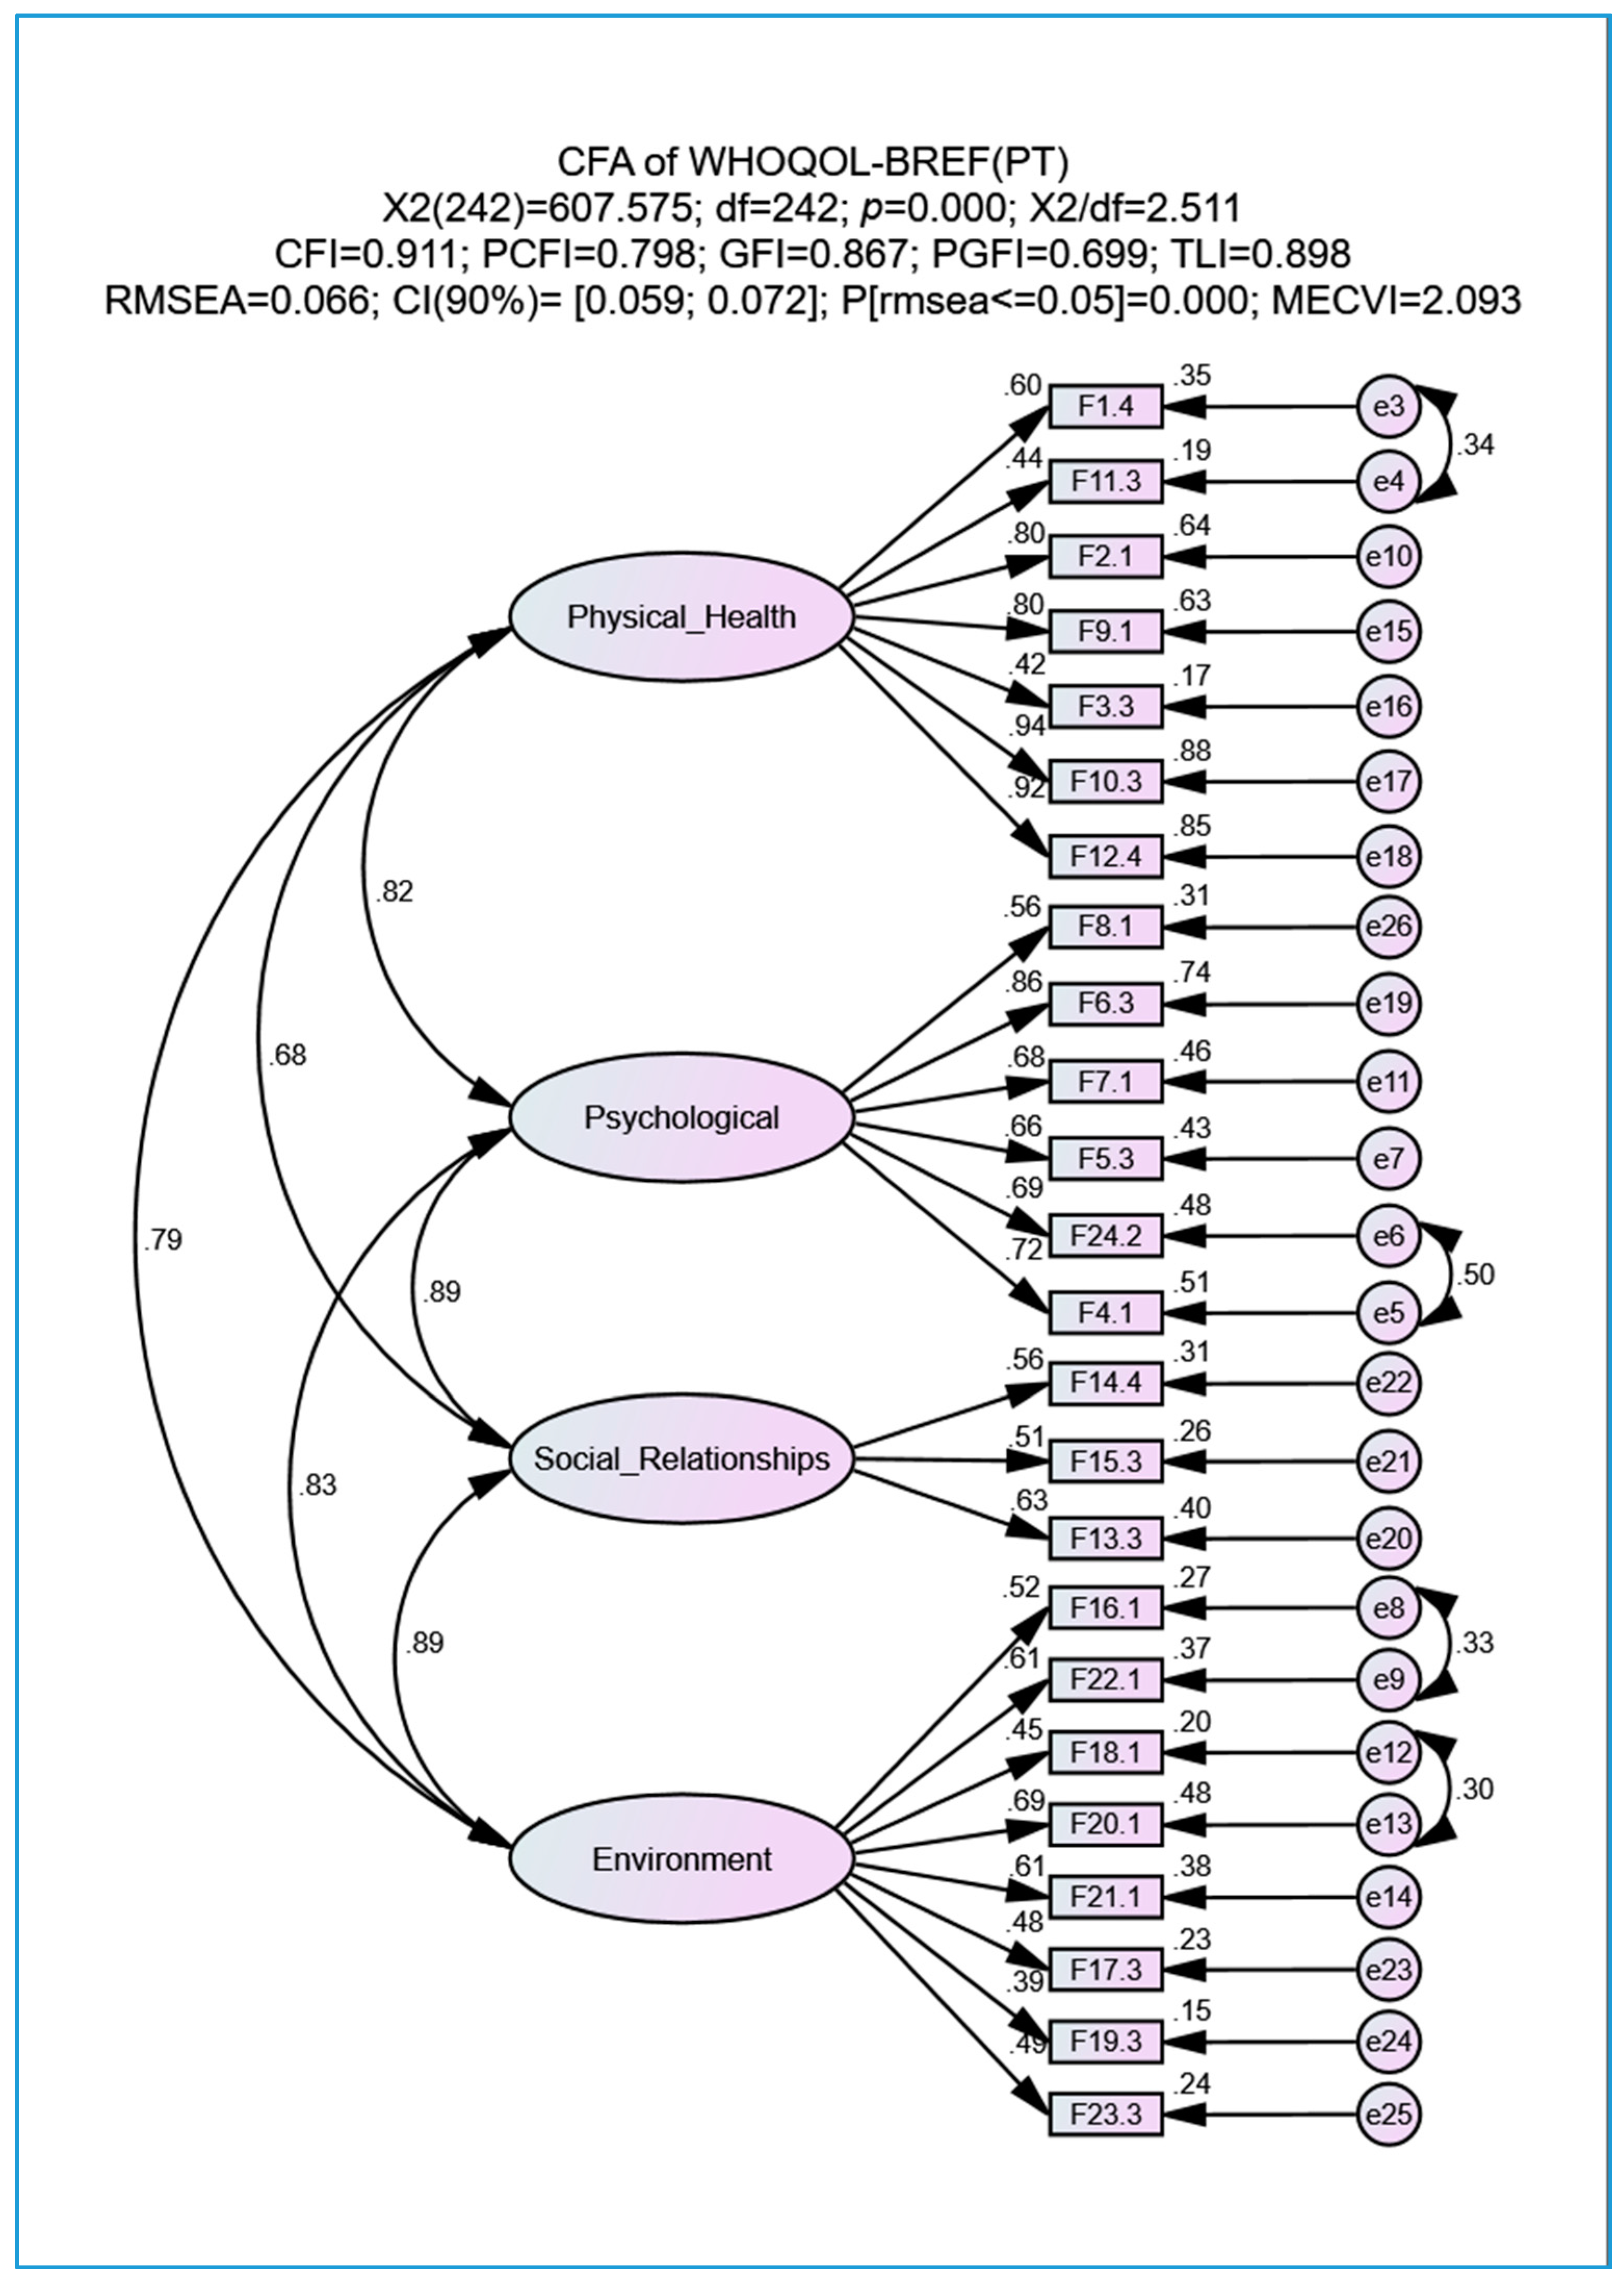
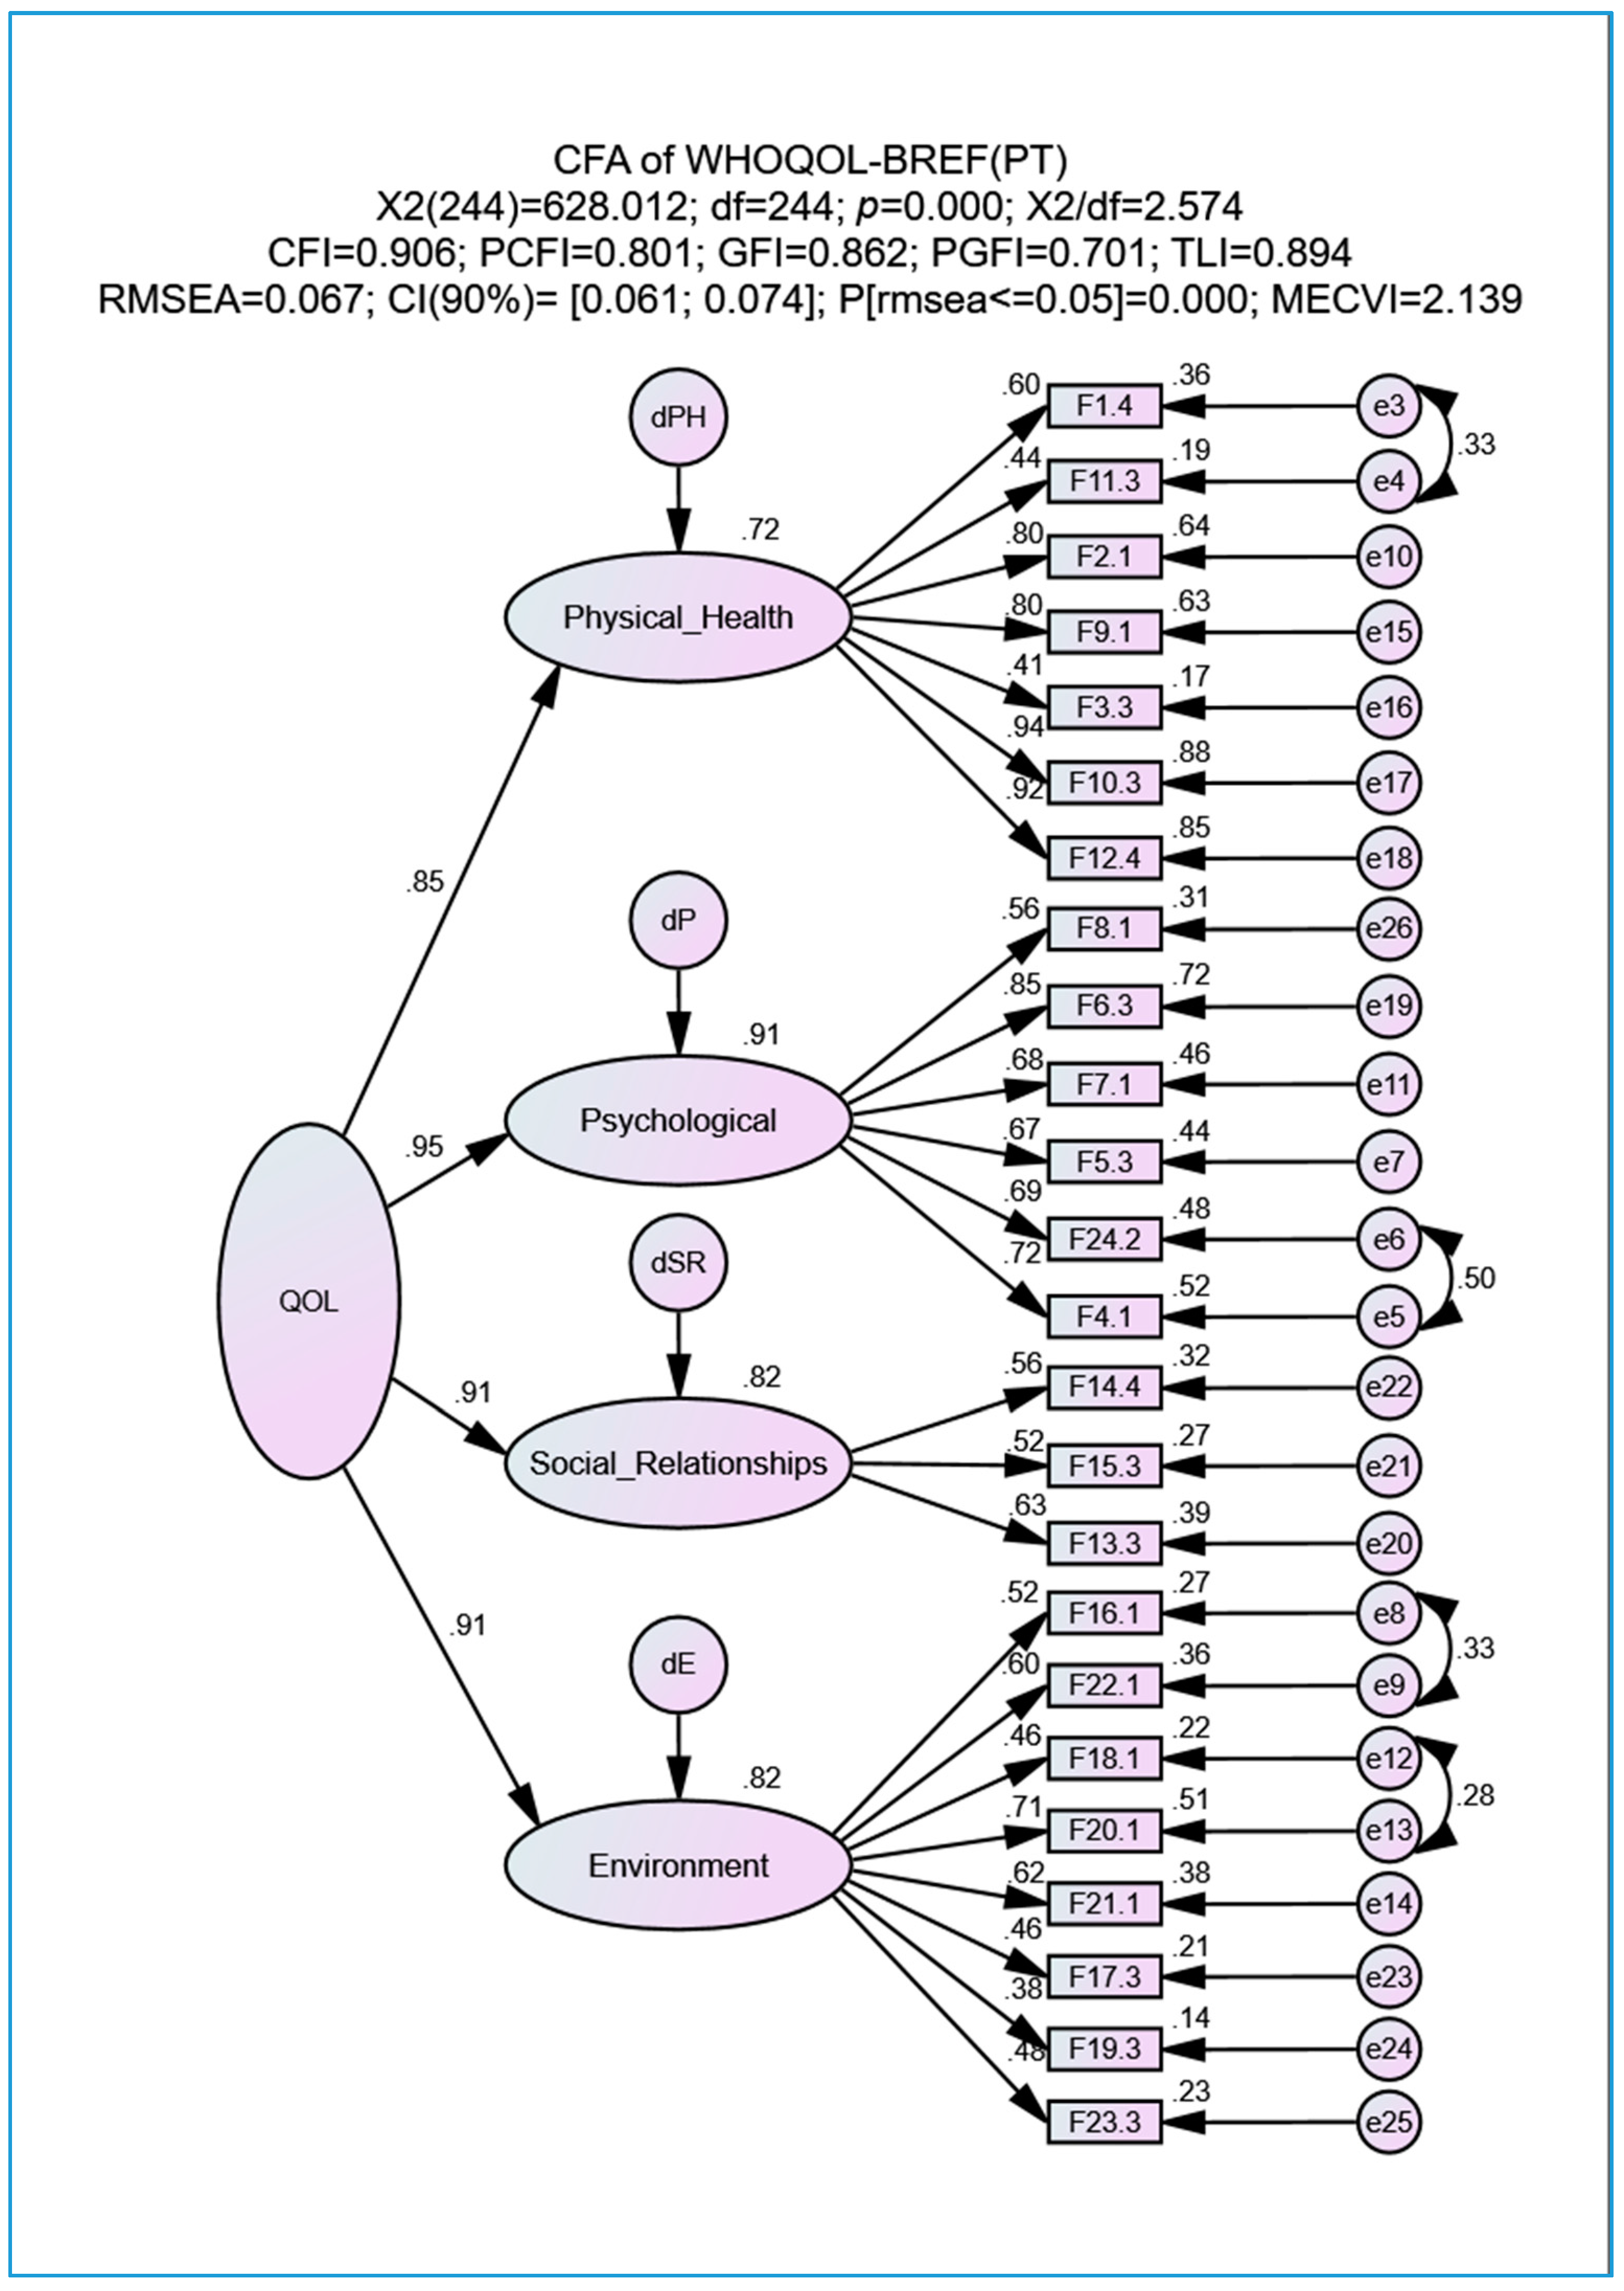
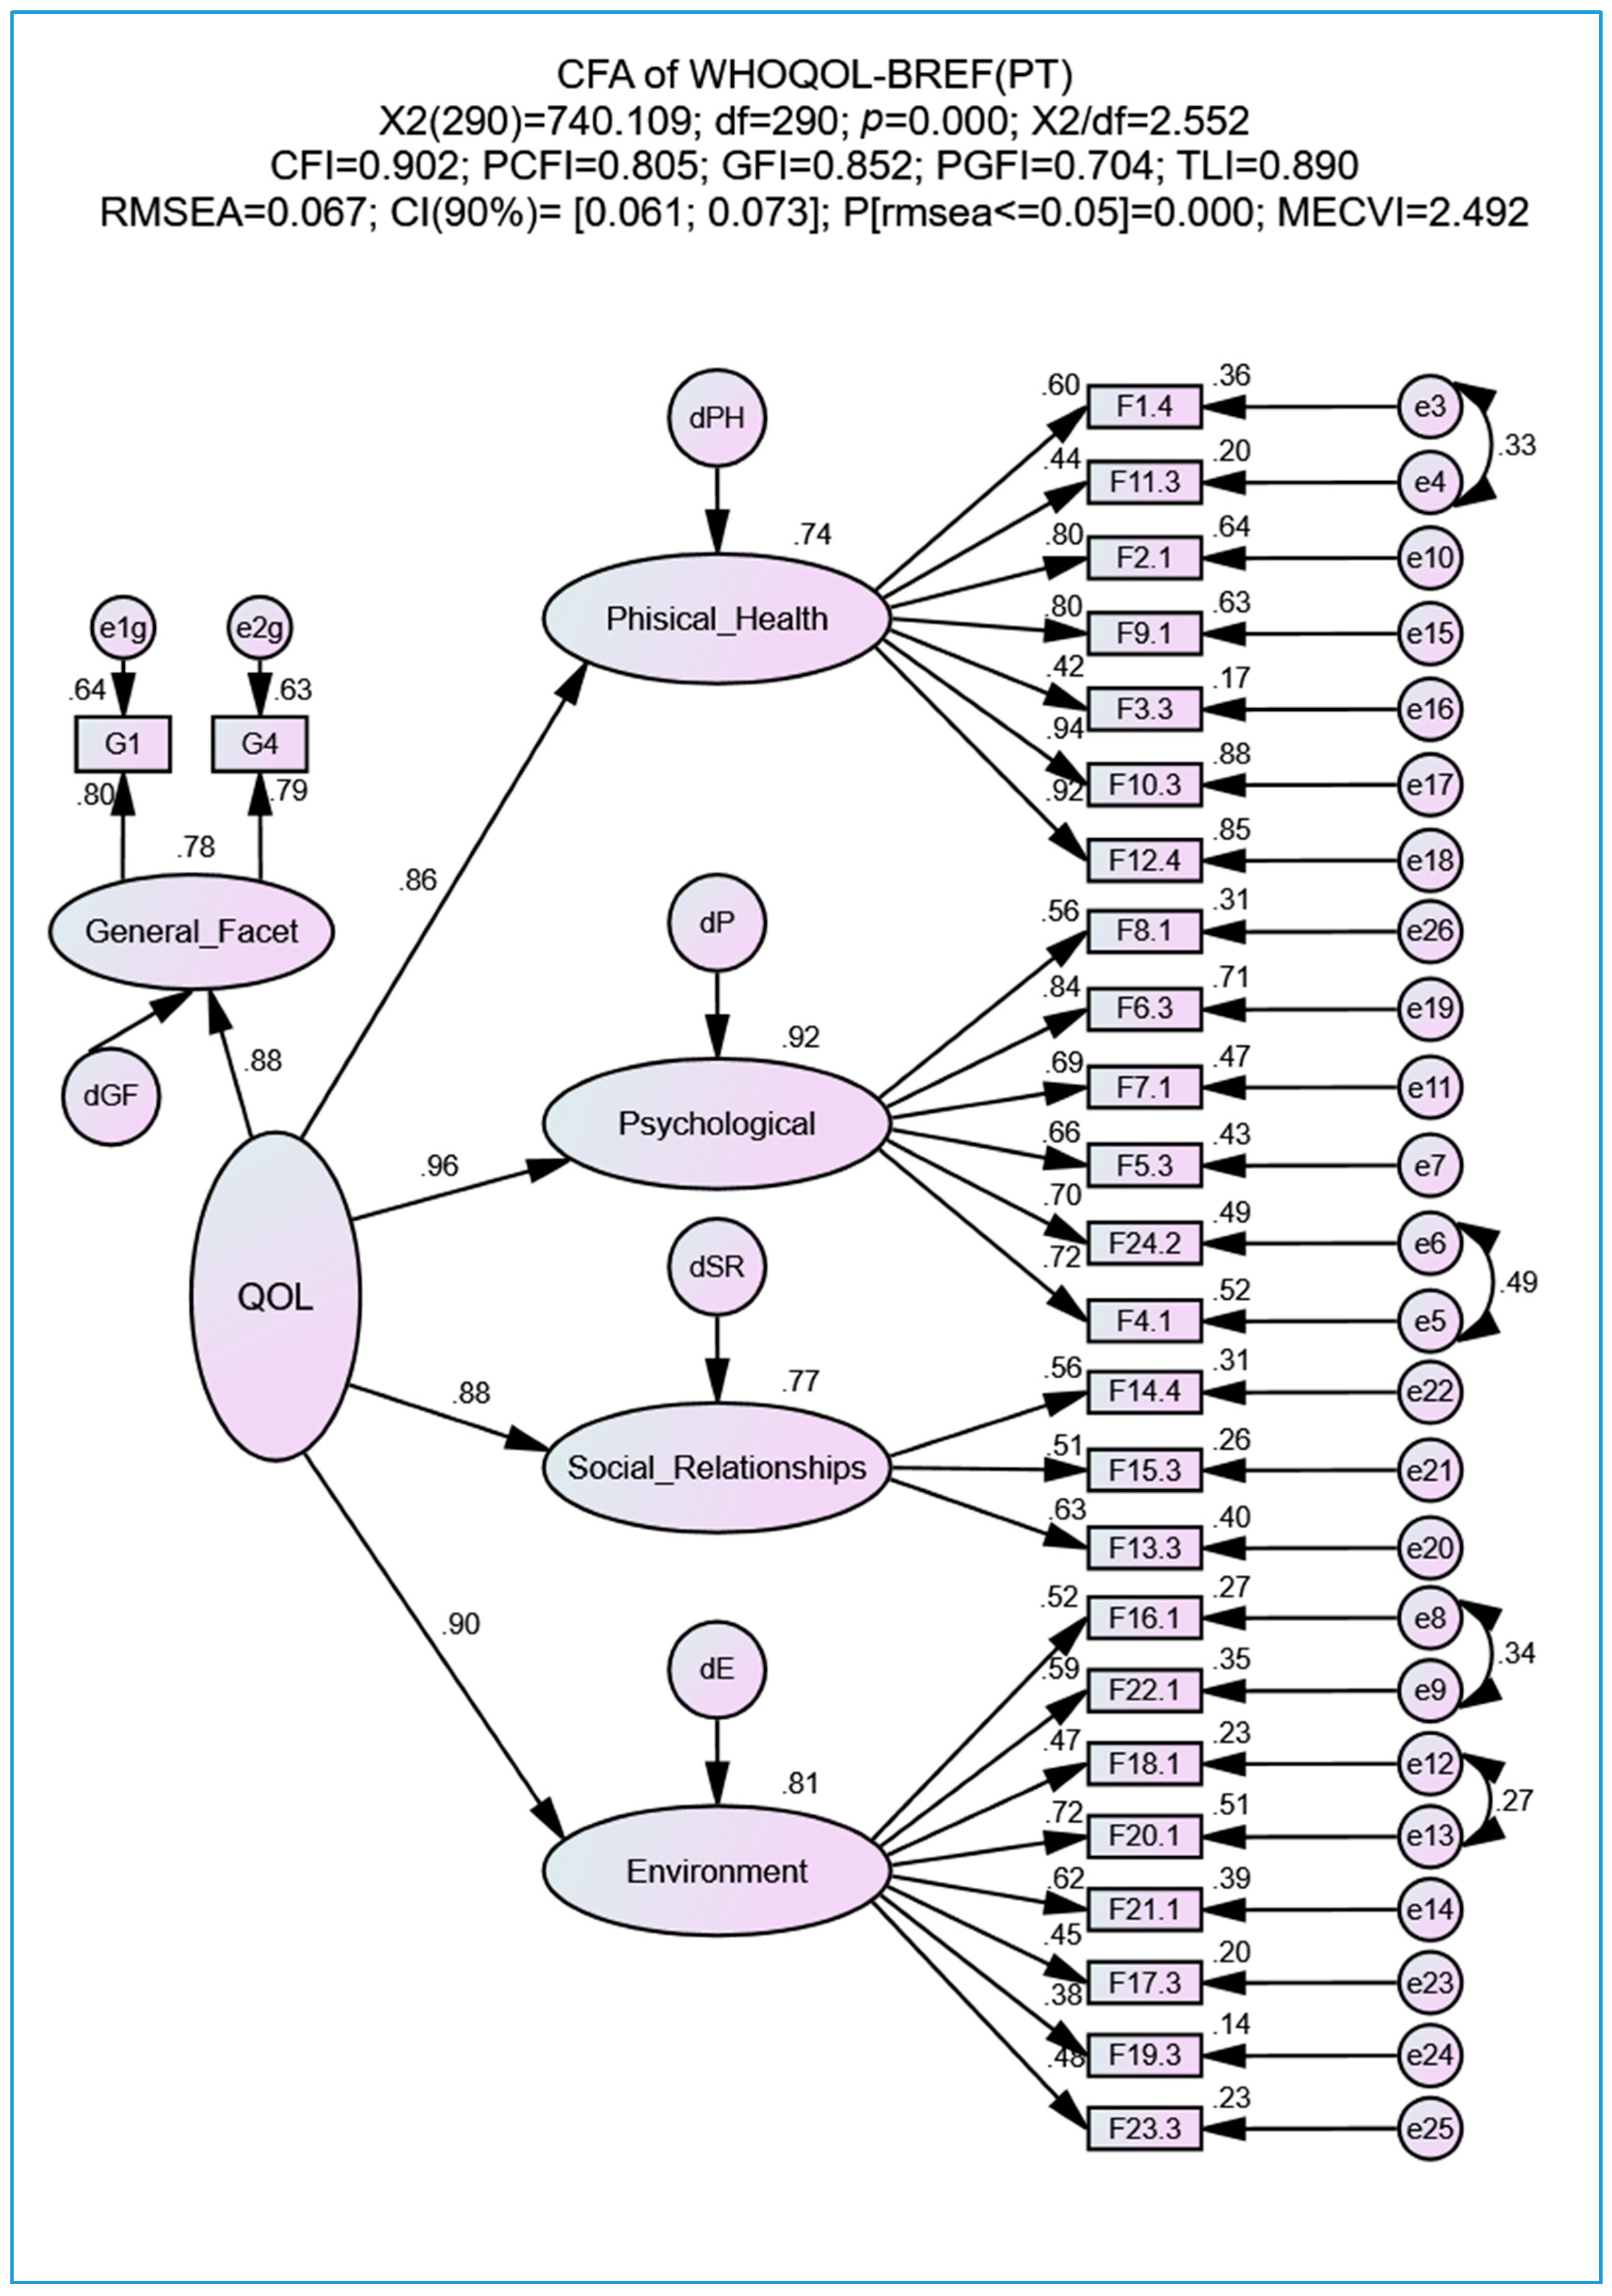
| Indexes | Initial Model | Adjusted Model | Qualitative Classification Based on Marôco [13] |
|---|---|---|---|
| 3.224 | 2.511 | Good | |
| CFI | 0.866 | 0.911 | Good |
| PCFI | 0.772 | 0.798 | Good |
| GFI | 0.832 | 0.867 | Reasonable |
| PGFI | 0.682 | 0.699 | Good |
| TLI | 0.850 | 0.898 | Reasonable |
| RMSEA | 0.080 | 0.066 | Acceptable |
| CI90%RMSEA<0.05 | [0.074; 0.086] | [0.059; 0.072] | - |
| PCLOSE | <0.001 | <0.001 | - |
| MECVI | 2.598 | 2.093 | Better |
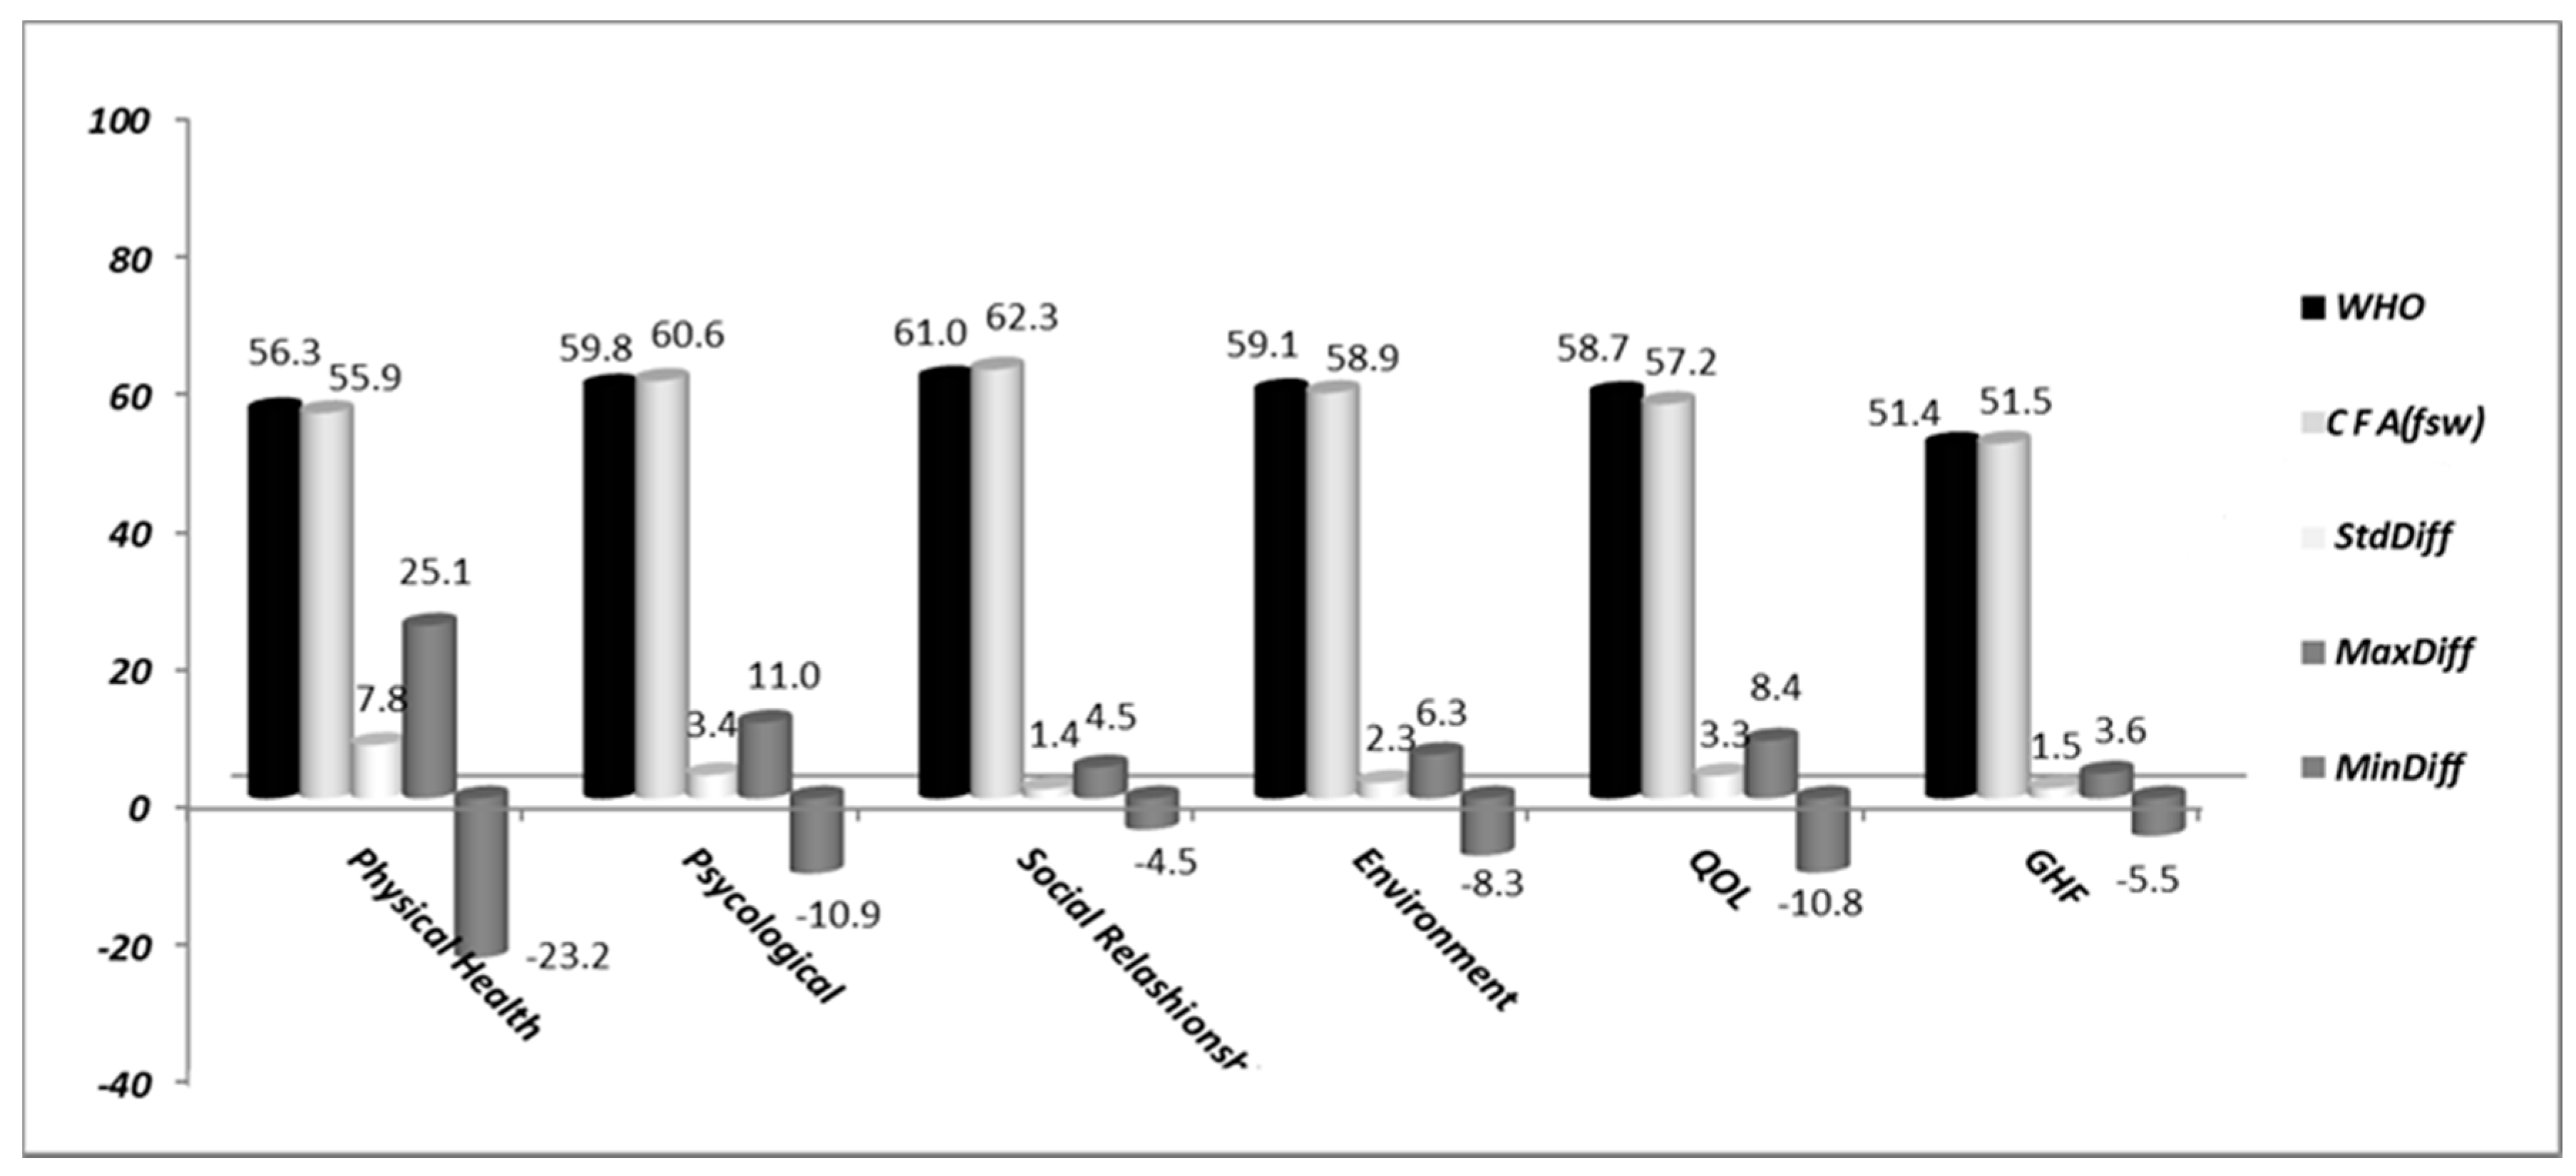
| Domains | Mean | Median | SD | Skewness | SESk | Kurtosis | SEku | Min | Max |
|---|---|---|---|---|---|---|---|---|---|
| Physical Health | 3.254 | 3 | 1.042 | −0.118 | 0.049 | −0.823 | 0.099 | 1 | 5 |
| Psychological | 3.392 | 4 | 0.901 | −0.367 | 0.053 | −0.296 | 0.107 | 1 | 5 |
| Social Relationships | 3.439 | 4 | 0.842 | −0.444 | 0.075 | 0.184 | 0.151 | 1 | 5 |
| Environment | 3.365 | 4 | 0.929 | −0.538 | 0.046 | −0.188 | 0.092 | 1 | 5 |
| GHF | 3.056 | 3 | 0.927 | −0.154 | 0.092 | −0.607 | 0.184 | 1 | 5 |
| QOL (24 Items) | 3.348 | 3 | 0.948 | −0.361 | 0.027 | −0.412 | 0.053 | 1 | 5 |
Publisher’s Note: MDPI stays neutral with regard to jurisdictional claims in published maps and institutional affiliations. |
© 2020 by the authors. Licensee MDPI, Basel, Switzerland. This article is an open access article distributed under the terms and conditions of the Creative Commons Attribution (CC BY) license (http://creativecommons.org/licenses/by/4.0/).
Share and Cite
Goes, M.; Lopes, M.J.; Marôco, J.; Oliveira, H.; Fonseca, C.; Mónico, L.; Parreira, P.; García-Alonso, J.; Guedes de Pinho, L. The Quality of Life of Older Individuals Following the World Health Organization Assessment Criteria. Geriatrics 2020, 5, 102. https://doi.org/10.3390/geriatrics5040102
Goes M, Lopes MJ, Marôco J, Oliveira H, Fonseca C, Mónico L, Parreira P, García-Alonso J, Guedes de Pinho L. The Quality of Life of Older Individuals Following the World Health Organization Assessment Criteria. Geriatrics. 2020; 5(4):102. https://doi.org/10.3390/geriatrics5040102
Chicago/Turabian StyleGoes, Margarida, Manuel José Lopes, João Marôco, Henrique Oliveira, César Fonseca, Lisete Mónico, Pedro Parreira, José García-Alonso, and Lara Guedes de Pinho. 2020. "The Quality of Life of Older Individuals Following the World Health Organization Assessment Criteria" Geriatrics 5, no. 4: 102. https://doi.org/10.3390/geriatrics5040102
APA StyleGoes, M., Lopes, M. J., Marôco, J., Oliveira, H., Fonseca, C., Mónico, L., Parreira, P., García-Alonso, J., & Guedes de Pinho, L. (2020). The Quality of Life of Older Individuals Following the World Health Organization Assessment Criteria. Geriatrics, 5(4), 102. https://doi.org/10.3390/geriatrics5040102