3.1. Baseline Characteristics
The mean age of the participants in the experimental group was 64.5 years (SD = 11.9) and 64.2 years (SD = 11.8) in the control group. The age range was similar across both groups (27–89 years) (
Figure 2).
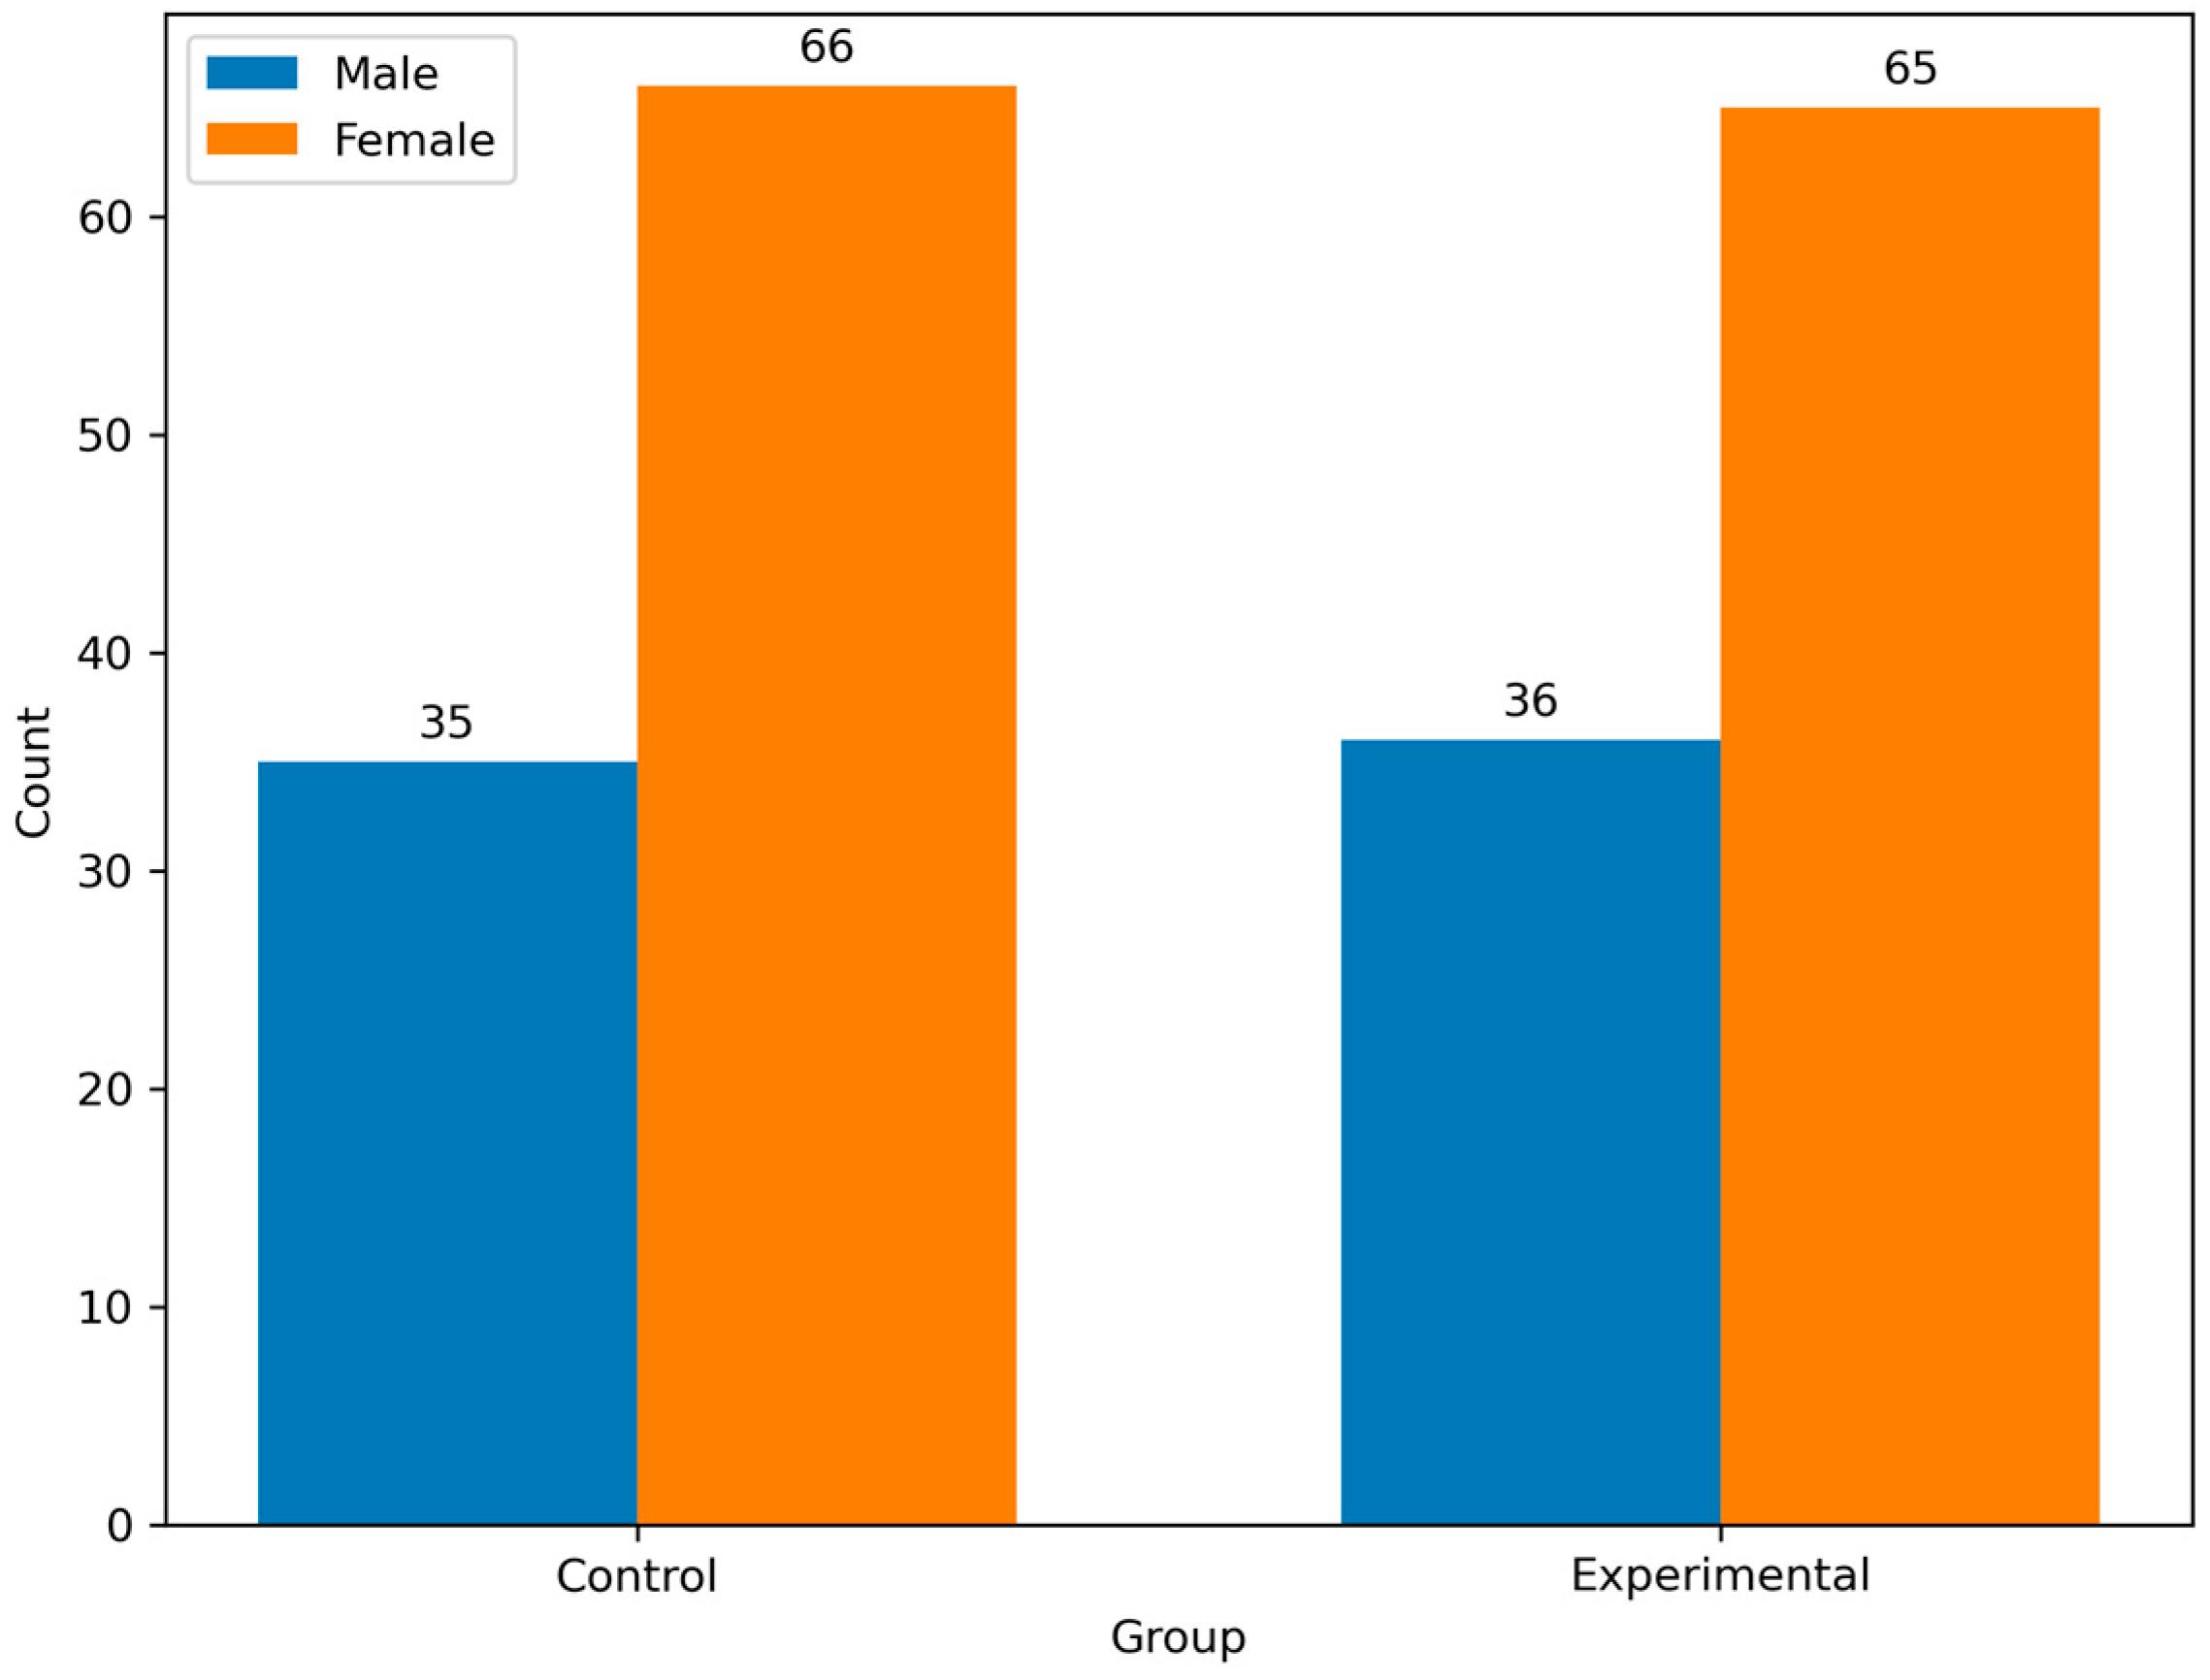
Both groups had a similar sex distribution, with females constituting 64.4% of the experimental group and 65.3% of the control group. Moreover, the proportion of men was comparable (35.6% vs. 34.7%). There were no significant differences between genders (
p = 0.8832) (
Figure 3).
The participants’ rural and urban distributions were balanced, with 40.6% and 39.6% from rural areas in the experimental and control groups, respectively, and 59.4% and 60.4%, respectively, from urban areas (
p = 0.8862). Education levels were comparable across the groups, with slight variations in proportions across categories (e.g., gymnasium, high school, college) (
p = 0.8652). A significant difference was noted in marital status distribution (
p = 0.0102), with the experimental group having a higher proportion of married individuals (63.4% vs. 48.5%) and fewer unmarried (1.0% vs. 5.9%) or concubine participants (2.0% vs. 9.9%) than the control group. The mean BMI was lower in the experimental group (21.1 kg/m
2, SD = 4.3) compared to the control group (22.7 kg/m
2, SD = 5.3) (
p = 0.021), with a wider range observed in the experimental group (2.5–38.9) compared to the control group (17.3–38.9). Smoking habits were evenly distributed between the two groups, with 50.5% in the experimental group and 49.5% in the control group identified as smokers (
p = 0.8882) (
Table 1).
3.3. Logistic Regression Analysis
The logistic regression model investigates the relationship between various neurological and sphincter-related conditions and the likelihood of a patient being assigned to the control group relative to the experimental group. The model’s intercept, with an estimate of 0.691 (SE = 0.568, z = 1.217, p = 0.224), is not statistically significant, indicating that, in the absence of the predictors, the baseline odds of group membership do not differ significantly.
Localized pain, defined as the presence versus absence of pain in a specific area, shows an estimate of −0.438 (SE = 0.455, z = −0.964, p = 0.335) and an odds ratio of 0.645, suggesting a non-significant trend toward lower odds of being in the control group among those with localized pain. Radiating pain, which may indicate a more diffuse pain pattern, has an estimate of −0.702 (SE = 0.370, z = −1.898, p = 0.058) with an odds ratio of 0.496. Although this result approaches statistical significance, it does not meet the conventional threshold (p < 0.05).
Among the motor deficits, monoplegia is significantly associated with group membership. Patients with monoplegia have a significantly lower likelihood of being in the control group, as indicated by an estimate of −1.368 (SE = 0.470, z = −2.911, p = 0.004) and an odds ratio of 0.255. Hemiparesis demonstrates an even stronger association, with an estimate of −1.927 (SE = 0.568, z = −3.391, p < 0.001) and an odds ratio of 0.146, signifying that the presence of hemiparesis markedly decreases the odds of being in the control group. Tetraparesis exhibits a significant borderline effect (Estimate = −1.615, SE = 0.825, z = −1.956, p = 0.050), with an odds ratio of 0.199, suggesting a potential trend toward lower odds of being in the control group among those with tetraparesis.
Paresthesia, representing abnormal sensations, yields a non-significant estimate of 0.205 (SE = 0.335, z = 0.613, p = 0.540), with an odds ratio of 1.228, indicating little difference between groups. Conversely, hypoesthesia shows a statistically significant positive association (Estimate = 0.795, SE = 0.355, z = 2.238, p = 0.025), with an odds ratio of 2.215. This implies that patients exhibiting hypoesthesia are more than twice as likely to be in the control group compared to the experimental group. Anesthesia and hypersensitivity, with estimates of 0.359 (p = 0.396) and 0.609 (p = 0.204), respectively, do not reach statistical significance.
Regarding sphincter disorders, the conditions of constipation, urinary retention, and incontinence yield non-significant results, with odds ratios of 1.605, 1.722, and 1.480, respectively. Finally, motor deficit due to monoparesis presents a non-significant estimate of −0.442 (p = 0.225) and an odds ratio of 0.643, suggesting that this factor does not significantly differentiate between the groups.
The analysis reveals that among the variables examined, monoplegia and hemiparesis are significantly associated with a reduced likelihood of being in the control group, while hypoesthesia is significantly associated with an increased likelihood. The remaining predictors, including localized and radiating pain, tetraparesis, paresthesia, anesthesia, hypersensitivity, sphincter disorders, and motor deficit due to monoparesis, do not demonstrate statistically significant associations with group membership. These findings indicate that specific motor impairments, particularly monoplegia and hemiparesis, are key differentiators between the two groups, whereas the presence of hypoesthesia appears to favor assignment to the control group. The overall results should be interpreted within the context of the study’s design and sample sizes, which comprised 101 patients in the control group and 101 patients in the experimental group (
Table 5).
The classification results indicate that among patients observed as experimental, 55 out of 97 (56.7%) were correctly predicted, while for those observed as control, 67 out of 99 (67.7%) were correctly classified. The overall accuracy of the model is 0.622, which suggests that approximately 62.2% of the cases were correctly classified using the cut-off of 0.5. The specificity of 0.567 reflects a moderate ability of the model to correctly identify patients in the control group, whereas the sensitivity of 0.677 indicates a slightly higher capacity to correctly classify patients in the experimental group. The area under the ROC curve (AUC) is 0.696, demonstrating acceptable discriminative power of the model (
Figure 4). Together, these findings suggest that while the model performs moderately well in distinguishing between the two groups, there is room for improvement, particularly in enhancing specificity and overall classification accuracy (
Table 6).
3.4. Functional and Neurological Assessments
The Barthel Total Score was significantly higher in the experimental group (mean: 60.7) than in the control group (mean: 40.8) (
p = 0.0021). The distribution across the Frankel Scale categories was identical between the groups, with no significant differences (
p = 1.0002). Most patients were classified into the highest functional category (E: 41.6%), followed by category D (28.7%), indicating a generally high level of neurological function (
Table 7).
Table 8 presents a detailed analysis of motor deficits categorized into domains such as monoparesis, monoplegia, hemiparesis, tetraparesis, and paresthesia, comparing their prevalence between the experimental and control groups. Each domain was analyzed individually, with statistical significance levels noted where applicable.
The prevalence of monoparesis was nearly identical between the experimental (49.5%) and control (51.5%) groups, with no significant difference (p = 0.7782). Monoplegia was slightly more common in the control group (21.8%) than in the experimental group (11.9%); however, this difference was not statistically significant (p = 0.1092). A severe form of monoplegia (category 2) was observed exclusively in the control group, although it was rare, affecting only one individual (1.0%). Hemiparesis was significantly more prevalent in the experimental group (20.0%) than in the control group (8.9%) (p = 0.0252). Missing data were minimal, with only one instance, ensuring a robust analysis.
Tetraparesis was similarly distributed between the experimental (5.0%) and control (4.0%) groups, with no significant difference observed (p = 0.7332). Paresthesia was slightly more prevalent in the control group (56.4%) than in the experimental group (53.5%); however, the difference was not statistically significant (p = 0.6712).
3.5. Coping Strategies by Gender
Table 9 compares coping strategies between the experimental and control groups, focusing on females, males, and the total mean scores.
In the domain of Positive Interpretation and Growth, the experimental group recorded a total mean of 9.7 (2.1), with no significant gender differences (p = 0.7171). The control group showed a similar trend, with a total mean of 9.3 (1.6), with no significant difference (p = 0.7981).
For Mental Disengagement, the experimental group scored 7.7 (2.3) for females and 7.8 (1.8) for males (p = 0.9791). The control group recorded slightly higher scores, with a mean of 8.4 (1.9), although this difference was not statistically significant (p = 0.7621).
In the domain of Focus on Emotional Expression, the experimental group showed a significant gender difference, with females scoring higher (12.1 ± 2.0) than males (9.7 ± 1.7), resulting in a p-value of less than 0.001. Similarly, in the control group, females scored 12.5 (1.5) compared to males at 11.1 (1.8), also with a p-value of less than 0.001.
The experimental and control groups showed comparable scores for the use of Instrumental Social Support. In the experimental group, the total mean was 13.1 (2.1), with no significant gender differences (p = 0.1981). The control group recorded a mean of 13.1 (1.7), with no significant differences (p = 0.7011).
For the Religious Approach, females in the experimental group scored significantly higher (14.8 ± 2.0) than males (13.7 ± 1.7), with a p-value of 0.0081. In the control group, a similar gender difference was observed, with females scoring 14.4 (1.8) compared to males at 13.6 (1.5), resulting in a p-value of 0.0311. These findings highlight the preference for religious coping strategies among females in both groups.
In the Social Support Coping domain, the experimental group recorded a total mean of 34.9 (4.8), with significant gender differences (p < 0.0011). The control group, with a mean of 35.5 (3.4), also showed a significant difference (p = 0.0011). Social support as a coping strategy was significantly different between genders and across the groups.
The results showed that significant differences were present in specific domains, including Focus on Emotional Expression, Religious Approach, and Social Support Coping, with females scoring consistently higher across these areas. Domains such as Positive Interpretation and Growth, Mental Disengagement, and Denial exhibited similar scores between the groups, reflecting non-significant differences. The experimental group demonstrated slightly greater reliance on certain coping strategies, which may reflect the influence of the intervention. These findings emphasize the importance of tailoring interventions to sex-specific coping patterns, particularly in strategies related to emotional and social support.

 ,
, 


