
Fetlock Joint Angle Pattern and Range of Motion Quantification Using Two Synchronized Wearable Inertial Sensors per Limb in Sound Horses and Horses with Single Limb Naturally Occurring Lameness

 , , ,
, , ,  ,
, 
Abstract
:Simple Summary
Abstract
1. Introduction
2. Material and Methods
2.1. Study Design
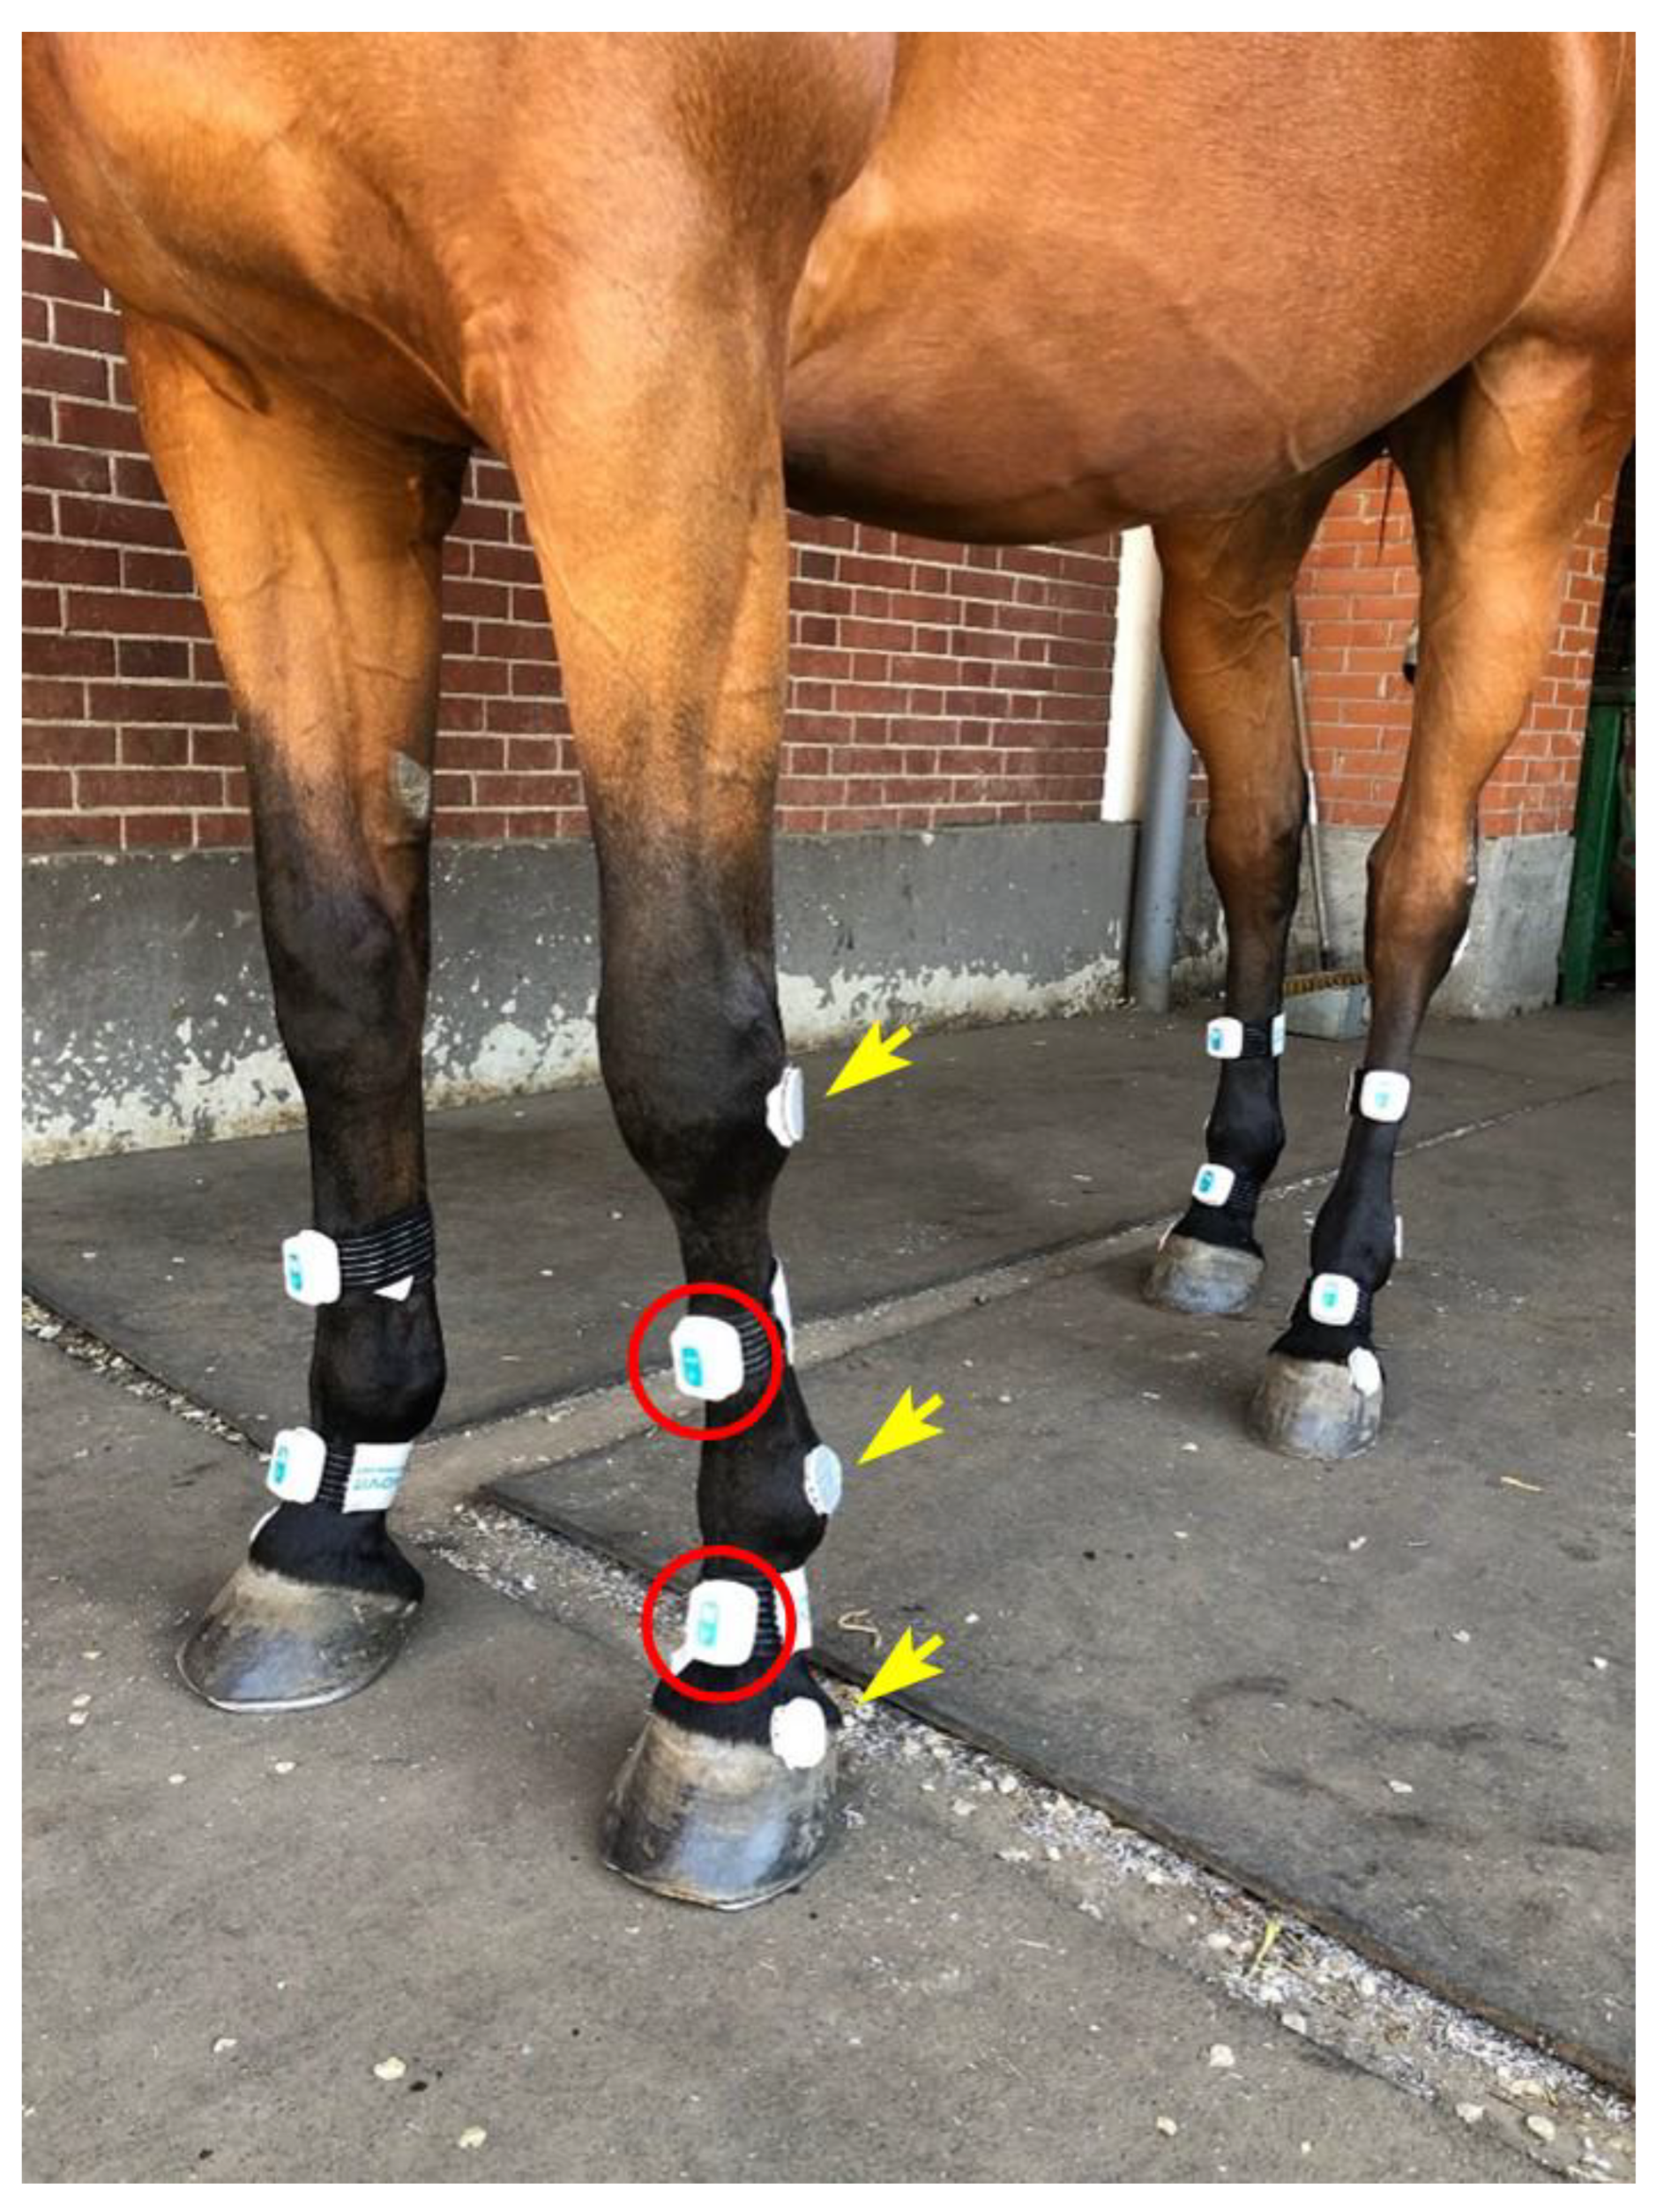
2.2. IMU System
2.3. OMC Technology
2.4. Standardized Locomotion Test
2.5. Data Acquisition
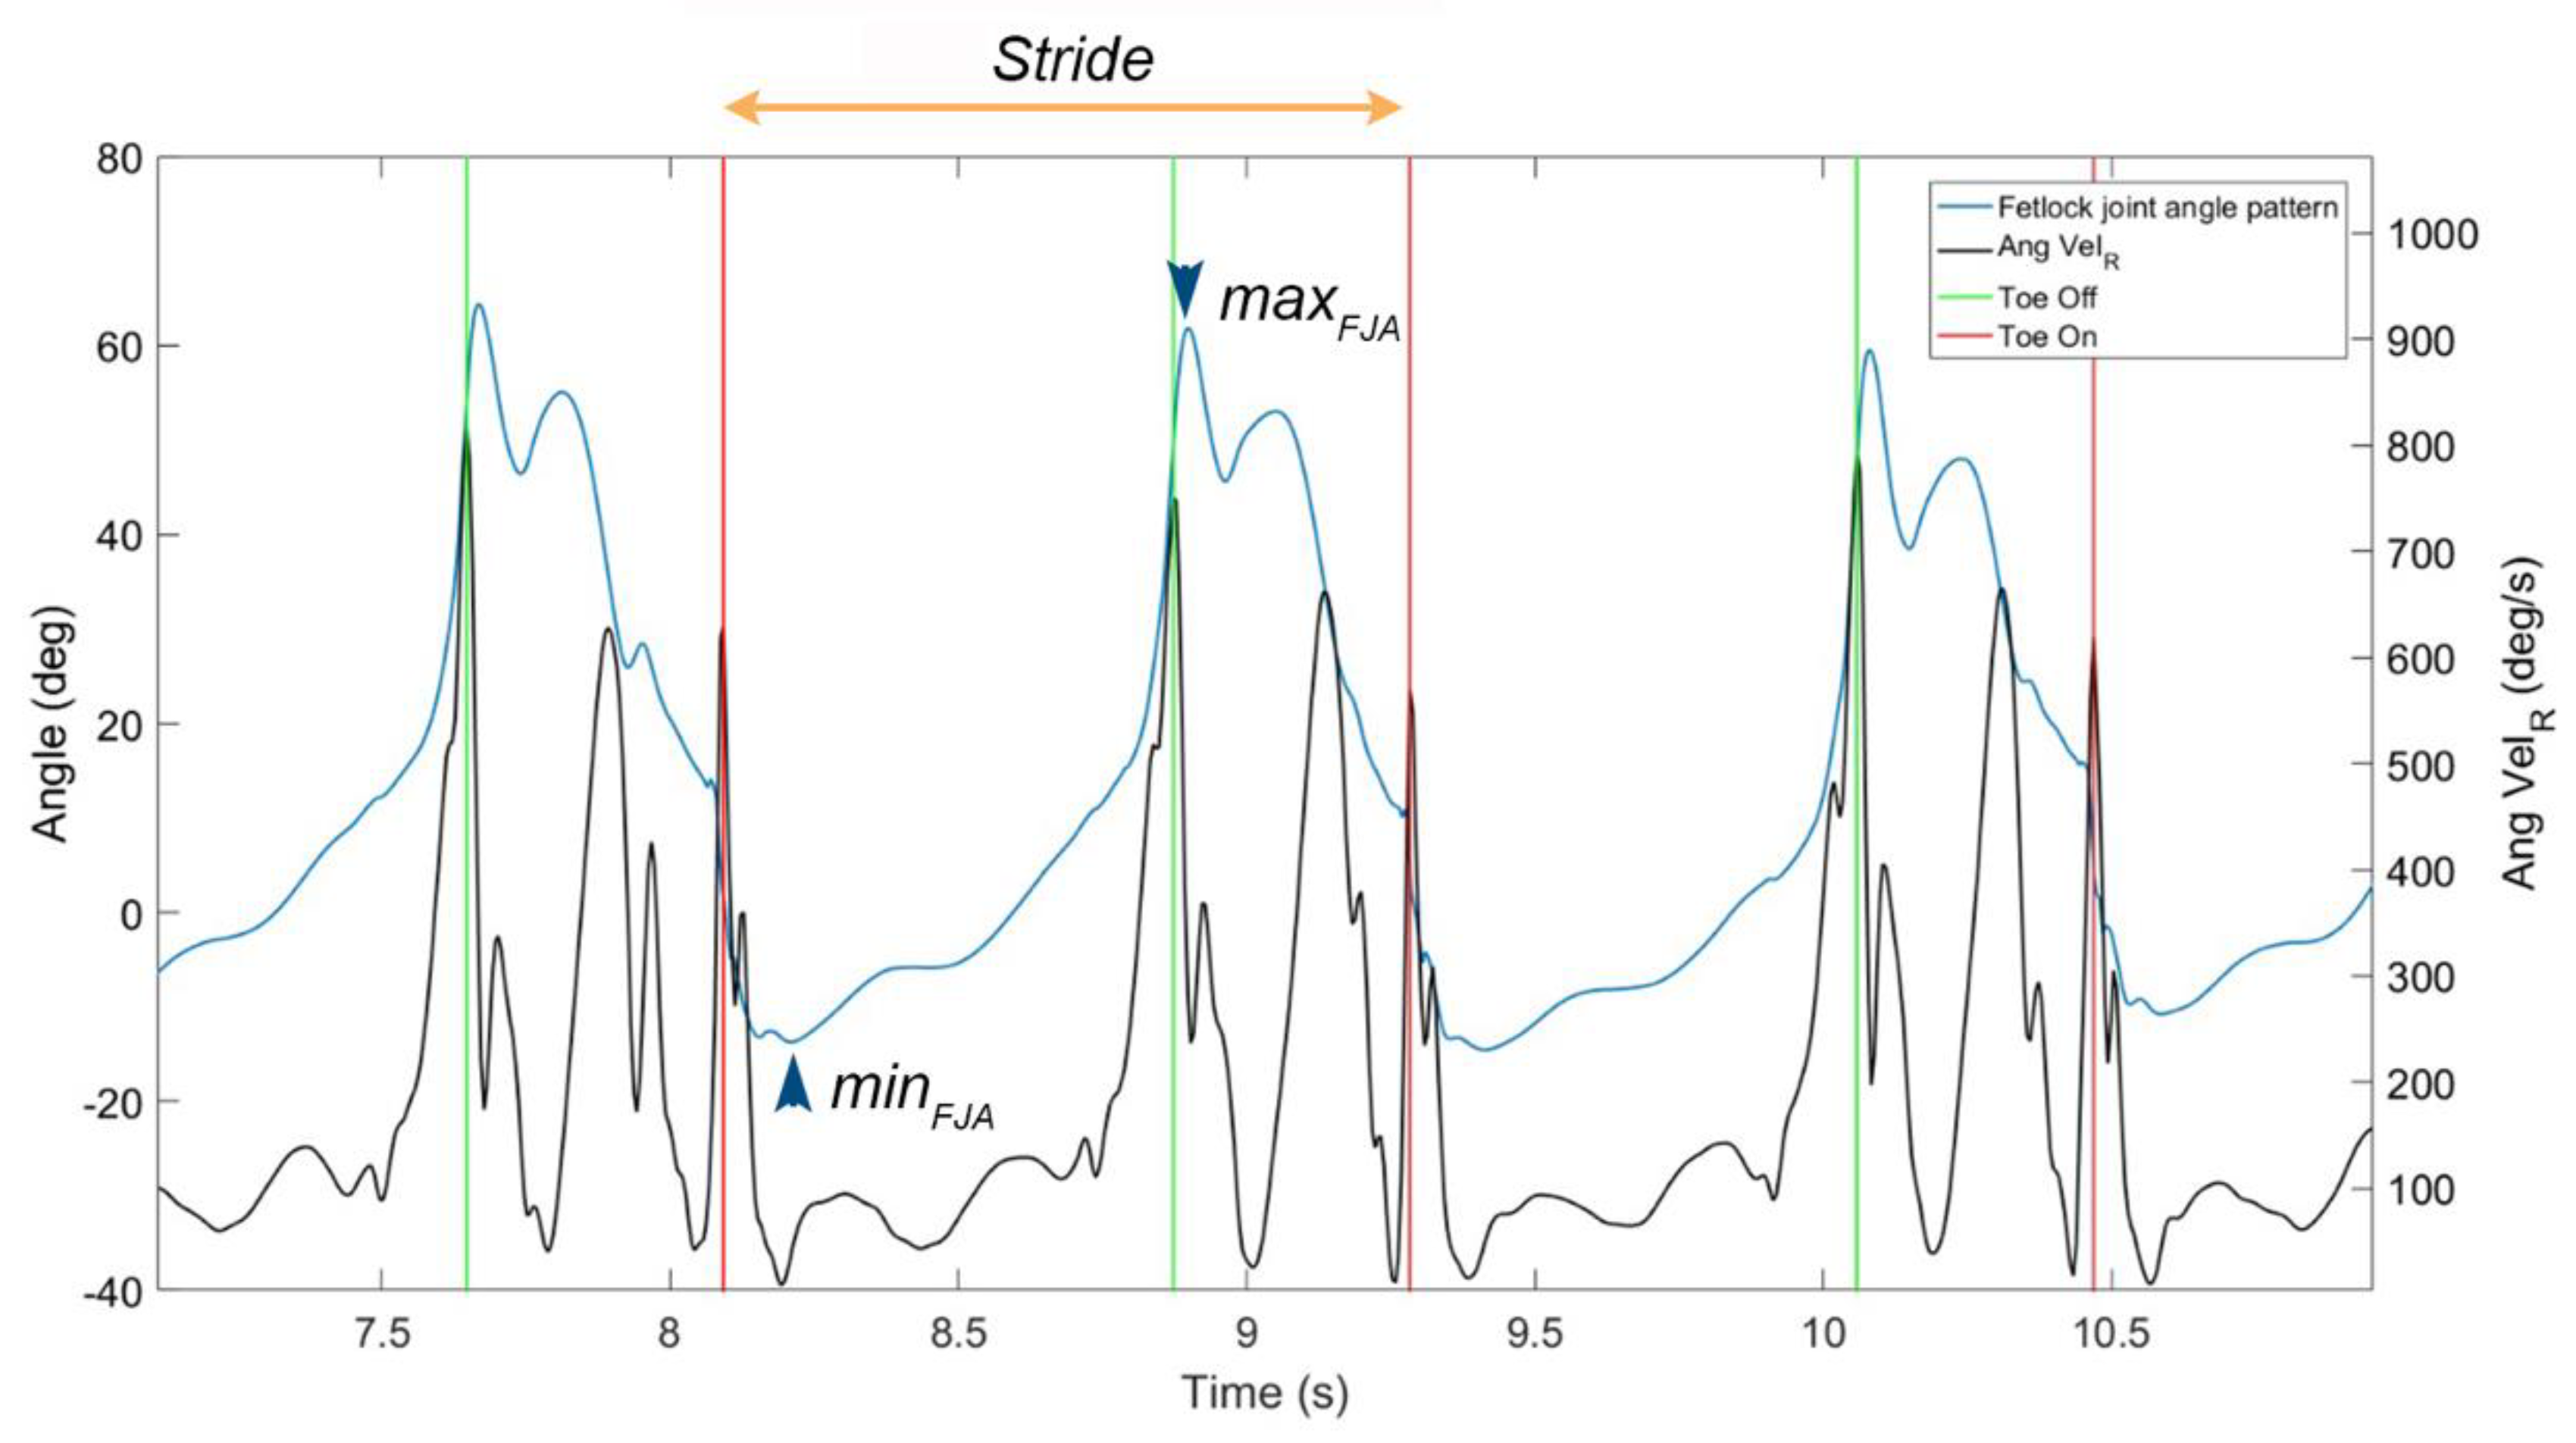
2.6. Data Processing
2.7. Statistical Analysis
3. Results
3.1. Animals
3.2. Standardized Locomotion Test
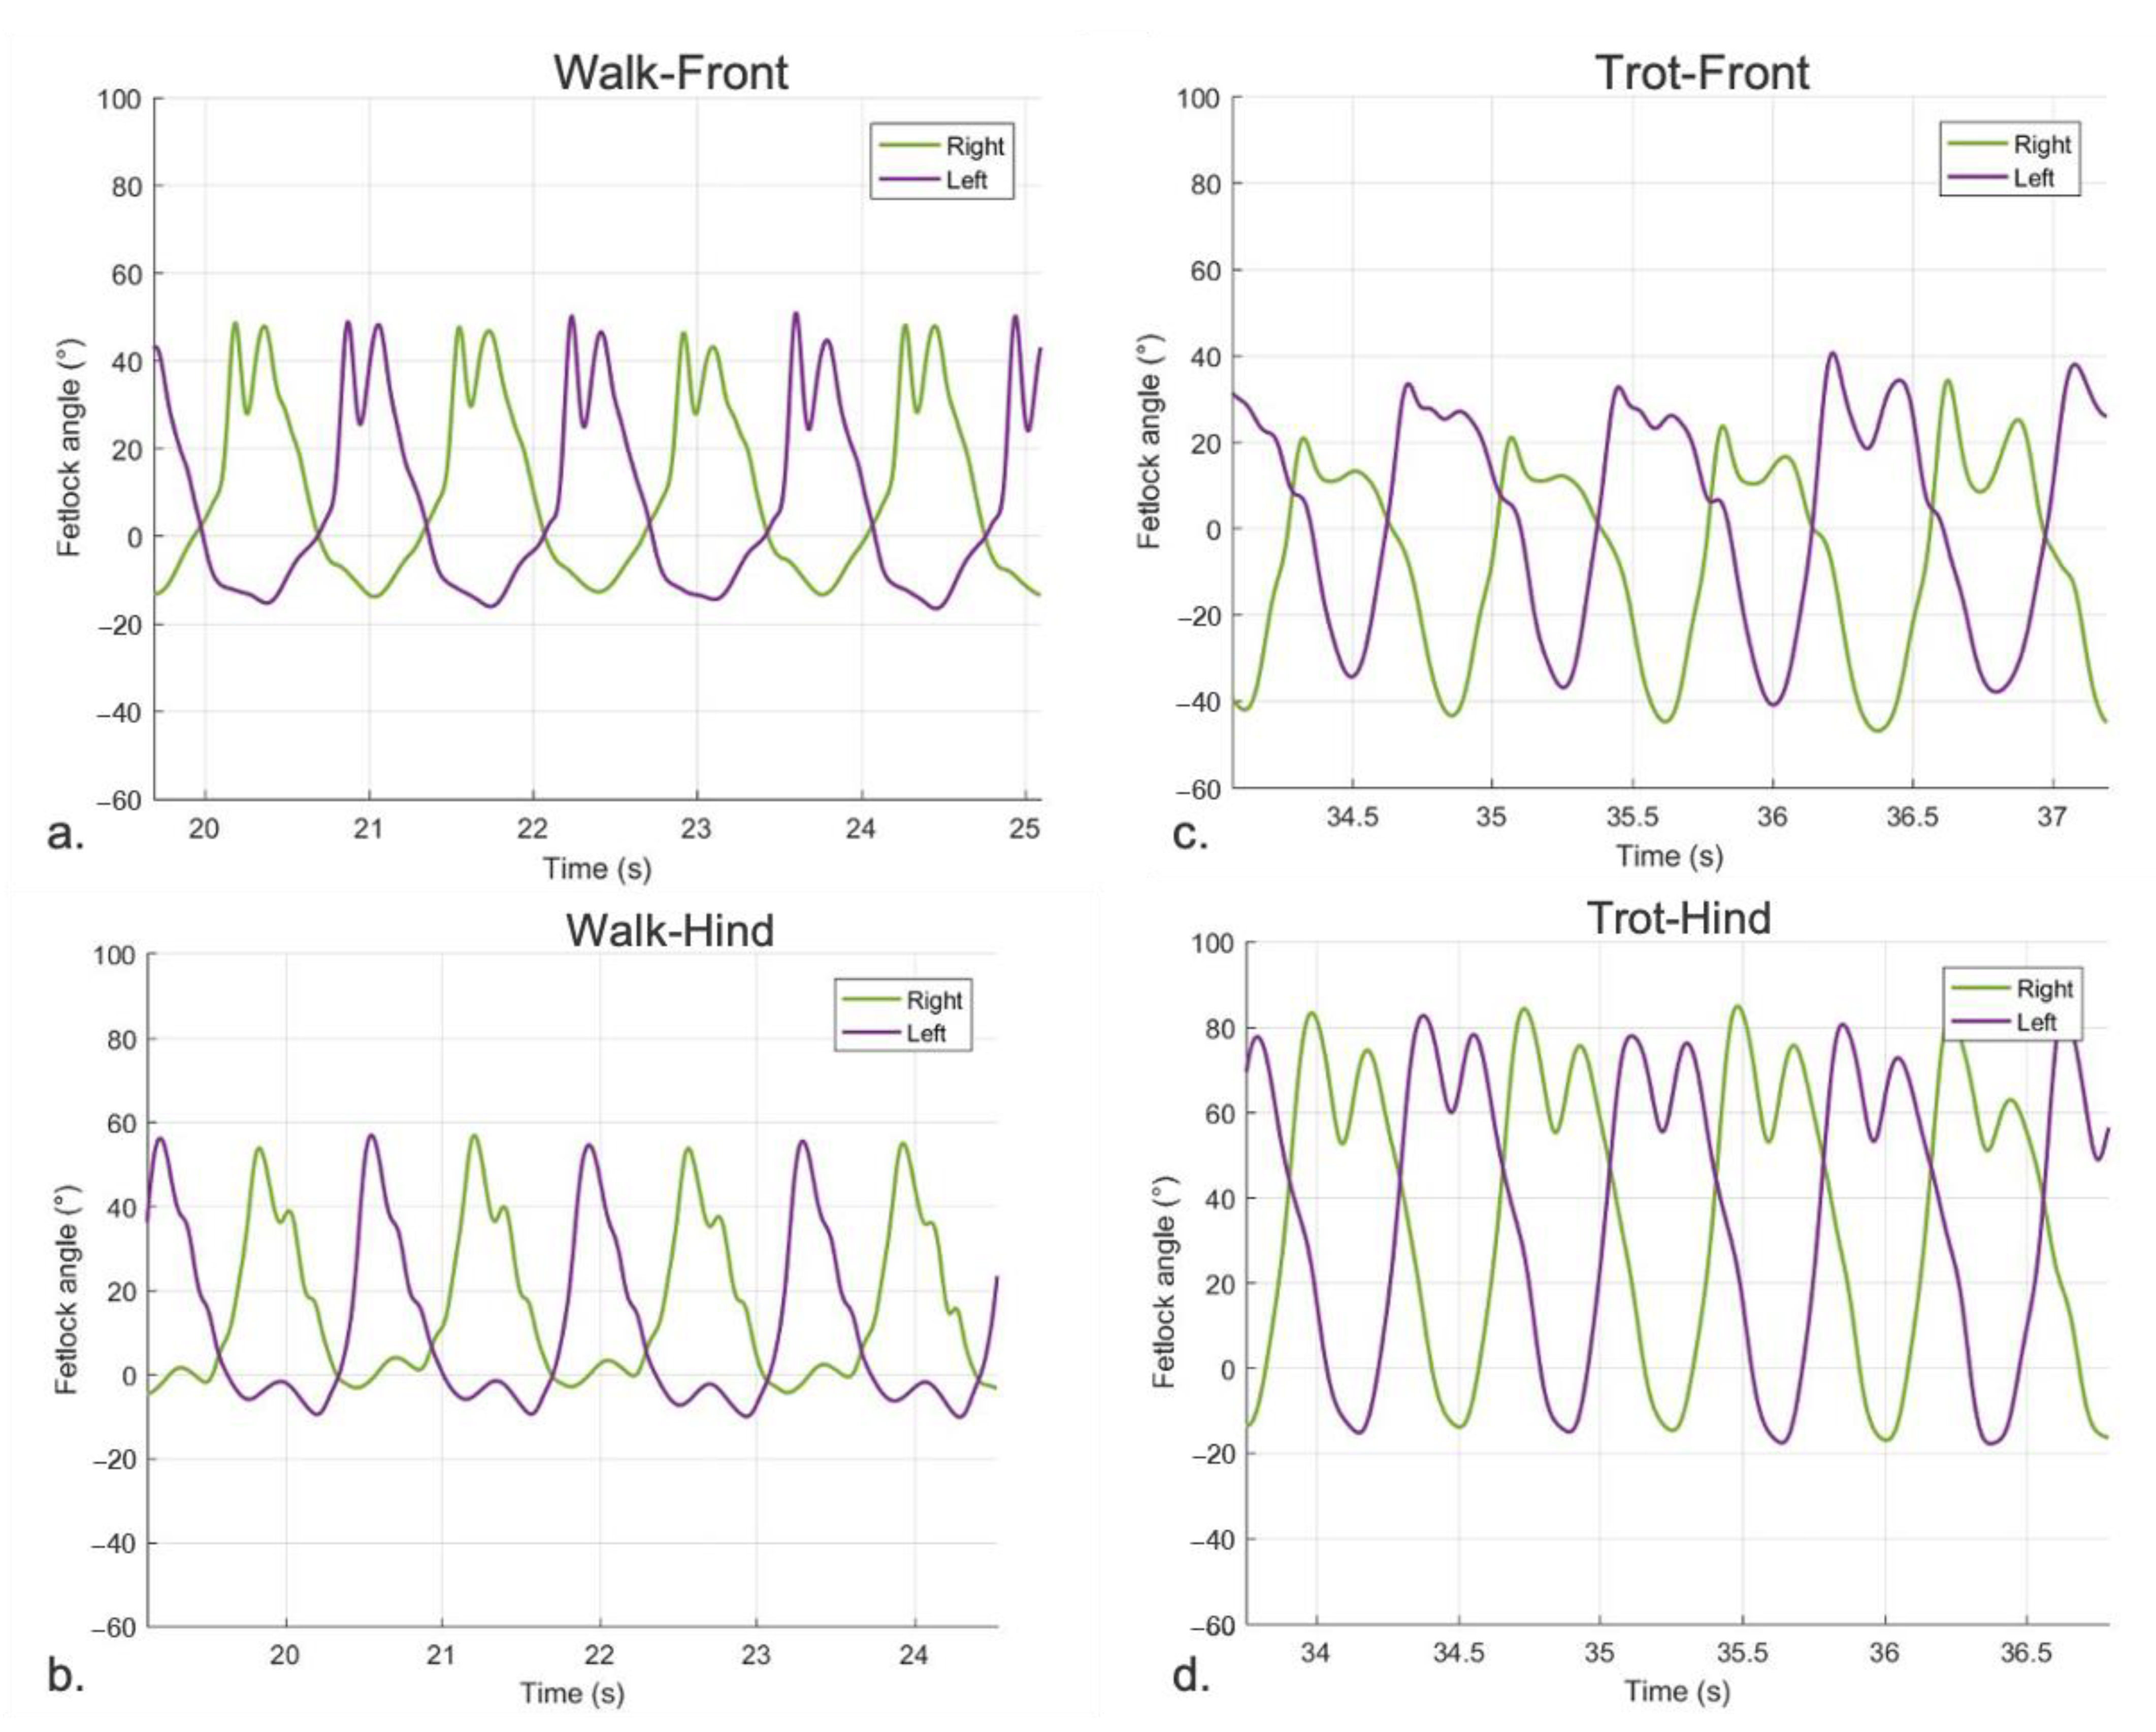
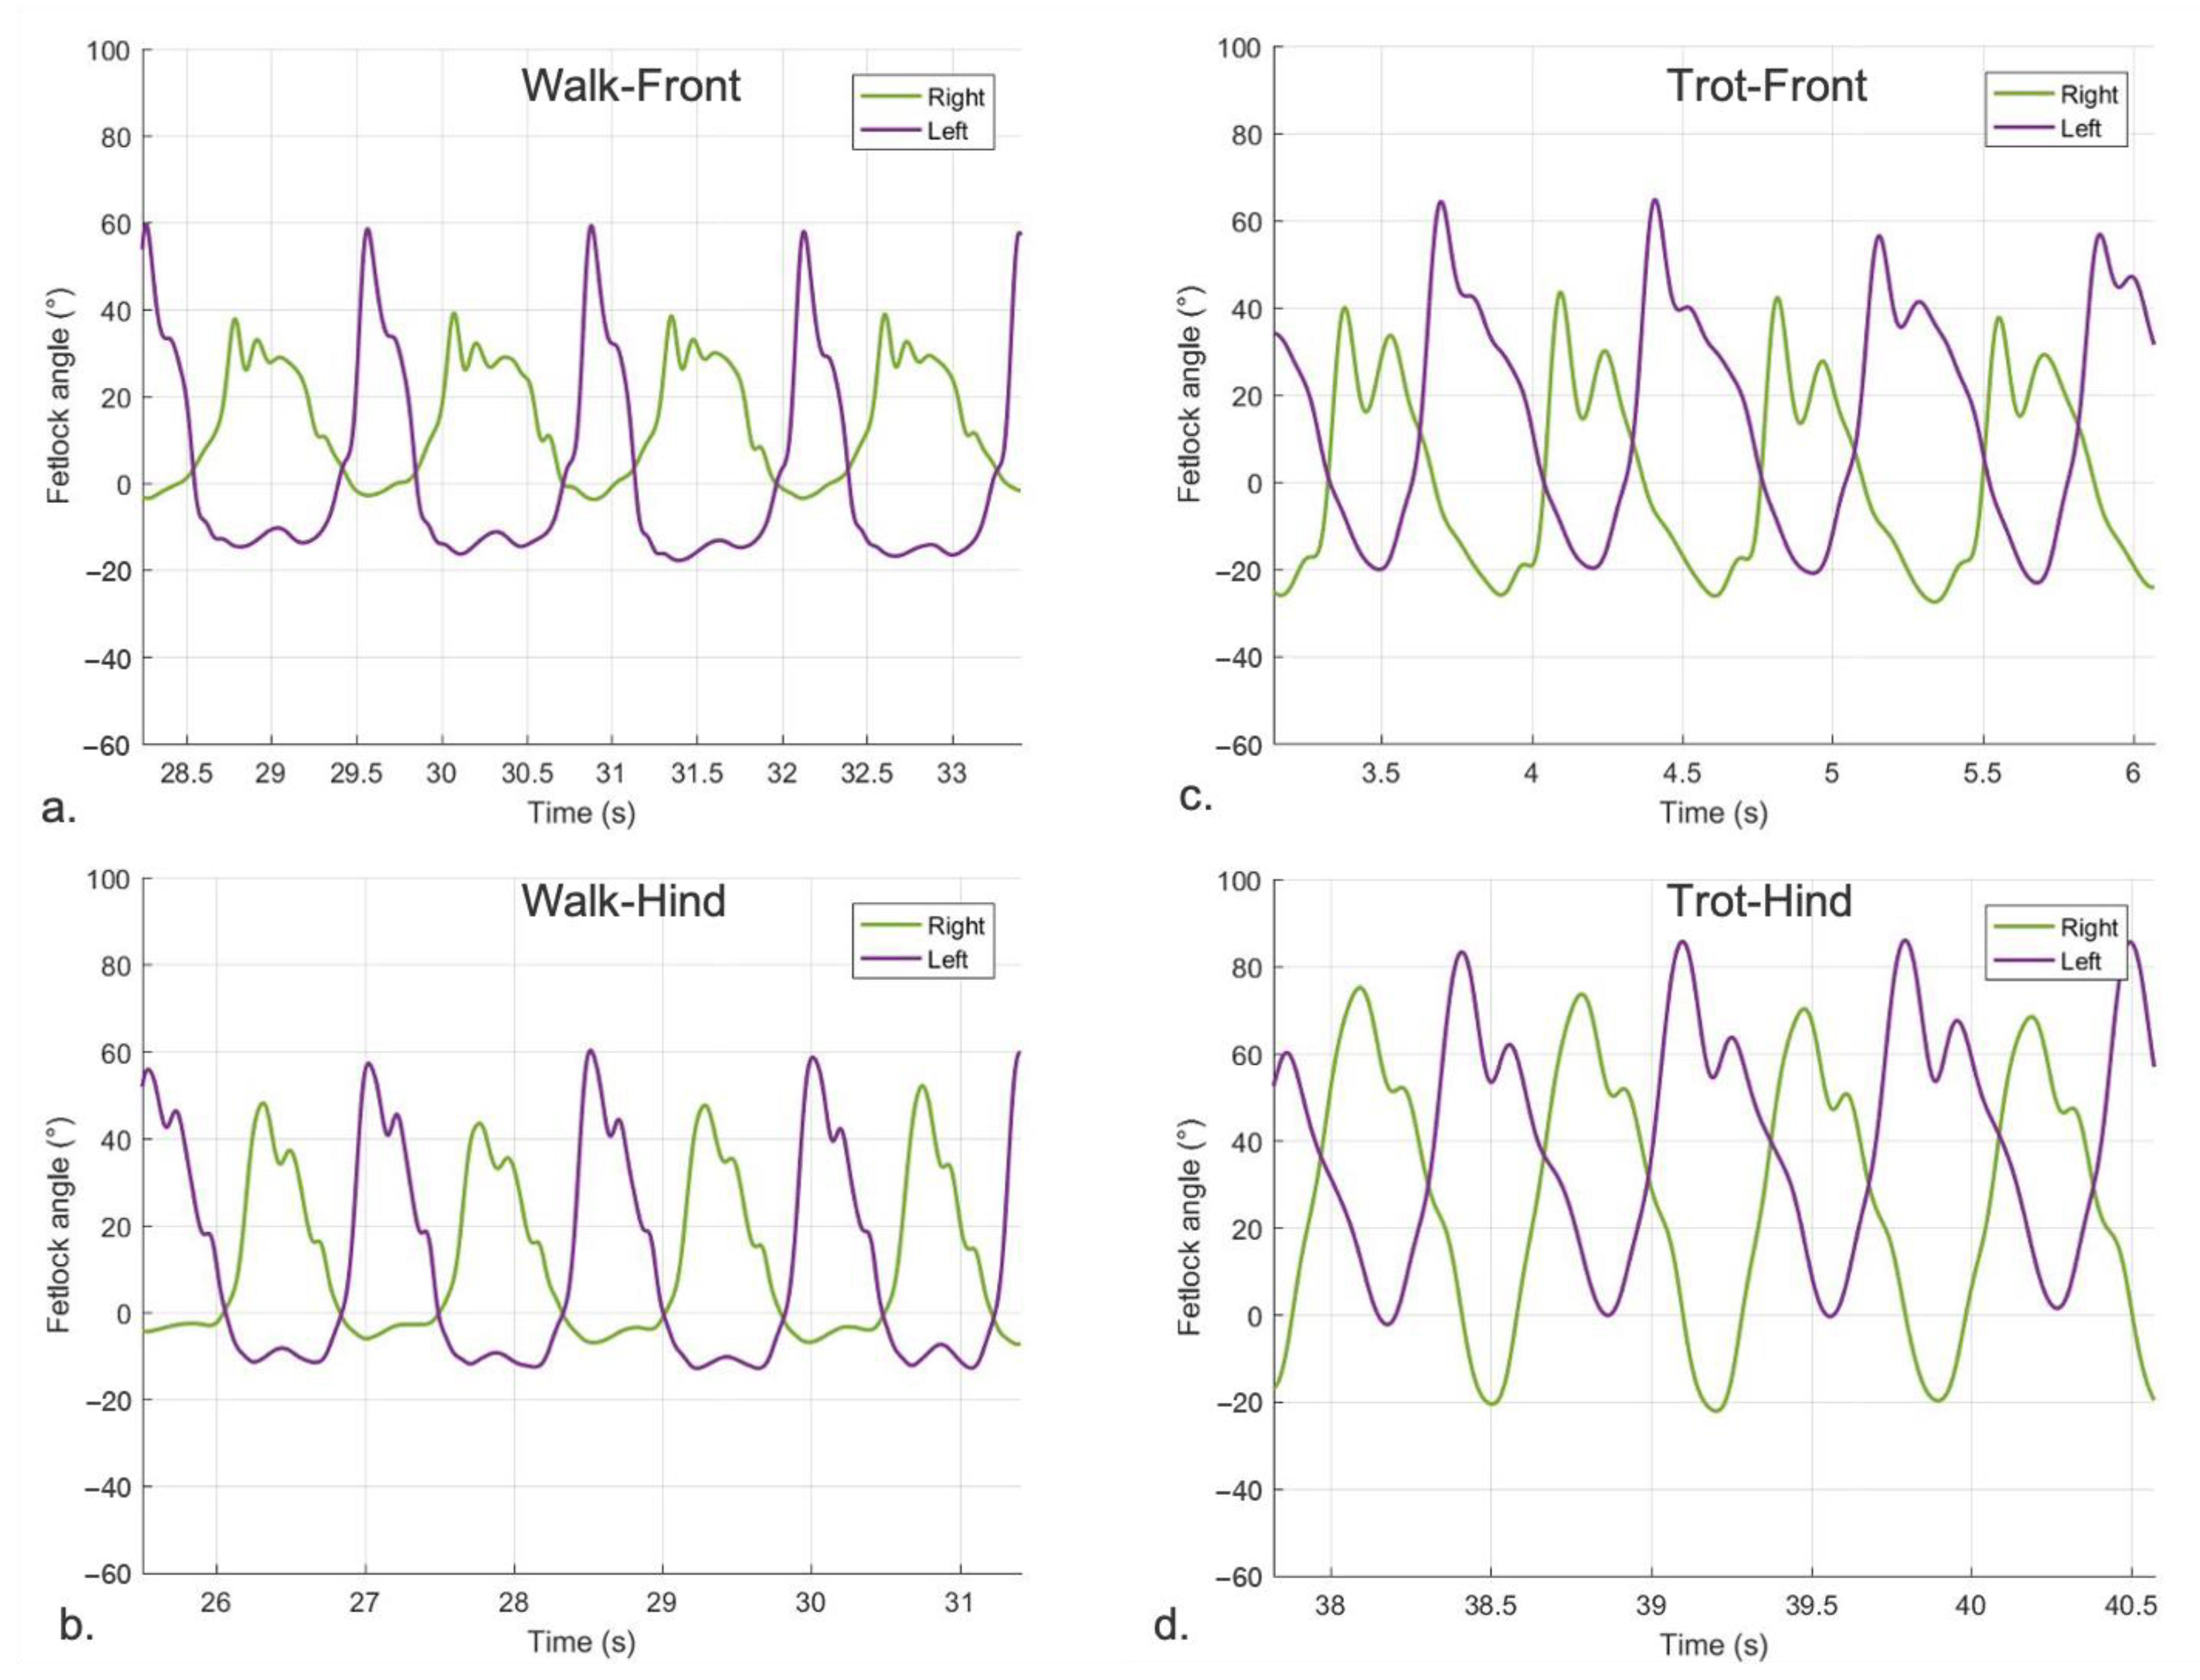
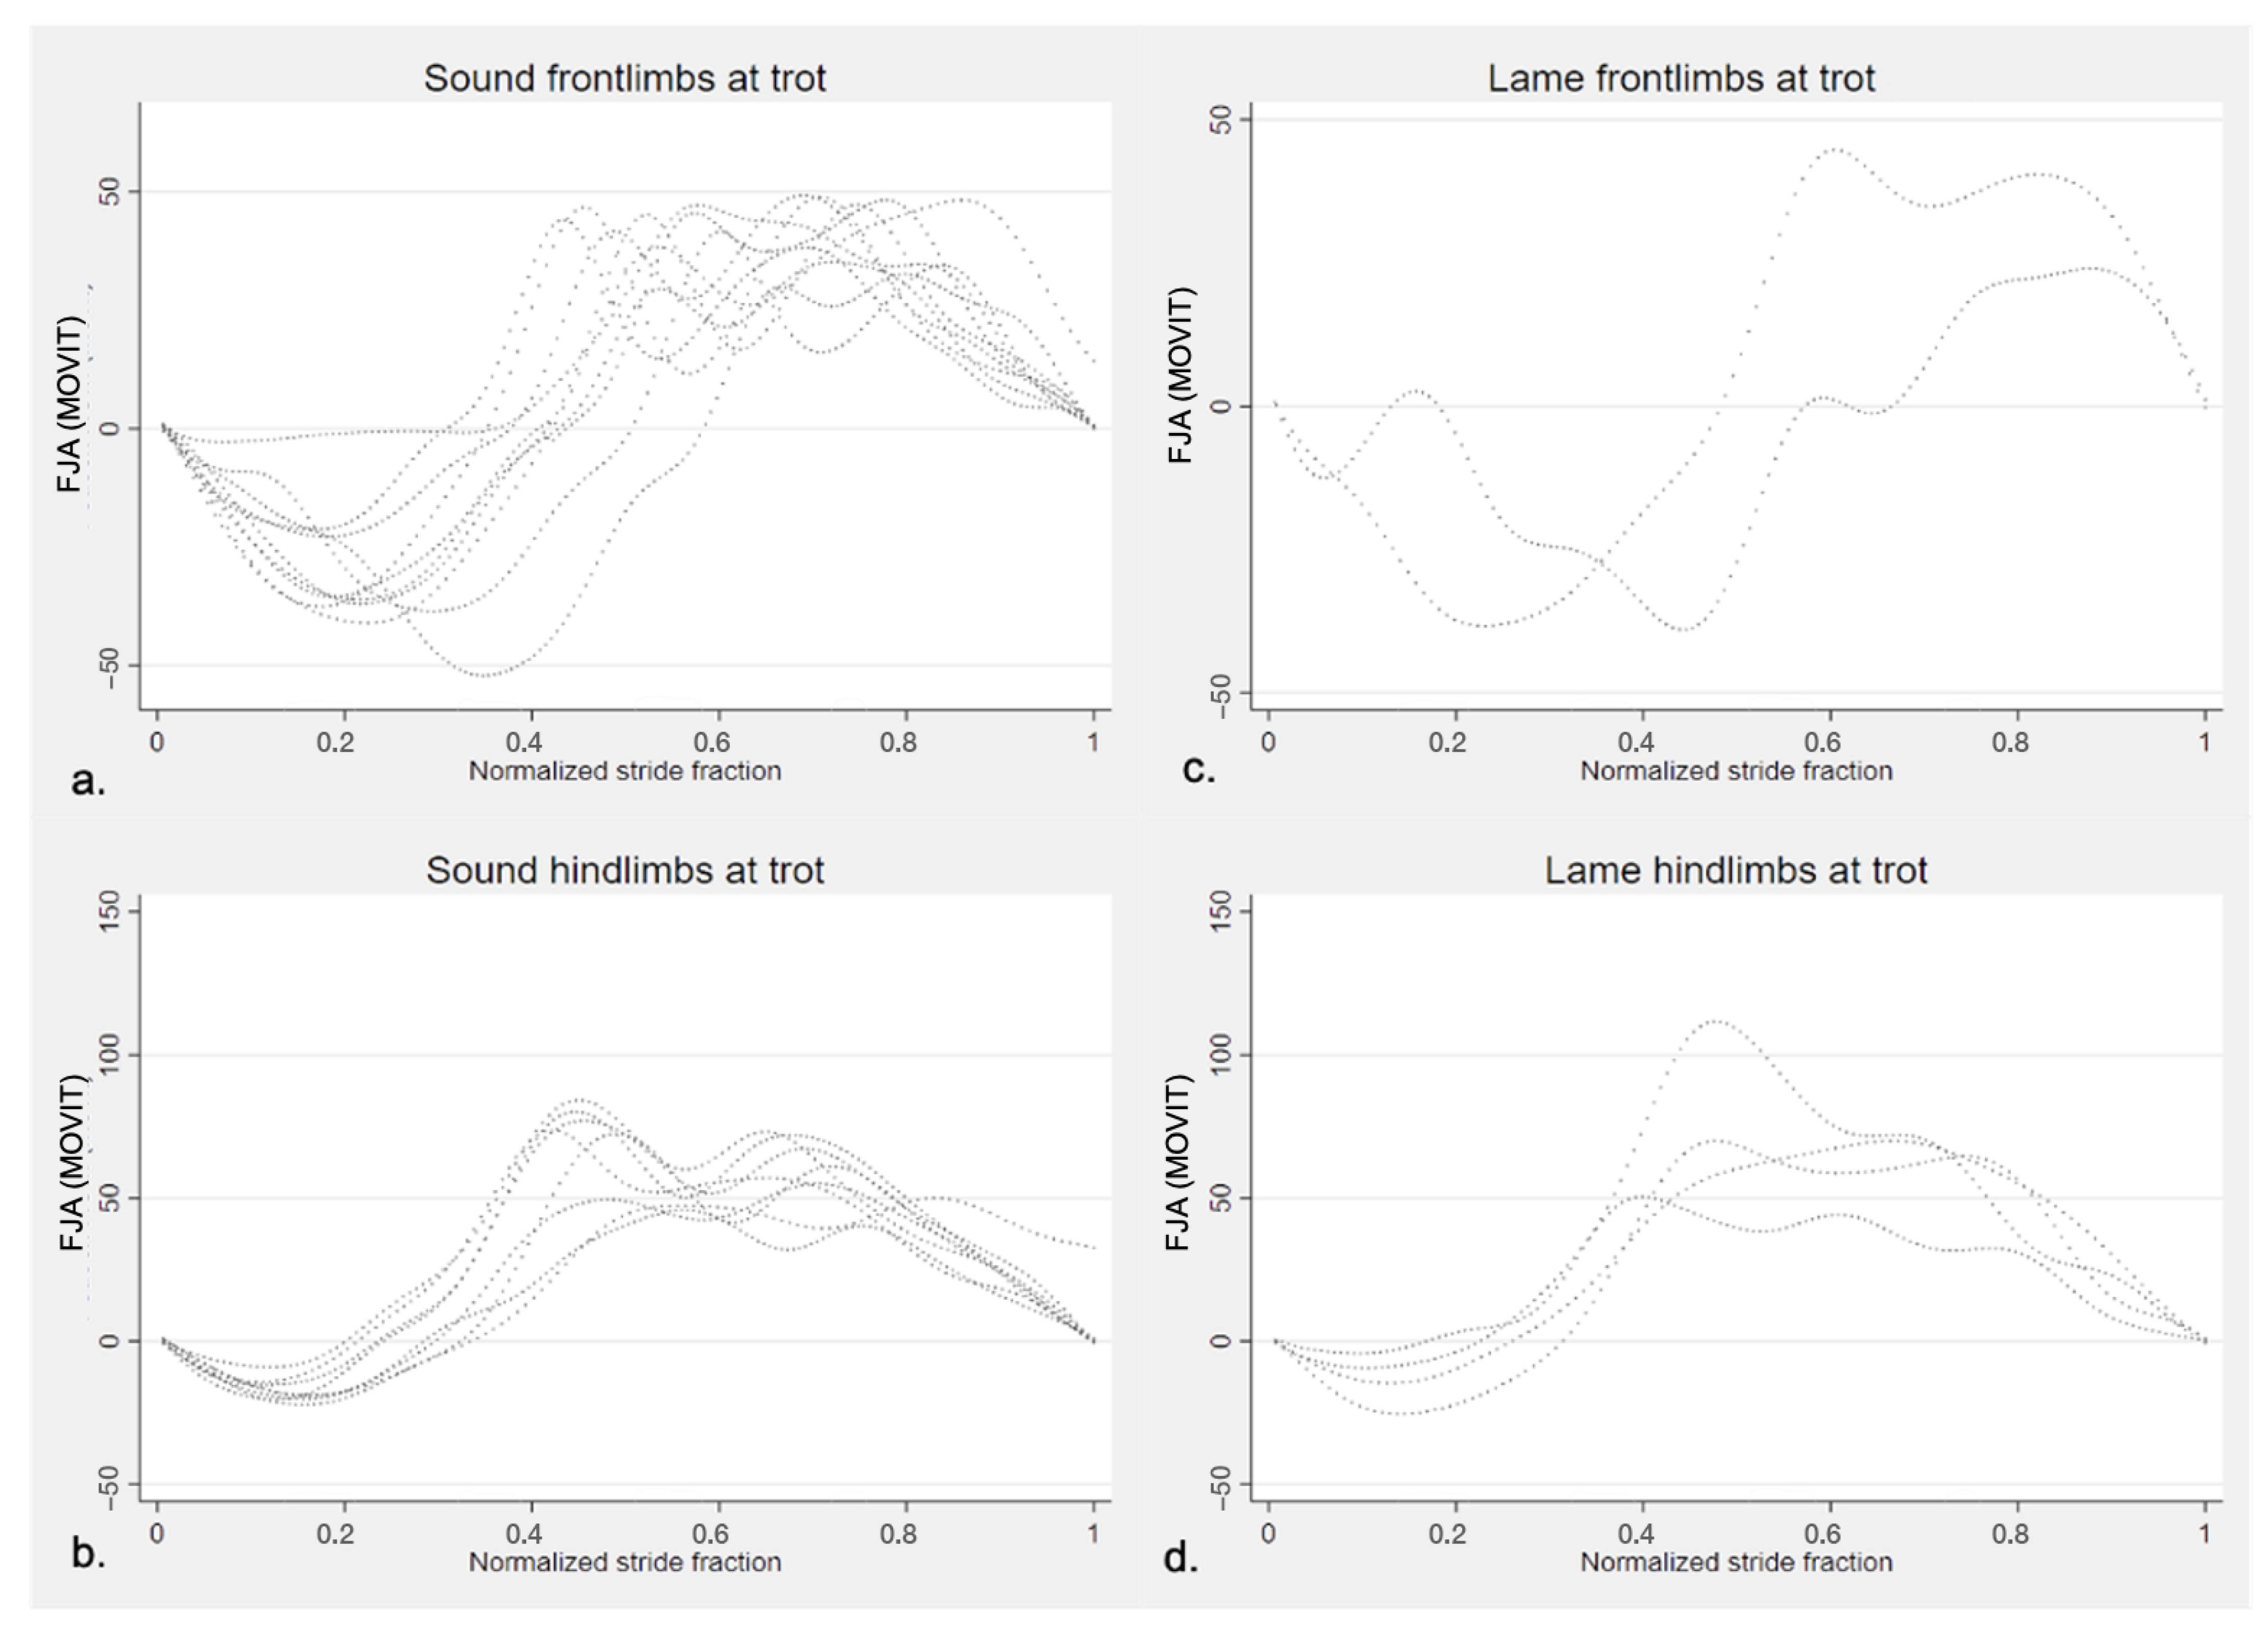
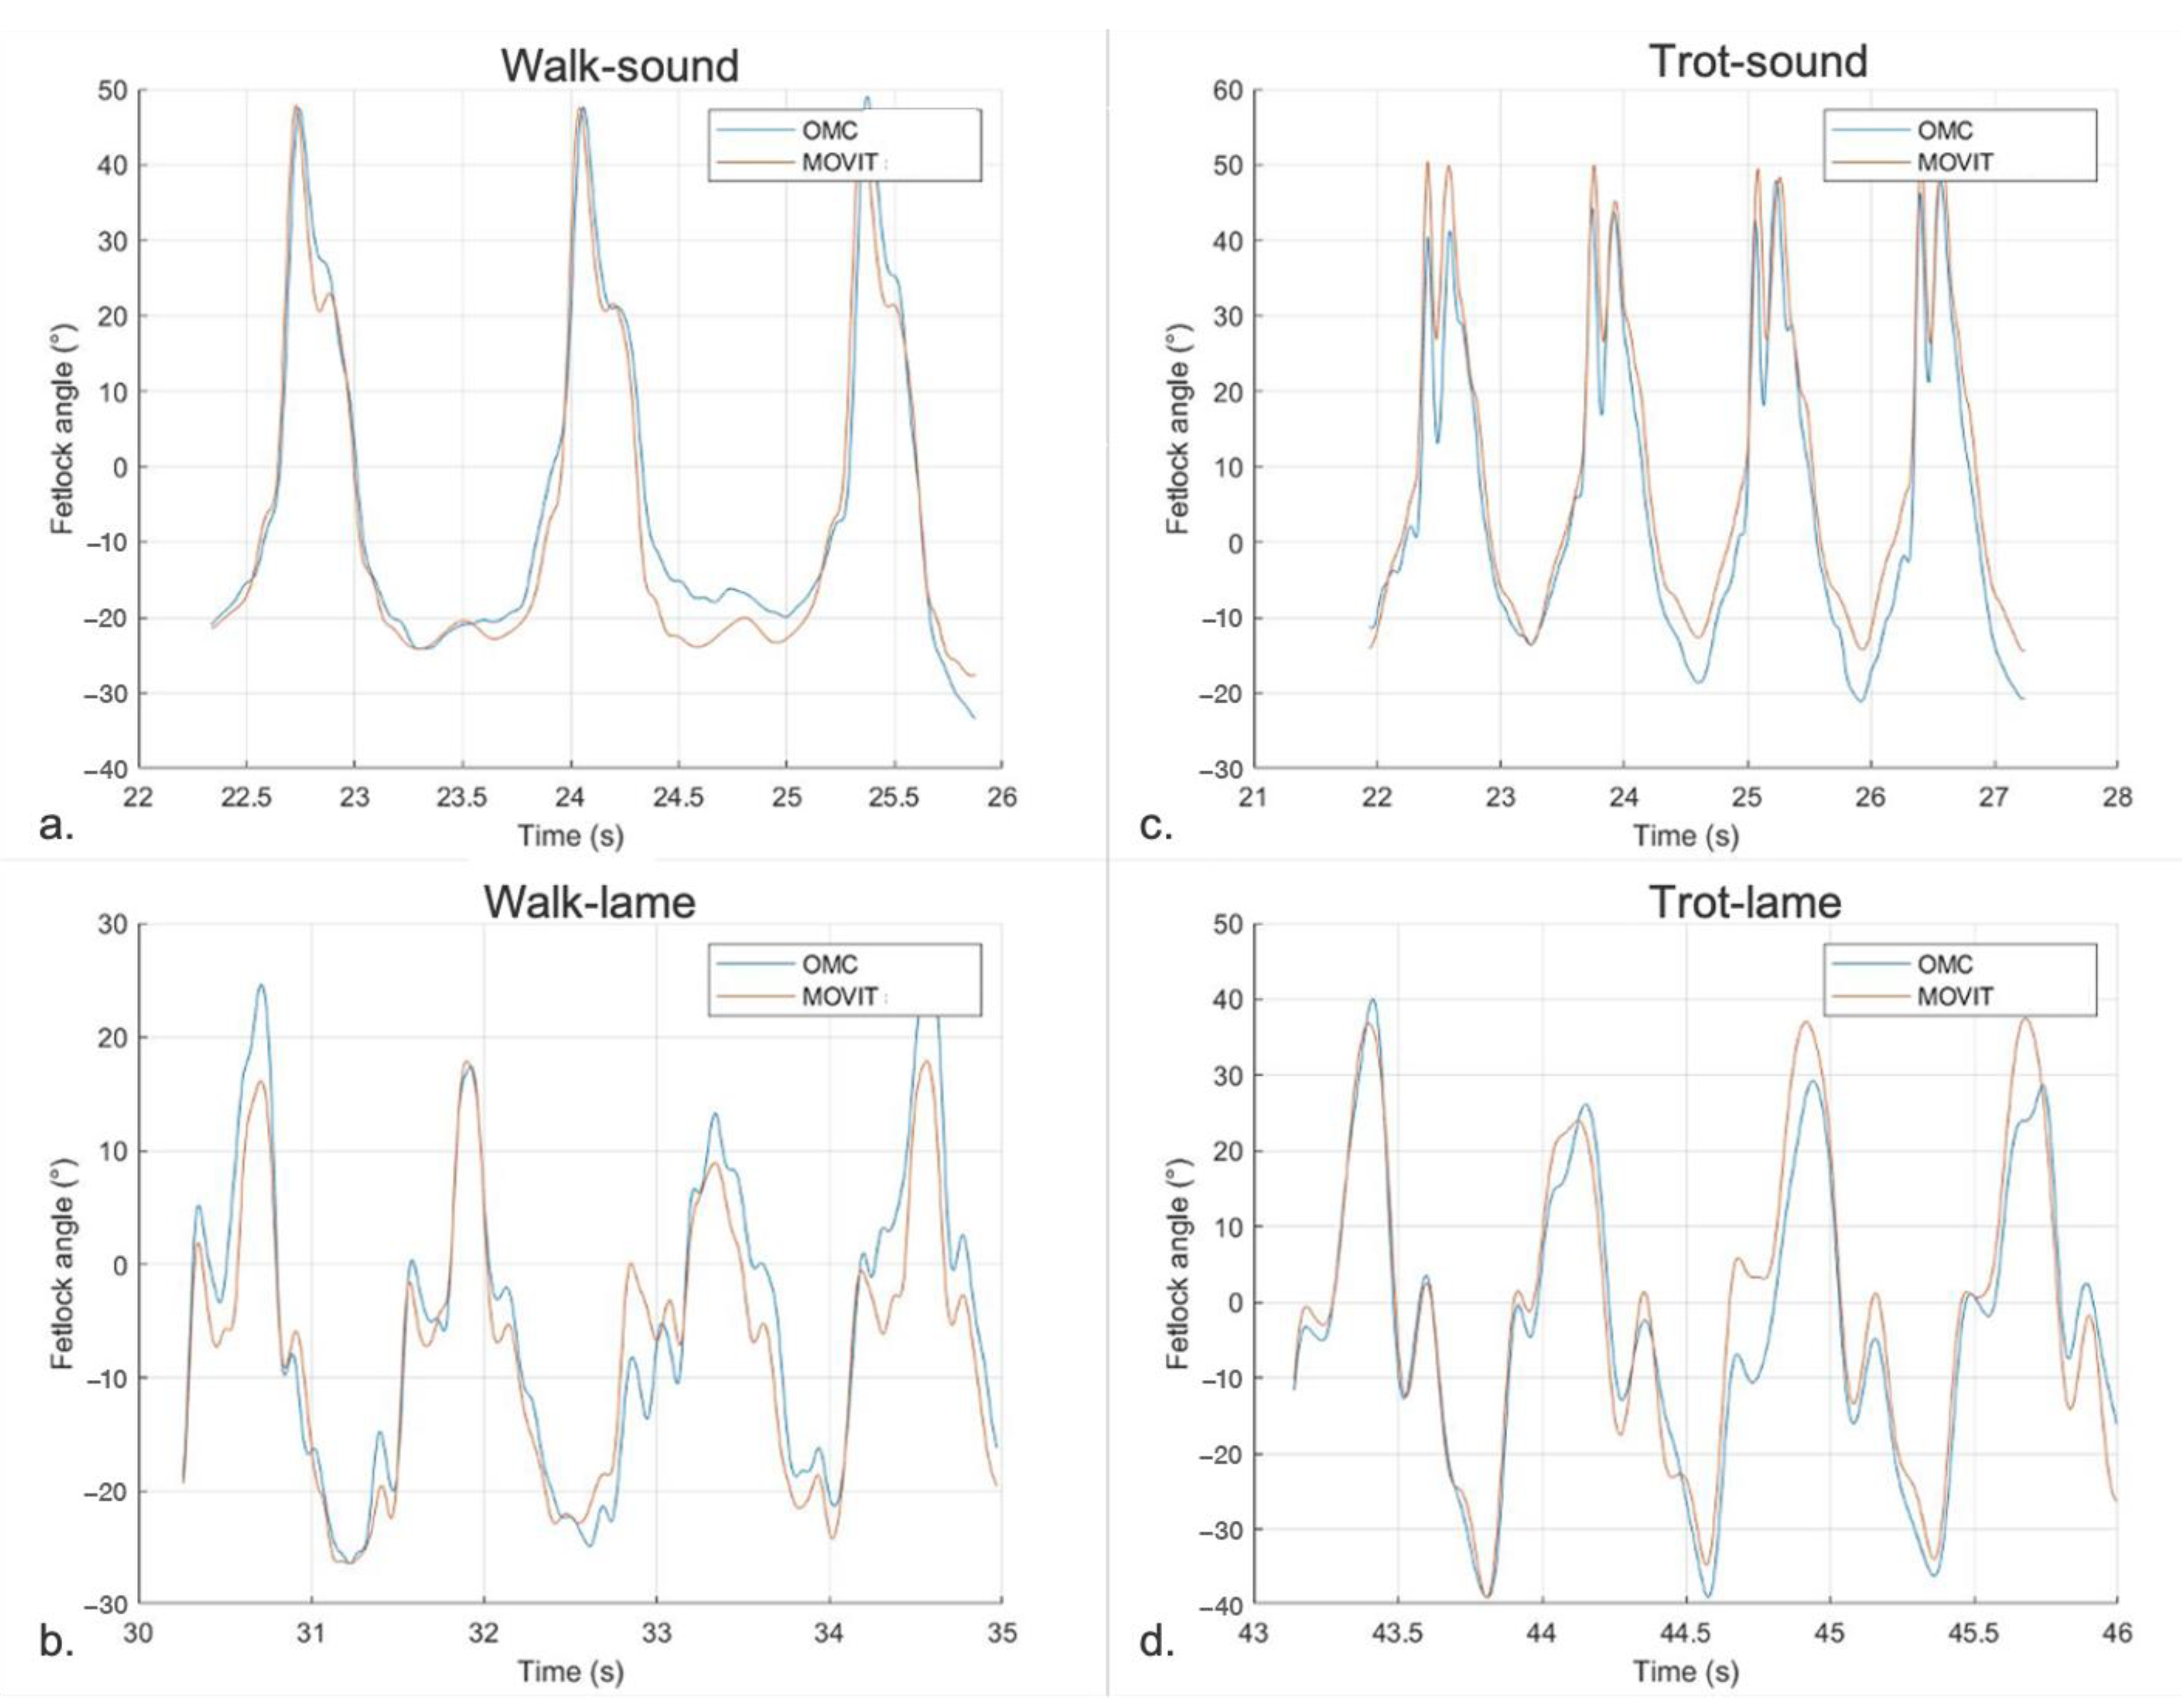
3.2.1. Sagittal FJA Curves Generated by MOVIT IMU System
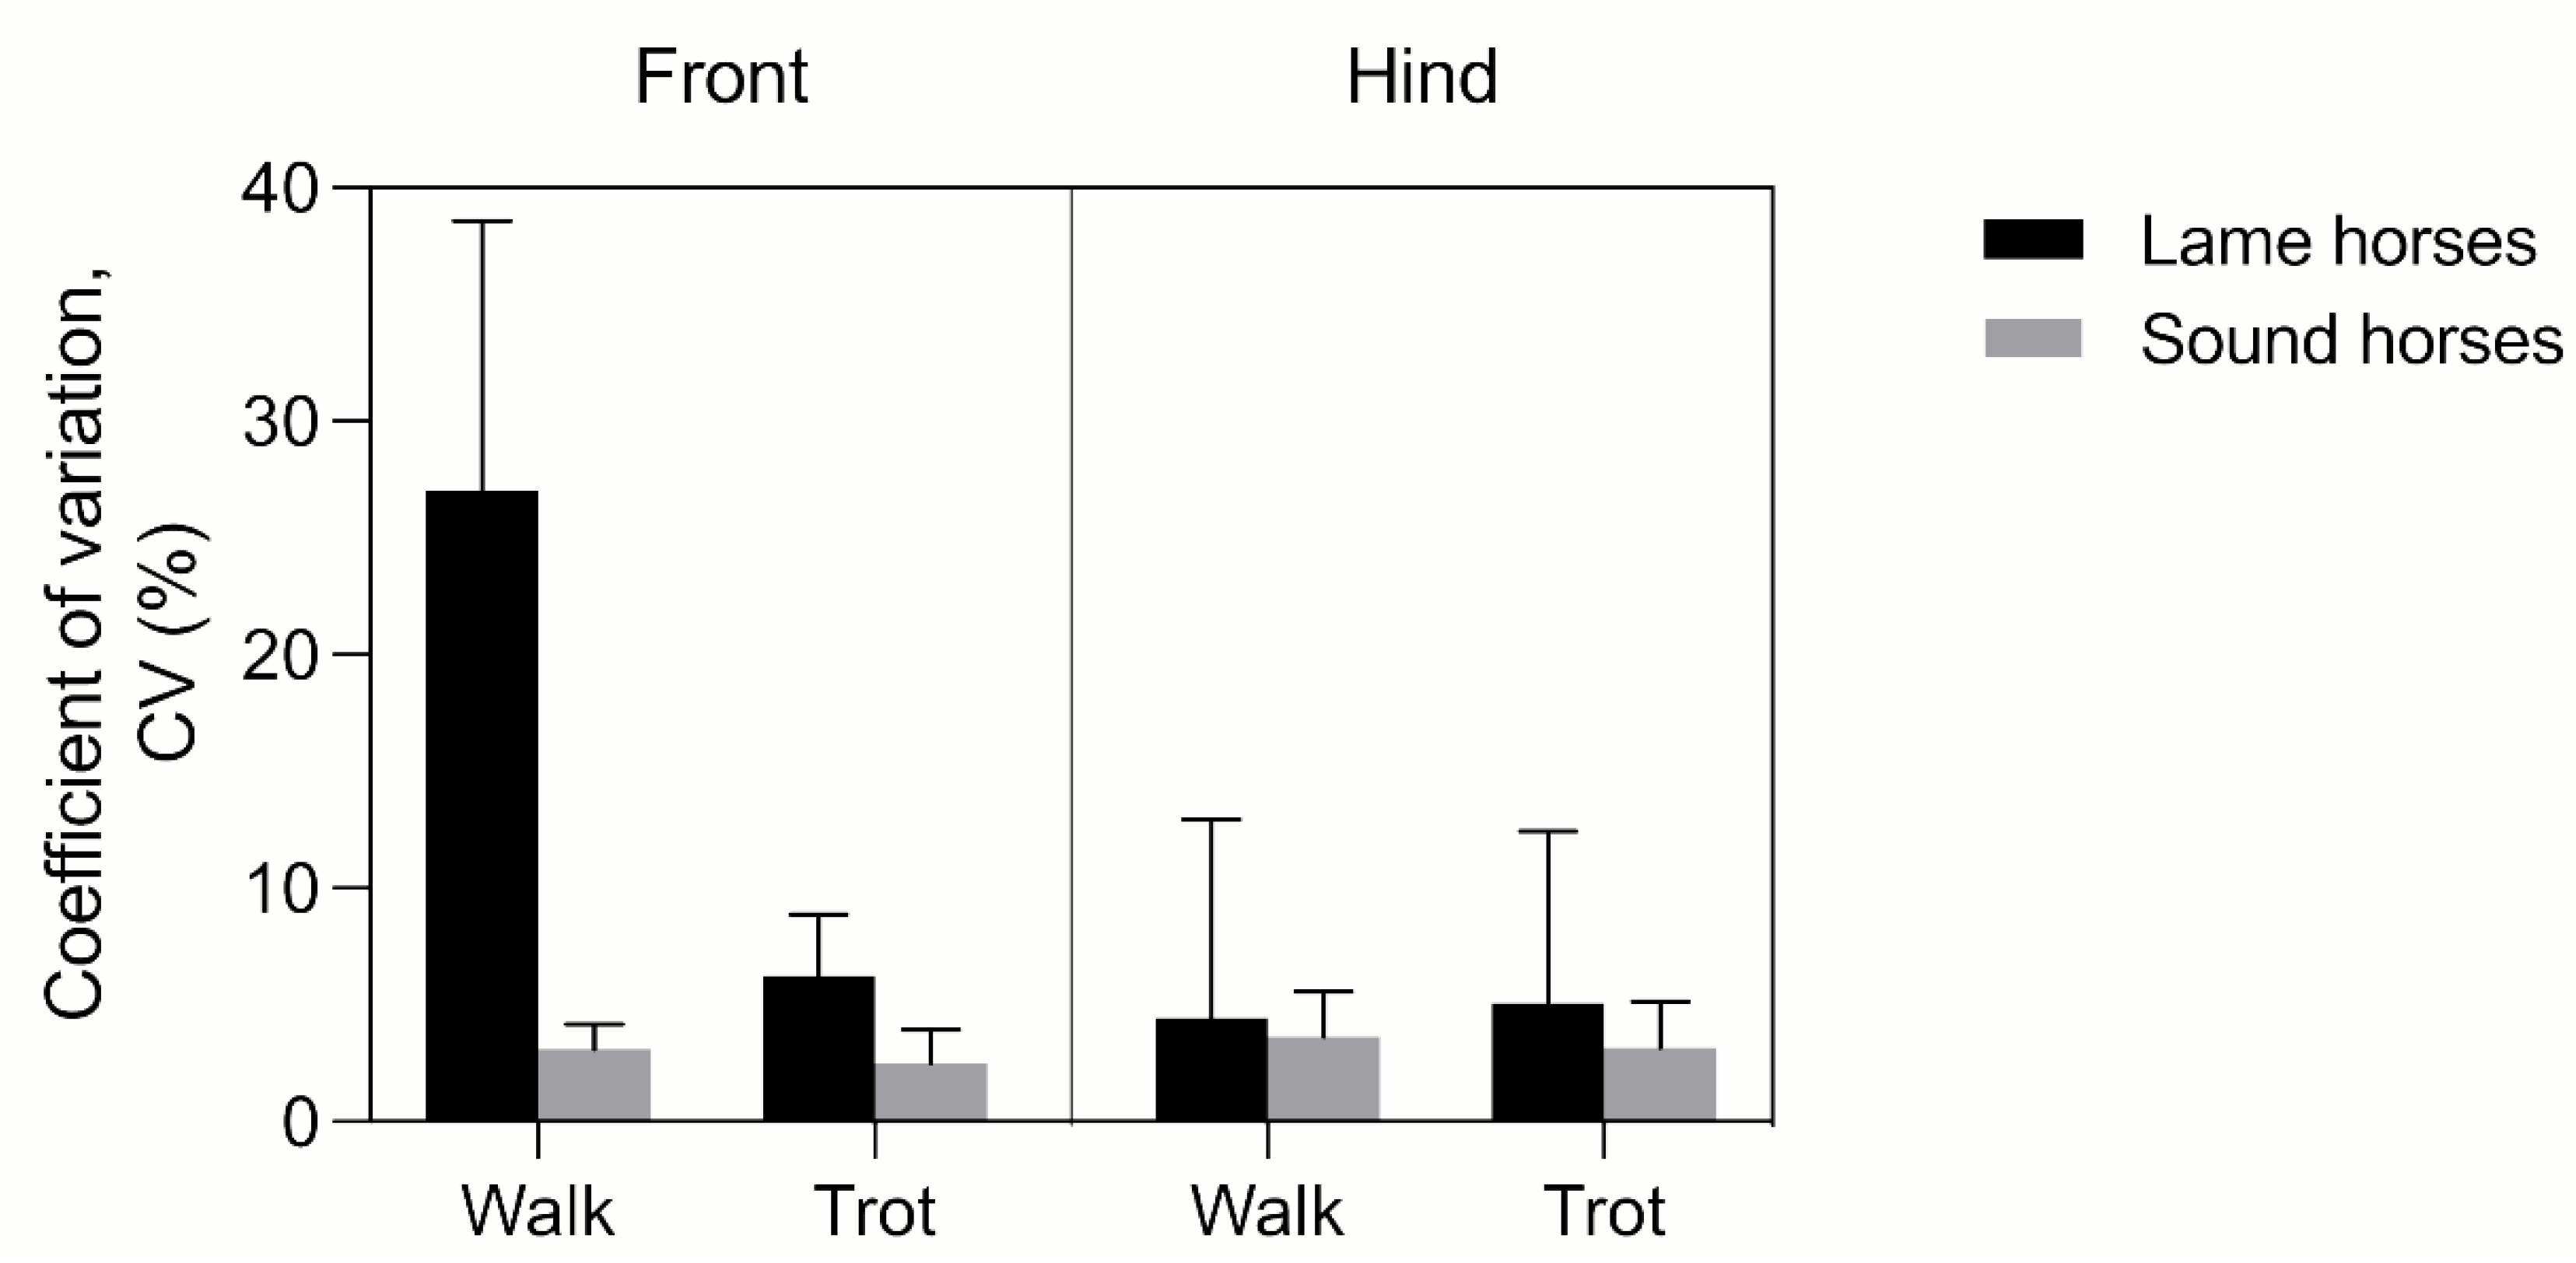
3.2.2. Determinants of FJROM Variability in MOVIT IMU System-Acquired Data
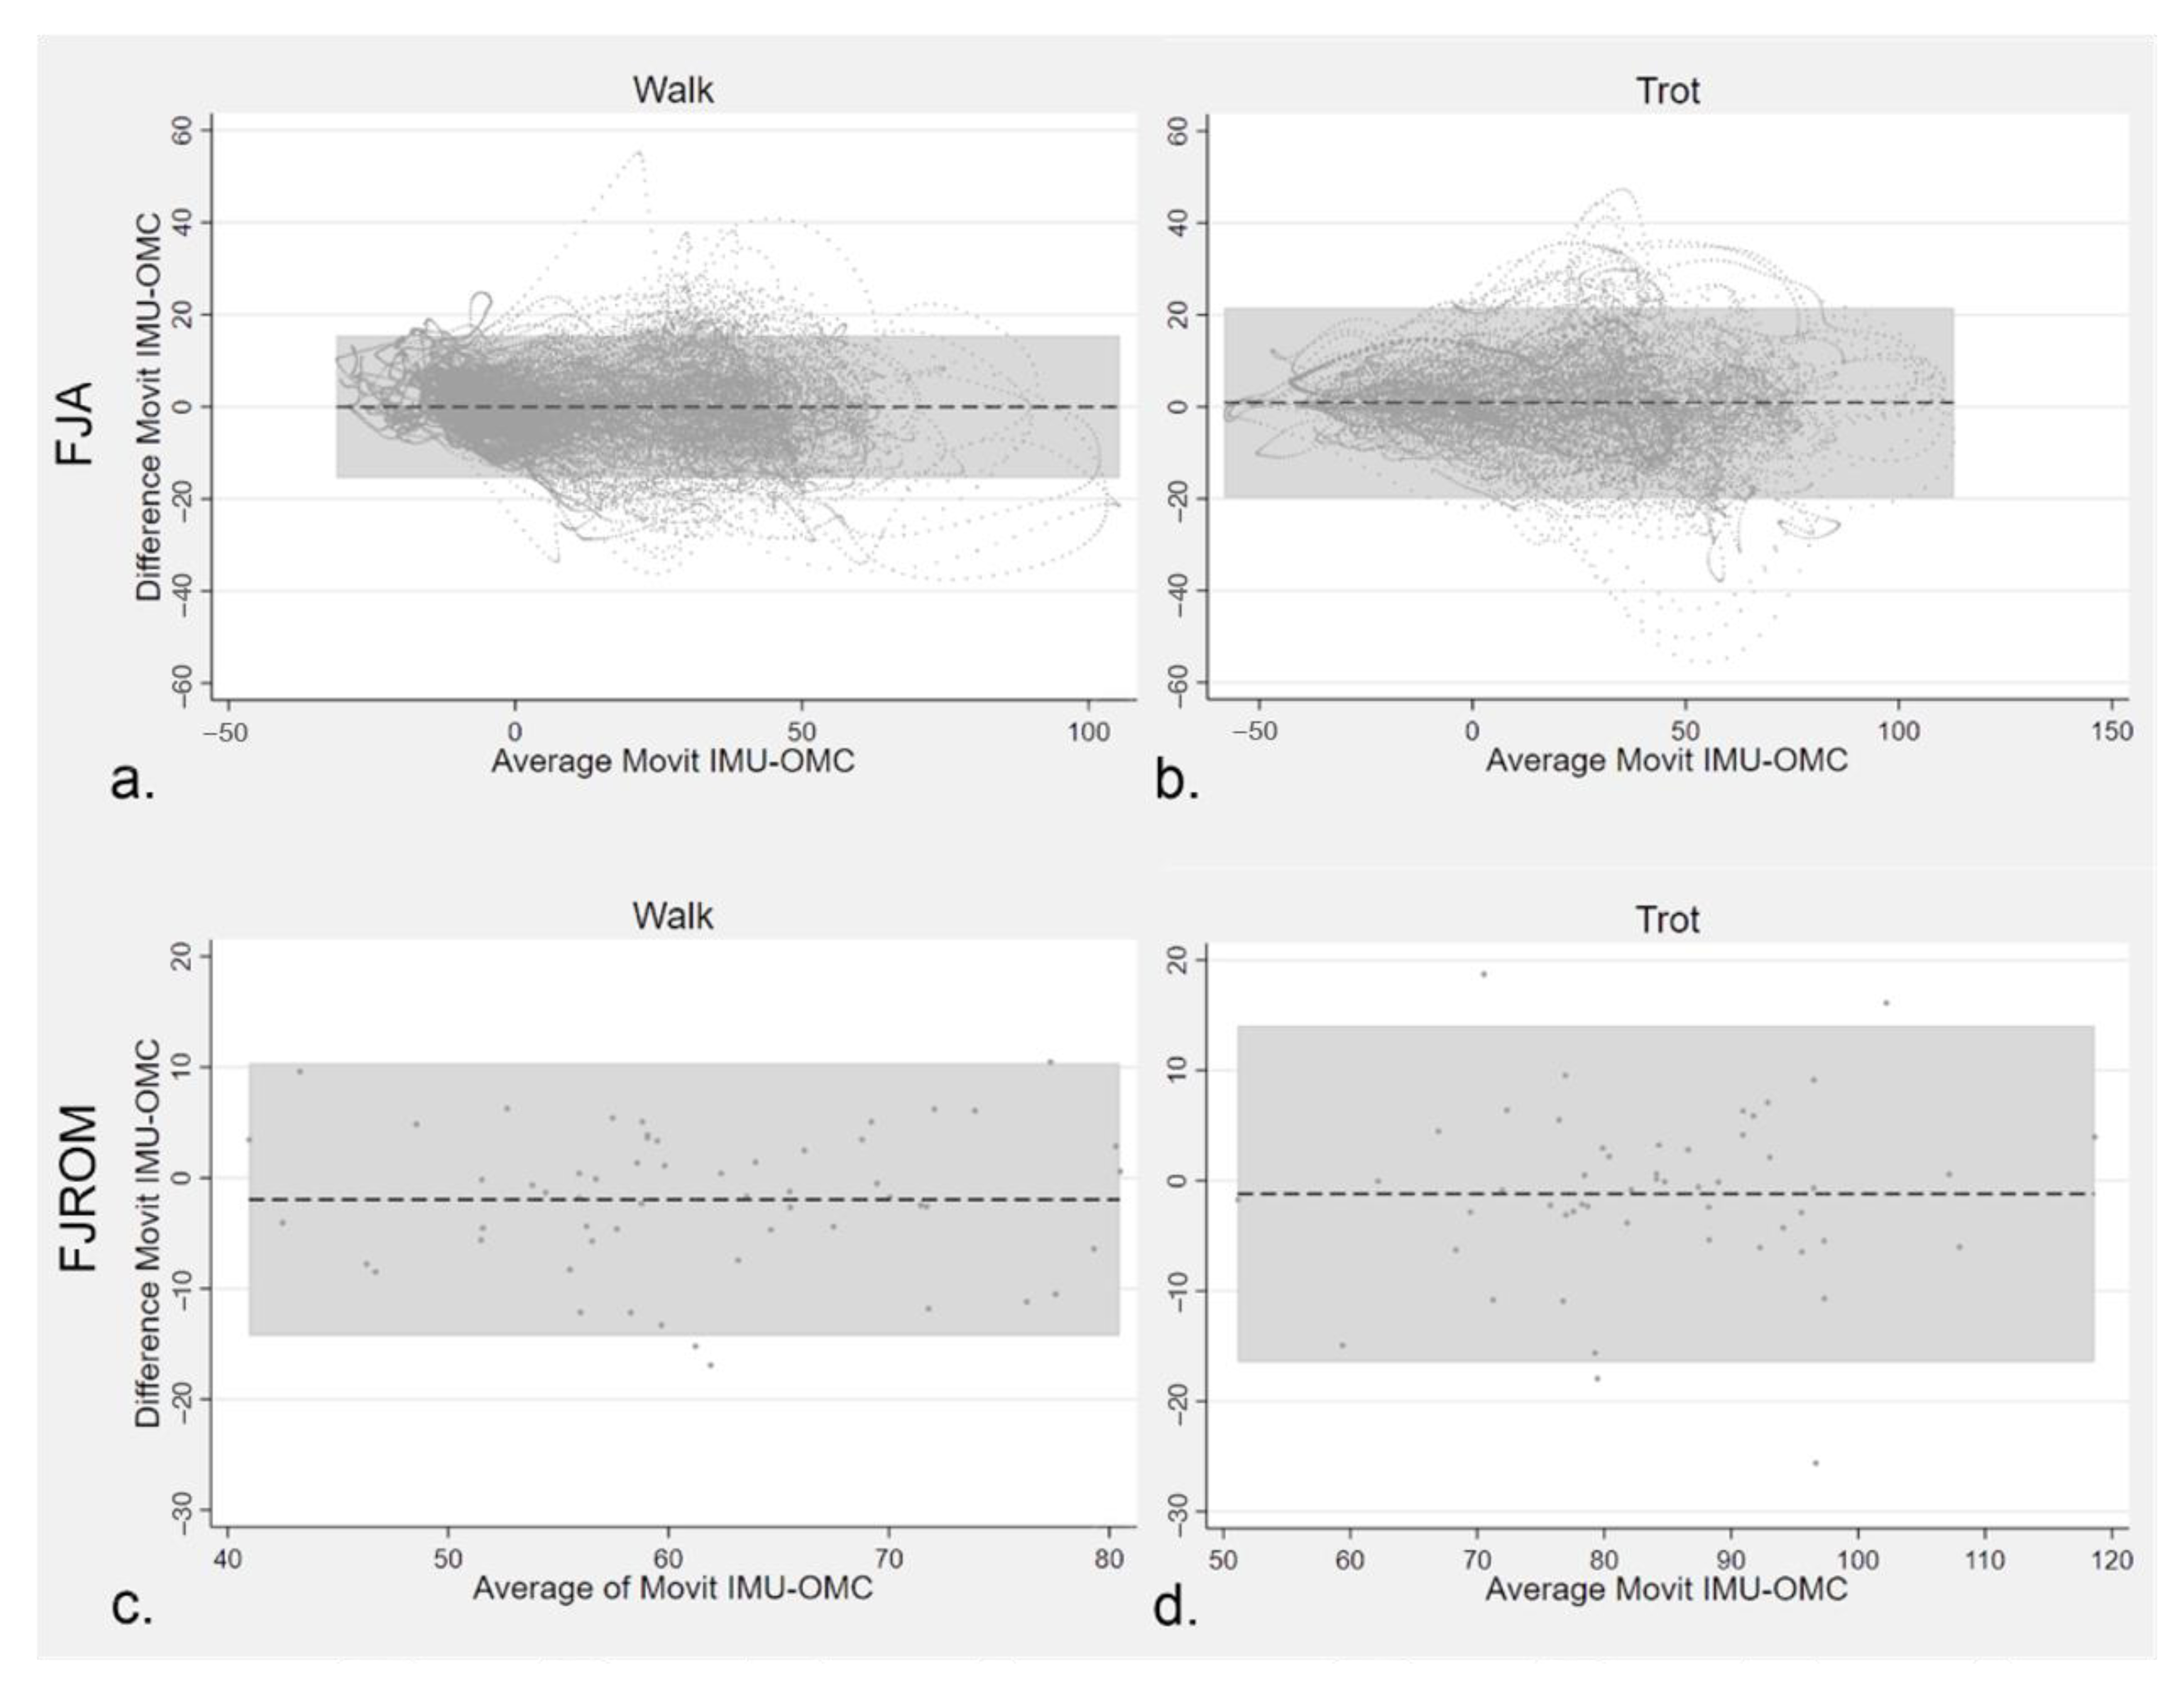
3.2.3. Agreement between MOVIT IMU and 2-D OMC Technology for FJA Quantification
4. Discussion
4.1. Equine FJA Curves in Sound and Lame Horses
4.2. Agreement between the Systems Studied
4.3. Pros of IMU System Recording FJA
4.4. Limitations
5. Conclusions
Supplementary Materials
Author Contributions
Funding
Institutional Review Board Statement
Informed Consent Statement
Data Availability Statement
Acknowledgments
Conflicts of Interest
References
- Hinchcliff, K.W.; Kaneps, A.J.; Geor, R.J. Equine Sports Medicine and Surgery, Basic and Clinical Sciences of the Equine Athlete, 2nd ed.; Elsevier Health Sciences: Amsterdam, The Netherlands, 2013. [Google Scholar]
- Harrison, S.M.; Whitton, R.C.; Kawcak, C.E.; Stover, S.M.; Pandy, M.G. Relationship between Muscle Forces, Joint Loading and Utilization of Elastic Strain Energy in Equine Locomotion. J. Exp. Biol. 2010, 213, 3998–4009. [Google Scholar] [CrossRef] [PubMed]
- Merritt, J.S.; Davies, H.M.S.; Burvill, C.; Pandy, M.G. Influence of Muscle-Tendon Wrapping on Calculations of Joint Reaction Forces in the Equine Distal Forelimb. J. Biomed. Biotechnol. 2008, 2008, e165730. [Google Scholar] [CrossRef] [PubMed]
- Bertone, A.L. Distal Limb: Fetlock and Pastern. In Equine Sport Medicine and Surgery; Saunders Ltd.: Philadelphia, PA, USA, 2014; ISBN 978-0-7020-4771-8. [Google Scholar]
- Lawson, S.E.M.; Chateau, H.; Pourcelot, P.; Denoix, J.-M.; Crevier-Denoix, N. Effect of Toe and Heel Elevation on Calculated Tendon Strains in the Horse and the Influence of the Proximal Interphalangeal Joint. J. Anat. 2007, 210, 583–591. [Google Scholar] [CrossRef] [PubMed]
- Weller, R.; Pfau, T.; Verheyen, K.; May, S.A.; Wilson, A.M. The Effect of Conformation on Orthopaedic Health and Performance in a Cohort of National Hunt Racehorses: Preliminary Results. Equine Vet. J. 2006, 38, 622–627. [Google Scholar] [CrossRef] [PubMed]
- Dabbene, I.; Bullone, M.; Pagliara, E.; Gasparini, M.; Riccio, B.; Bertuglia, A. Clinical Findings and Prognosis of Interference Injuries to the Palmar Aspect of the Forelimbs in Standardbred Racehorses: A Study on 74 Cases. Equine Vet. J. 2018, 50, 759–765. [Google Scholar] [CrossRef] [PubMed]
- Keegan, K.G.; Wilson, D.A.; Smith, B.K.; Wilson, D.J. Changes in Kinematic Variables Observed during Pressure-Induced Forelimb Lameness in Adult Horses Trotting on a Treadmill. Am. J. Vet. Res. 2000, 61, 612–619. [Google Scholar] [CrossRef]
- Clayton, H.M.; Schamhardt, H.C.; Willemen, M.A.; Lanovaz, J.L.; Colborne, G.R. Kinematics and Ground Reaction Forces in Horses with Superficial Digital Flexor Tendinitis. Am. J. Vet. Res. 2000, 61, 191–196. [Google Scholar] [CrossRef]
- Serra Bragança, F.M.; Rhodin, M.; van Weeren, P.R. On the Brink of Daily Clinical Application of Objective Gait Analysis: What Evidence Do We Have so Far from Studies Using an Induced Lameness Model? Vet. J. 2018, 234, 11–23. [Google Scholar] [CrossRef]
- Bosch, S.; Serra Bragança, F.; Marin-Perianu, M.; Marin-Perianu, R.; Van der Zwaag, B.J.; Voskamp, J.; Back, W.; Van Weeren, R.; Havinga, P. EquiMoves: A Wireless Networked Inertial Measurement System for Objective Examination of Horse Gait. Sensors 2018, 18, 850. [Google Scholar] [CrossRef]
- Keegan, K.G.; Pai, P.F.; Wilson, D.A.; Smith, B.K. Signal Decomposition Method of Evaluating Head Movement to Measure Induced Forelimb Lameness in Horses Trotting on a Treadmill. Equine Vet. J. 2001, 33, 446–451. [Google Scholar] [CrossRef]
- Olsen, E.; Pfau, T.; Ritz, C. Functional Limits of Agreement Applied as a Novel Method Comparison Tool for Accuracy and Precision of Inertial Measurement Unit Derived Displacement of the Distal Limb in Horses. J. Biomech. 2013, 46, 2320–2325. [Google Scholar] [CrossRef] [PubMed]
- Roepstorff, L.; Wiestner, T.; Weishaupt, M.A.; Egenvall, E. Comparison of Microgyro-Based Measurements of Equine Metatarsal/Metacarpal Bone to a High Speed Video Locomotion Analysis System during Treadmill Locomotion. Vet. J. 2013, 198 (Suppl. S1), e157–e160. [Google Scholar] [CrossRef] [PubMed]
- Sapone, M.; Martin, P.; Ben Mansour, K.; Chateau, H.; Marin, F. The Protraction and Retraction Angles of Horse Limbs: An Estimation during Trotting Using Inertial Sensors. Sensors 2021, 21, 3792. [Google Scholar] [CrossRef] [PubMed]
- Bragança, F.M.; Bosch, S.; Voskamp, J.P.; Marin-Perianu, M.; Van der Zwaag, B.J.; Vernooij, J.C.M.; van Weeren, P.R.; Back, W. Validation of Distal Limb Mounted Inertial Measurement Unit Sensors for Stride Detection in Warmblood Horses at Walk and Trot. Equine Vet. J. 2017, 49, 545–551. [Google Scholar] [CrossRef]
- Cruz, A.M.; Maninchedda, U.E.; Burger, D.; Wanda, S.; Vidondo, B. Repeatability of Gait Pattern Variables Measured by Use of Extremity-Mounted Inertial Measurement Units in Nonlame Horses during Trotting. Am. J. Vet. Res. 2017, 78, 1011–1018. [Google Scholar] [CrossRef]
- Hatrisse, C.; Macaire, C.; Sapone, M.; Hebert, C.; Hanne-Poujade, S.; De Azevedo, E.; Marin, F.; Martin, P.; Chateau, H. Stance Phase Detection by Inertial Measurement Unit Placed on the Metacarpus of Horses Trotting on Hard and Soft Straight Lines and Circles. Sensors 2022, 22, 703. [Google Scholar] [CrossRef]
- Degueurce, C.; Pourcelot, P.; Audigié, F.; Denoix, J.M.; Geiger, D. Variability of the Limb Joint Patterns of Sound Horses at Trot. Equine Vet. J. Suppl. 1997, 29, 89–92. [Google Scholar] [CrossRef]
- AAEP Horse Show Committee Guide to Veterinary Services for Horse Shows, 7th ed.; American Association of Equine Practitioners: Lexington, KY, USA, 1999.
- Saggio, G.; Tombolini, F.; Ruggiero, A. Technology-Based Complex Motor Tasks Assessment: A 6-DOF Inertial-Based System Versus a Gold-Standard Optoelectronic-Based One. IEEE Sens. J. 2021, 21, 1616–1624. [Google Scholar] [CrossRef]
- Drevemo, S.; Dalin, G.; Fredricson, I.; Hjertén, G. Equine Locomotion; 1. The Analysis of Linear and Temporal Stride Characteristics of Trotting Standardbreds. Equine Vet. J. 1980, 12, 60–65. [Google Scholar] [CrossRef]
- Clayton, H.M. Comparison of the Stride Kinematics of the Collected, Working, Medium and Extended Trot in Horses. Equine Vet. J. 1994, 26, 230–234. [Google Scholar] [CrossRef]
- Briggs, E.V.; Mazzà, C. Automatic Methods of Hoof-on and -off Detection in Horses Using Wearable Inertial Sensors during Walk and Trot on Asphalt, Sand and Grass. PLoS ONE 2021, 16, e0254813. [Google Scholar] [CrossRef] [PubMed]
- Bland, J.M.; Altman, D.G. Agreement between Methods of Measurement with Multiple Observations per Individual. J. Biopharm. Stat. 2007, 17, 571–582. [Google Scholar] [CrossRef] [PubMed]
- Buchner, H.H.; Savelberg, H.H.; Schamhardt, H.C.; Barneveld, A. Limb Movement Adaptations in Horses with Experimentally Induced Fore- or Hindlimb Lameness. Equine Vet. J. 1996, 28, 63–70. [Google Scholar] [CrossRef] [PubMed]
- Lynch, J.A.; Clayton, H.M.; Mullineaux, D.R. The Reliability of Force Platform Data from Trotting Horses. Equine Comp. Exerc. Physiol. 2005, 2, 129–132. [Google Scholar] [CrossRef]
- Lewczuk, D.; Maśko, M. Symmetry and Regularity of Recreation Horse during Treadmill Training. Livest. Sci. 2021, 254, 104773. [Google Scholar] [CrossRef]
- Galisteo, A.M.; Cano, M.R.; Morales, J.L.; Vivo, J.; Miró, F. The Influence of Speed and Height at the Withers on the Kinematics of Sound Horses at the Hand-Led Trot. Vet. Res. Commun. 1998, 22, 415–424. [Google Scholar] [CrossRef]
- Ishihara, A.; Bertone, A.L.; Rajala-Schultz, P.J. Association between Subjective Lameness Grade and Kinetic Gait Parameters in Horses with Experimentally Induced Forelimb Lameness. Am. J. Vet. Res. 2005, 66, 1805–1815. [Google Scholar] [CrossRef]
- Cuesta-Vargas, A.I.; Galán-Mercant, A.; Williams, J.M. The Use of Inertial Sensors System for Human Motion Analysis. Phys. Rev. 2010, 15, 462–473. [Google Scholar] [CrossRef]
- Poitras, I.; Dupuis, F.; Bielmann, M.; Campeau-Lecours, A.; Mercier, C.; Bouyer, L.J.; Roy, J.-S. Validity and Reliability of Wearable Sensors for Joint Angle Estimation: A Systematic Review. Sensors 2019, 19, 1555. [Google Scholar] [CrossRef]
- Farber, M.; Schamhardt, H.; van Weeren, R.; Barneveld, A. Methodology and Validity of Assessing Kinematics of the Thoracolumbar Vertebral Column in Horses on the Basis of Skin-Fixated Markers. Am. J. Vet. Res. 2001, 62, 301–306. [Google Scholar] [CrossRef]
- Back, W.; Clayton, H.M. Equine Locomotion, 2nd ed.; Elsevier Health Sciences: Amsterdam, The Netherlands, 2012; ISBN 978-0-7020-2950-9. [Google Scholar]
- Chateau, H.; Degueurce, C.; Denoix, J.-M. Evaluation of Three-Dimensional Kinematics of the Distal Portion of the Forelimb in Horses Walking in a Straight Line. Am. J. Vet. Res. 2004, 65, 447–455. [Google Scholar] [CrossRef] [PubMed]
- Hobbs, S.J.; Richards, J.; Matuszewski, B.; Brigden, C. Development and Evaluation of a Noninvasive Marker Cluster Technique to Assess Three-Dimensional Kinematics of the Distal Portion of the Forelimb in Horses. Am. J. Vet. Res. 2006, 67, 1511–1518. [Google Scholar] [CrossRef] [PubMed]
- Clayton, H.M.; Sha, D.; Stick, J.; Elvin, N. 3D Kinematics of the Equine Metacarpophalangeal Joint at Walk and Trot. Vet. Comp. Orthop. Traumatol. 2007, 20, 86–91. [Google Scholar] [CrossRef]
- Chateau, H.; Degueurce, C.; Denoix, J.M. Three-Dimensional Kinematics of the Distal Forelimb in Horses Trotting on a Treadmill and Effects of Elevation of Heel and Toe. Equine Vet. J. 2006, 38, 164–169. [Google Scholar] [CrossRef] [PubMed]
- Hodson, E.; Clayton, H.M.; Lanovaz, J.L. The Forelimb in Walking Horses: 1. Kinematics and Ground Reaction Forces. Equine Vet. J. 2000, 32, 287–294. [Google Scholar] [CrossRef] [PubMed]
- Back, W.; Schamhardt, H.C.; Savelberg, H.H.; van den Bogert, A.J.; Bruin, G.; Hartman, W.; Barneveld, A. How the Horse Moves: 1. Significance of Graphical Representations of Equine Forelimb Kinematics. Equine Vet. J. 1995, 27, 31–38. [Google Scholar] [CrossRef] [PubMed]
- Back, W.; Schamhardt, H.C.; Barneveld, A. Are Kinematics of the Walk Related to the Locomotion of a Warmblood Horse at the Trot? Vet. Q 1996, 18 (Suppl. S2), S79–S84. [Google Scholar] [CrossRef]


| Horse | Age | Breed | Pathology | Affected Limb | Lameness Grade (AAEP Scale) |
|---|---|---|---|---|---|
| z1 | 8 y | Thoroughbred | Fetlock joint OA | RF | 4/5 |
| z2 | 4 y | Standardbred | Scapulo-humeral OA | LF | 4/5 |
| z3 | 23 y | Criollo | SDFT tendonitis | RH | 3/5 |
| z5 | 17 y | Warmblood | Proximal interphalangeal joint OA | RH | 3/5 |
| z6 | 7 y | Warmblood | Centrotarsal joint OA | LH | 3/5 |
| z7 | 15 y | Pony | Medial femoro-tibial joint OA | RH | 3/5 |
| z8 | 12 y | Italian saddle horse | DDFT tendonitis-navicular disease | RF | 3/5 |
Publisher’s Note: MDPI stays neutral with regard to jurisdictional claims in published maps and institutional affiliations. |
© 2022 by the authors. Licensee MDPI, Basel, Switzerland. This article is an open access article distributed under the terms and conditions of the Creative Commons Attribution (CC BY) license (https://creativecommons.org/licenses/by/4.0/).
Share and Cite
Pagliara, E.; Marenchino, M.; Antenucci, L.; Costantini, M.; Zoppi, G.; Giacobini, M.D.L.; Bullone, M.; Riccio, B.; Bertuglia, A. Fetlock Joint Angle Pattern and Range of Motion Quantification Using Two Synchronized Wearable Inertial Sensors per Limb in Sound Horses and Horses with Single Limb Naturally Occurring Lameness. Vet. Sci. 2022, 9, 456. https://doi.org/10.3390/vetsci9090456
Pagliara E, Marenchino M, Antenucci L, Costantini M, Zoppi G, Giacobini MDL, Bullone M, Riccio B, Bertuglia A. Fetlock Joint Angle Pattern and Range of Motion Quantification Using Two Synchronized Wearable Inertial Sensors per Limb in Sound Horses and Horses with Single Limb Naturally Occurring Lameness. Veterinary Sciences. 2022; 9(9):456. https://doi.org/10.3390/vetsci9090456
Chicago/Turabian StylePagliara, Eleonora, Maddalena Marenchino, Laura Antenucci, Mario Costantini, Giacomo Zoppi, Mario Dante Lucio Giacobini, Michela Bullone, Barbara Riccio, and Andrea Bertuglia. 2022. "Fetlock Joint Angle Pattern and Range of Motion Quantification Using Two Synchronized Wearable Inertial Sensors per Limb in Sound Horses and Horses with Single Limb Naturally Occurring Lameness" Veterinary Sciences 9, no. 9: 456. https://doi.org/10.3390/vetsci9090456
APA StylePagliara, E., Marenchino, M., Antenucci, L., Costantini, M., Zoppi, G., Giacobini, M. D. L., Bullone, M., Riccio, B., & Bertuglia, A. (2022). Fetlock Joint Angle Pattern and Range of Motion Quantification Using Two Synchronized Wearable Inertial Sensors per Limb in Sound Horses and Horses with Single Limb Naturally Occurring Lameness. Veterinary Sciences, 9(9), 456. https://doi.org/10.3390/vetsci9090456